Article

Logging In-Operation Battery Data from Android Devices: A Possible Path to Sourcing Battery Operation Data

Independent Researcher, 81547 Munich, Germany
Electronics 2023, 12(14), 3049; https://doi.org/10.3390/electronics12143049
Submission received: 19 June 2023 / Revised: 10 July 2023 / Accepted: 10 July 2023 / Published: 12 July 2023

Abstract

:
Operating Lithium-ion batteries requires a deep understanding of their performance. Laboratory experiments are conducted mostly under controlled ambient conditions and repetitive loads, whereas real-world operations feature a large spectrum of operating conditions. This leads to a large gap, which in-operation battery field data aims to close. Literature states the necessity for large datasets for field data studies; however, these are not available today. In this article, an overview of the possibilities of sourcing battery field data from Android devices is presented. Today, there are two billion Android devices in active use, and most of them are equipped with a lithium-ion battery and are also connected to the internet. An Android device study featuring multiple devices is conducted, evaluating signal quality and differences. Exemplary data analysis with a focus on state estimation algorithms is then tested on the sourced data.

1. Introduction

Lithium-ion (Li-ion) batteries are a widely used option for energy storage in mobile devices, transportation, and electrical grids. The high cost of batteries and their limited lifetime, which is typically measured by the number of cycles or years of operation achievable [1,2], demand an in-depth analysis of battery performance, degradation, and parameters during operation.
However, despite advances in experimental work and simulation, there still exists uncertainty about battery performance as real-world operating conditions vary strongly across usage profiles, locations, etc. Laboratory experiments mostly feature controlled ambient conditions and repetitive loads. Testing with only one repetition per operating condition is common practice due to resource constraints.
This creates a large gap between the majority of battery testing and real-world operating conditions.
In-operation battery field data can close this gap, improving battery research by serving future studies as input as well as validation. Howey states a necessity for datasets spanning years of operation in different applications across thousands to millions of cells [3]. Industry operators of batteries today, such as electric vehicle manufacturers or battery energy storage system operators, collect such data, but it is commonly proprietary. Thus, such large data sets as are necessary for field data studies are not available today.
In this article, the possibilities of sourcing battery field data from Android devices are evaluated. Android devices are mostly equipped with a lithium-ion battery and are also connected to the internet. With roughly two billion devices in active use, the data potentially available would be highly beneficial for battery data analytics.
The presented article includes a data collection study featuring multiple Android devices in operation. With operation data from the devices, the signal quality and differences in the hardware/software are evaluated. Operation data are evaluated, and several battery state estimation algorithms are tested to evaluate data quality and possible outcomes.
The remainder of the article is structured as follows: A literature review (Section 1.1) discusses currently available battery data sources and field data studies in general, followed by a review of literature that uses Android devices as a data source. Details on the novelty of this work are outlined in Section 1.2. After a description of the methods, signals, and device study (Section 2), the data of the device study is evaluated (Section 3).

1.1. Literature Review

Regarding field data and subsequent studies herewith, several studies show the possible benefit. Sulzer et al. describe the challenges and results from field data for battery lifetime prediction [4]. With battery degradation being a major field of interest, other areas come to mind: battery state estimation algorithms, battery operating conditions, battery and system designs, and many more. Aitio and Howey worked towards predicting the battery’s end of life using machine learning on a battery-aging dataset with 620 million data rows from solar off-grid system field data [5]. Cell-to-cell variation arising from production, system design, or usage variability is a specific field that is hard to evaluate in laboratory settings due to resource constraints. Song et al. work on capacity estimation with operating data from 700 electric vehicles [6]. Wang et al. studied cell-to-cell variability with a dataset from 8032 electric taxis [7]. She et al. estimated capacity loss with field data from 18 electric city buses [8]. Huo et al. analyzed data from 16 electric taxis for capacity estimation [9]. All the studies mentioned do not make their data or their data streams available to others. Available datasets from laboratory tests, such as those from NASA [10], cannot replace real field data and thus only serve as an intermediate step. Therefore, no comprehensive dataset or continuous data source remains available.
Regarding Android devices as a source for battery data, some studies have been conducted. Ali et al. describe the available battery data signals in the Android OS, focusing on signal quality analysis [11]. The developed Android application is also used in this work for part of the data logging. However, no battery state estimations are conducted, and the data collection is focused on short durations with high temporal resolution.
Hoque et al. focus on capacity modeling and the necessary measurements on Android devices [12]. Additional external measurements are conducted with pass-through power measurement equipment. Their work is based on the software Carat described in [13,14].
In conclusion, although some work on Android battery data exists, no study on the quality of the data is available that covers the relevant aspects of field data for scientific studies in a comprehensive way.

1.2. Contributions of This Work

Consequently, for the first time in the literature, we present a study on sourcing in-operation battery data from Android devices. The concept of this study was introduced by the author for the first time in [15]. In detail, we offer in this article:
  • Overview and discussion of the available battery signals on Android OS devices;
  • Evaluation of battery signal quality;
  • Long-term multi-device monitoring study;
  • Evaluation of signal quality for statistical analysis;
  • Evaluation of signal quality for battery parameter estimation, namely battery open circuit voltage, resistance, and capacity;
  • Best practices and recommendations for future battery data studies with Android devices.

2. Materials and Methods

The Battery Manager API in Android OS offers a wide array of signals with information about the energy/power status of the device [16]. The API is directed mostly at Android application developers, and thus most signals are not relevant for battery studies.
Table 1 shows the six signals in the API that were prioritized as the most relevant for battery studies and were further investigated. It is noted that more signals might be added to the API in future Android OS versions. Within the six parameters, the three commonly important signals can be found: battery voltage, battery temperature, and battery current. For the battery current, the API offers two signals: An averaged current value and a discrete-measured current value. Both are investigated in this work. The battery State of Charge (SOC) is also provided by the on-board estimation algorithm. The last parameter describes the power source of the device, whether it is currently unplugged or charged via an AC-powered USB charger, the USB port of a computer, or wirelessly.
As the landscape of Android OS devices is heavily fragmented with manufacturers, devices, and installed Android versions, the study was similarly extended. Table 2 shows the devices evaluated through a case study in this work. The study cannot be taken as fully representative of the whole Android device spectrum in operation today. Nonetheless, it covers seven devices across four manufacturers, five OS versions, and device ages ranging from one to nine years. Three Samsung Galaxy S7 are included with three different users. The devices in the study were selected to achieve a diverse device portfolio in active usage. Thus, user acceptance was also a deciding factor in the device selection. The device’s users were typical smartphone/tablet users, and the operating modes were not influenced by the study.
The case study contains two approaches regarding data collection:
  • High-Frequency (HF) measurements where the relevant signals are logged at very high temporal resolution (1 kHz) for durations less than a day;
  • Low-Frequency (LF) measurements, wherein all signals are logged at lower frequencies (1 mHz to 1 Hz) for a duration of up to several months.
The goal of the HF measurements is to evaluate the signal calculations and their quality in short tests in high detail. The goal of the LF measurements is to evaluate the device signal data for long-term logging. LF data are collected in the long-term case study for approximately five to nine months from the devices, with some additional deviation due to device unavailability and user behavior.
Two Android applications were used to evaluate the battery data at different time scales:
For HF measurements, the Battery Current (Version 1.6) application by the Lahore University of Management Sciences was used. The application is described in detail, including the source code, in [11]. The application logs the signals at a resolution greatly exceeding the actual device signal update frequencies and thus enables an accurate evaluation thereof. However, the amount of data generated and the high processor load are not feasible for long-term studies.
To conduct the LF measurements over several months, the 3C All-in-One Toolbox by 3C (Version 2.5.1) was used [17]. The application allows different logging intervals to be set from seconds to minutes, as well as increased logging frequencies during charging.
In general, Android apps can be terminated or hibernated by Android users, other applications such as task managers, or the OS itself. In the long-term case study, this turned out not to be a problem for any device; however, small data gaps do occur and should be expected. Also, if the device is turned off, no data are collected—even when the device is charging.

3. Data Evaluation

The battery signal evaluation is separated into three parts: an in-depth investigation of signal quality in HF and LF measurements (Section 3.1), a statistical evaluation of long-term LF data collection (Section 3.2), and parameter estimations with collected LF data (Section 3.3). Based on the results, data volume in long-term measurements is predicted (Section 3.4).

3.1. Signal Quality in HF and LF Measurements

To evaluate signal quality, a detailed study comparing HF and LF measurements was conducted with the Samsung Galaxy S6 Edge. Figure 1 shows voltage and actual current data from HF measurements. The data are well synchronized between the two signals. Thus, complex state estimations that require calculations between these two important signals, e.g., impedance/resistance, can be conducted.
Figure 2 shows a comparison of HF and LF data for both battery voltage (a) and current (b). The LF voltage data shows the expected overestimation and underestimation of peak duration in LF measurements. For the battery current data, a comparison is conducted between the averaged current values in LF and the actual current values in HF. Averaged current at LF represents operation well; however, the required minimum frequency and whether averaged data are sufficient depend on the goal of the studies. In the long-term LF device study, only the averaged current is further evaluated.
Evaluating different device types reveals that manufacturers can and do implement varying signal update frequencies. Table 3 shows the exemplary differences in device signal update frequency of the battery current signals between the two devices.
From the analysis of the signal quality, it can be concluded that the signal synchronicity is sufficient. Regarding signal update frequency, the quality can vary strongly. Whether the update frequency and the averaged current data are sufficient depends on the device as well as on the goal of the study.

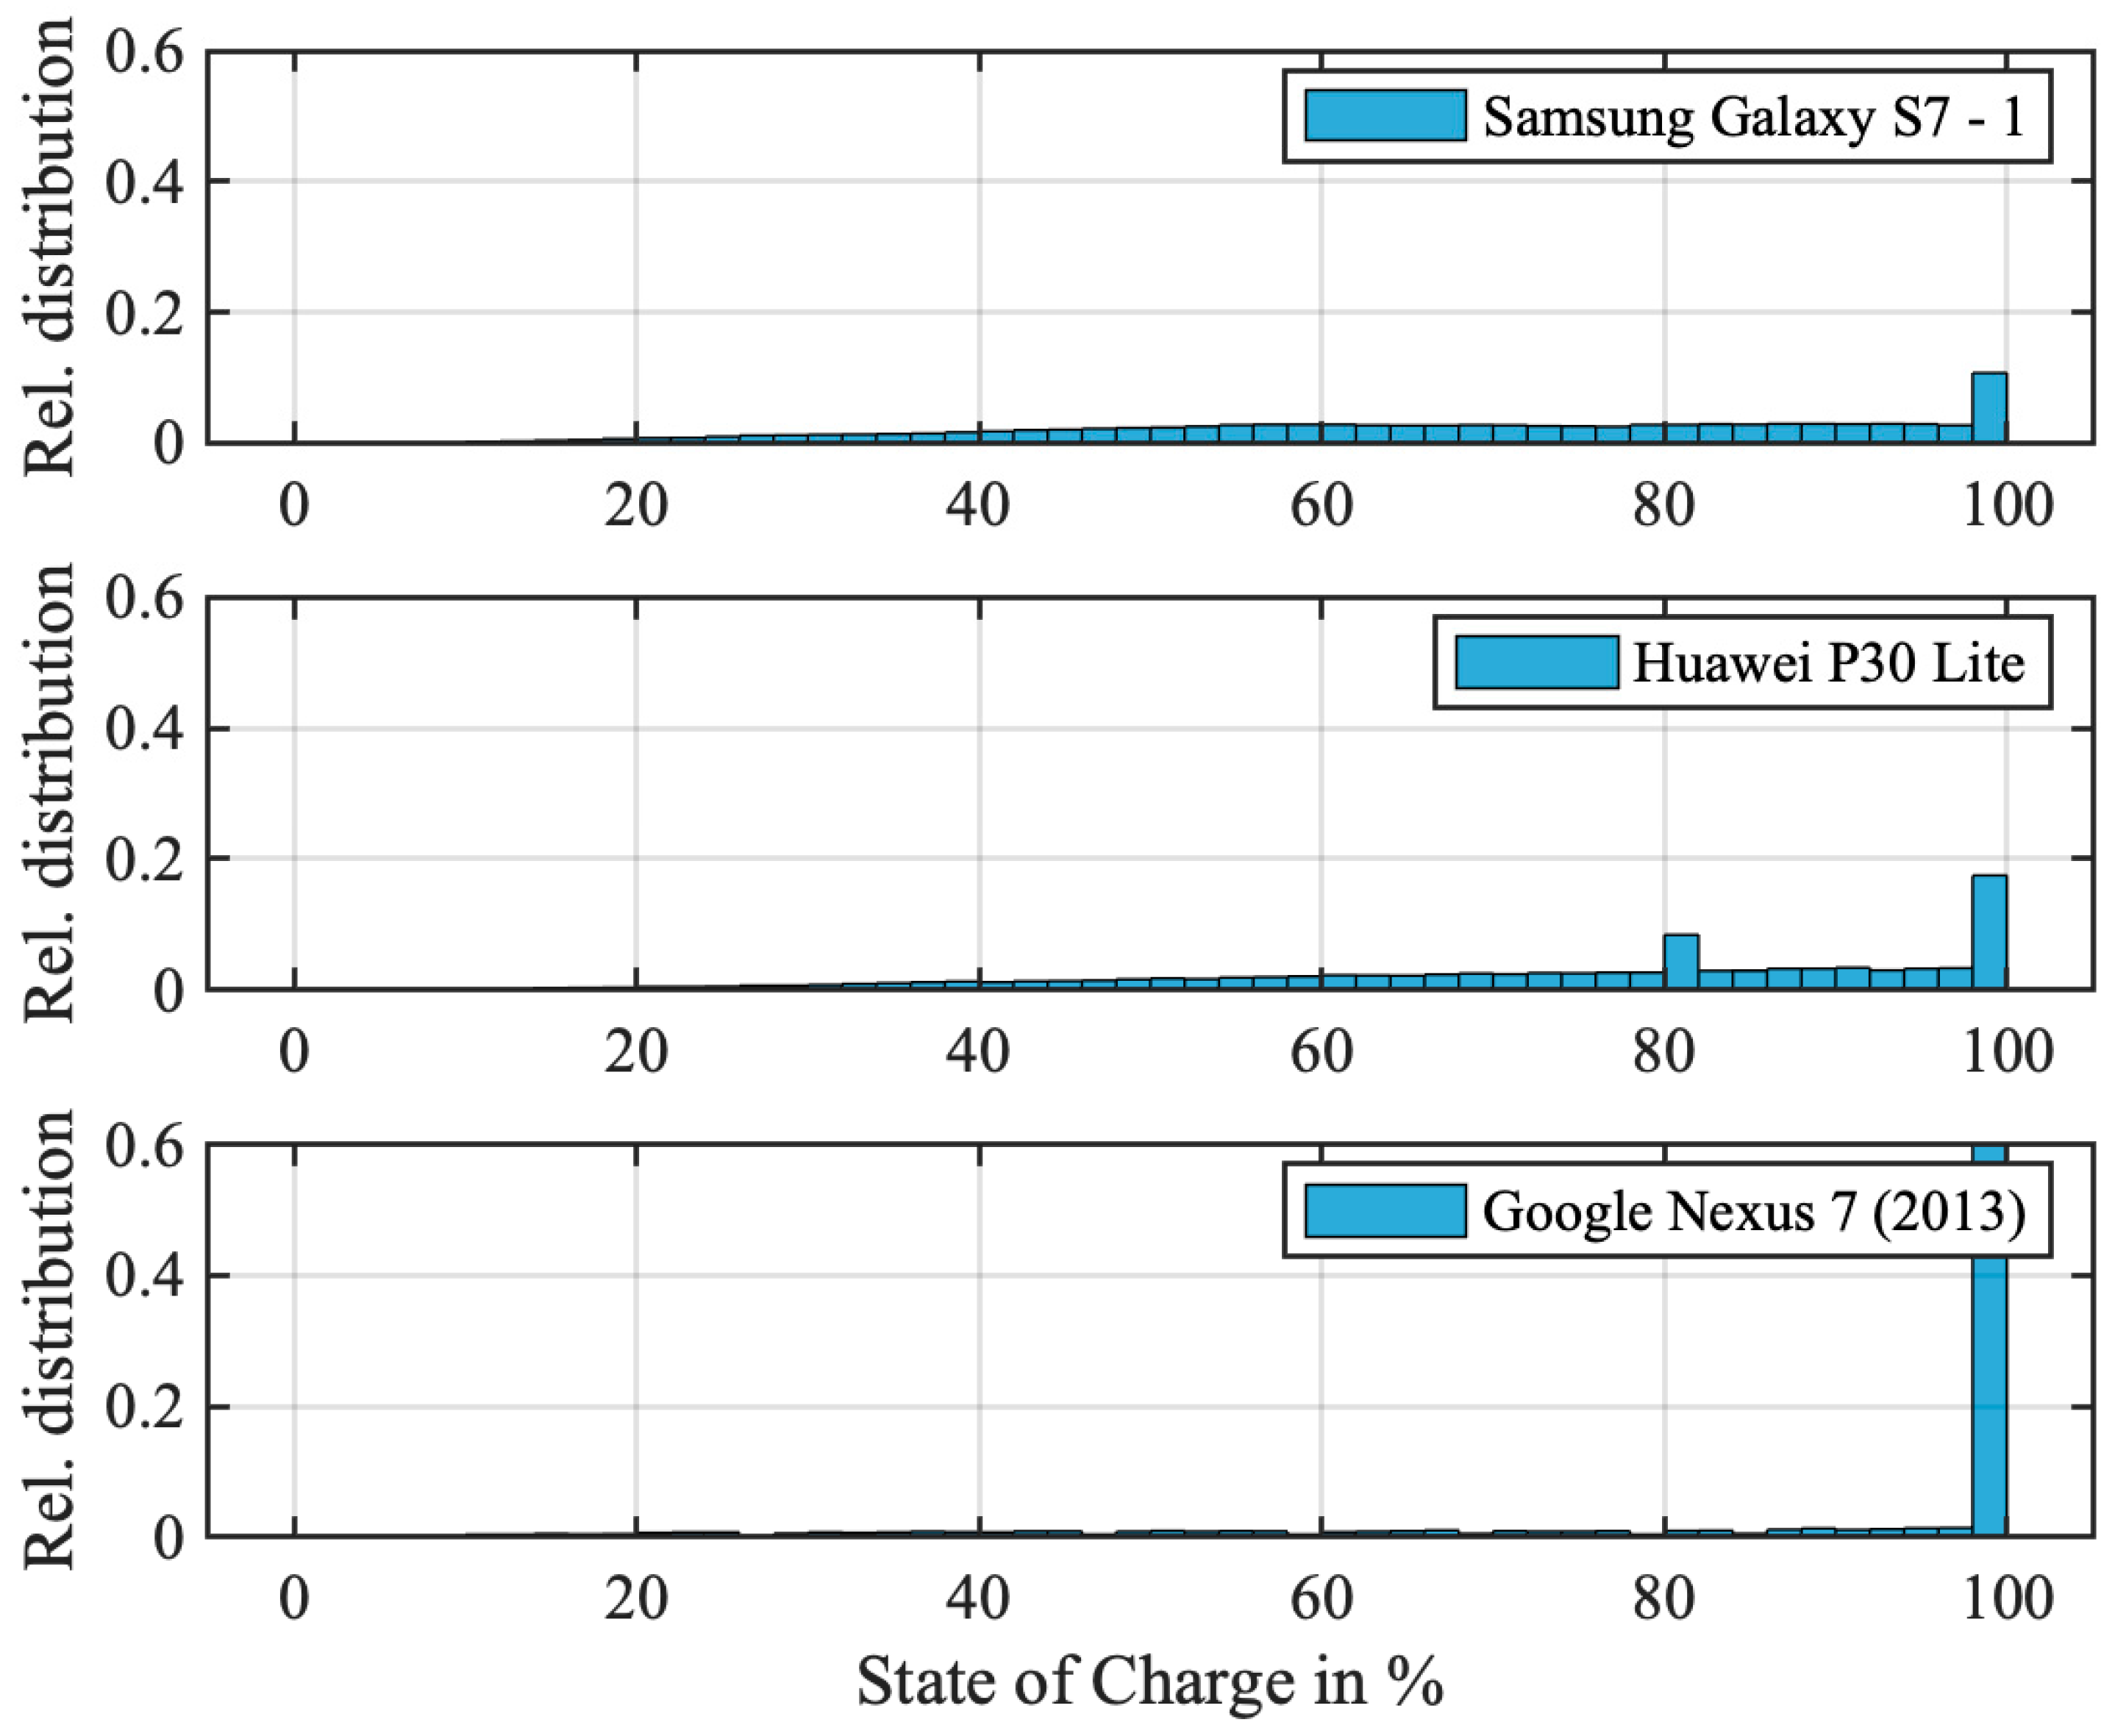
3.2. Evaluation of Long-Term LF Data Collection

Without any further algorithms, the collected data can be statistically analyzed. Histograms of three major parameters are plotted: averaged current, battery temperature, and SOC. Three devices are exemplarily selected.
Figure 3 shows the histograms of the averaged current for the three devices. Current values are normalized to the nominal battery capacity as C-Rates. In the results, the major peak at low discharge current near zero is related to the high amount of time with no charging or active use of the device. Peaks of positive current values indicate the most common charging rates, which depend on the current derating of the battery management system as well as on the used charging equipment. The device, the Google Nexus 7, stands out, as it does show little discharge operation. During the study, the tablet device was mostly plugged in, relieving the battery of most of the load.
Battery current logging and histograms enable investigations, user clustering, or simulation of general battery use. Exemplary focus areas are smart charging strategies and battery degradation simulation.
Figure 4 shows the histograms of the battery temperature for the devices. The Google Nexus 7 again stands out, here with a smaller and lower temperature window of operation—as it was only operated indoors and not carried on a person. Temperature logging and histograms enable the investigation of the temperature-related aspects of battery usage. Exemplary focus areas are ambient temperature variation, heat dissipation, heat transfer, and battery degradation simulation.
Figure 5 shows the histograms of the battery SOC for the devices. The Huawei P30 Lite features a smart charging strategy that decreases the time spent at S O C = 100 % by limiting the charge to S O C = 80 % as long as possible. The Google Nexus 7, however, stands out with a high share of time at S O C = 100 % —as it was mostly plugged in, features no smart charging strategy, and thus charges to maximum SOC. SOC-logging and -histograms enable investigation of the usage-related aspects of battery operation.
Exemplary focus areas are smart charging strategies, user behavior, and battery degradation simulation.

3.3. Parameter Estimations from In-Operation Data

Beyond statistical evaluations, logged battery data can be used with off-board or on-board state estimation algorithms to provide more insight into battery performance.
In this work, the battery is modeled as a single-cell model. The cell is simulated through an equivalent circuit model featuring an open circuit voltage U OCV as well as a resistance R C e l l , which accounts for the overvoltages within the cell.
Therefore, four parameter estimations were tested off-board:
  • State of Charge S O C : defined as the ratio of the actual available charged capacity to the current battery capacity:
    S O C = A ctual   charged   capacity Currently   estimated   battery   capacity
  • Open Circuit Voltage U O C V : defined as the relaxed open circuit voltage of the battery without load;
  • Capacity: defined as the current battery capacity that can be utilized;
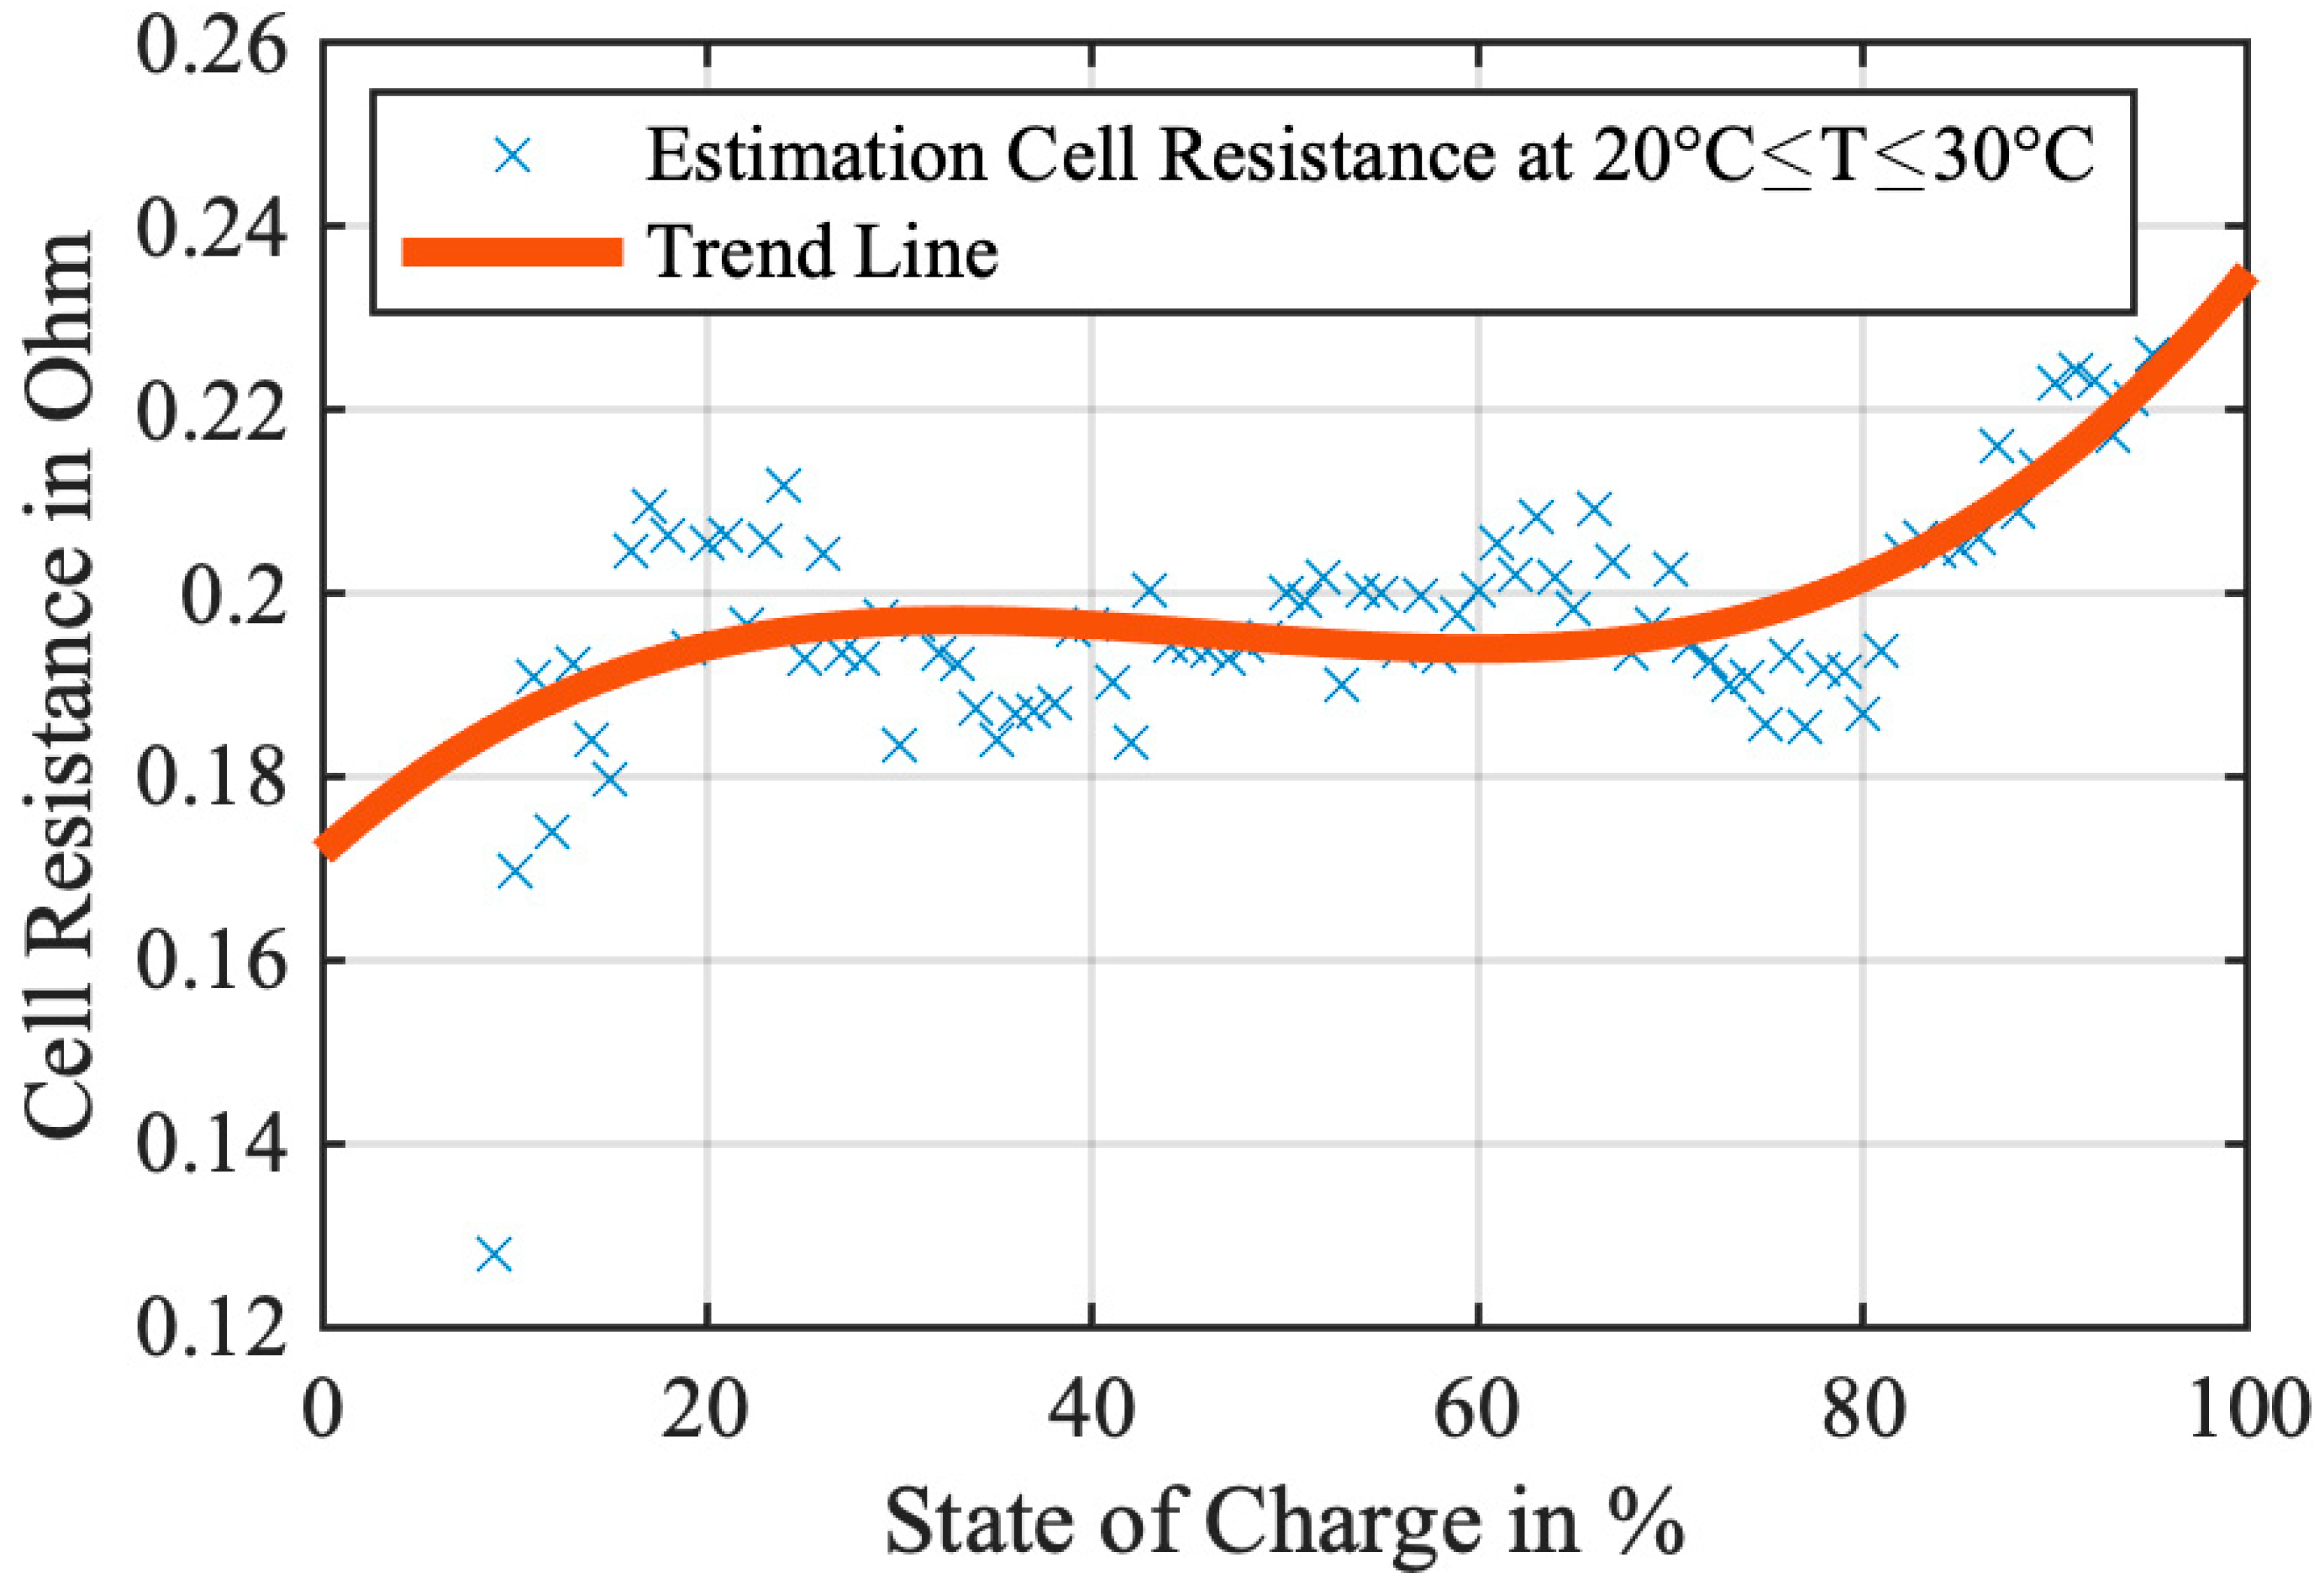
  • Resistance R C e l l : defined as the lumped resistance accounting for all overvoltages under load between the cell voltage U C e l l and the estimated OCV U O C V :
    R C e l l = U C e l l U O C V Battery   current
All data analysis was conducted in MATLAB.
Figure 6 shows a comparison between the logged onboard-device SOC estimation and a Coulomb-counting-based off-board SOC estimation for a battery charge event from S O C = 1 % to S O C = 100 % . The off-board SOC estimation is calculated based on logged current data with the following equation using the average current I A v g , the timestep length Δ t , and the currently estimated battery capacity:
S O C t = S O C t 1 + I A v g · Δ t Capacity
Throughout the charging process, there is a clear deviation between the onboard SOC and the offboard-calculated SOC. The deviation is, however, resolved at the end of charging. Looking at the end of the charging process, the off-board estimated SOC reveals that the battery continues charging when the onboard-estimated SOC reaches 100%. Using only the onboard-estimated SOC would hide the continued charging process. Thus, improved SOC estimations can improve accuracy and transparency in battery data studies beyond using the standard onboard-estimated SOC.
Figure 7 shows the open circuit voltage (OCV) curve derived from normal device operation. The implemented algorithm detects open circuit conditions without load and collects voltage data, which is then averaged to form a voltage curve. Open circuit conditions are:
  • No external charging of the device;
  • Battery current rate (C-Rate) below 0.05 C at time of measurement ( t ) and in the data point before ( t 1 ).
Per each SOC-value S O C i , the median of the voltage measurement values U C e l l is then averaged towards an estimated open circuit voltage U O C V using the median:
U O C V ( S O C i ) = median   ( U C e l l , S O C   i ,     1 , U C e l l , S O C   i ,     2 ,   ,   U C e l l , S O C   i ,     n )
Results towards S O C = 0 % show inaccuracies, which are partially explained by the inaccuracies of the on-board estimated SOC but are also a known artifact due to the high gradients in the OCV curves here. Additionally, the OCV estimation based on cell voltage suffers from the fact that there is always a current flow, and the cell resistance varies with SOC and increases strongly towards S O C = 0 % .
Although there are challenges in producing the OCV curve from field data, the resulting curve shows a clear possibility.
Figure 8 shows an off-board capacity estimation for all devices. The exemplarily-used capacity estimation algorithm estimates the capacities from charging events with a SOC-difference Δ SOC i of at least 15% to a per-cycle Capacity i :
Capacity i = Charge   added   in   cycle   i Δ SOC i = I A v g ( t ) d t Δ SOC i
The new capacity is calculated as a moving weighted average, with the SOC difference Δ SOC i as the weight factor between past capacity estimations and the latest charging event:
Moving   weighted - avg .   capacity i = Capacity i 1 · ( 100 % Δ SOC i ) + Capacity i · Δ SOC i
Results show that capacity estimation is mostly stable with small variations and single missed estimations, which are quickly corrected with the next charging event. One device, the Samsung Galaxy S7-1, shows an upward trend in the capacity estimation, followed by a steeper decrease later on. Whether this is related to algorithmic/sensor inaccuracies or due to physical capacity recovery/loss effects in the battery, it cannot be concluded. However, the steep capacity decrease was confirmed by the device user through the loss of device runtime. External capacity measurements after disassembly of the device would clarify the questions and improve the transparency of the data/algorithm accuracy. Such tests could not be included in this study.
Figure 9 shows the validation of the data logging frequency on the capacity estimation. The impact of signal logging frequency on the result is evaluated by comparing the capacity estimated from HF actual current measurements and LF averaged current measurements. Data are taken from a charging event from S O C = 1 % to S O C = 100 % . Quantitatively, the data used for the HF measurements are 6,188,416 log entries (1210 per second), compared with 1706 log entries in the LF measurements (0.01 per second). The estimation from LF measurements with averaged current values (LF Avg. Meas.) matches the estimation with HF actual measurements (HF Actual Meas.) almost exactly in this charging event, with a significant reduction of data volume. Thus, both bars in the plots show identical heights.
Figure 10 shows the State of Health S O H over the respective device’s age at the end of the device study. The SOH is defined as the ratio of the currently estimated capacity to the nominal battery capacity of the device:
S O H = Currently   estimated   capacity   Nominal   battery   capacity  
The results for the SOH over the device’s age align with the typical degradation of Li-ion batteries with their usage.
The initial SOH value when the devices are new and unused is expected to be around 100%. However, the devices in the study were not new, and thus such a value was not found. Regarding any changes in the SOH value during the study (from beginning to end), the changes were found to be rather small (see Figure 8) and mostly due to capacity estimation inaccuracies. This is explained by the slow pace of capacity changes.
Therefore, only the most current SOH value is presented per device.
The SOH of the Google Nexus 7 stands out with relatively low degradation at the highest age of all devices, which can be explained due to its usage history. The device was not used and sat in storage for several years. The three Galaxy S7 devices are of similar age but show highly deviating SOH values.
Figure 11 shows the fourth off-board estimated parameter, the battery resistance. The estimated battery resistance accounts for all the estimated overvoltage in the cell and therefore the difference between battery terminal voltage and battery OCV. The estimation here calculates the resistance only during charging.
The implemented algorithm detects high constant load conditions, and then resistance estimation calculations are performed. High-constant-load circuit conditions are defined as:
  • External charging of the device;
  • Battery current rate (C-Rate) higher than 0.1 C at the time of measurement ( t ) and in the data point before ( t 1 ).
Additionally, the battery temperature is evaluated to control for battery resistance variation due to temperature changes:
  • Battery temperature between 20 °C and 30 °C.
For each data point that fits in the required parameters, the resistance R C e l l is calculated with the cell voltage U C e l l , the estimated open circuit voltage for the SOC U O C V ( S O C ) , and the battery current:
R C e l l = U C e l l U O C V ( S O C ) Battery   current
Per each SOC-value S O C i , the median of the resistance calculations R C e l l is then averaged towards an estimated cell resistance R C e l l ( S O C i ) using the median:
R C e l l ( S O C i ) = median   ( R C e l l , S O C   i ,     1 , R C e l l , S O C   i ,     2 ,   ,   R C e l l , S O C   i ,     n )
Results for the resistance over the SOC are stable, with the typical trend of high resistance towards a higher SOC for charge operation. Battery resistance is also highly sensitive to temperature. Therefore, a temperature window from 20 °C to 30 °C is evaluated in this study to control the impact. More advanced algorithms can accurately calculate the temperature correction. In summary, it is shown that resistance estimation from normal device operation is possible.
Summarizing the four most relevant battery parameters, SOC, OCV, capacity, and resistance, can be estimated with logged LF Android battery signal data.

3.4. Data Volume

Continuous logging can result in large amounts of data being stored and transmitted. Thus, planning data volume is a necessary step in defining temporal resolution in field data studies. Table 4 shows an exemplary single log entry. The shown log entry corresponds to 33 Bytes of data.
As was shown before, LF measurements are sufficient for most studies; it can be extrapolated that with a logging frequency of 60 s, only 17 MegaBytes of data per year are created.
Depending on the battery load or goals of the data study, higher temporal resolutions may be necessary. There are, however, possible approaches for data reduction. Data logging can be improved from a fixed frequency to adaptive logging, such as logging whenever a signal value is changed or increasing the logging frequency during higher loads. Data can also be aggregated on-board with cumulative variables, e.g., cycle count or histograms for SOC/current/temperature distribution. Finally, the parameter estimation, e.g., of SOC, capacity, OCV, or resistance, can also be implemented into an on-board application.

4. Conclusions and Outlook

It was shown that Android OS devices can provide stable, high-quality data for battery field data studies. The most relevant signals are included, and the most relevant parameter estimations are possible too. Data collection shows further improvement potential via on-board calculations. Therefore, for the best quality of data logging, a dedicated Android application should be developed.
A key question for acquiring data from a large number of devices will be the motivation for the device users to install the logging application. Although the cost of data storage/transfer per device is not high, users providing data might still require some benefit from it. A potential solution could be the provision of data to the users for transparency into their own devices; e.g., insights into battery health are of value in the case of device resale.
Data aggregation at large scale, from thousands to millions of devices, would also require a stable, scaled, and financed platform. Thus, research grants might be required to finance the analytics platforms.
Transferring results from batteries in mobile devices to batteries in electric vehicles or grid storage should be done carefully with respect to several limitations. Battery chemistry is optimized for the application and is not comparable between applications. The battery operating conditions also strongly differ.

Funding

This research received no external funding.

Data Availability Statement

Data partially available upon request.

Acknowledgments

The author is thankful to Hassan Abbas Khan and Hayder Aldi of the Lahore University of Management Sciences for providing the Battery Current application for HF measurements. The author is also thankful to the users in the data logging study who agreed to help with this project and agreed to the data usage.

Conflicts of Interest

The author declares no conflict of interest. The author states that employment in industry has no influence on the study.

References

  1. Hesse, H.C.; Schimpe, M.; Kucevic, D.; Jossen, A. Lithium-Ion Battery Storage for the Grid—A Review of Stationary Battery Storage System Design Tailored for Applications in Modern Power Grids. Energies 2017, 10, 2107. [Google Scholar] [CrossRef] [Green Version]
  2. Schimpe, M.; von Kuepach, M.E.; Naumann, M.; Hesse, H.C.; Smith, K.; Jossen, A. Comprehensive Modeling of Temperature-Dependent Degradation Mechanisms in Lithium Iron Phosphate Batteries. J. Electrochem. Soc. 2018, 165, A181–A193. [Google Scholar] [CrossRef] [Green Version]
  3. Howey, D.A. Tools for Battery Health Diagnostics and Prediction. Electrochem. Soc. Interface 2019, 28, 55–56. [Google Scholar] [CrossRef]
  4. Sulzer, V.; Mohtat, P.; Aitio, A.; Lee, S.; Yeh, Y.T.; Steinbacher, F.; Khan, M.U.; Lee, J.W.; Siegel, J.B.; Stefanopoulou, A.G.; et al. The challenge and opportunity of battery lifetime prediction from field data. Joule 2021, 5, 1934–1955. [Google Scholar] [CrossRef]
  5. Aitio, A.; Howey, D.A. Predicting battery end of life from solar off-grid system field data using machine learning. Joule 2021, 5, 3204–3220. [Google Scholar] [CrossRef]
  6. Song, L.; Zhang, K.; Liang, T.; Han, X.; Zhang, Y. Intelligent state of health estimation for lithium-ion battery pack based on big data analysis. J. Energy Storage 2020, 32, 101836. [Google Scholar] [CrossRef]
  7. Wang, Q.; Wang, Z.; Zhang, L.; Liu, P.; Zhang, Z. A Novel Consistency Evaluation Method for Series-Connected Battery Systems Based on Real-World Operation Data. IEEE Trans. Transp. Electrif. 2021, 7, 437–451. [Google Scholar] [CrossRef]
  8. Naumann, M.; Spingler, F.B.; Jossen, A. Analysis and Modeling of Cycle Aging of a Commercial Lifepo4/Graphite Cell. J. Power Sources 2020, 451, 227666. [Google Scholar] [CrossRef]
  9. Huo, Q.; Ma, Z.; Zhao, X.; Zhang, T.; Zhang, Y. Bayesian Network Based State-of-Health Estimation for Battery on Electric Vehicle Application and its Validation Through Real-World Data. IEEE Access 2021, 9, 11328–11341. [Google Scholar] [CrossRef]
  10. Saha, B.; Goebel, K. Battery Data Set. In Nasa Ames Prognostics Data Repository; Nasa Ames Research Center: Moffett Field, CA, USA, 2007. [Google Scholar]
  11. Ali, H.; Khan, H.A.; Pecht, M.G. Evaluation of Li-Based Battery Current, Voltage, and Temperature Profiles for In-Service Mobile Phones. IEEE Access 2020, 8, 73665–73676. [Google Scholar] [CrossRef]
  12. Hoque, M.A.; Siekkinen, M.; Koo, J.; Tarkoma, S. Full Charge Capacity and Charging Diagnosis of Smartphone Batteries. IEEE Trans. Mob. Comput. 2017, 16, 3042–3055. [Google Scholar] [CrossRef]
  13. Oliner, A.J.; Iyer, A.P.; Stoica, I.; Lagerspetz, E.; Tarkoma, S. Carat: Collaborative Energy Diagnosis for Mobile Devices. In Proceedings of the 11th ACM Conference on Embedded Networked Sensor Systems, Roma, Italy, 11–15 November 2013. [Google Scholar]
  14. Peltonen, E.; Lagerspetz, E.; Nurmi, P.; Tarkoma, S. Energy Modeling of System Settings: A Crowdsourced Approach. In Proceedings of the 2015 IEEE International Conference on Pervasive Computing and Communications (PerCom), St. Louis, MO, USA, 23–27 March 2015. [Google Scholar]
  15. Schimpe, M. (Digital Presentation) Sourcing in-Operation Battery Data from Android Devices. In Proceedings of the ECS Meeting, Vancouver, BC, Canada, 29 May–2 June 2022. [Google Scholar]
  16. Google. Battery Manager Parameters. Available online: https://developer.android.com/reference/android/os/BatteryManager (accessed on 1 August 2022).
  17. 3C. 3C All-in-One Toolbox Version 2.5.1. Available online: https://play.google.com/store/apps/details?id=ccc71.at.free&hl=de&gl=US (accessed on 24 December 2021).
Figure 1. Synchroneity of the signals: battery voltage and battery current. High-frequency measurements. Data from Samsung Galaxy S6 Edge.
Electronics 12 03049 g001
Figure 2. High-frequency vs. low-frequency data collection: (a) Battery voltage; (b) Battery current. Data from Samsung Galaxy S6 Edge during charge event from S O C = 3 %   to S O C = 84 % .
Electronics 12 03049 g002
Figure 3. Histogram of long-term operation data—averaged battery current. Data from LF measurements during the full case study.
Electronics 12 03049 g003
Figure 4. Histogram of long-term operation data—battery temperature. Data from LF measurements during the full case study.
Electronics 12 03049 g004
Figure 5. Histogram of long-term operation data—battery SOC. Data from LF measurements during the full case study.
Electronics 12 03049 g005
Figure 6. Comparison between onboard-device SOC estimation and off-board data-based SOC estimation. Data from LF measurements of Samsung Galaxy S6 Edge during charge event from S O C = 1 %   to S O C = 100 % .
Electronics 12 03049 g006
Figure 7. Open-circuit voltage curve estimation from normal device operation over the SOC. Data from LF measurements of Samsung Galaxy S6 Edge during the full case study.
Electronics 12 03049 g007
Figure 8. Capacity estimation along charging events. Data from LF measurements during the full case study.
Electronics 12 03049 g008
Figure 9. Comparison of capacity estimation at different measurement frequencies. Data from charging Samsung Galaxy S6 Edge from S O C = 1 % to S O C = 100 % .
Electronics 12 03049 g009
Figure 10. Capacity SOH over device age. Data from LF measurements during the full case study.
Electronics 12 03049 g010
Figure 11. Resistance estimation over SOC. Data from LF measurements during charging events of Samsung Galaxy S6 Edge during the full case study.
Electronics 12 03049 g011
Table 1. Battery data signals and corresponding parameters in the Android OS API [16].
UnitsExemplary ValuesAndroid Parameter
Battery VoltagemilliVolt3812 mVEXTRA_VOLTAGE
Battery TemperatureDegree Celsius+25 °CEXTRA_TEMPERATURE
Battery State of Charge %80%EXTRA_LEVEL
Battery Current: AveragedmilliAmpere+500 mABATTERY_PROPERTY_CURRENT_AVERAGE
Battery Current: Discrete Measurement (also: “Actual Current” or “Current Now”)milliAmpere+500 mABATTERY_PROPERTY_CURRENT_NOW
Device Power Source-unplugged,
ac, usb,
wireless
EXTRA_PLUGGED
Table 2. Case study: Android device overview.
DeviceNominal Battery
Capacity
Device Age at
End of the Study
Android OS Version
Xiaomi POCO F34520 mAh1.0 a11
Huawei P30 lite3340 mAh1.9 a10
Samsung Galaxy S6 Edge2600 mAh5.7 a7
Samsung Galaxy S7—13000 mAh4.4 a8
Samsung Galaxy S7—2 3.9 a
Samsung Galaxy S7—3 4.1 a
Google Nexus 7 (2013)3950 mAh8.8 a6
Table 3. Differences in device signal update frequency.
ModelUpdate Frequency of
Parameter
“Battery Current Average”
Update Frequency of
Parameter
“Battery Current Now”
Google Nexus 7 (2013)1 s 1 s
Samsung Galaxy S6 Edge30 s10 s
Table 4. Exemplary log entry.
Date
as Unix Time
SOC
in %
Battery Current in mATemperaturein
°C
Voltage
in mV
Device Power Source
1641497711224100343226.84321-
Disclaimer/Publisher’s Note: The statements, opinions and data contained in all publications are solely those of the individual author(s) and contributor(s) and not of MDPI and/or the editor(s). MDPI and/or the editor(s) disclaim responsibility for any injury to people or property resulting from any ideas, methods, instructions or products referred to in the content.

