Article

MRI Image Fusion Based on Sparse Representation with Measurement of Patch-Based Multiple Salient Features

1
School of Information Science and Engineering, NingboTech University, Ningbo 315100, China
2
Third Research Institute of China Electronics Technology Group Corporation, Beijing 100846, China
3
Institute of Information Science, Beijing Jiaotong University, Beijing 100044, China
4
Beijing Key Laboratory of Advanced Information Science and Network Technology, Beijing 100044, China
*
Author to whom correspondence should be addressed.
Electronics 2023, 12(14), 3058; https://doi.org/10.3390/electronics12143058
Submission received: 9 June 2023 / Revised: 3 July 2023 / Accepted: 5 July 2023 / Published: 12 July 2023

Abstract

:
Multimodal medical image fusion is a fundamental, but challenging, problem in the fields of brain science research and brain disease diagnosis, as it is challenging for sparse representation (SR)-based fusion to characterize activity levels with a single measurement and not lose effective information. In this study, the Kronecker-criterion-based SR framework was applied for medical image fusion with a patch-based activity level, integrating salient features of multiple domains. Inspired by the formation process of vision systems, the spatial saliency was characterized by textural contrast (TC), composed of luminance and orientation contrasts, to promote the participation of more highlighted textural information in the fusion process. As a substitute for the conventional l1-norm-based sparse saliency, the sum of sparse salient features (SSSF) was used as a metric for promoting the participation of more significant coefficients in the composition of the activity level measurement. The designed activity level measurement was verified to be more conducive to maintaining the integrity and sharpness of detailed information. Various experiments on multiple groups of clinical medical images verified the effectiveness of the proposed fusion method in terms of both visual quality and objective assessment. Furthermore, this study will be helpful for the further detection and segmentation of medical images.

1. Introduction

Over the past several decades, a variety of information processing technologies have led to major achievements in clinical diagnosis research [1], such as image classification [2,3], image fusion [4], and image segmentation [5]. The main purpose of medical image fusion is to combine the complementary information from various sensors to construct a new image with which to assist medical experts with diagnosis. Despite the simplicity of the idea, there are many challenges related to the theoretical background and the nature of medical images that need to be resolved. For instance, computed tomography (CT) imaging is informative regarding dense tissues, but lacks soft tissue information. In contrast, magnetic resonance imaging (MRI) is more suitable for soft tissues, but is short on dense tissue information. More crucially, single imaging tends to be ineffective at characterizing the symptoms of different diseases.
To overcome these challenges, a variety of image fusion methods have been proposed. The content of the image can be either visual (i.e., color, shape, or texture) or textual (i.e., to identify datasets appearing within an image). Some new advances in the fusion field consider these two aspects simultaneously [6,7]. To further improve fusion performance, some new features, such as different image moments [8,9,10], have also been used in image fusion.
The mainstream directions of image fusion mainly focus on the visual content, including the spatial domain [11,12] and transform domain [13,14]. The former usually addresses the fusion issue via image blocks or pixel-wise gradient information for multi-focus fusion [15,16,17] and multi-exposure fusion [18,19,20] tasks. The latter merges the transform coefficients relevant to source images with different reconstruction algorithms to obtain a fused image, which is recognized as being effective for multimodal image fusion [21,22]. Multi-scale transform (MST)-based medical image fusion is a mainstream research direction. Dual-tree complex wavelet transform (DTCWT) [23], non-subsampled shearlet transform (NSST) [24], and non-subsampled contourlet transform (NSCT) [25] are conventional MST methods for image fusion. In recent years, some novel MST-based methods have been proposed. Xia combined sparse representation with a pulse-coupled neural network (PCNN) in the NSCT domain for medical image fusion [26]. Yin proposed a parameter-adaptive pulse-coupled neural network as part of an NSST domain (NSST-PAPCNN)-based medical image fusion strategy [27]. Dinh proposed a Kirsch compass operator with a marine-predator-algorithm-based method for medical image fusion [28].
Differently from MST, the principle of SR is more in accordance with the human visual system (HVS), and compared to the MST-based methods, SR-based methods have two main distinctions. For the first distinction, the fixed basis limits the MST-based methods to expressing significant features, while the SR-based methods are flexible and can procure more intrinsic features by means of dictionary learning. For the second distinction, the MST-based methods are sensitive to noise and misregistration with large decomposition level settings, while the SR-based methods with overlapping patch-wise modes are robust for misregistration, which guarantees the accuracy of the spatial location of tissues. Therefore, a wide range of research on SR-based medical image fusion has been conducted in recent years [29,30,31].
However, there are still drawbacks to these SR-based methods. Firstly, they may be insufficient to handle fine details due to an over-complete dictionary, and this highly redundant dictionary will lead to visual artifacts in the fused result [32]. Secondly, the dictionary atoms are updated in column vector form, resulting in the loss of correlation and structural information. In addition to the drawbacks of SR itself, the fusion weight accuracy will inevitably be reduced with an unreasonable fusion strategy of coefficients. One issue relates to the activity level measure, which helps to recognize distinct features in the fusion process, and another issue concentrates on the integration of coefficients into the counterparts of the fused image. For the former issue, the l1-norm mode is a conventional solution to describe the detailed information contained in sparse vectors [33]; however, the solution is insufficient to express the sparse saliency well, since detailed information that characterizes the activity level with the same weight cannot be highlighted. Furthermore, as SR is an approximate technique, it tends to fail to reflect the salient features of sparse coefficient maps accurately with a single measurement of the activity level, thereby further leading to the loss of detailed information. For this issue, it may reduce the contrast of the fused image with the weighted averaging rule, and the maximum absolute rule enables the fused image to absorb the main visual information of source images at the cost of minor information loss.
Based on the above discussion, we adopted a promising signal decomposition model, known as Kronecker-criterion-based SR [34], to solve the medical image fusion problem. The main contributions of this work are illustrated as follows:
(a)
Kronecker-criterion-based SR, with a designed activity level measure integrating the salient features of multiple domains, will effectively reduce the loss of structural detailed information in the fusion process.
(b)
Inspired by the formation process of the vision system, the spatial saliency by textural contrast consists of luminance and orientation contrasts that can promote more highlighted textural information in order to participate in the fusion process.
(c)
Compared with the l1-norm-based activity level measure in sparse vectors, the transform saliency by the sum of sparse salient features can highlight more coefficients to measure the composite activity level through the sum of differences in the adjacent areas.
The rest of this paper is organized as follows: Section 2 provides a brief description of conventional sparse representation theory and the Kronecker-criterion-based SR, i.e., the separable dictionary learning algorithm. The detailed fusion scheme is described in Section 3. The experimental results and a discussion are given in Section 4. Finally, Section 5 concludes the paper.

2. Related Work

2.1. SR-Based Image Fusion

SR reflects the sparsity of natural signals with minimal sparse coefficients, and this is consistent with the principle of HVS [35]. Given y R m in the vector mode of signal sample Y R m × m and an over-complete dictionary D R m × n (m < n), the objective function of dictionary learning consisting of the fidelity term and penalty term is defined as
arg min D , α 1 2 y D α 2 2 + λ R ( α )
where α represents the sparse vector, 2 2 represents the l2-norm, and λ represents the regularization parameter of the penalty term R ( α ) . SR can be roughly divided into two categories, the greedy scheme (e.g., matching pursuit (MP) [36] and orthogonal matching pursuit (OMP) [37]) with R ( α ) = α 0 and the convex optimization scheme (e.g., alternating direction method of multipliers (ADMM) [38]) with R ( α ) = α 1 . The extremely high complexity inhibits the practicality of the convex optimization scheme, while the greedy scheme has superiority in this regard.
In the process of conventional SR-based image fusion, its ability to handle fine details with an over-complete dictionary may be insufficient, since atoms (i.e., vectors) of the pre-trained over-complete dictionary are updated one-by-one with either the method of optimal directions (MOD) or k-singular value decomposition (K-SVD). This can be understood as extracting image textural information from only a one-dimensional direction; this breaks the potential correlations within the image, thus causing the obtained pre-trained dictionary to become unstructured. Meanwhile, the highly redundant dictionary is sensitive to random noise and may cause visual artifacts to appear. Therefore, there is a deviation between the source and fused images to some extent.

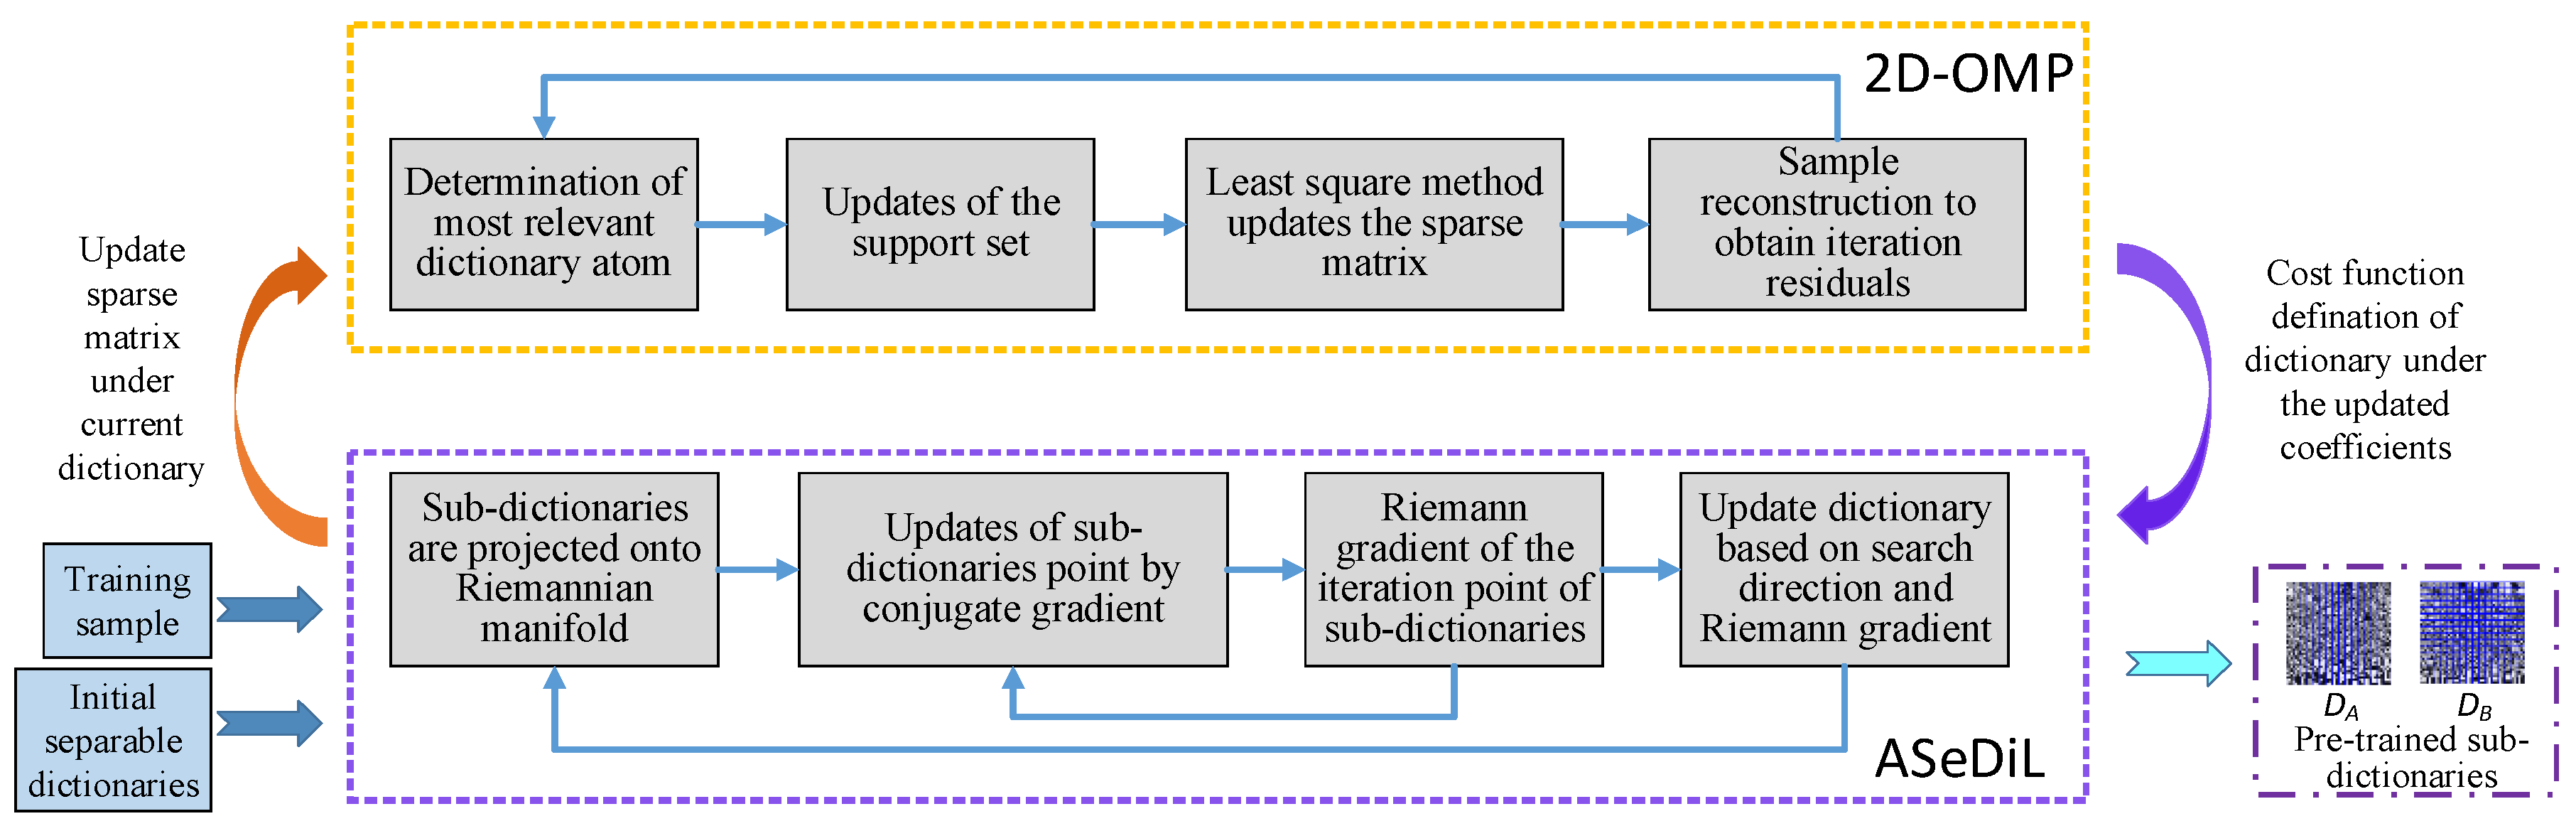
2.2. Separable Dictionary Learning Algorithm

To overcome the aforementioned deficiencies of SR for image fusion, the Kronecker-criterion-based separable structure has received significant attention [34]. On the premise of ensuring the quality of image reconstruction, the penalty in l0-norm with R ( α ) = α 0 and the corresponding objective function of separable dictionary learning [39] is defined as
arg min D A , S , D B S 0   such   that   D A S D B T = Y , S R n × n
where S represents a sparse matrix. As the cross-product of the over-complete dictionary D, the sub-dictionaries D A R m × n and D B R m × n were obtained by the Kronecher product criterion. For simplicity, we set both sub-dictionaries to the same size.
The steps of the separable dictionary-learning algorithm include sparse coding and dictionary update. The dictionary optimization problems were found using the extensional two-dimensional OMP (2D-OMP) greedy algorithm and the ASeDiL (analytic separable dictionary learning) algorithm to obtain the sparse coefficients and the pre-trained sub-dictionaries { D A , D B } , respectively, using the method described by [40]. The dictionary pre-training model is shown in Figure 1.
The process of sparse coding consists of a four-step iterative loop, including the determination of the most relevant dictionary atom, updates to the support set, updates to the sparse matrix S, and refactoring residual updates. To obtain the sparsest representation under the current dictionary, the objective function of sparse coding is expressed as
arg min S S 0   such   that   D A S D B T Y 2 2 < ε
where ε represents the tolerance of reconstruction error, and when D A S j D B T Y j F 2 > ε , the condition of iterations is terminated.
Combining the constraints with the l2-norm of the dictionary atoms equaling 1, and with no correlation of atoms in the dictionary, the log function was employed to fit the full rank and the column irrelevance of sub-dictionaries. Then, the objective function of the dictionary update was written as
arg min D A , D B D A S D B T - Y 2 2 + ω [ p ( D A ) + p ( D B ) ] + ψ [ h ( D A ) + h ( D B ) ]
where ω and ψ represent the fitting parameters, and h ( D A ) , p ( D A ) ,   h ( D B ) , p ( D B ) are defined as
h ( D A ) = 1 m log ( m ) log det ( 1 n D A D A T ) , p ( D A ) = log ( 1 ( ( D A ) T ( D A ) ) 2 )
h ( D B ) = 1 m log ( m ) log det ( 1 n D B D B T ) , p ( D B ) = log ( 1 ( ( D B ) T ( D B ) ) 2 )
By means of geodesics on the Riemannian manifold, the dictionary update adopted the conjugate gradient method to correct the most rapid descent direction of the iteration point of the dictionary update, ensuring the rapid convergence of the cost function, and improved the efficiency of the dictionary update.
With the aforementioned separable structure, the obtained sparse matrix composed of correlation coefficients becomes able characterize more textural and structural information. This can not only increase the dimensions of texture extraction without adding dictionary redundancy, but also ameliorate the accuracy of texture extraction with effective noise suppression performance. Through the above separable dictionary learning algorithm, the pre-trained sub-dictionaries can be obtained. Then, the pre-trained sub-dictionaries will participate in the subsequent transform saliency measure characterization process to extract features from the source images.

3. Proposed Fusion Method

The framework of the proposed method is shown in Figure 2. Supposing that there are K pre-registered source images denoted by I k , k { 1 , 2 , , K } , the r-th overlapping image patch of the k-th source image I k r was obtained through the sliding window technique, and the corresponding sparse coefficient map S k r was learned through the sparse coding process in the separable dictionary-learning algorithm with the pre-trained sub-dictionaries { D A , D B } . The proposed SR-based medical image fusion with measurement integrating spatial saliency and transform saliency consisted of the following two steps:

3.1. The Measurement of Activity Level for Fusion

3.1.1. Spatial Saliency by Textural Contrast

In general, the salient area is recognized by the vision system from the retina to the visual cortex. Some of the early information received by the retina is luminance contrast, and orientation contrast in the visual cortex is involved in understanding the context at higher levels. We were inspired to attempt to express spatial saliency by allowing textural contrast to be defined by luminance contrast and orientation contrast.
First of all, the luminance contrast was defined by considering the distinctiveness of the intensity attributes between each pixel and the corresponding image patch [41]. To increase the useful dynamic ranges and to suppress high contrast effectively in the background, the n-th order statistic was applied as
L C k r ( x , y ) = | μ ^ k r - 1 M ( x , y ) Φ I k r ( x , y ) | n
where μ ^ k r denotes the mean luminance values over the r-th patch in the k-th source image I k r , and Φ and M represent a 3 × 3 neighborhood with pixel ( x , y ) centered and its size, respectively.
Along with luminance contrast, the local image structure was captured by orientation contrast through a weighted structure tensor. It is worth noting that we focused on weighted gradient information rather than the gradient itself, and this highlights the main features of the source images. The weighted structure tensor [42] was able to effectively summarize the dominant orientation and the energy along this direction based on the weighted gradient field:
G I k r ( x , y ) = [ k = 1 K ( ω k ( x , y ) I k r x ) 2 k = 1 K ω k 2 ( x , y ) I k r x I k r y k = 1 K ω k 2 ( x , y ) I k r x I k r y k = 1 K ( ω k ( x , y ) I k r y ) 2 ]
where I k r / x and I k r / y denote the gradients along the x and y directions, respectively, at the given pixel ( x , y ) . The weight function ω k ( x , y ) is calculated by
ω k ( x , y ) = L S M k r ( x , y ) k = 1 K ( L S M k r ( x , y ) ) 2
where L S M k r ( x , y ) represents the local salient metric, which reflects the importance of the pixel ( x , y ) by computing the sum of intensity around it, and is calculated by
L S M k r ( x , y ) = ( x , y ) Φ ( | I k r ( x , y ) x | + | I k r ( x , y ) y | )
where | | denotes the absolute value operator. The local salient metric is sensitive to the edges and texture while being insensitive to the flat part. To express the local image structure, the weighted structure tensor as a semi-definite matrix can be decomposed by eigenvalue decomposition as
G I k r = V ( β 1 2 β 2 2 ) V T
The orientation contrast related to the eigenvalues of β 1 and β 2 of this matrix is calculated as
O C k r ( x , y ) = ( β 1 + β 2 ) 2 + η ( β 1 β 2 ) 2
where η > 1 . This parameter can determine the relative emphasis of the orientation contrast to the corner-like structures effectively.
Since it is assumed that the salient area contains luminance contrast and orientation contrast, as mentioned, we then attempted to define the texture contrast with two parts:
T C k r ( x , y ) = L C k r ( x , y ) × O C k r ( x , y )
Here, each part was smoothed by Gaussian filtering, as in [43], and T C k r was normalized to [0, 255] for gray-scale representation.

3.1.2. Spatial Saliency by Textural Contrast

Compared with the conventional transform-based activity level measure, which uses the l1-norm to describe the detail information contained in sparse vectors, the SSSF metric [44] is able to highlight more significant coefficients to participate in the composition of activity level measures through the sum of differences in adjacent areas, which is defined as
S S S F k r ( x , y ) = p = P P q = Q Q [ L S S F k r ( x + p , y + q ) ] 2
where P and Q determine a sliding window, with the size of the sparse matrix equal to the r-th patch in the k-th source image I k r . The local sparse salient feature (LSSF) metric represents the sparse saliency diversity of adjacent pixels, and is calculated as
L S S F k r ( x , y ) = ( m , n ) Φ [ S k r ( x , y ) S k r ( m , n ) ] 2
where Φ denotes a square window centered with a certain sparse coefficient that corresponds to pixel ( x , y ) in the source image patch I k r .

3.2. Fusion Scheme

Combining the transform saliency and the spatial saliency of the image patch, the proposed activity level measure was defined as
ϖ k r ( x , y ) = S S S F k r ( x , y ) × T C k r ( x , y )
where ϖ k r is the measurement result of the source image patch I k r . Then, the maximum weighted activity level measure was used to achieve the fused coefficient map:
S F r ( x , y ) = S k * r ( x , y ) , k * = arg max k [ ϖ k r ( x , y ) ]
Then, the fusion result was obtained by sparse reconstruction as
I F r = D A S F r D B T
The final fused image I F was constituted by the overall fused image patches.

4. Experiments

4.1. Experimental Setting

4.1.1. Source Images

In our experiments, three categories of “Acute stroke”, “Hypertensive encephalopathy”, and “Multiple embolic infarctions” from clinical multimodal image pairs in the Whole Brain Atlas Medical Image (WBAMI) database were used as test images, which can be downloaded at: http://www.med.harvard.edu/aanlib/home.htm, accessed on 8 June 2023. The database covers a variety of modal combination types, and it is widely applied for the verification of medical image fusion performance [22,23,24]. The spatial resolution was set to 256 × 256 for all test images. To make sure the registration was realized, we took the feature-based registration algorithm for each pair, i.e., the method of complementary Harris feature point extraction based on mutual information [45], which has strong robustness and is able to adapt to various image characteristics and variations.

4.1.2. Objective Evaluation Metrics

Since there are limitations of a single objective metric in terms of reflecting the fusion result accurately, the six popular objective metrics, namely, the Xydeas–Petrovic index [46], the structural similarity index QS [47], the universal image quality index QU [48], the overall image quality index Q0 [48], the weighted fusion quality index QW [49], and the mutual information index QNMI [50], were adopted to evaluate the fusion performance in this study. The higher the scores of the above metrics, the better the fusion result of the corresponding fusion method. A classification of these metrics is shown in Table 1.

4.1.3. Methods for Comparison

Since it was inspired by the transform-domain-based method [33] to design the activity level measure and fusion scheme in our method, to carry out a fair and clear comparison, the conventional l1-norm-based scheme [33] and the sum of sparse salient features (SSSF)-based scheme were used to verify the advantages of the proposed activity level measurement. Meanwhile, in each of the medical image fusion categories, some newly published representative medical image fusion methods, such as LRD [51], NSST-MSMG-PCNN [52], and CSMCA [53], were used for comparison with the proposed method. The competitors adopted the default parameters in the corresponding literature.

4.1.4. Algorithm Parameter Setting

For the proposed method, to obtain the pre-trained sub-dictionaries, we chose 104 patches with sizes of 8 × 8 from different uncorrupted images to be included in the training dataset. Furthermore, the training patches were normalized with a zero mean and unit l2-norm, and the initial sub-dictionaries were obtained by the MATLAB function randn with normalized columns. Following the experimental setup detailed in [40], the spatial size of the sliding window was set to 8 × 8, the patch-wise step size was set to 1 to keep the shift invariant of SR, the two Kronecker-criterion-based separable dictionaries were set to the same size of 8 × 16, and the tolerance of the reconstruction error ε was set to 0.01.
In addition to the above general settings, variable n and variable η were the key parameters affecting the luminance contrast and the orientation contrast, respectively, and the parameters set through quantitative experiments are shown in Figure 3. It can be seen that variable n would affect the luminance contrast and the retention of effective information in subsequent fusion results. On this basis, we set n = 3 as a compromise. With an increase in variable η , the texture structure of the source image was clearer, and it was conducive for extracting orientation contrast information. On this basis, we set η = 0.5 .

4.2. Comparison to Other Fusion Methods

The subjective visual and objective metrics were used to evaluate the proposed method. The comparison experiment contained three categories of clinical multimodal medical images, including “Acute stroke”, with 28 pairs of CT/MR-PD and CT/MR-T2; “Hypertensive encephalopathy”, with 28 pairs of CT/MR-Gad and CT/MR-T2; and “Multiple embolic infarctions”, with 60 pairs of CT/MR-PD, CT/MR-T1, and CT/MR-T2.

4.2.1. Subjective Visual Evaluation

In the experiments using multimodal medical image fusion, CT and MRI image fusion were the most common. This is because the information provided by CT and MRI images can act as a good supplement, while the multimodal combination category can be expanded to other types of fusion, such as the method used in this paper. Figure 4 shows the nine randomly selected groups of multimodal-fused medical images in subjective visual experiments. The first three groups belong to “Acute stroke”, the second three groups belong to “Hypertensive encephalopathy”, and the last three groups belong to “Multiple embolic infarctions”. To more intuitively reflect the superiority of the proposed method, one group showing typical fusion was selected from each of the three WBAMI categories as an example with which to conduct a detailed analysis on the amplification of representative regions, as shown in Figure 5, Figure 6 and Figure 7.
The CT/MR-T2 fusion results and the red box selections of the proposed method and its competitors are shown in Figure 5. The fusion results of LRD and NSST-MSMG-PCNN are blurred since artificial interference is unsuppressed (in Figure 5c,d), while CSMCA, l1-norm, SSSF, and the proposed method, as SR-based methods, are robust to artificial interference, and the fused edges are more distinct (see in Figure 5e–h). However, the luminance loss of CSMCA caused a reduction in contrast (see in Figure 5e), and CSMCA, l1-norm, and SSSF showed partial reductions in detail (see in Figure 5e–g). In contrast, more details from the source images were extracted via the proposed method, with artificial interference suppressed effectively (see in Figure 5h).
The CT/MR-T2 fusion results and the red box selections of the proposed method and its competitors are shown in Figure 6. We can clearly see that the results of LRD and NSST-MSMG-PCNN were disturbed by noise (see in Figure 6c,d). CSMCA, l1-norm, and SSSF lost a significant amount of structural information (see in Figure 6e–g). In contrast, the proposed method performed better in terms of structural integrity and robustness to artificial interference (see in Figure 6h).
The CT/MR-T2 fusion results and the red box selections of the proposed method and competitors are shown in Figure 7. It is clear that artifacts appeared when using the LRD method (see in Figure 7c). NSST-MSMG-PCNN, CSMCA, l1-norm, and SSSF caused losses of luminance, and all led to partial reductions in detail (see in Figure 7d–g). In contrast, the proposed method was obviously superior to its competitors in terms of luminance and detail retention (see in Figure 7h).
Through these subjective comparison experiments, it was difficult to contain the completed information for SR-based image fusion with a single measurement of the activity level, such as the CSMCA, l1-norm, or SSSF. Moreover, the proposed method was not only able to retain luminance and detail information from the source images, but also performed better in terms of robustness to artificial interference, keeping the fused edges more distinct. Therefore, the proposed method offered better subjective visual performance than the competitors.

4.2.2. Objective Quality Evaluation

Objective quality evaluation is an important approach with which to evaluate fusion performance. Table 2 reports the objective assessment results of the proposed method and its competitors. The average scores of all of the test examples from each of the three WBAMI categories were calculated, and the highest value of each row, shown in bold, indicates the best fusion performance. It can be seen that the proposed method performed best in all six metrics in the “Acute stroke” category, which included 28 pairs of multimodal medical images. In the “Hypertensive encephalopathy” category with 28 pairs of multimodal medical images, except for Q0 ranking second, the other five metrics of the proposed method were the best. In the “Multiple embolic infarctions” category with 60 pairs of multimodal medical images, this metric ranked second, and the other five metrics of the proposed method were the best. On the whole, the average results of the six metrics of the proposed method were the best in the three clinical category experiments. Therefore, based on the above subjective analysis and objective evaluation, the proposed method has considerable advantages over the most recently published methods of LRD, NSST-MSMG-PCNN, and CSMCA.
Furthermore, without changing the fusion framework, the ablation experiments were carried out to verify the universal advantages of the proposed method over the l1-norm- and SSSF-based schemes, which only considered the transform domain situation of the activity level measurement. Through the six commonly used fusion metrics, the QNMI metric of the proposed method had the most obvious advantage over the two experiments in which ablation was competed. This indicates that the proposed new activity level measure plays a significant role in the retention of the textural information of the source images. Furthermore, it is worth noting that the SSSF-based scheme showed slightly significant superiority over the l1-norm-based scheme in all test examples; this reveals the justification for using SSSF as a substitute for l1-norm in order to participate in the construction of the activity level measure in the transform domain.

5. Conclusions

In this study, a multi-modal medical image fusion method with Kronecker-criterion-based SR was proposed. The main contribution of the proposed method is summarized in three parts. Firstly, a novel activity level measure integrating spatial saliency and transform saliency was proposed to represent more abundant textural structure features. Secondly, inspired by the formation process of the vision system, the spatial saliency was characterized by the textural contrast consisting of luminance contrast and orientation contrast to induce more highlighted textural information to participate in the fusion process. Thirdly, as a substitution for conventional l1-norm-based sparse saliency, the sum of the sparse salient features metric characterizes the transform saliency to promote more significant coefficients and to participate in the composition of the activity level measure. The experimental results of different clinical medical image categories demonstrated the effectiveness of the proposed method. Extensive experiments have demonstrated the state-of-the-art performance of the proposed method in terms of visual perception and objective assessment. Taking into account the influence of computational efficiency, some measures can attempt to obtain a more compact and adaptive dictionary, such as by taking source images as the training sample and testing samples simultaneously, and some feature selection rules can be used to exclude unfeatured image patches.

Author Contributions

The individual contributions are provided as: Conceptualization, S.H. and Q.H.; methodology, validation, data curation, writing—original draft preparation, writing—review and editing, Q.H.; resources, Q.H., W.C. and S.H.; investigation, W.C., S.X. and S.H. All authors have read and agreed to the published version of the manuscript.

Funding

This work was supported by the Natural Science Foundation of China [Grant No. 32073028, 62172030, 62002208], the Ningbo Youth Science and Technology Innovation Leading Talent Project [Grant No. 2023QL004].

Data Availability Statement

There were no new data created.

Acknowledgments

The authors would like to thank the anonymous reviewers for their insightful comments and suggestions, which have greatly improved this paper.

Conflicts of Interest

The authors declare that there is no conflict of interest regarding the publication of this paper.

References

  1. Ahmad, S.; Khan, S.; Ajmi, M.F.A.; Dutta, A.K.; Dang, L.M.; Joshi, G.P.; Moon, H. Deep learning enabled disease diagnosis for decure internet of medical things. Comput. Mater. Contin. 2022, 73, 965–979. [Google Scholar]
  2. Haq, A.; Li, J.; Agbley, B.; Khan, A.; Khan, I.; Uddin, M.; Khan, S. IIMFCBM: Intelligent integrated model for feature extraction and classification of brain tumors using MRI clinical imaging data in IoT-Healthcare. IEEE J. Biomed. Health Inform. 2022, 26, 5004–5012. [Google Scholar] [CrossRef] [PubMed]
  3. Haq, A.; Li, J.; Khan, S.; Alshara, M.; Alotaibi, R.; Mawuli, C. DACBT: Deep learning approach for classification of brain tumors using MRI data in IoT healthcare environment. Sci. Rep. 2022, 12, 15331. [Google Scholar] [CrossRef] [PubMed]
  4. Hermessi, H.; Mourali, O.; Zagrouba, E. Multimodal medical image fusion review: Theoretical background and recent advances. Signal Process. 2021, 183, 108036. [Google Scholar] [CrossRef]
  5. Yousef, R.; Khan, S.; Gupta, G.; Siddiqui, T.; Albahlal, B.; Alajlan, S.; Haq, M. U-net-based models towards optimal MR brain image segmentation. Diagnostics 2023, 13, 1624. [Google Scholar] [CrossRef]
  6. Unar, S.; Xingyuan, W.; Chuan, Z. Visual and textual information fusion using kernel method for content based image retrieval. Inf. Fusion 2018, 44, 176–187. [Google Scholar] [CrossRef]
  7. Unar, S.; Wang, X.; Wang, C.; Wang, Y. A decisive content based image retrieval approach for feature fusion in visual and textual images. Knowl. Based Syst. 2019, 179, 8–20. [Google Scholar] [CrossRef]
  8. Xia, Z.; Wang, X.; Zhou, W.; Li, R.; Wang, C.; Zhang, C. Color medical image lossless watermarking using chaotic system and accurate quaternion polar harmonic transforms. Signal Process. 2019, 157, 108–118. [Google Scholar] [CrossRef]
  9. Wang, C.; Wang, X.; Xia, Z.; Zhang, C. Ternary radial harmonic Fourier moments based robust stereo image zero-watermarking algorithm. Inf. Sci. 2019, 470, 109–120. [Google Scholar] [CrossRef]
  10. Wang, C.; Wang, X.; Xia, Z.; Ma, B.; Shi, Y. Image description with polar harmonic Fourier moments. IEEE Trans. Circuits Syst. Video Technol. 2020, 30, 4440–4452. [Google Scholar] [CrossRef]
  11. Liu, S.; Zhao, J.; Shi, M. Medical image fusion based on improved sum-modified-laplacian. Int. J. Imaging Syst. Technol. 2015, 25, 206–212. [Google Scholar] [CrossRef]
  12. Liu, S.; Zhao, J.; Shi, M. Medical image fusion based on rolling guidance filter and spiking cortical model. Comput. Math. Methods Med. 2015, 2015, 156043. [Google Scholar]
  13. Sneha, S.; Anand, R.S. Ripplet domain fusion approach for CT and MR medical image information. Biomed. Signal Process. Control 2018, 46, 281–292. [Google Scholar]
  14. Talbar, S.N.; Chavan, S.S.; Pawar, A. Non-subsampled complex wavelet transform based medical image fusion. In Proceedings of the Future Technologies Conference, Vancouver, BC, Canada, 15–16 November 2018; pp. 548–556. [Google Scholar]
  15. Zhao, W.; Yang, H.; Wang, J.; Pan, X.; Cao, Z. Region- and pixel-level multi-focus image fusion through convolutional neural networks. Mob. Netw. Appl. 2021, 26, 40–56. [Google Scholar] [CrossRef]
  16. Jin, X.; Nie, R.; Zhang, X.; He, D.Z.K. Multi-focus image fusion combining focus-region-level partition and pulse-coupled neural network. Soft Comput. 2019, 23, 4685–4699. [Google Scholar]
  17. Qiu, X.; Li, M.; Yuan, L.Z.X. Guided filter-based multi-focus image fusion through focus region detection. Signal Process. Image Commun. 2019, 72, 35–46. [Google Scholar] [CrossRef]
  18. Li, H.; Ma, K.; Yong, H.; Zhang, L. Fast multi-scale structural patch decomposition for multi-exposure image fusion. IEEE Trans. Image Process. 2020, 29, 5805–5816. [Google Scholar] [CrossRef]
  19. Ma, K.; Li, H.; Yong, H.; Wang, Z.; Meng, D.; Zhang, L. Robust multi-exposure image fusion: A structural patch decomposition approach. IEEE Trans. Image Process. 2017, 26, 2519–2532. [Google Scholar] [CrossRef]
  20. Li, H.; Chan, T.N.; Qi, X.; Xie, W. Detail-preserving multi-exposure fusion with edge-preserving structural patch decomposition. IEEE Trans. Circuits Syst. Video Technol. 2021, 99, 4293–4304. [Google Scholar] [CrossRef]
  21. Nair, R.R.; Singh, T. MAMIF: Multimodal adaptive medical image fusion based on B-spline registration and non-subsampled shearlet transform. Multimed. Tools Appl. 2021, 80, 19079–19105. [Google Scholar] [CrossRef]
  22. Kong, W.; Miao, Q.; Lei, Y. Multimodal sensor medical image fusion based on local difference in non-subsampled domain. IEEE Trans. Instrum. Meas. 2019, 68, 938–951. [Google Scholar] [CrossRef]
  23. Padmavathi, K.; Karki, M.V.; Bhat, M. Medical image fusion of different modalities using dual tree complex wavelet transform with PCA. In Proceedings of the International Conference on Circuits, Controls, Communications and Computing, Bangalore, India, 4–6 October 2016; pp. 1–5. [Google Scholar]
  24. Xi, X.; Luo, X.; Zhang, Z.; You, Q.; Wu, X. Multimodal medical volumetric image fusion based on multi-feature in 3-D shearlet transform. In Proceedings of the International Smart Cities Conference, Wuxi, China, 14–17 September 2017; pp. 1–6. [Google Scholar]
  25. Shabanzade, F.; Ghassemian, H. Multimodal image fusion via sparse representation and clustering-based dictionary learning algorithm in nonsubsampled contourlet domain. In Proceedings of the 8th International Symposium on Telecommunications, Tehran, Iran, 27–28 September 2016; pp. 472–477. [Google Scholar]
  26. Xia, J.; Chen, Y.; Chen, A.; Chen, Y. Medical image fusion based on sparse representation and pcnn in nsct domain. Comput. Math. Methods Med. 2018, 5, 2806047. [Google Scholar] [CrossRef]
  27. Yin, M.; Liu, X.N.; Liu, Y.; Chen, X. Medical image fusion with parameter-adaptive pulse coupled-neural network in nonsubsampled shearlet transform domain. IEEE Trans. Instrum. Meas. 2018, 68, 49–64. [Google Scholar] [CrossRef]
  28. Dinh, P.H. A novel approach based on three-scale image decomposition and marine predators algorithm for multi-modal medical image fusion. Biomed. Signal Process. Control 2021, 67, 102536. [Google Scholar] [CrossRef]
  29. Pei, C.; Fan, K.; Wang, W. Two-scale multimodal medical image fusion based on guided filtering and sparse representation. IEEE Access 2020, 8, 140216–140233. [Google Scholar] [CrossRef]
  30. Shahdoosti, H.R.; Mehrabi, A. Multimodal image fusion using sparse representation classification in tetrolet domain. Digit. Signal Process. 2018, 79, 9–22. [Google Scholar] [CrossRef]
  31. Ling, T.; Yu, X. Medical image fusion based on fast finite shearlet transform and sparse representation. Comput. Math. Methods Med. 2019, 2019, 3503267. [Google Scholar]
  32. Elad, M.; Yavneh, I. A plurality of sparse representations is better than the sparsest one alone. IEEE Trans. Inf. Theory 2009, 55, 4701–4714. [Google Scholar] [CrossRef]
  33. Liu, Y.; Chen, X.; Rabab, K.W.; Wang, Z. Image fusion with convolutional sparse representation. IEEE Signal Process. Lett. 2016, 23, 1882–1886. [Google Scholar] [CrossRef]
  34. Ghassemi, M.; Shakeri, Z.; Sarwate, A.D.; Bajwa, W.U. Learning mixtures of separable dictionaries for tensor data: Analysis and algorithms. IEEE Trans. Signal Process. 2019, 68, 33–48. [Google Scholar] [CrossRef] [Green Version]
  35. Olshausen, B.A.; Field, D.J. Emergence of simple-cell receptive field properties by learning a sparse code for natural images. Nature 1996, 381, 607–609. [Google Scholar] [CrossRef] [PubMed]
  36. Sturm, B.L.; Christensen, M.G. Cyclic matching pursuits with multiscale time-frequency dictionaries. In Proceedings of the Conference Record of the Forty Fourth Asilomar Conference on Signals, Systems and Computers, Pacific Grove, CA, USA, 7–10 November 2011. [Google Scholar]
  37. Schnass, K. Average performance of orthogonal matching pursuit (OMP) for sparse approximation. IEEE Signal Process. Lett. 2018, 26, 1566–1567. [Google Scholar] [CrossRef]
  38. Boyd, S.; Parikh, N.; Chu, E.; Peleato, B.; Eckstein, J. Distributed optimization and statistical learning via the alternating direction method of multipliers. Found. Trends Mach. Learn. 2010, 3, 1–122. [Google Scholar] [CrossRef]
  39. Hawe, S.; Seibert, M.; Kleinsteuber, M. Separable dictionary learning. In Proceedings of the IEEE Conference on Computer Vision and Pattern Recognition, Portland, OR, USA, 23–28 June 2013; pp. 438–445. [Google Scholar]
  40. Hu, Q.; Hu, S.; Zhang, F. Multi-modality medical image fusion based on separable dictionary learning and Gabor filtering. Signal Process. Image Commun. 2020, 83, 115758. [Google Scholar] [CrossRef]
  41. Kim, W.; Kim, C. Spatiotemporal saliency detection using textural contrast and its applications. IEEE Trans. Circuits Syst. Video Technol. 2013, 24, 646–659. [Google Scholar]
  42. Zhou, Z.; Li, S.; Wang, B. Multi-scale weighted gradient-based fusion for multi-focus images. Inf. Fusion 2014, 20, 60–72. [Google Scholar] [CrossRef]
  43. Hou, X.; Zhang, L. Saliency detection: A spectral residual approach. In Proceedings of the IEEE Conference on Computer Vision & Pattern Recognition, Minneapolis, MI, USA, 17–22 June 2007; pp. 1–8. [Google Scholar]
  44. Liu, X.; Mei, W.; Du, H. Structure tensor and nonsubsampled shearlet transform based algorithm for CT and MRI image fusion. Neurocomputing 2017, 235, 131–139. [Google Scholar] [CrossRef]
  45. Pan, S.; Zhang, J.; Liu, X.; Guo, X. Complementary Harris feature point extraction method based on mutual information. Signal Process. 2017, 130, 132–139. [Google Scholar]
  46. Petrović, V. Subjective tests for image fusion evaluation and objective metric validation. Inf. Fusion 2007, 8, 208–216. [Google Scholar] [CrossRef]
  47. Yang, C.; Zhang, J.; Wang, X.; Liu, X. A novel similarity based quality metric for image fusion. Inf. Fusion 2008, 9, 156–160. [Google Scholar] [CrossRef]
  48. Wang, Z.; Bovik, A.C. A universal image quality index. IEEE Signal Process. Lett. 2002, 9, 81–84. [Google Scholar] [CrossRef]
  49. Piella, G.; Heijmans, H. A new quality metric for image fusion. Int. Conf. Image Process. 2003, 3, 173–176. [Google Scholar]
  50. Qu, G.; Zhang, D.; Yan, P. Information measure for performance of image fusion. Electron. Lett. 2002, 38, 313–315. [Google Scholar] [CrossRef] [Green Version]
  51. Li, X.; Guo, X.; Han, P.; Wang, X.; Luo, T. Laplacian re-decomposition for multimodal medical image fusion. IEEE Trans. Instrum. Meas. 2020, 69, 6880–6890. [Google Scholar] [CrossRef]
  52. Tan, W.; Tiwari, P.; Pandey, H.M.; Moreira, C.; Jaiswal, A.K. Multimodal medical image fusion algorithm in the era of big data. Neural Comput. Appl. 2020, 3, 1–21. [Google Scholar] [CrossRef]
  53. Liu, Y.; Chen, X.; Ward, R.; Wang, Z.J. Medical image fusion via convolutional sparsity based morphological component analysis. IEEE Signal Process. Lett. 2019, 26, 485–489. [Google Scholar] [CrossRef]
Figure 1. Dictionary pre-training model on Riemannian manifold.
Electronics 12 03058 g001
Figure 2. Overall framework of the proposed method.
Electronics 12 03058 g002
Figure 3. Parameter setting through quantitative experiments: The first line indicates the effect of n on luminance contrast, and the second line indicates the effect of η on orientation contrast.
Electronics 12 03058 g003
Figure 4. Source images and the corresponding fusion results with nine pairs of CT/MRI images: (a1,b1) image group 1 (CT and MR-PD); (a2,b2) image group 2 (CT and MR-T2); (a3,b3) image group 3 (CT and MR-T2); (a4,b4) image group 4 (CT and MR-Gad); (a5,b5) image group 5 (CT and MR-T2); (a6,b6) image group 6 (CT and MR-T2); (a7,b7) image group 7 (CT and MR-T1); (a8,b8) image group 8 (CT and MR-PD); (a9,b9) image group 9 (CT and MR-T2); fused images (c1c9) of the LRD-based method; fused images (d1d9) of the NSST-MSMG-PCNN-based method; fused images (e1e9) of the CSMCA-based method; fused images (f1f9) of the l1-norm-based method; fused images (g1g9) of the SSSF-based method; and fused images (h1h9) using the proposed method.
Electronics 12 03058 g004
Figure 5. The CT/MR-T2 image pair from the “Acute stroke” category and the corresponding fusion results achieved using different methods: (a,b) represent the CT image and the MR-T2 image, respectively; (c) is the fusion result of LRD; (d) is the fusion result of NSST-MSMG-PCNN; (e) is the fusion result of CSMCA; (f) is the fusion result of l1-norm; (g) is the fusion result of SSSF; and (h) is the fusion result of the proposed method.
Electronics 12 03058 g005
Figure 6. The CT/MR-T2 image pair from the “Hypertensive encephalopathy” category and the corresponding fusion results with different methods: (a,b) are the CT image and MR-T2 image, respectively; (c) is the fusion result of LRD; (d) is the fusion result of NSST-MSMG-PCNN; (e) is the fusion result of CSMCA; (f) is the fusion result of l1-norm; (g) is the fusion result of SSSF; and (h) is the fusion result of the proposed method.
Electronics 12 03058 g006
Figure 7. The CT/MR-T2 image pair from the “Multiple embolic infarctions” category and the corresponding fusion results with different methods: (a,b) are the CT image and MR-T2 images, respectively; (c) is the fusion result of LRD; (d) is the fusion result of NSST-MSMG-PCNN; (e) is the fusion result of CSMCA; (f) is the fusion result of l1-norm; (g) is the fusion result of SSSF; and (h) is the fusion result of the proposed method.
Electronics 12 03058 g007
Table 1. Classification of different objective assessment metrics.
CategoryMetricSymbolDescription
Textural-feature-preservation-based metrics Normalized mutual
information
QNMIIt measures the mutual information of a fused image and source images.
Edge-dependent-sharpness-based metrics Normalized weighted
performance index
QAB/FIt measures the amount of edge and orientation information of the fused image using the Sobel edge detection operator.
Overall image
quality index
Q0It evaluates structural distortions in the fused image.
Comprehensive-evaluation-based metrics Weighted fusion
quality index
QWIt values the structural similarity by addressing the coefficient correlation, illumination, and contrast.
Structural similarity
index
QSIt determines the structural similarity by taking comparisons of luminance, contrast, and structure.
Universal image indexQUIt is designed by modeling image distortion as a combination of the loss of correlation, luminance distortion, and contrast distortion.
Table 2. Objective assessment of different fusion methods.
WBAMIMetricNSST-
LRDMSMG-CSMCAl1-normSSSFProposed
PCNN
Acute stroke
(28 pairs of CT/MR -PD, CT/MR-T2)
QAB/F0.48210.51870.55130.58630.58440.5880
QS0.72440.69720.72540.73590.73660.7418
QU0.67090.46280.58620.68030.68090.6866
Q00.30080.29840.30380.32710.32700.3319
QW0.56330.57910.58730.60350.60610.6090
QNMI0.74660.66930.70970.85540.83570.8827
Hypertensive encephalopathy
(28 pairs of CT/MR-Gad, CT/MR-T2)
QAB/F0.50620.53430.58400.62420.62480.6290
QS0.69740.66990.71650.71440.71630.7211
QU0.62830.45060.58250.63950.64130.6474
Q00.31520.30510.31300.35400.35630.3541
QW0.59840.62540.64190.66070.66710.6736
QNMI0.68830.62400.66800.70910.70400.7464
Multiple embolic infarctions
(60 pairs of CT/MR -PD, CT/MR-T1, CT/MR-T2)
QAB/F0.45840.51400.55450.58500.57840.5840
QS0.68930.67850.70020.69390.69520.7016
QU0.61460.44380.61460.63310.63430.6412
Q00.32110.31580.31110.34490.34580.3488
QW0.55620.5851 0.58420.59620.59770.5994
QNMI0.69510.63270.65360.72040.70950.7575
Disclaimer/Publisher’s Note: The statements, opinions and data contained in all publications are solely those of the individual author(s) and contributor(s) and not of MDPI and/or the editor(s). MDPI and/or the editor(s) disclaim responsibility for any injury to people or property resulting from any ideas, methods, instructions or products referred to in the content.

