1. Introduction
While driving, the interaction between the vehicle tires and the road generates vibrations which are transmitted to the chassis and, further, to the passengers. This also happens in the military field, where this type of vibration can generate mechanical stress that can affect sensitive equipment (such as telecommunication, IT, armament systems, etc.) and crew members, including the driver, as well as transported goods. Addressing the issue of vibration effects on the human body and cargo involves taking into consideration the existing standards and regulations, the use of different methodologies of study, the allowed limit values, and analysing vibration parameters. Considering these aspects, the present paper only focuses on presenting the results of a comparative analysis of vibrations transmitted to the human body, in the case of armoured personnel carriers and cargo transportation vehicles.
Such an analysis can be performed with the use of various signal processing methods, e.g., time series or wavelet analysis [
1,
2]. These complex tools help to determine the maximum amount of energy generated by the vibrations of a vehicle by applying Power Spectral Density (PSD) analysis to different indicators, as well as frequency values that affect drivers’ comfort.
Related studies concerning vibrations induced by different types of vehicles to the transported personnel are already within the scope of different scientific papers. Article [
3] focuses on the study of whole-body vibrations transmitted to the drivers of heavy equipment vehicles, comparing short- and long-term exposures. After establishing the comparative methodologies for assessing the exposure to vibrations based on a typical work cycle, the authors concluded that vibration values exceed the limits due to factors such as the type of road surface, forward speed, etc. Article [
4] is a study involving the effects on drivers exposed to vibrations when operating military vehicles in different terrain conditions. The approach was to analyse the influence of vibrations on the driver’s attention and the level of their cognitive functions. As depicted in the paper, the whole-body vibration exposure affects these particular attention mechanisms, with an inter-subject dimensionless coefficient of variation ranging from 0.28 to 0.51.
Other scientists have also addressed the topic of vibration analysis by performing measurements with a Viking military vehicle while driving on different types of terrain [
5]. The values of shocks, noise, and frequency-weighted magnitudes were analysed while the driver was standing or sitting. From the experiments and the follow-up analysis, the authors concluded that higher vibration values occur when travelling on a track rather than on a road, with the driver standing, namely, 1.0 m/s
2 r.m.s (root mean square). Also, for a tested speed of 55 km/h while driving on the road, the sound pressure level was the highest, reaching 104 dB(A). In this case, the driver was also standing.
The interest in the topic of the vibrations that are characteristic of military vehicles is also reflected through studies conducted by international organisations, such as the NATO (North Atlantic Treaty Organization) Science and Technology Organization [
6]. The scientific research project published by this group addresses issues regarding the accepted vibration level, frequency-weighted vibration values, daily exposure vs. vibration dose value, etc. In this case, the aim was to develop a monitoring tool for personnel’s state of health.
According to existing field studies [
7,
8,
9], the human body’s response to vibrations depends on factors such as: vibration frequency, acceleration, and time of exposure. Also, the upper limit values are regulated by the standards ISO 2631/1:1997 ÷ 2631/5:2004, but only for healthy people submitted to normal daily stress, and they target an increase in comfort alongside decreases in fatigue. In accordance with the afore-mentioned standards, vibrations below 1 Hz are the cause of sickness conditions such as: sea sickness, car sickness, drowsiness, etc. Between 3 and 6 Hz, when the human body is perceived as a mechanical system, the resonance effect takes place. Between 60 and 90 Hz [
10,
11,
12,
13,
14], stress is transmitted to the eyeball, and between 100 and 200 Hz, the human jaw line experiences the resonance effect. In
Table 1, symptoms due to vibration exposure of the human body are summarized [
10], extracted from standards ISO 2631/1:1997 ÷ 2631/5:2004.
Recent research in the vibration domain regarding effects on the human body with implications on long term comfort consisted of performing practical tests, in addition to simulations, according to the in-effect standards [
10,
11]. The majority of tests are performed along the vertical axis [
15].
Among the factors with influence on vibrations transmitted to the human body are: type and particularities of the road, tyre pressure, suspension type, driving speed, type of vehicle (including its configuration regarding engine placement), load, etc.
According to the EU Directive 2002/44 regarding minimum health and safety requirements concerning the exposure of workers to the risks generated by physical agents (vibrations) [
9,
16], there are two limit indicators which are not to be exceeded: Exposure Limit Value (ELV) and Exposure Action Value (EAV). Both have different limits depending on the measuring system, hand-arm vibration system (HAV) or whole-body vibration system (WBV).
In the case of measurements performed using the former system, the accepted ELV is 5 m/s
2 A(8), where A(8) represents the average value calculated over an eight-hour interval [
17,
18], and the maximum EAV for eight hours is 2.5 m/s
2. On the other hand, for the latter system, the ELV is 1.15 m/s
2 (accordingly, the Vibration Dose Value—VDV—is 21 m/s
1.75) and the EAV is 0.5 m/s
2 (accordingly, the Vibration Dose Value—VDV—is 9.1 m/s
1.75). The accepted level of vibrations sent to the hand-arm system are determined for a period of eight hours and represent the frequency-weighted Root Mean Square (RMS) values (Directive 2002/44/EC) [
16].
Regarding the present paper, the novelty consists in performing a comparative frequency analysis of the vibrations generated by two types of military vehicles, one for cargo transportation use and the other one for personnel carrier use, which are specific in terms of manufacturing process, ergonomics standards, design functionality, etc.
Our approach is to measure the VDV and RMS parameters recorded at the whole-body level and at the hand-arm level for both types of vehicles and compare them with the accepted value. In addition, considering the medical importance of the vibration, we conduct an advanced frequency analysis, based on recurrence plot representation that allows us to identify the main spectral components of the vibrations measured at the chassis and at the engine cover.
The remainder of the paper is organised as follows.
Section 2 summarises the theoretical aspects involved in vibration characterization. The proposed experimental setup, along with the measurement conditions and the equipment used, are specified in
Section 3. Then,
Section 4 is dedicated to experimental results presentation and discussion. Finally, we present some conclusions and perspectives in
Section 5.
2. Evaluation Techniques of Vibration Exposure
The vibration is characterised by acceleration measurements that can be performed along all three orthogonal axes (
x,
y,
z), depending on the scope of the research. In order to analyse the influence of road quality on the whole human body, the vertical (
z) component is the most relevant [
19]. Therefore, our analysis will focus on the acceleration measured on the vertical axis.
Being directly related to the energy characterization of the vibration profile, the RMS represents a widely used parameter in vibration analysis. Considering the time variance in the waveform, RMS estimates the destructive capability of the vibration, but may underestimate the vibrations caused by shocks.
Based on ISO 2631-1, VDV is recommended as a measure of shock within the vibration signal. VDV integrates both vibration magnitude and exposure time, calculated as:
where
represents the total time of measurement, in [s], and
is the frequency-weighted acceleration, in [m/s
2] [
15,
20].
According to [
9,
21,
22,
23], human health is only affected by certain frequency values. For this reason, scientists use the weighted frequency acceleration as a parameter for analysis, by determining all three orthogonal constituents:
where
is the total weighted acceleration, and
,
,
represent the acceleration components along the (
x,
y,
z) axes.
Considering the importance of vibration frequency on the human body, our work aimed to perform a precise frequency analysis to highlight the main components and predict the effects caused by them on the whole human body. Therefore, to determine the frequency components, we used a classical frequency analysis based on Fast Fourier Transformation (FFT) and a new approach that relies on Recurrence Plot Analysis (RPA).
Computing the discrete Fourier transform, the FFT converts a discrete signal from the time domain
to the frequency domain
. Relying on FFT, the power spectral density PSD, defined as in (3), represents the most common approach for frequency analysis and depicts how the power of a signal is distributed over the frequency.
where
is the number of samples used in time domain representation [
24]. In the vibration analysis field, the PSD represents the acceleration and, therefore, it is expressed in
[
25,
26].
Derived from the theory of nonlinear dynamic systems, the fundamental goal of RPA is to represent the recurrence of states or events in a time series by constructing a two-dimensional plot known as a recurrence plot. Recurrence patterns in the data are visually represented by the recurrence plot, which allows researchers to analyse dynamic and complex systems.
Considering the acquired time series
with a length of
samples, the
dimensional phase space is derived using a new time delay parameter
, as in:
where
is the phase space vectors, respectively, and
and
are the axis unit vectors [
27,
28].
The RPA approach then shows the phase space on the distance/recurrence matrix. The distance matrix calculates the separations between the phase space’s points:
where
is the squared Euclidean distance, and the recurrence matrix represents the threshold version of the distance matrix.
In our case, where we want to estimate the fundamental period of the signal, the distance matrix representation is more advantageous than the recurrence matrix in following the entire signal evolution and not dividing it into binary values, which typically highlights various spectral harmonics [
29,
30].
The existence of persistent diagonal lines in the image of the recurrence matrix indicates that the system returns for a particular period of time in basically the same state. Therefore, the Diagonal Lines Quantification (DLQ), performed as in (6), estimates the fundamental period based on the distance between two successive diagonal lines.
where
is the complement of the distance matrix.
Then, the FFT is applied to this quantification:
where
is as given in (4).
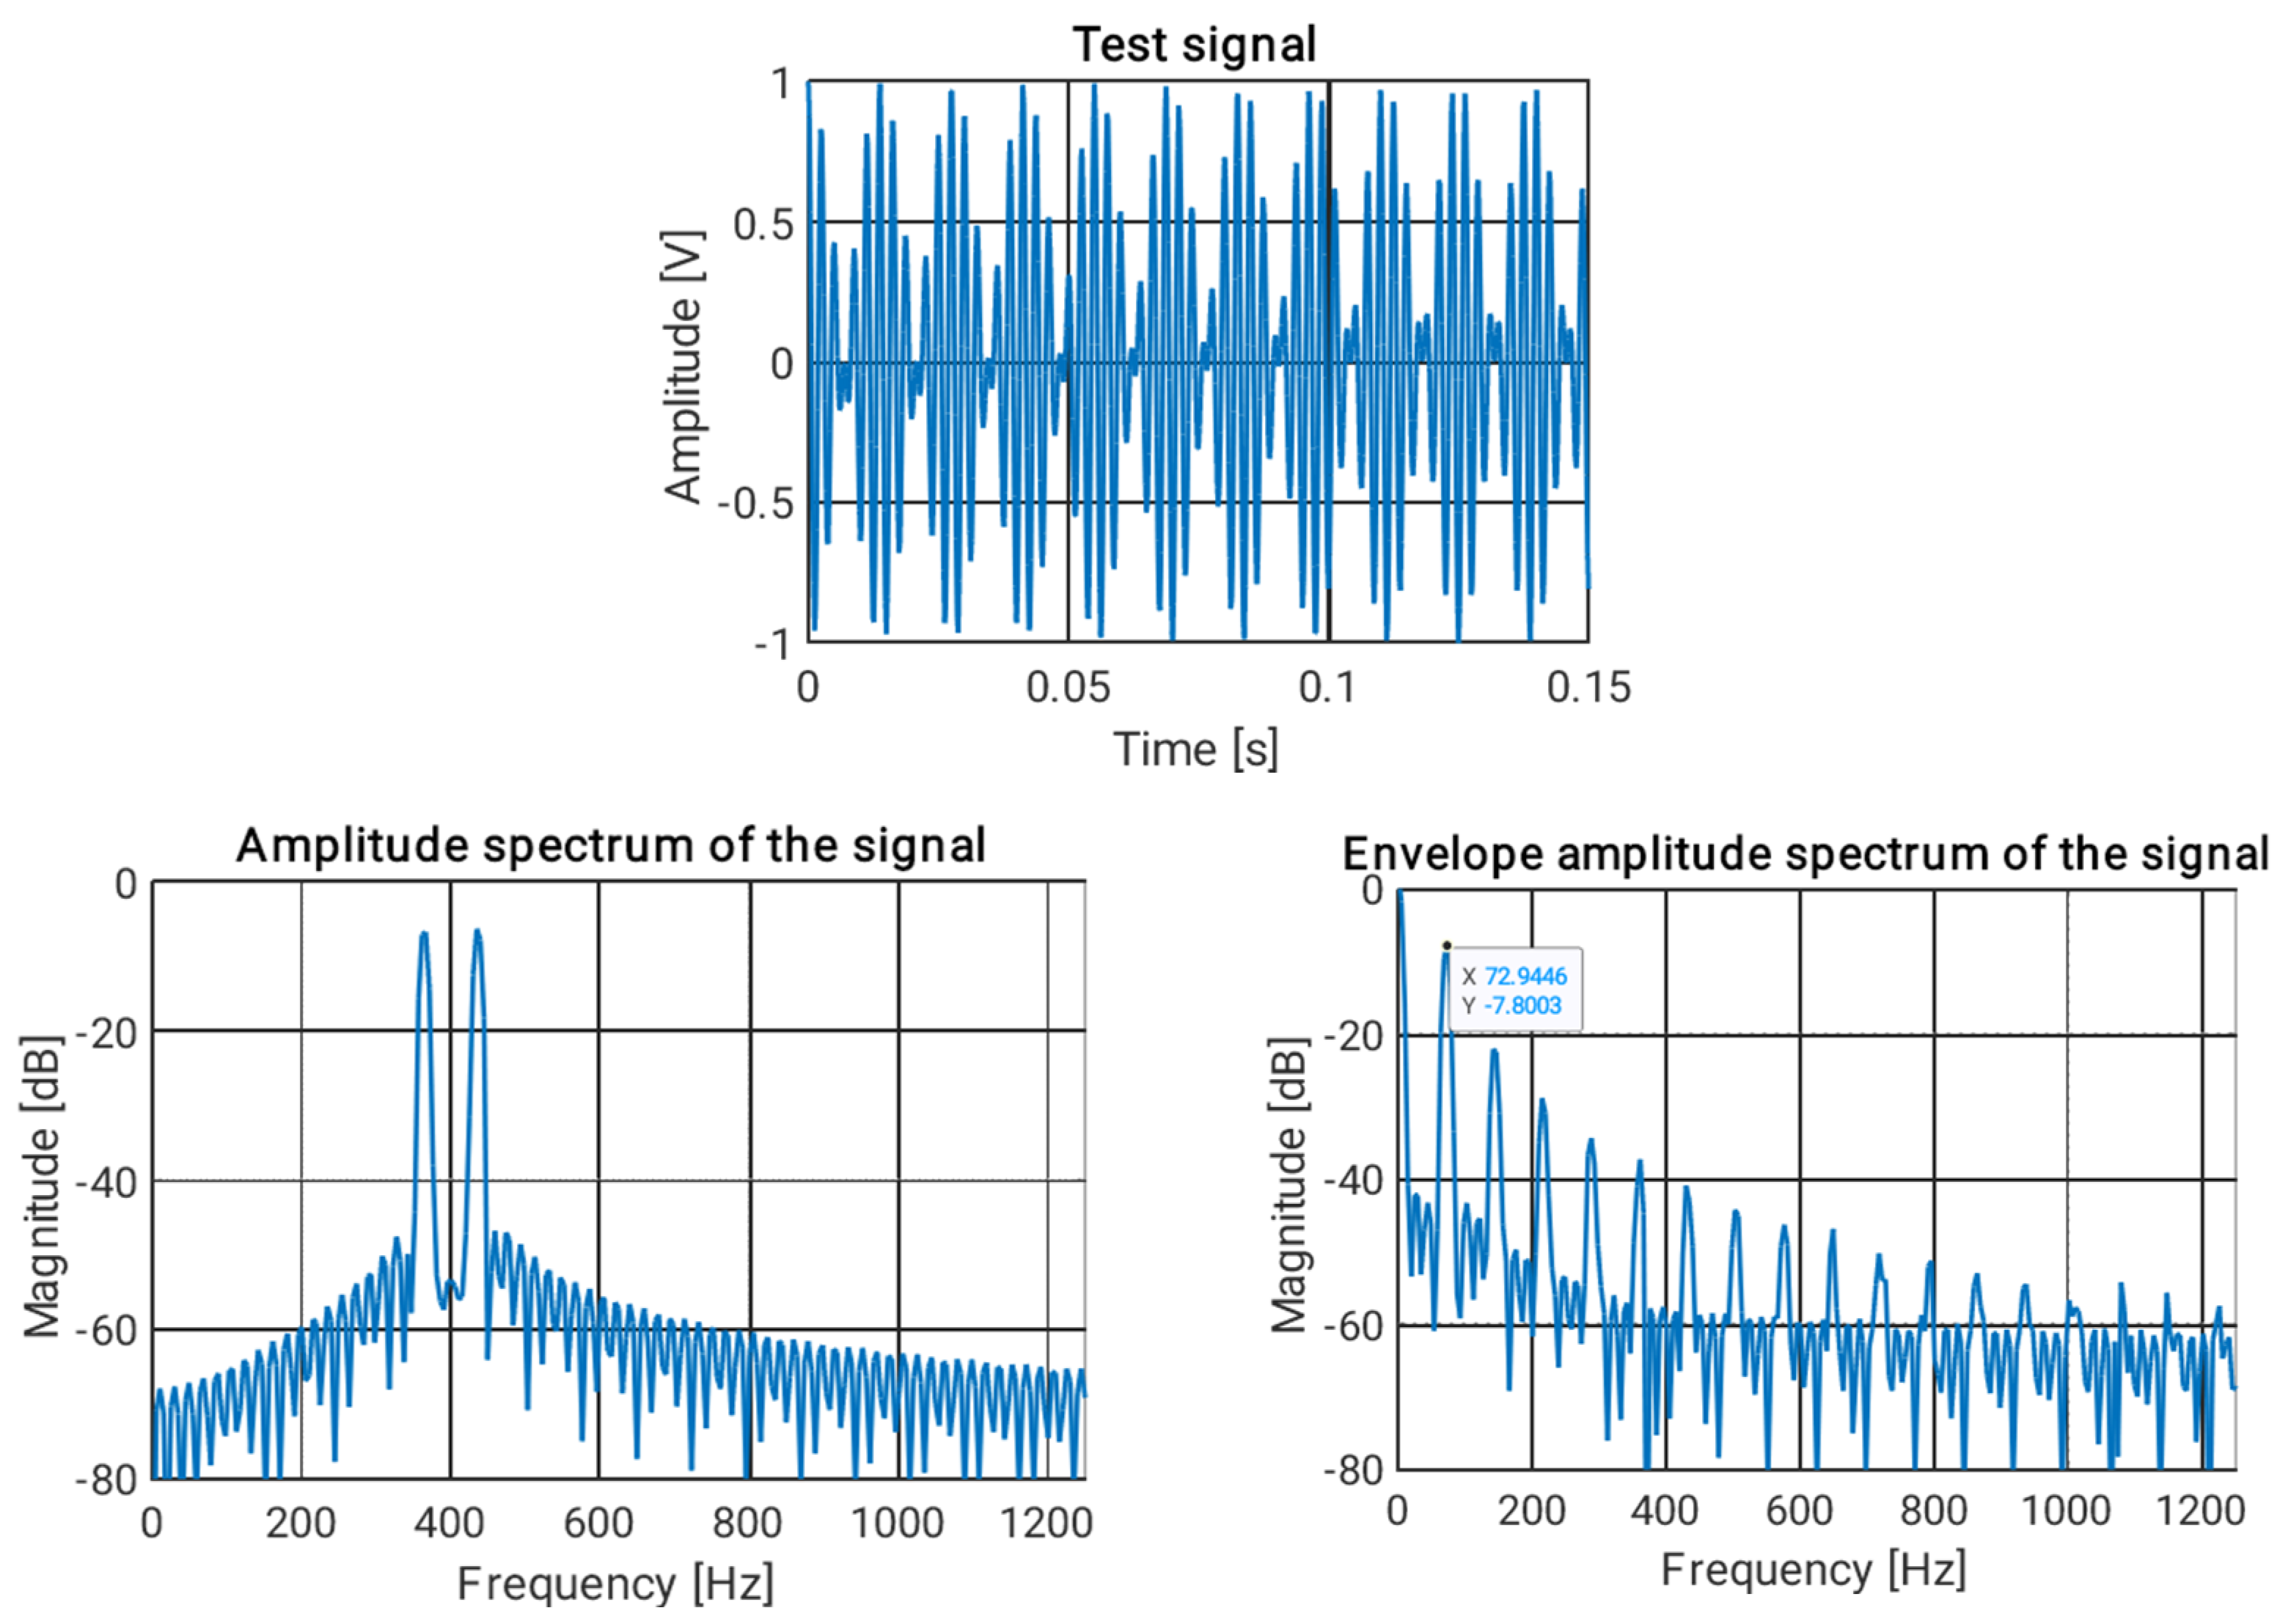
In order to exemplify the method presented above, we consider the following amplitude-modulated test signal:
where the modulating pulsation is
, the modulating pulsation is
and the sampling frequency is
.
As can be seen from
Figure 1, the classical approach of the PSD analysis, in the ideal case of the noise-free amplitude modulated signal, highlights just the double side band of the modulated signal (
Figure 1, down left) or just the double of the modulation frequency (
Figure 1, bottom-right). For real signals, which are affected by noise and many other phenomena, this approach is very limited.
In exchange, the DLQ approach from
Figure 2 provides both spectral components in its representation: the double side band as well as the double of the modulating frequency. This approach is also well suited for the frequency-modulated signals [
29], the spectral components also being present in this case.
Hereby, unlike the traditional methods, which compute the Fourier transform on the investigated signal directly, this method highlights all of the fundamental frequency components that are contained in the signal, managing to eliminate a large part of the noise and highlighting only the elements of interest for the analysed system.
In order to present the advantages of the DLQ method, a noisy test signal was used, given in
Figure 3 and characterized by a 10 dB Signal to Noise Ratio (SNR). As can be noticed in
Figure 4, even under these conditions, the DLQ techniques still provide both spectral components while managing to mitigate a large part of the noise.
4. Results of Experimental Research
4.1. Vibrations Transmitted to the Driver
In order to determine the accelerations transmitted to the hand-arm system or to the whole body, three tests were performed per vehicle, each lasting between 60 and 120 s. According to regulations imposed by Directive 2002/44/EC [
16], the time exposure of a subject during tests can be less than eight hours only if the relevant periods are intercepted. In displaying the results, each value is coloured differently depending on the appropriate range [
16]:
4.1.1. Values Measured in Case of the Vehicle Destined for Cargo Transportation
For vibrations sent to the hand-arm system, the results are given in
Table 2.
The parameters from
Table 2 have the following meaning:
- →
, , —average values of frequency-weighted acceleration, in the case of the hand-arm system, along the x, y, z axes.
Yet again, the results obtained in the case of the whole-body measurement of vibrations can be observed from
Table 3.
The parameters from
Table 3 have the following meaning:
- -
, , —average values of frequency-weighted acceleration in the case of the whole-body system, along the x, y, z axes;
- -
VDV (x), VDV (y), VDV (z)—vibration dose values, along the x, y, z axes.
The data measured by the uniaxial accelerometers placed on the military vehicle on the engine cover and chassis are illustrated in
Figure 10. A PSD analysis was further performed to highlight the main frequency components, and the results are shown in
Figure 11, while the DLQ results are given in
Figure 12.
4.1.2. Values Measured in Case of the Vehicle Destined for Troops Transportation
During experimental tests conducted with the vehicle destined for troop transportation, RMS values of accelerations (
,
,
) and vibration dose values (VDV) were recorded, the former for both hand-arm and whole-body systems and the latter for whole-body systems. The results are shown in
Table 4 and
Table 5.
Measurements similar to those made in the case of a military vehicle for logistic transportation were also captured on the armoured personnel carrier. Thus,
Figure 13 presents the acceleration evolution during the testing period, while
Figure 14 and
Figure 15 illustrate the results obtained using PSD and, respectively, DLQ analysis.
4.2. Interpretation of Results
According to the PSD and DLQ analysis depicted in
Figure 11 and
Figure 12, some topics could be discussed, since they may have importance in the further development of particular damping devices between the vehicle engine and its chassis.
The engine dissipates an important amount of energy on the frequencies of about 28 Hz and 55 Hz. Due to the rather rigid mountings of the engine on the chassis, the transducer that was mounted on the chassis identified the same frequencies. Both PSD and DLQ analysis identified the same main frequency components, but DLQ removed a large part of the noise, keeping only the essential information.
As we figured out, the first peak denotes the value of the engine angular speed, which was kept as steady as possible, around 1650 ÷ 1700 rpm (and can be expressed as 27.5 ÷ 28.5 rev/sec, i.e., 27.5 ÷ 28.5 Hz).
The second peak is at about 55 Hz and its value is double that of the first peak. This can be interpreted as the second harmonic of the engine (double of the first peak). It can also be identified in the right image of
Figure 11, which depicts the chassis frequency distribution.
Moreover, a significant decrease in vibration power can be noticed for both frequency components. According to the PDS analysis, for the 28 Hz component, the attenuation is 2.2 G2/Hz, while for the 55 Hz frequency, the attenuation is significant higher, almost 11 G2/Hz. The same behaviour can be observed in the results achieved by the DLQ method. It is obvious that there is a connection between these two elements and the engine behaviour strongly reflects upon the chassis, but at the same time, the system shows a selective behaviour in frequency, attenuating more strongly the components with a frequency higher than 50 Hz.
The same tests have been performed on an APC (Armoured Personnel Carrier). The actual APC has a very low rev diesel engine, and it was working pretty close to its idle speed (of about 650 ÷ 700 rpm). The tests were performed around less than 900 rpm, on tarmac. There is a slight difference when compared to the tests developed on the logistic transportation vehicle. As can be noticed, although the transducer mounted on the engine sensed only two peaks, the one on the hull (chassis) sensed one more. This occured due to the resonance induced by the hull (it behaves like a hollow resonant chamber, sensing and amplifying higher frequencies as well). Due to this behaviour, the peak from the frequency of 13 Hz is lower than the one at 39 Hz, the second one being amplified by the behaviour of the vehicle hull. The hull somehow dampens the first harmonic, letting the second become harmonic stronger. A reverse connection can also be noticed, as the transducers on the engine collected a similar signal. This might have occurred due to the rigid mounting of the engine inside the vehicle hull.
In comparison with the results obtained for the military vehicle for logistic transportation, the vibrations induced in the chassis of the military vehicle for use as an armoured personnel carrier are more attenuated, the power difference being about 10 G
2/Hz regardless of the frequency. Thus, for this frequency range, a linear behaviour can be observed. However, according to
Figure 14 and
Figure 15, an additional frequency component of 80 Hz which was not induced by the engine’s operating mode can be noticed at the chassis level. This frequency component may indicate a malfunction in the system that produces an additional vibration.
In both cases, the DLQ method highlights the main frequency components and eliminates a significant part of the noise. Thus, this method can make a clear distinction between different close-frequency vibrations that affect the human body, being suitable to be integrated into advanced systems for analysing the effects caused by driving certain vehicles.
From the analysis of the results given in
Table 2 and
Table 3, regarding the acceleration values transmitted to the hand-arm and the whole-body systems in the case of the logistic transportation vehicle, it can be concluded that all frequency-weighted acceleration values are below the limit of 5 m/s
2 imposed by standard ISO 5349-2 [
11].
When analysing the vibration dose values in the case of the same vehicle, it can be observed that the limit value of 21 m/s1.75 given by the standard was exceeded during all three experimental tests (26.802 m/s1.75 for Test 1, 28.737 m/s1.75 for Test 2, and 25.565 m/s1.75 for Test 3). If the VDV exceeds the limit imposed by the standard, it indicates that the driver has been exposed to high levels of vibration that may cause health problems such as hand-arm vibration syndrome. However, if the A(8) is below the limit, it suggests that the overall daily exposure to vibration is still within acceptable levels. In this situation, it is important to take steps to reduce the driver’s exposure to high-frequency vibrations to bring the VDV within the permissible limit. This could involve implementing engineering controls, such as using vibration-absorbing materials, or administrative controls, such as using alternating drivers for the whole task to minimise their exposure.
It is important to note that, even if the A(8) is below the limit, drivers may still experience symptoms of hand-arm vibration syndrome if they are exposed to high levels of vibration for prolonged periods. Therefore, the analysis of both VDV and A(8) indicators shows that drivers of the analysed logistic transportation vehicle may be exposed to excessive levels of vibration. On that account, the manufacturer has taken measures to limit the impact on the driver by mounting a pneumatic damper below their seat, thus reducing the level of vibrations transmitted to the human body.
From the analysis of the results given in
Table 4 and
Table 5, regarding the acceleration values transmitted to the hand-arm and the whole-body systems in the case of the armoured personnel carrier, it can be concluded that all frequency-weighted acceleration values were below the limit of 5 m/s
2 imposed by standard ISO 5349-2 [
11]. The maximum A(8) value was 2.938 m/s
2, during Test 2. Yet again, the cumulative exposure while running on tarmac did not exceed the upper limit value of 21 m/s
1.75 [
11], meaning that all missions can be carried out without negative effects on the driver’s health condition (obtained values are 14.897 m/s
1.75 for Test 1, 11.817 m/s
1.75 for Test 2, and 16.159 m/s
1.75 for Test 3).
There are several factors that contribute to better results for vibration damping in the case of armoured personnel carriers. First is the existence of the armoured casing of the vehicle, which is a self-supporting structure that is rigid and compact. For example, the vehicle’s chassis and body are reinforced with thicker steel which can help absorb vibrations and reduce the impact on the occupants. Second, the tyres are specially designed to provide better traction and reduce vibration. Third, the vehicle’s specialised suspension systems are designed to absorb and dissipate shocks and vibration.
5. Conclusions
The use of the two vibration analysis methods, PSD and DLQ, allows for a precise estimation of the maximum time to which the driver of a vehicle can be exposed depending on the condition of the road on which the movement is carried out and depending on the technical condition of the vehicle before symptoms such as sickness, fatigue, etc., might appear.
Determining the VDV and A(8) values for heavy vehicles is important because it helps to assess the level of vibration and shock exposure to which the driver and passengers may be subjected. From the analysis, it can be stated that the driver exposed to such vibration indicator values and shocks can experience health disorders or fatigue.
From the frequency analysis, it can be noticed that most of the frequencies of the logistic transportation vehicle spectra are less important than the peak ones, while the ones belonging to the APC are higher. This is due to the behaviour of the hull, which works as a damper for the important ones and as an amplifier for the rest of the spectrum. Obviously, this is noticeable by the human ear as well if travelling inside the vehicle (meaning the APC).
In addition to the potential health effects, excessive vibration and shock can also lead to decreased comfort, reduced driver and passenger satisfaction, and even damage to the vehicle or its contents. Therefore, determining the VDV and A(8) values for the tested heavy trucks helps to ensure the safety and well-being of the occupants and to comply with relevant regulations which exist at the international level.
In order to protect transported goods, there are some suggestions with respect to the tests performed with the logistic transportation vehicle.
First, it is rather hard to lower the vibrations transmitted by the engine to the chassis. The engine is already mounted on vibration-damping elements (rubber, elastic connectors, and so on). More elastic elements could lead to an unstable behaviour of the engine movements and to a less accurate transmission of the engine power to the rest of the transmission. At its turn, most of the vibration generated by the engine work will be transmitted to the frame of the truck.
Furthermore, the transport platform of the truck is rigidly coupled to its frame, with the links providing no damping to the platform. Therefore, the only way to protect the carried cargo is to ensure a less rigid connection between it and the truck platform.
Nevertheless, not all cargo types can be transported this way, so this will be always an issue for the payload securing team. The driver is well protected by the damping system within the driver’s seat. The lack or malfunctioning of this system may lead to increased fatigue of the driver, especially when traveling long distances and on rough terrain.
As far as the armoured personnel carrier is concerned, these things are even more problematic.
The vibrations are even more amplified by the resonance effect of the hull. Yet, if taking into account that the driver’s seat has no damping system at all, it could be used in further applications.
On the other hand, that would be economically unfeasible due to at least two reasons. The first is related to the number of troops inside: not only the driver is subject to vibrations but also the rest of the troops. The second is related to the time spent inside the vehicle. Most of the fighting/troop transport operations scarcely exceed a few hours (two, three at the utmost), so the exposure will not exceed the forbearance limits of the organism and the troops will successfully face the situation due to their military training.
Nevertheless, at least the driver’s seat should be fit with a vibration-damping system as the logistic transportation truck (and other vehicles) has, since the driver has the longest and most intense activity inside such a vehicle.


 ,
, 


