Article

A Design for a Lithium-Ion Battery Pack Monitoring System Based on NB-IoT-ZigBee

1
School of Mechanical Engineering, North China University of Water Resources and Electric Power, Zhengzhou 450045, China
2
School of Management and Economics, North China University of Water Resources and Electric Power, Zhengzhou 450045, China
3
School of Computing, Engineering & Digital Technologies, Teesside University, Middlesbrough TS1 3BA, UK
*
Authors to whom correspondence should be addressed.
Electronics 2023, 12(17), 3561; https://doi.org/10.3390/electronics12173561
Submission received: 14 July 2023 / Revised: 20 August 2023 / Accepted: 21 August 2023 / Published: 23 August 2023

Abstract

:
With environmental issues arising from the excessive use of fossil fuels, clean energy has gained widespread attention, particularly the application of lithium-ion batteries. Lithium-ion batteries are integrated into various industrial products, which necessitates higher safety requirements. Narrowband Internet of Things (NB-IoT) is an LPWA (Low Power Wide Area Network) technology that provides IoT devices with low-power, low-cost, long-endurance, and wide-coverage wireless connectivity. This study addresses the shortcomings of existing lithium-ion battery pack detection systems and proposes a lithium-ion battery monitoring system based on NB-IoT-ZigBee technology. The system operates in a master-slave mode, with the subordinate module collecting and fusing multi-source sensor data, while the master control module uploads the data to local monitoring centers and cloud platforms via TCP and NB-IoT. Experimental validation demonstrates that the design functions effectively, accomplishing the monitoring and protection of lithium-ion battery packs in energy storage power stations.

1. Introduction

In recent years, due to the consumption of fossil fuels, energy crises and environmental pollution have become significant factors affecting people’s quality of life [1]. To reduce environmental pollution and the greenhouse effect, countries worldwide have begun focusing on the development and utilization of clean energy. However, clean energy is characterized by randomness and uncertainty, necessitating the establishment of energy storage systems [2,3]. Among various energy storage systems, lithium-ion batteries are widely used due to their high energy density, long cycle life, low self-discharge rate, and lack of memory effect [4]. Lithium-ion batteries also play a vital role in fields such as smartphones and electric vehicles. Consequently, with the rapid development of clean energy generation and electric vehicles, lithium-ion batteries have received increasing attention [5,6,7]. However, safety concerns have hindered their rapid application, such as accidents in energy storage stations in Arizona, USA, in 2019, and Beijing in 2021, resulting in firefighter casualties. Additionally, nearly 30 energy storage accidents occurred in South Korea between 2018 and 2020. Therefore, a well-designed battery monitoring system is essential for large-scale energy storage stations to ensure safe and reliable operation [8].
Due to issues with lithium-ion battery materials, the voltage of a single lithium-ion battery is typically between 2.5 and 4.2 V [1]. Multiple single cells are connected in series and parallel to form battery modules, which meet practical usage requirements, and several battery modules compose larger battery packs connected to the grid [9,10]. However, the current large-scale battery pack monitoring systems exhibit certain design flaws: (1) wired communication leads to cable harness problems such as connection failure, high cost, heavyweight, and complex design; and (2) insufficient monitoring data, preventing timely warnings [11,12,13].
A Battery Management System (BMS) developed and designed by Bosch of Germany is able to manage different types and models of batteries, adopting jumper cables in the hardware design to cope with changes in the number of batteries, and modifying parameters on the software to adapt to new battery packs. Honda researchers in Japan developed a BMS that disconnects the battery pack from the EV when it is hit by a crash, severe bumps, or malfunctions, preventing more serious accidents. The BMS developed by China’s BYD uses a distributed design to avoid the drawbacks of a centralized structure. The BMS is capable of monitoring individual batteries, collecting various parameter information of the battery pack, realizing the calculation of the battery charge state, and setting up a temperature management system and a three-level protection system to ensure the safe and reliable operation of electric vehicles.
Narrowband Internet of Things (NB-IoT) offers advantages such as a large connection capacity, low power consumption, and strong coverage. However, it also has drawbacks, including limited data transmission, high communication costs, and immature technology. NB-IoT is primarily designed for fixed monitoring, low power consumption, and multi-device scenarios. The NB-IoT communication protocol eliminates the traditional measurement reporting process, reducing device power consumption. However, the protocol is tailored for multi-device, low-power monitoring environments, resulting in subpar communication performance and data transmission delays. This poses a significant challenge for certain application scenarios in smart power stations, such as the timely reporting of battery status information during thermal runaway warnings.
This study proposes a battery monitoring system based on NB-IoT-ZigBee technology. The system operates in a master-slave mode, with the subordinate module collecting parameters such as the temperature, voltage, current, and strain of the battery pack and performing preliminary fault detection [14]. The data are then transmitted to the master control module via ZigBee [15,16]. The master control module uploads the collected data to a local upper computer via a serial port, and the local upper computer uploads the data to a local monitoring center via a TCP connection for staff inspection [17]. The master control module also uploads the data to a cloud platform via NB-IoT, enabling the remote monitoring of the energy storage station when the local monitoring center is unattended [18]. Finally, the test results demonstrate that the designed monitoring system effectively monitors and protects energy storage station batteries and has potential applications in energy storage stations [19,20].

2. Network Architecture of Smart Power Station Based on NB-IoT-ZigBee

2.1. Advantages and Disadvantages of NB-IoT

Advantages:
(1)
Broad coverage: Compared to existing communication technologies, Narrowband Internet of Things (NB-IoT) has stronger penetration capabilities and is less affected by energy storage boxes, making it very suitable for transmitting information from energy storage boxes.
(2)
Low power consumption: NB-IoT can enter a sleep state when not in use, with a standby time of up to 10 years, making it very suitable for transmitting information from energy storage boxes.
(3)
Large capacity: NB-IoT has fewer restrictions on connected devices, allowing tens of thousands of users to connect and meet the connection needs of smart power station equipment.
Disadvantages:
(1)
The cost of Narrowband Internet of Things (NB-IoT) is higher compared to other technologies such as ZigBee and Bluetooth. The cost of NB-IoT chips is higher, and if all information transmission in energy storage boxes was to use NB-IoT, the cost would increase significantly.
(2)
To address the battery distribution characteristics of energy storage boxes, ZigBee technology is used for information transmission in energy storage boxes. This ensures the real-time transmission of information while also reducing costs.

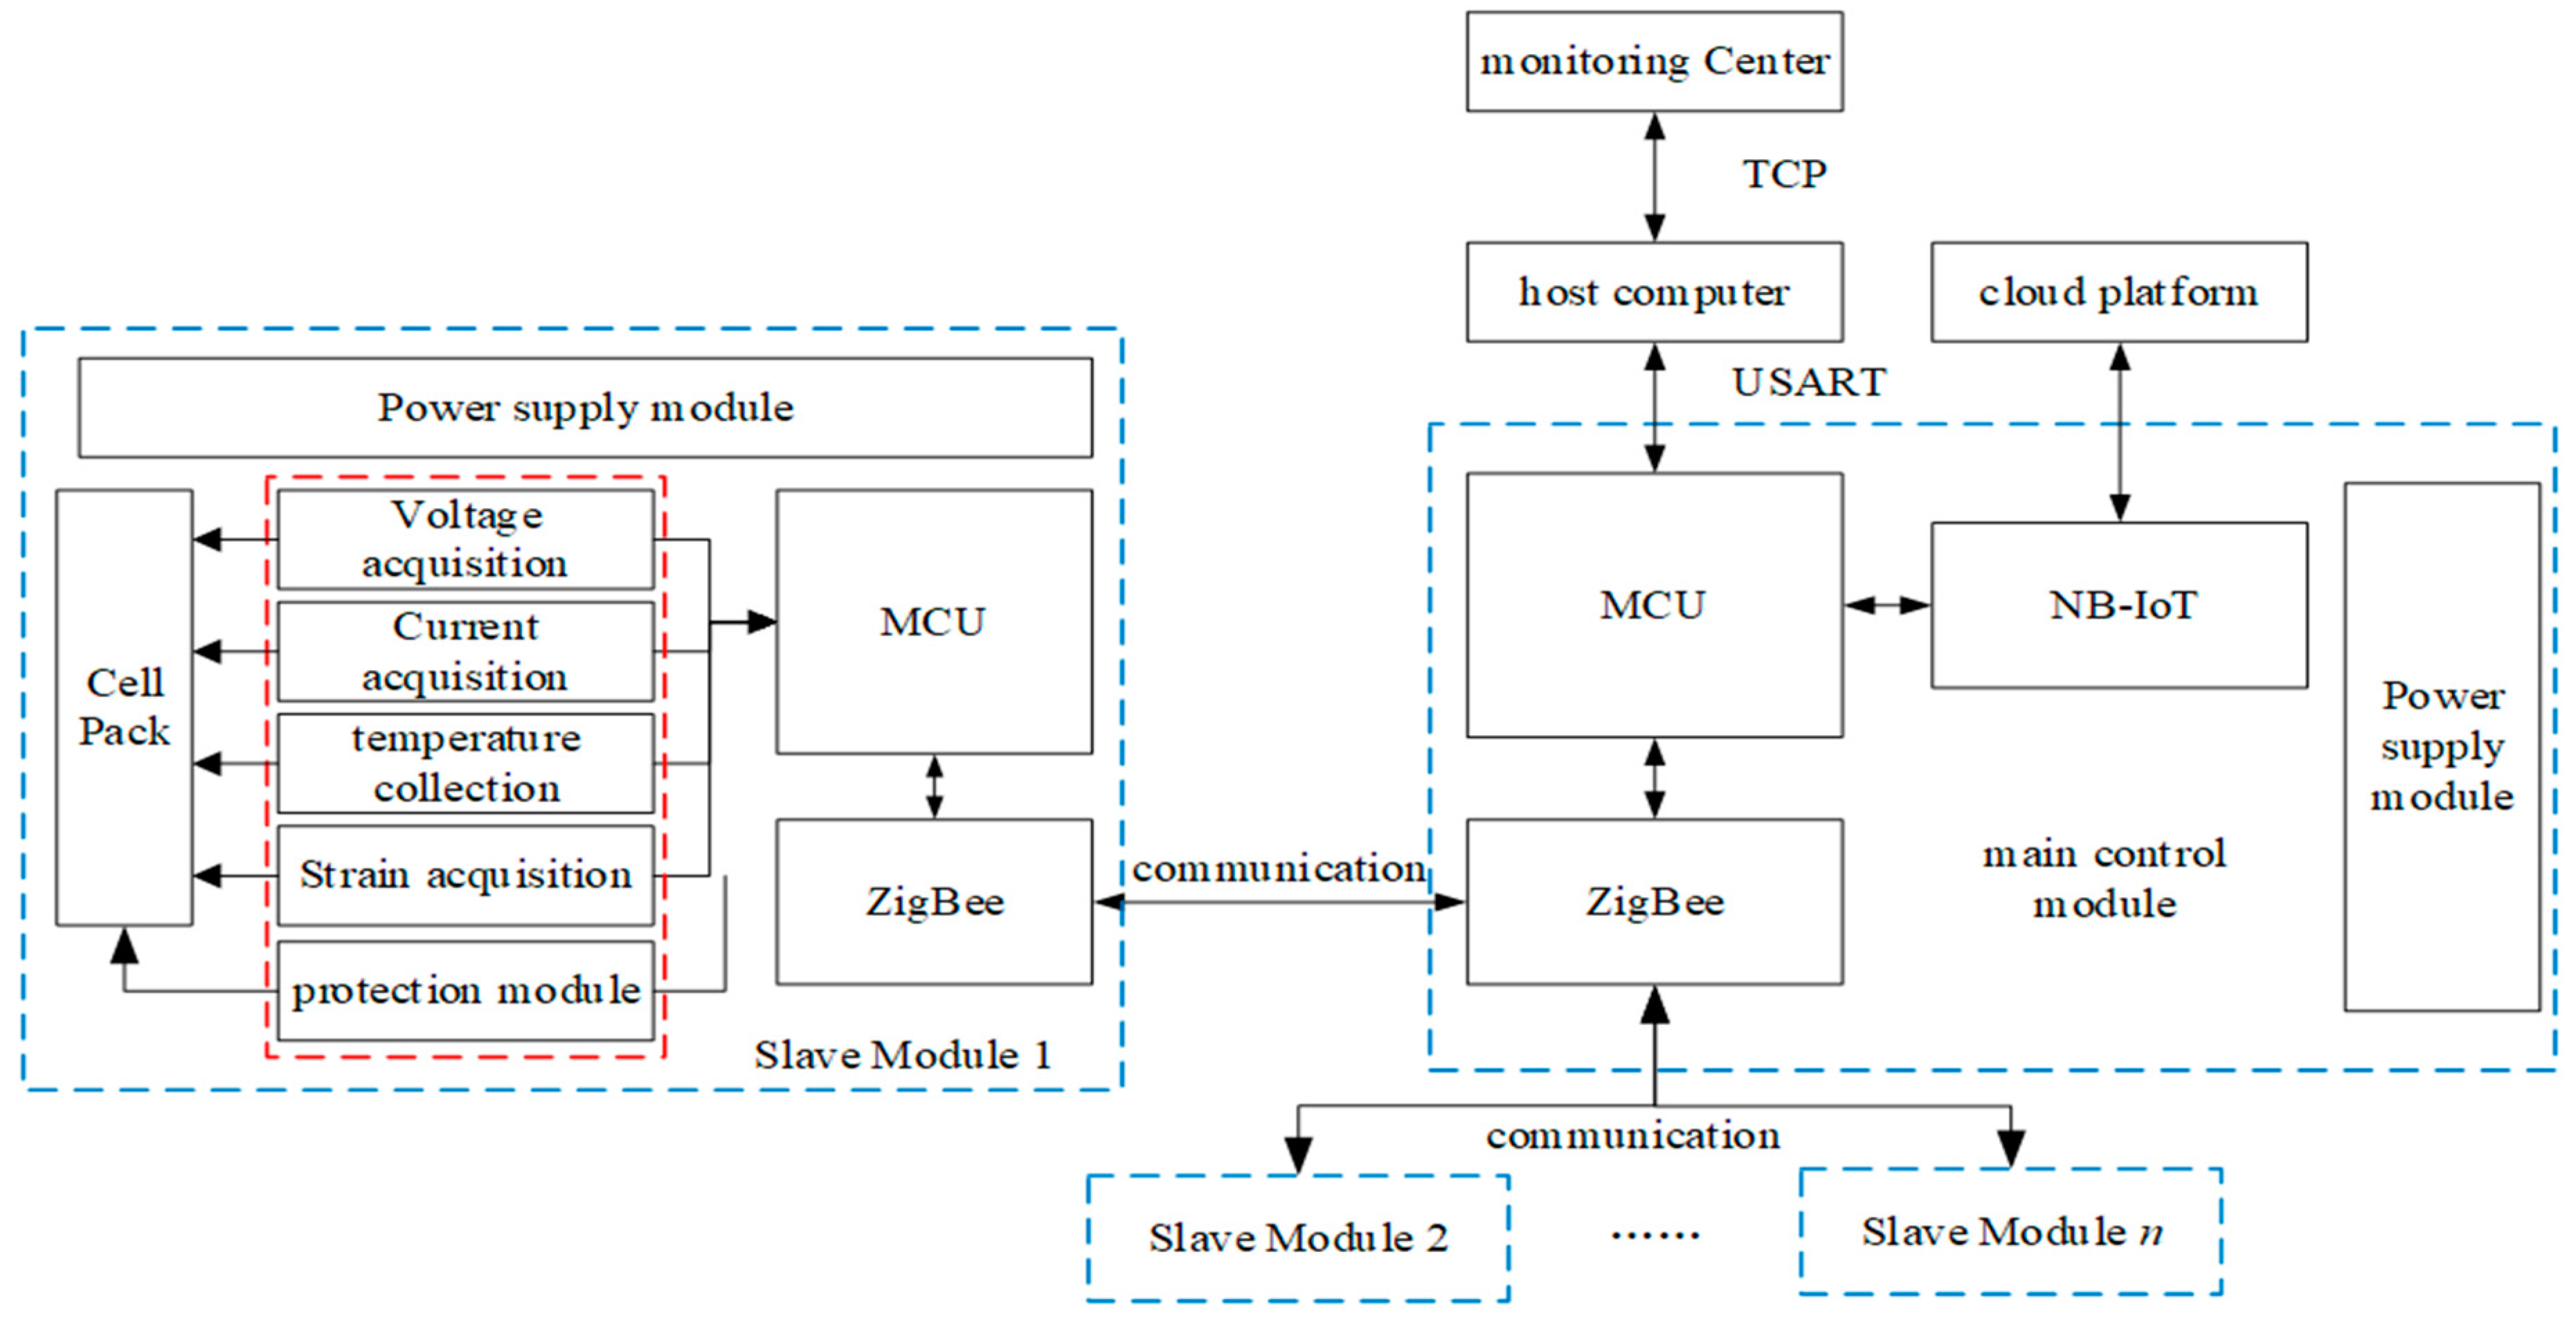
2.2. Smart Power Station Network Architecture

Figure 1 shows the architecture of an intelligent power station monitoring system based on NB-IoT-ZigBee. In this architecture, sensor terminals upload the collected data to ZigBee coordinator nodes through ZigBee end nodes [21]. In response to the need for real-time processing and thermal runaway warning, edge computing is introduced, and data are uploaded to a local host computer via a serial port, and then transmitted to a local monitoring center through a TCP connection for data processing. Data are also uploaded to the cloud platform through the NB-IoT module for global data processing and remote monitoring. When the local monitoring center is unmanned, the working status of the energy storage station can be queried through the cloud platform. The functions and actual requirements of each layer in this architecture are as follows:
Perception layer: The perception layer integrates a large number of terminal sensing modules, which have the function of data acquisition and act as the eyes and ears of the system. When designing perception modules, energy consumption needs to be considered to prevent energy supply problems. In an intelligent power station, multiple types of data need to be collected, such as the temperature, current, voltage, and strain. Each terminal sensing module needs to work for a long time and use battery power. Therefore, device power consumption needs to be controlled, and low-power MCUs should be selected as much as possible. After the sensor collects and sends information, it should enter the sleep state as soon as possible.
Transmission layer: The transmission layer is the bridge between the perception layer and the application layer, which can realize the data transmission between the perception layer and the application layer. First, the transmission layer needs to access the perception layer device and upload the collected data to the application layer. Secondly, the transmission layer needs to send commands and information from the application layer to the perception layer to ensure the reliable transmission of data and instructions. To make the transmitted information as accurate as possible, data verification methods are used to process wireless transmission data and reduce packet loss and error rates.
Application layer: Traditional application layers mainly perform calculations and storage on the cloud platform. However, there are too many battery packs and battery information in energy storage stations, which will cause network delays or excessive transmission loads. The computing power of the cloud platform cannot match the complex data volume, resulting in cloud platform computing overload. Some data in intelligent power stations require low latency, and traditional cloud computing cannot meet the requirements of intelligent power stations. Therefore, edge computing is introduced in the architecture to reduce data transmission latency and improve data processing efficiency. The introduction of edge computing has the following advantages:
  • The local monitoring center is close to the monitoring terminal, and the data transmission rate is fast, which reduces latency and is helpful for the thermal runaway warning of energy storage stations.
  • The local monitoring center can improve the security and stability of the system. The local monitoring center can receive and process the data collected by monitoring terminals, which can avoid network attacks when the data are uploaded to the cloud platform, ensuring the accuracy and reliability of data to the greatest extent [22].
  • The local monitoring center can reduce system power consumption. The local monitoring center is close to the monitoring terminal, and data transmission is fast. With strong computing power, local computing can be performed before transmitting data to the monitoring terminal to control the monitoring terminal to take corresponding actions, which can reduce both communication with the cloud platform and the power consumption of the system.

3. Modular Battery Management System

The lithium-ion battery monitoring system proposed in this study consists of subordinate modules, main control modules, and host computers. The subordinate module mainly consists of the MCU, temperature measurement module, current measurement module, voltage measurement module, strain measurement module, ZigBee module, power supply module, and protection module. The main control module consists of the MCU, ZigBee module, and NB-IoT module. The host computer module consists of a local host computer, a local monitoring center, and a cloud platform. The system architecture diagram is shown in Figure 2.
During the course of this study, the batteries used for testing were 18650 batteries manufactured by a company called Jiaozuo DFD. These batteries have a rated voltage of 3.7 V and a rated capacity of 2000 mAh. The maximum charging current is 2 A, and the maximum discharging current is 6 A. The physical appearance of the battery is depicted in Figure 3.

3.1. Hardware Design

3.1.1. Subordinate MCU Module

The subordinate MCU module is responsible for collecting the operational information of the battery pack and calculating the battery’s State of Charge (SOC). Based on the collected information, it determines if the battery is experiencing issues such as overcharging, overdischarging, or overheating. In the event of an abnormal situation, it disconnects the external circuit of the battery pack to ensure its safety. When no abnormal conditions are detected, it uploads the collected information to the main control module through the ZigBee module. Simultaneously, it receives instructions from the main control module and executes relevant operations.

3.1.2. Temperature Measurement Module

The temperature measurement module consists of a K-type thermocouple and MAX6675 chip. As the temperature changes, the thermocouple’s end generates a slight voltage variation. By utilizing relevant circuits or chips, the voltage value can be converted into the measured temperature of the object. Due to the K-type thermocouple’s accuracy of ±1 °C, to achieve precise temperature acquisition, this study applies a filtering process. It collects 11 temperature values, removes the minimum and maximum values, and calculates the average of the remaining 9 temperature values as the final temperature value. The specific process is illustrated in Figure 4.

3.1.3. Current Measurement Module

The current measurement module consists primarily of ACS712 and related circuits. To ensure accurate current acquisition, the AD580 is utilized to provide a reference voltage for ACS712. During operation, the current information is transmitted to the MCU. The current acquisition circuit and the AD584 circuit are shown in Figure 5.

3.1.4. Voltage Measurement Module

To rapidly and accurately measure the terminal voltage of lithium-ion batteries, this study employs the DS2438 chip as the voltage acquisition chip. DS2438 utilizes a single-wire communication method, enabling data transmission through a single data line. Each DS2438 is assigned a unique serial number, allowing communication by reading the chip’s serial number when multiple DS2438 devices are connected to a single bus.

3.1.5. Strain Measurement Module

To monitor the deformations of lithium-ion batteries, such as swelling, a strain circuit is employed to monitor real-time deformation information on the battery’s surface. Resistive strain gauges are commonly used in strain acquisition circuits. However, the voltage changes caused by the resistance variations of the strain gauges are relatively weak and cannot be directly captured by the microcontroller. Therefore, it is necessary to amplify the output voltage of the Wheatstone bridge by a certain factor to improve the accuracy of the strain acquisition circuit.

3.1.6. Protection Module

The protection module controls MOSFETs. When the lithium-ion battery experiences adverse conditions such as overcharging, overdischarging, overheating, or swelling, the subordinate module reacts by shutting off the MOSFETs, disconnecting the battery module from the circuit to prevent more severe faults.

3.1.7. ZigBee Communication Module

In the energy storage system, lithium-ion batteries are centrally placed in energy storage boxes, which are relatively concentrated and made of metal. ZigBee network signals have difficulty penetrating these energy storage boxes. Based on the distribution characteristics of lithium-ion batteries in the energy storage system, a star network structure is chosen as the network structure for this system. The star network structure consists of only two types of devices: coordinators (FFD) and end devices (RFD). The end devices are located at the bottom layer of the ZigBee communication network and mainly handle the transmission of collected parameters. The coordinator node is positioned at the top layer of the ZigBee communication network, where the information collected by the end devices is aggregated. Finally, the information is sent to the local host computer and cloud platform via a serial port and NB-IoT.

3.1.8. Main Control MCU Module

The main control MCU module plays a role in data reception, integration, and transmission. It acts as the brain of the entire system and can communicate with one or more subordinate modules, receiving uploaded data and issuing instructions to the host computer.

3.1.9. NB-IoT Module

The NB-IoT module facilitates communication between the main control module and the cloud platform. The MODBUS protocol is employed for information transmission to ensure the accuracy of data transfer.

3.1.10. Local Host Computer

The local host computer communicates with the main control module via a serial port. Utilizing LabVIEW, the host computer builds a user interface to analyze and adjust the battery modules in the energy storage box, ensuring optimal operation.

3.1.11. Local Monitoring Center

The local monitoring center communicates with the local host computer via TCP. To ensure data accuracy, a verification function is included during data transmission. Utilizing LabVIEW, the monitoring center builds a user interface to analyze and adjust the battery modules in the entire energy storage station, ensuring optimal operation. In this design, the local monitoring center serves only for monitoring purposes.

3.1.12. Cloud Platform

The cloud platform consolidates battery information from all the energy storage stations in a specific area, enabling control and ensuring power supply and economic efficiency within the region. In this design, the cloud platform serves only for monitoring purposes.

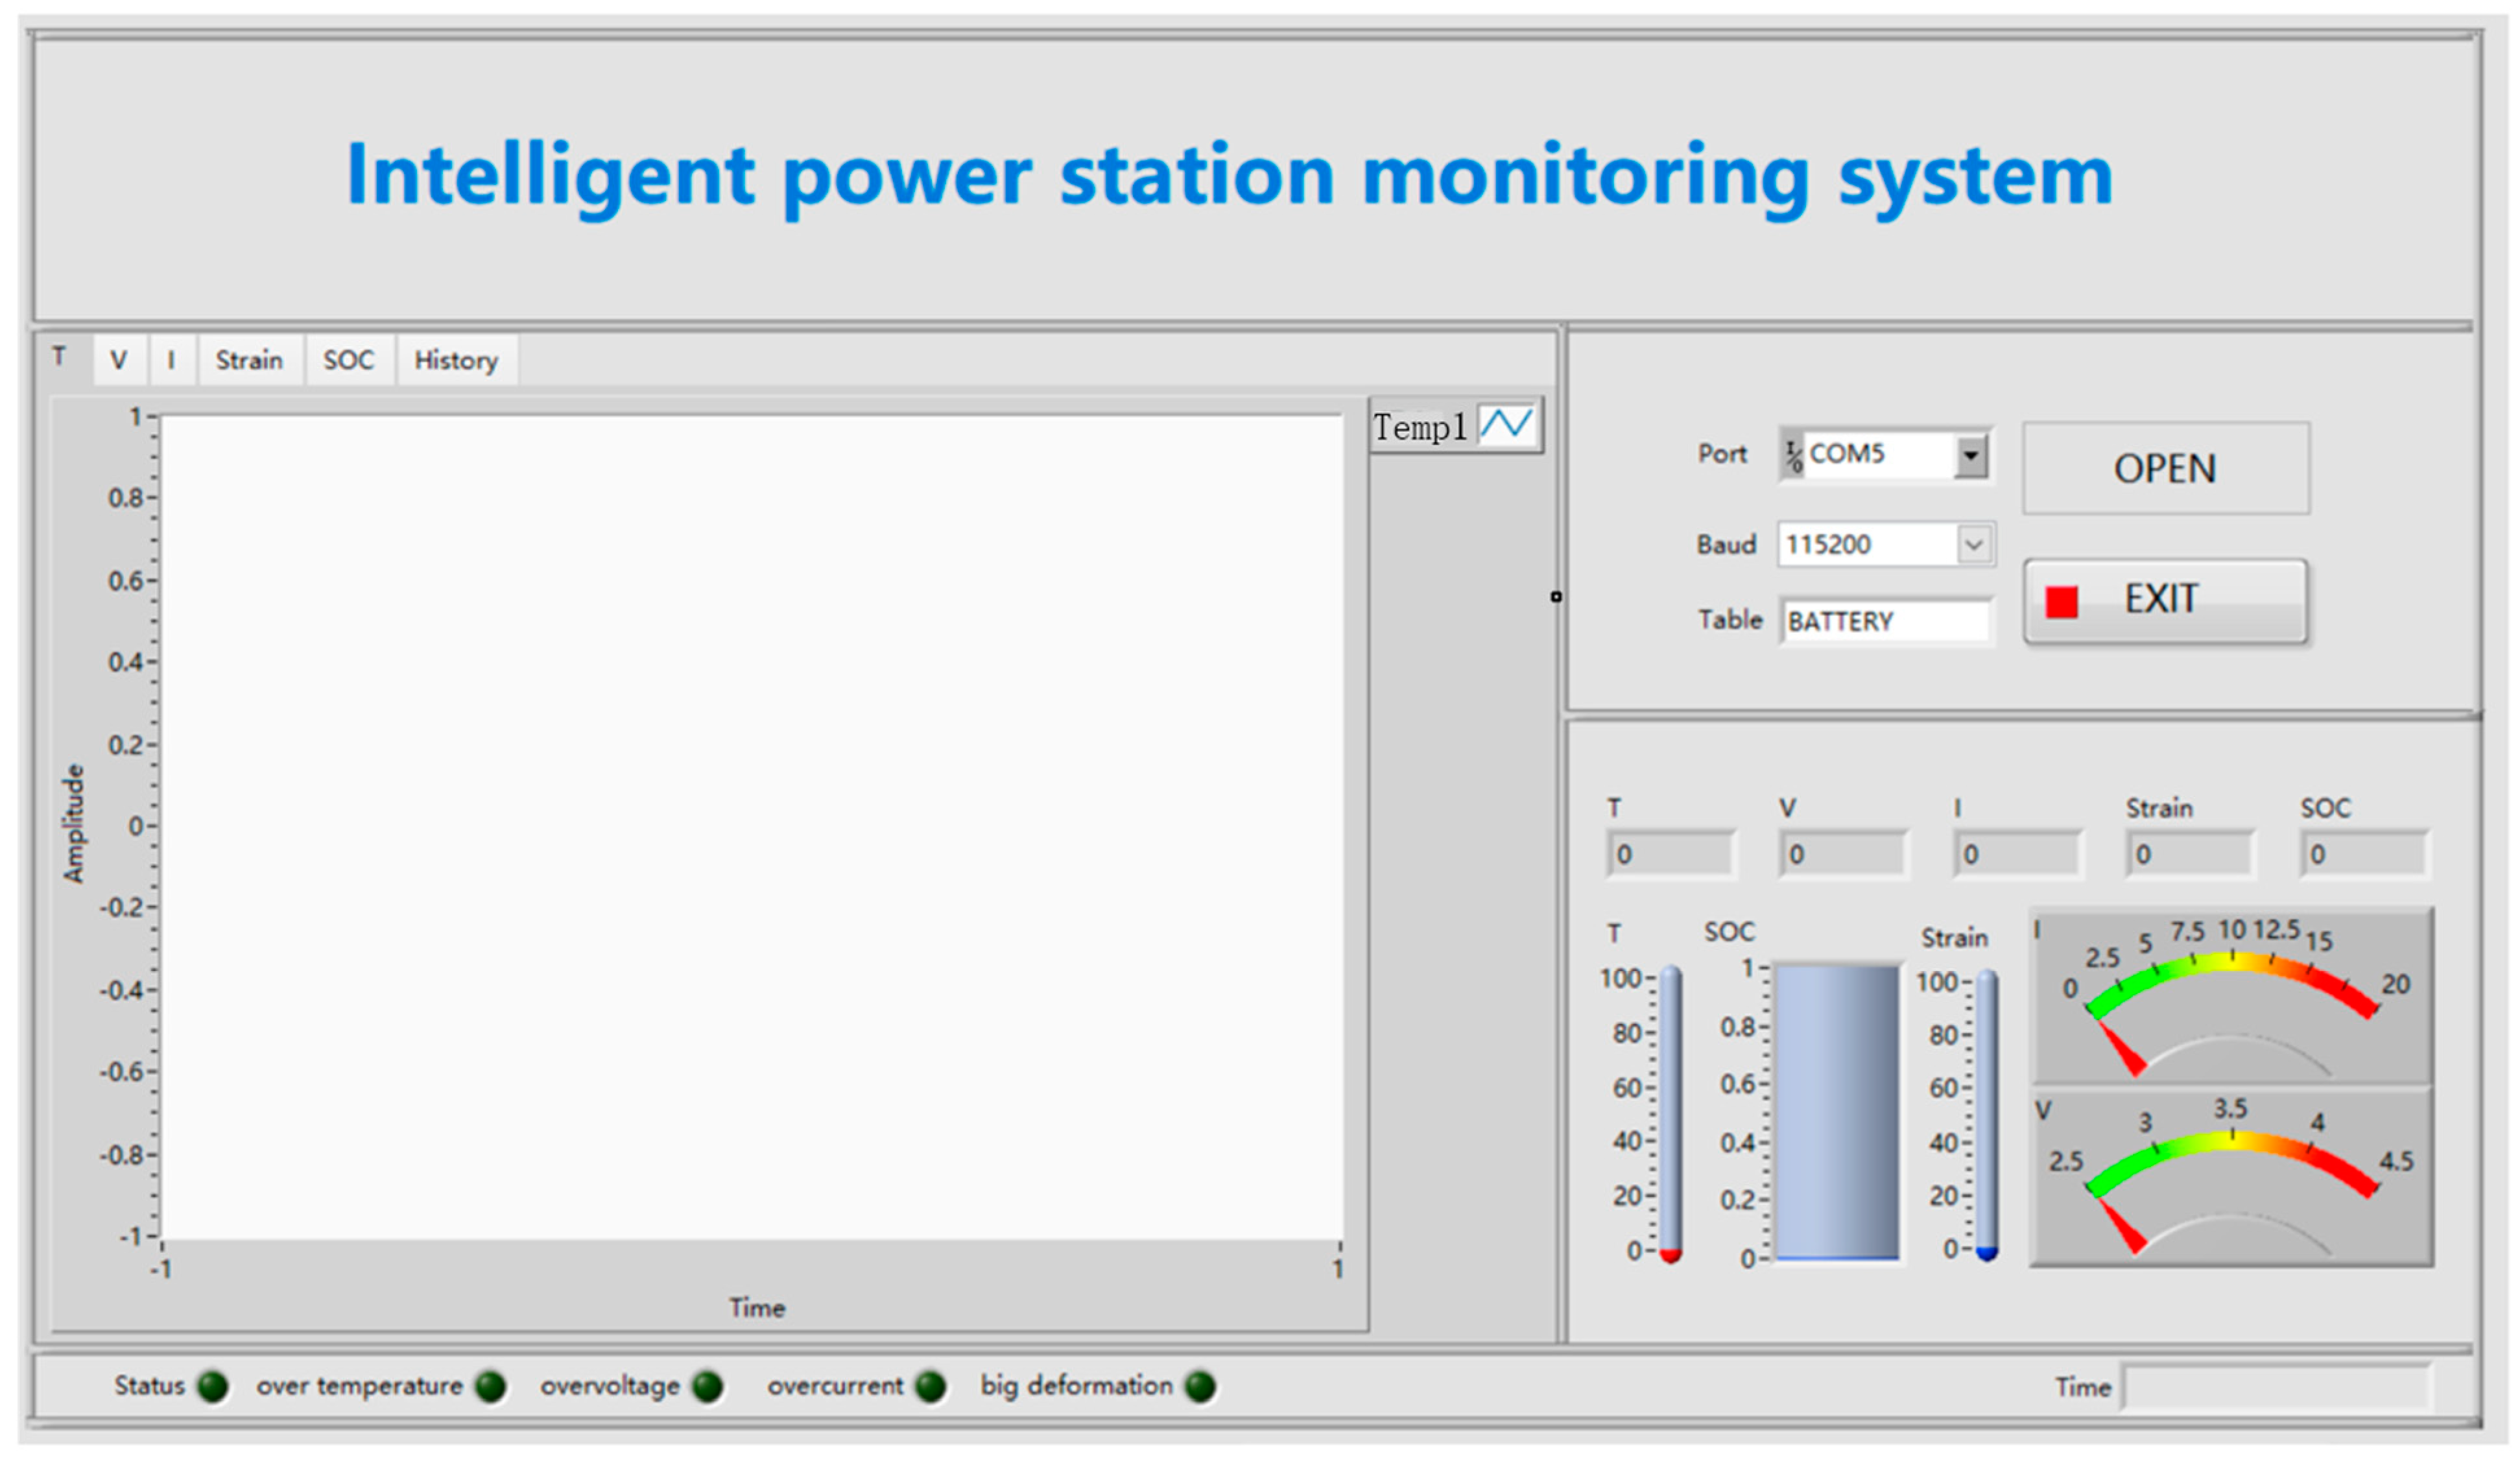
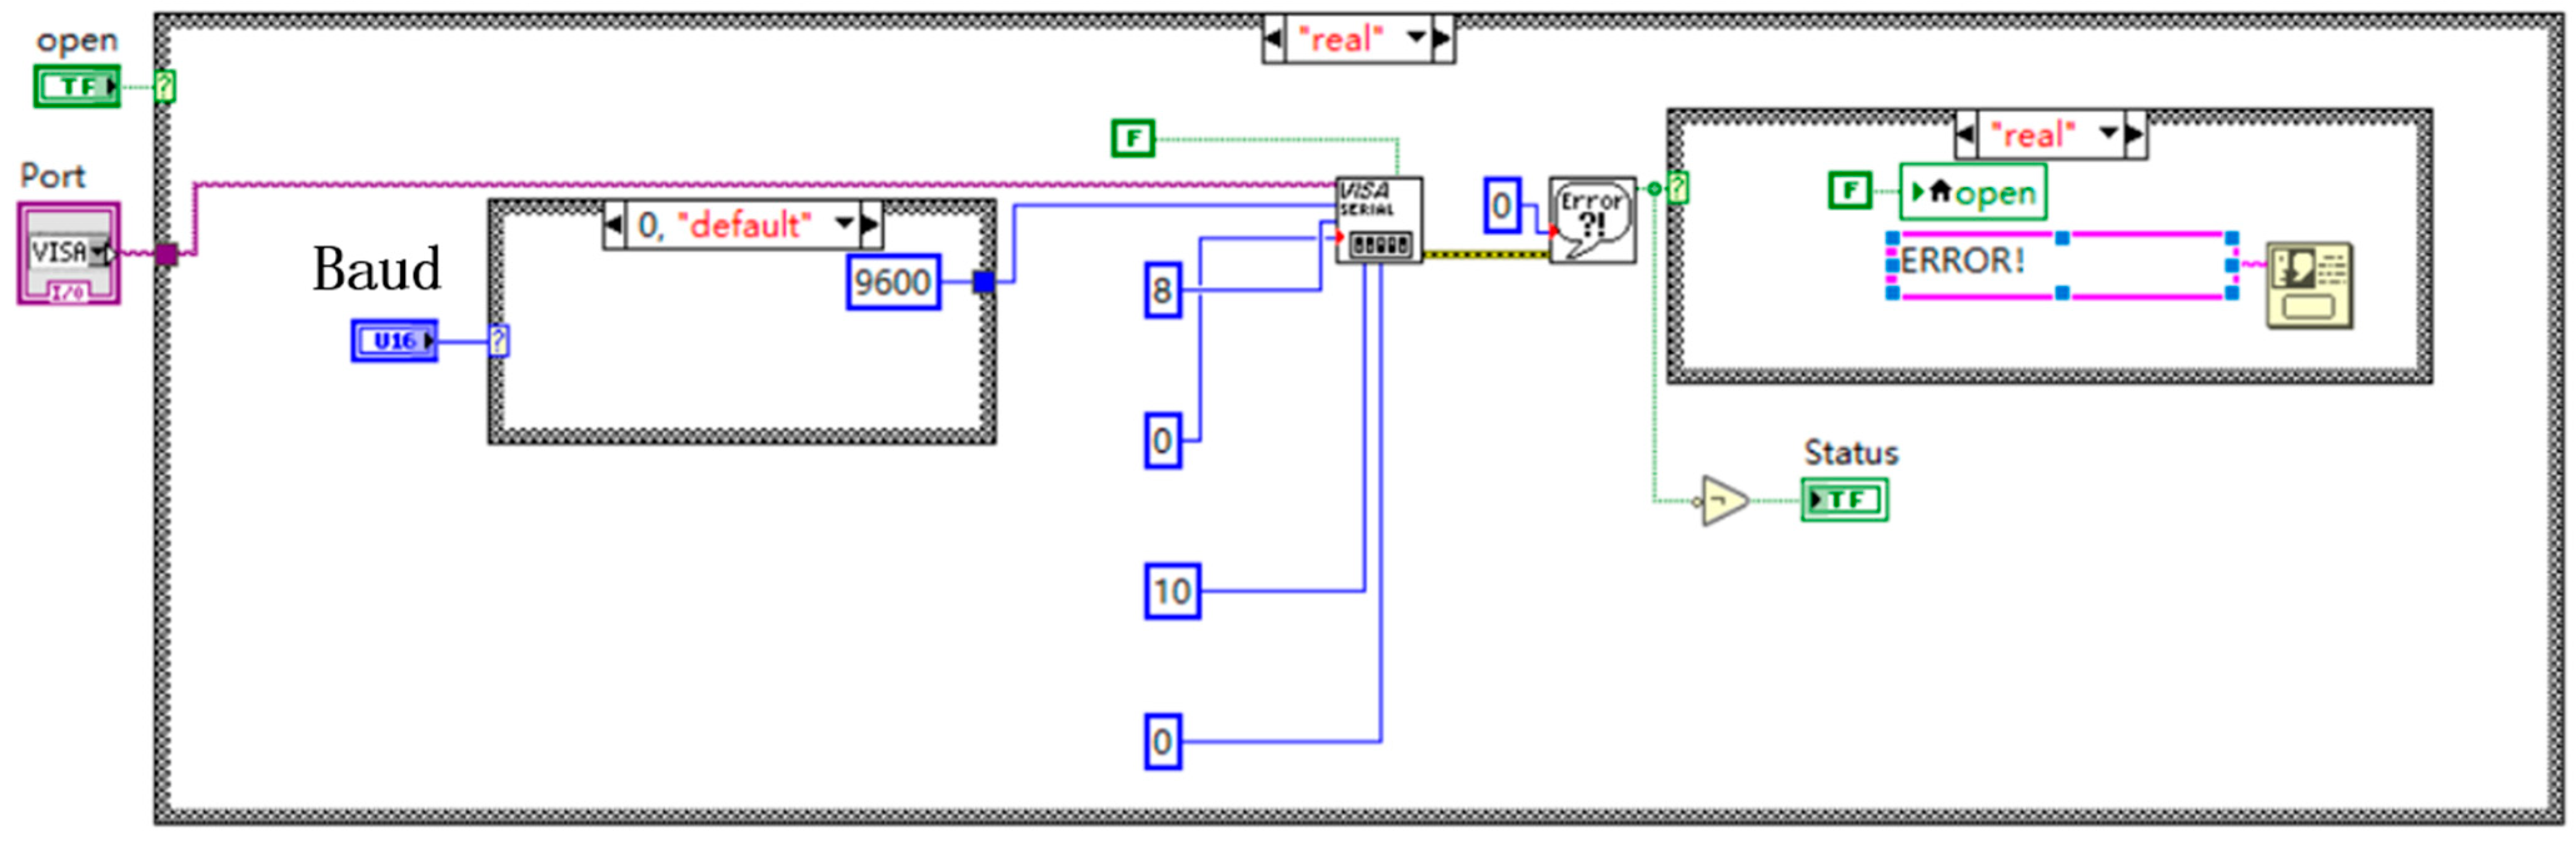
3.2. Software Design

The local host computer and local monitoring center of this system will utilize LabVIEW to build an online visualization monitoring platform. It will enable functions such as data reception, storage, visualization, threshold alerts, remote communication, data fitting, and data querying. The monitoring platform interface is depicted in Figure 6, which is similar to the interface of the local monitoring center and local host computer.

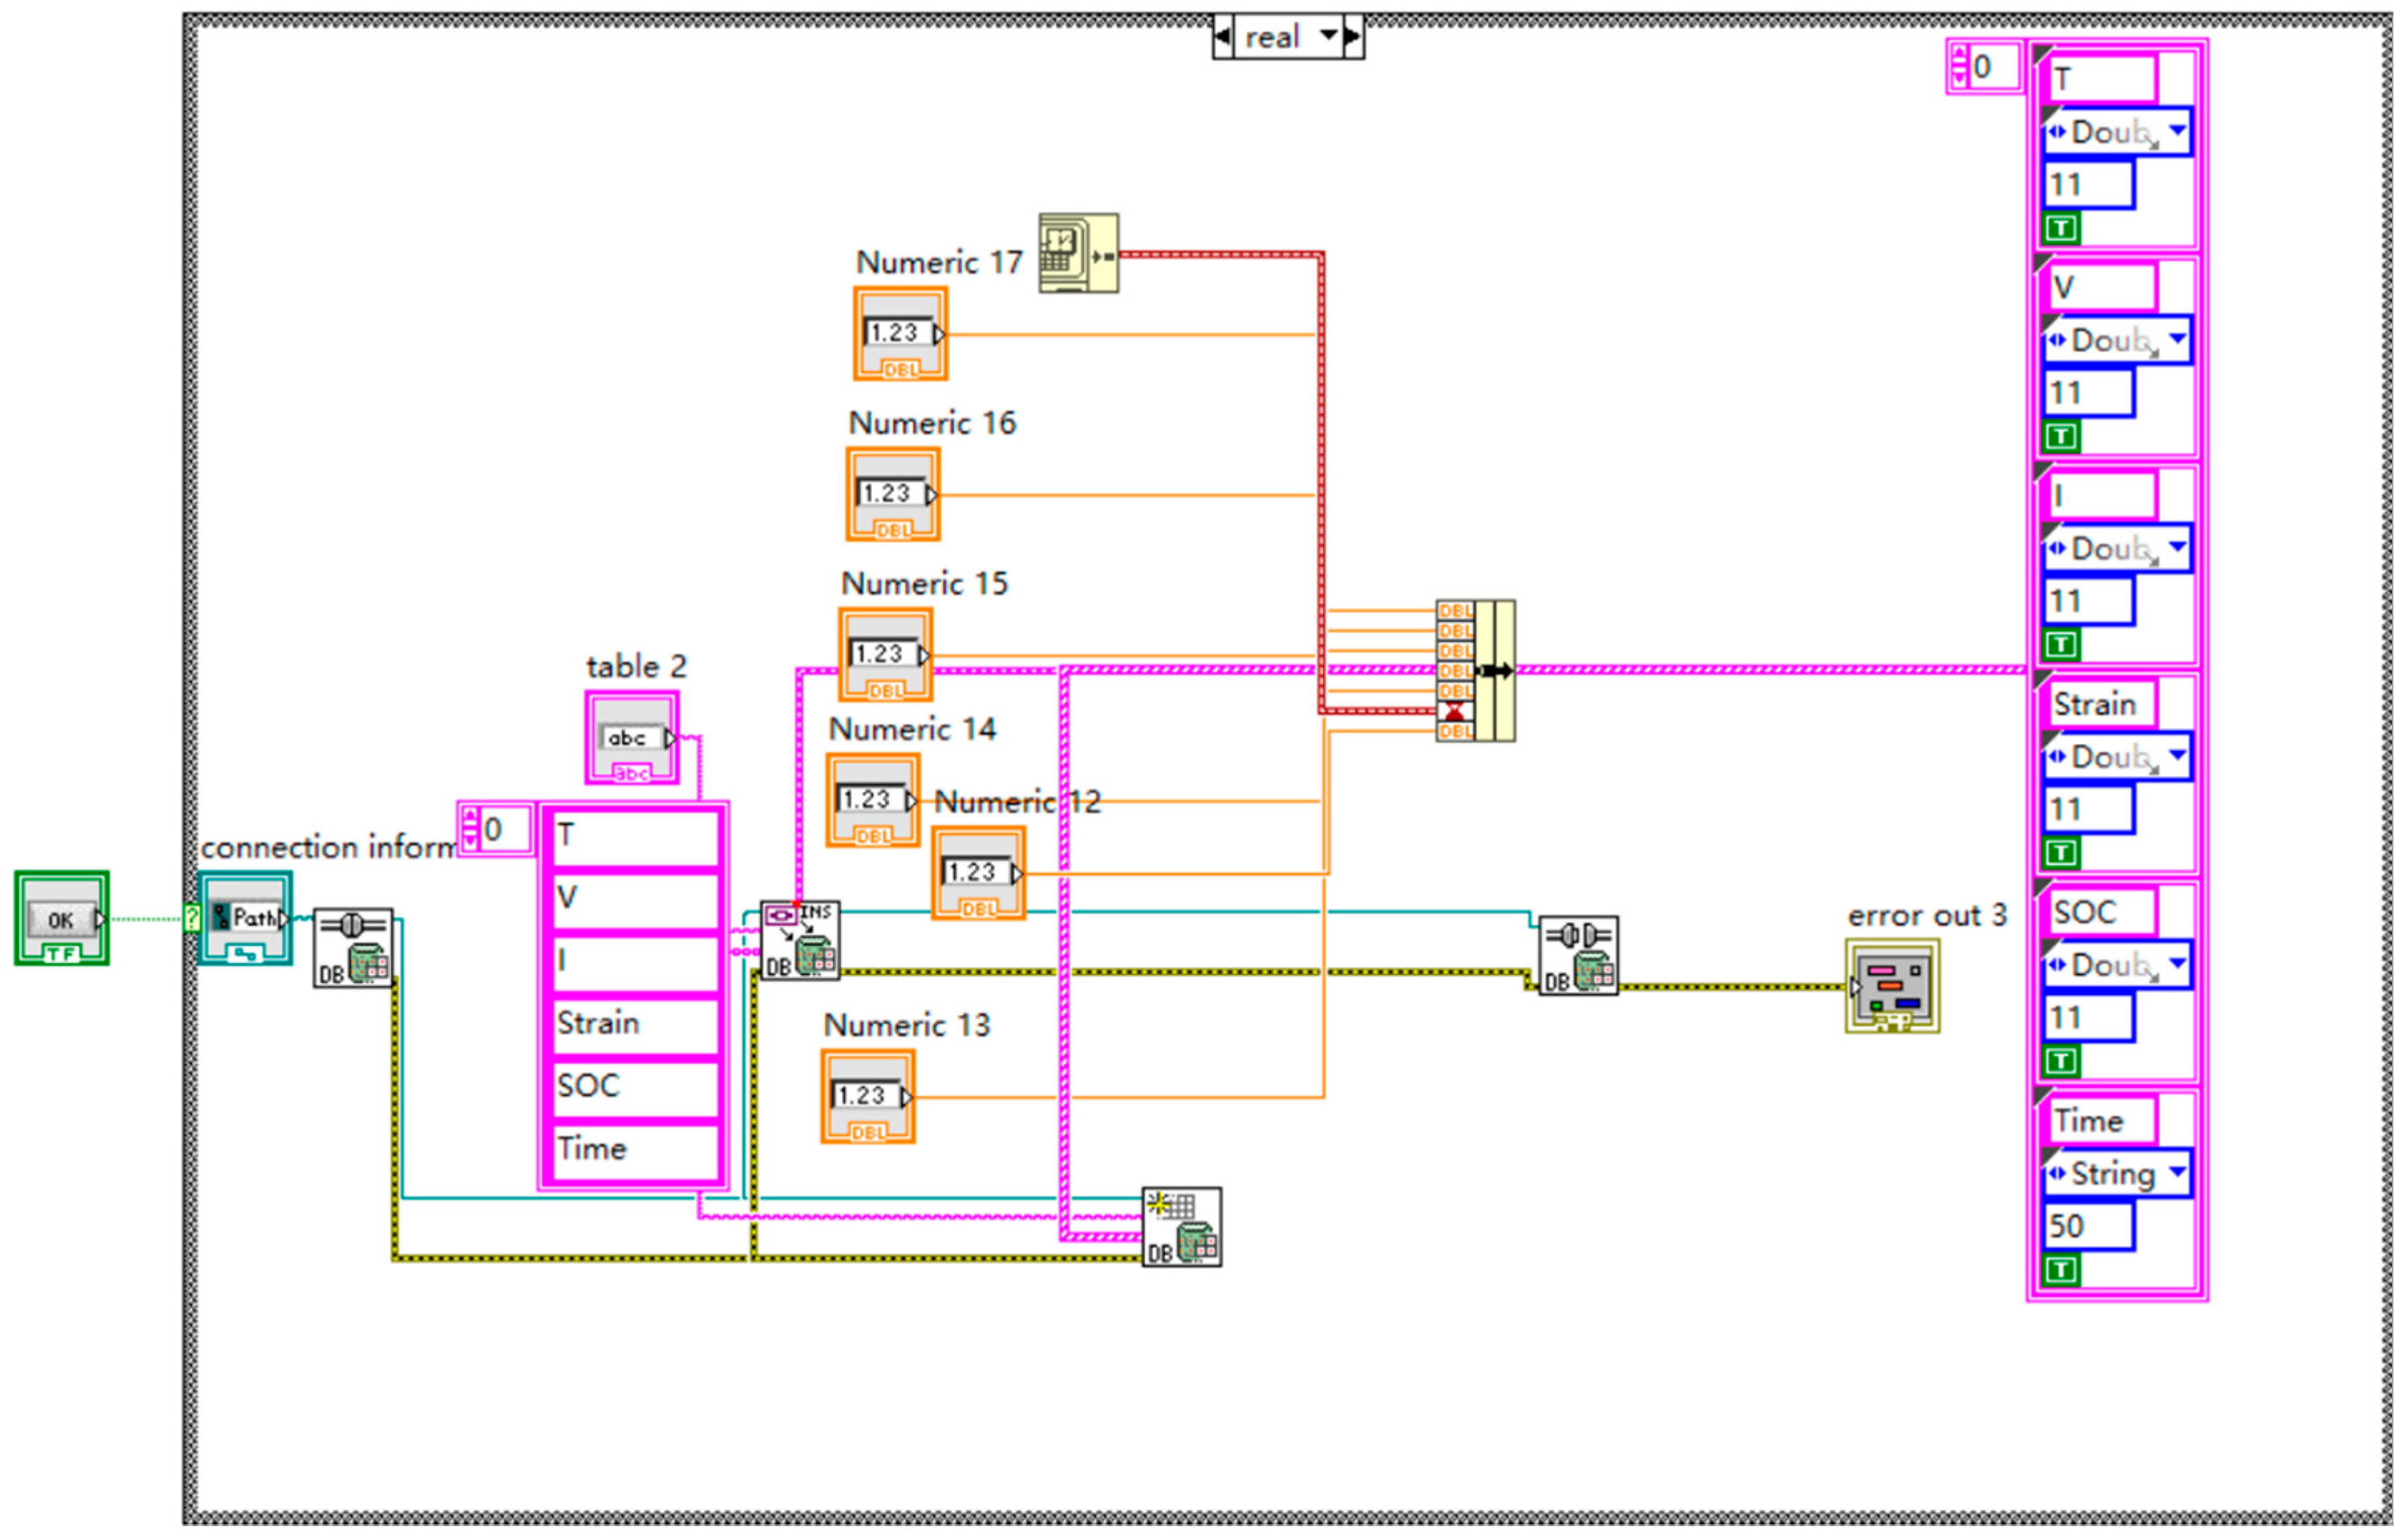
3.2.1. Data Reception

The local host computer is connected to the main control module via a serial port. First, the serial port parameters need to be configured based on the main control module’s serial port settings, as shown in Figure 7. By configuring the serial port number, baud rate, data bits, parity bits, stop bits, and control bits, the serial port is initialized. Then, the serial port is opened to receive battery information from the main control module, enabling the reception of parameters such as the battery temperature, current, voltage, and strain. The received data are first stored in the main program queue, and the data in the queue are transmitted to the data visualization module. Simultaneously, the data are also transmitted to the local monitoring center through TCP.

3.2.2. Data Visualization

As shown in Figure 8, in the data visualization module, the data stored in the main program queue are first extracted according to the data format. Then, the data are transmitted to the display control component to be presented graphically. The monitoring system can also store the data in a local database, as shown in Figure 9. Before running the monitoring system, the user inputs the name of the storage table. During system operation, a table with the specified name will be created in the ACCESS database, and the data will be stored in that table. During operation, if the battery parameters exceed the defined safety threshold, a bool switch will be triggered, and an alarm signal will be generated.

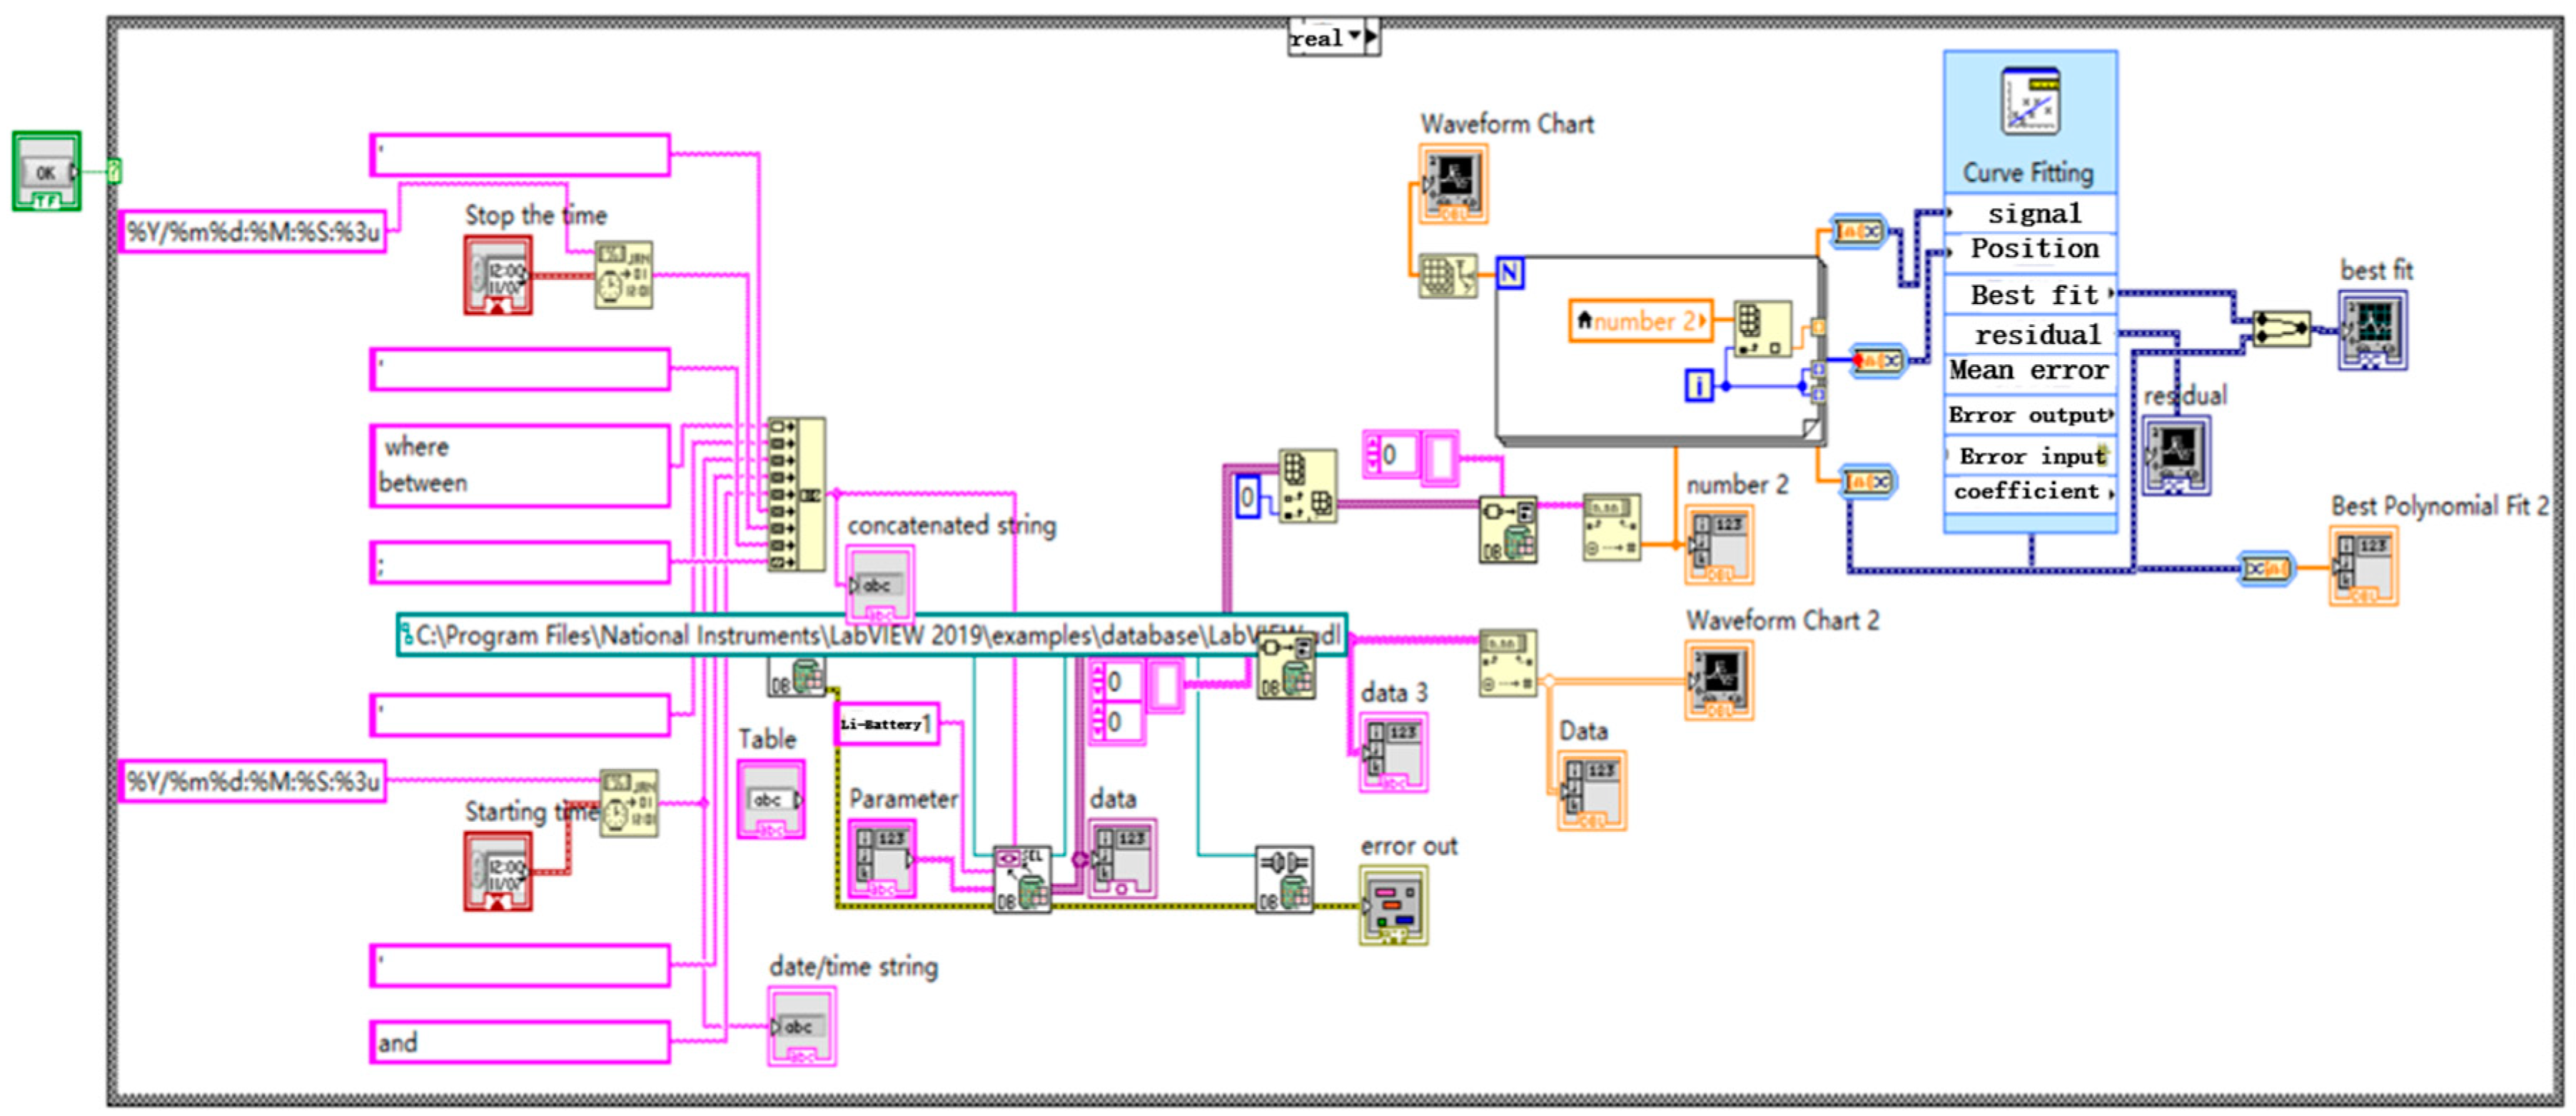
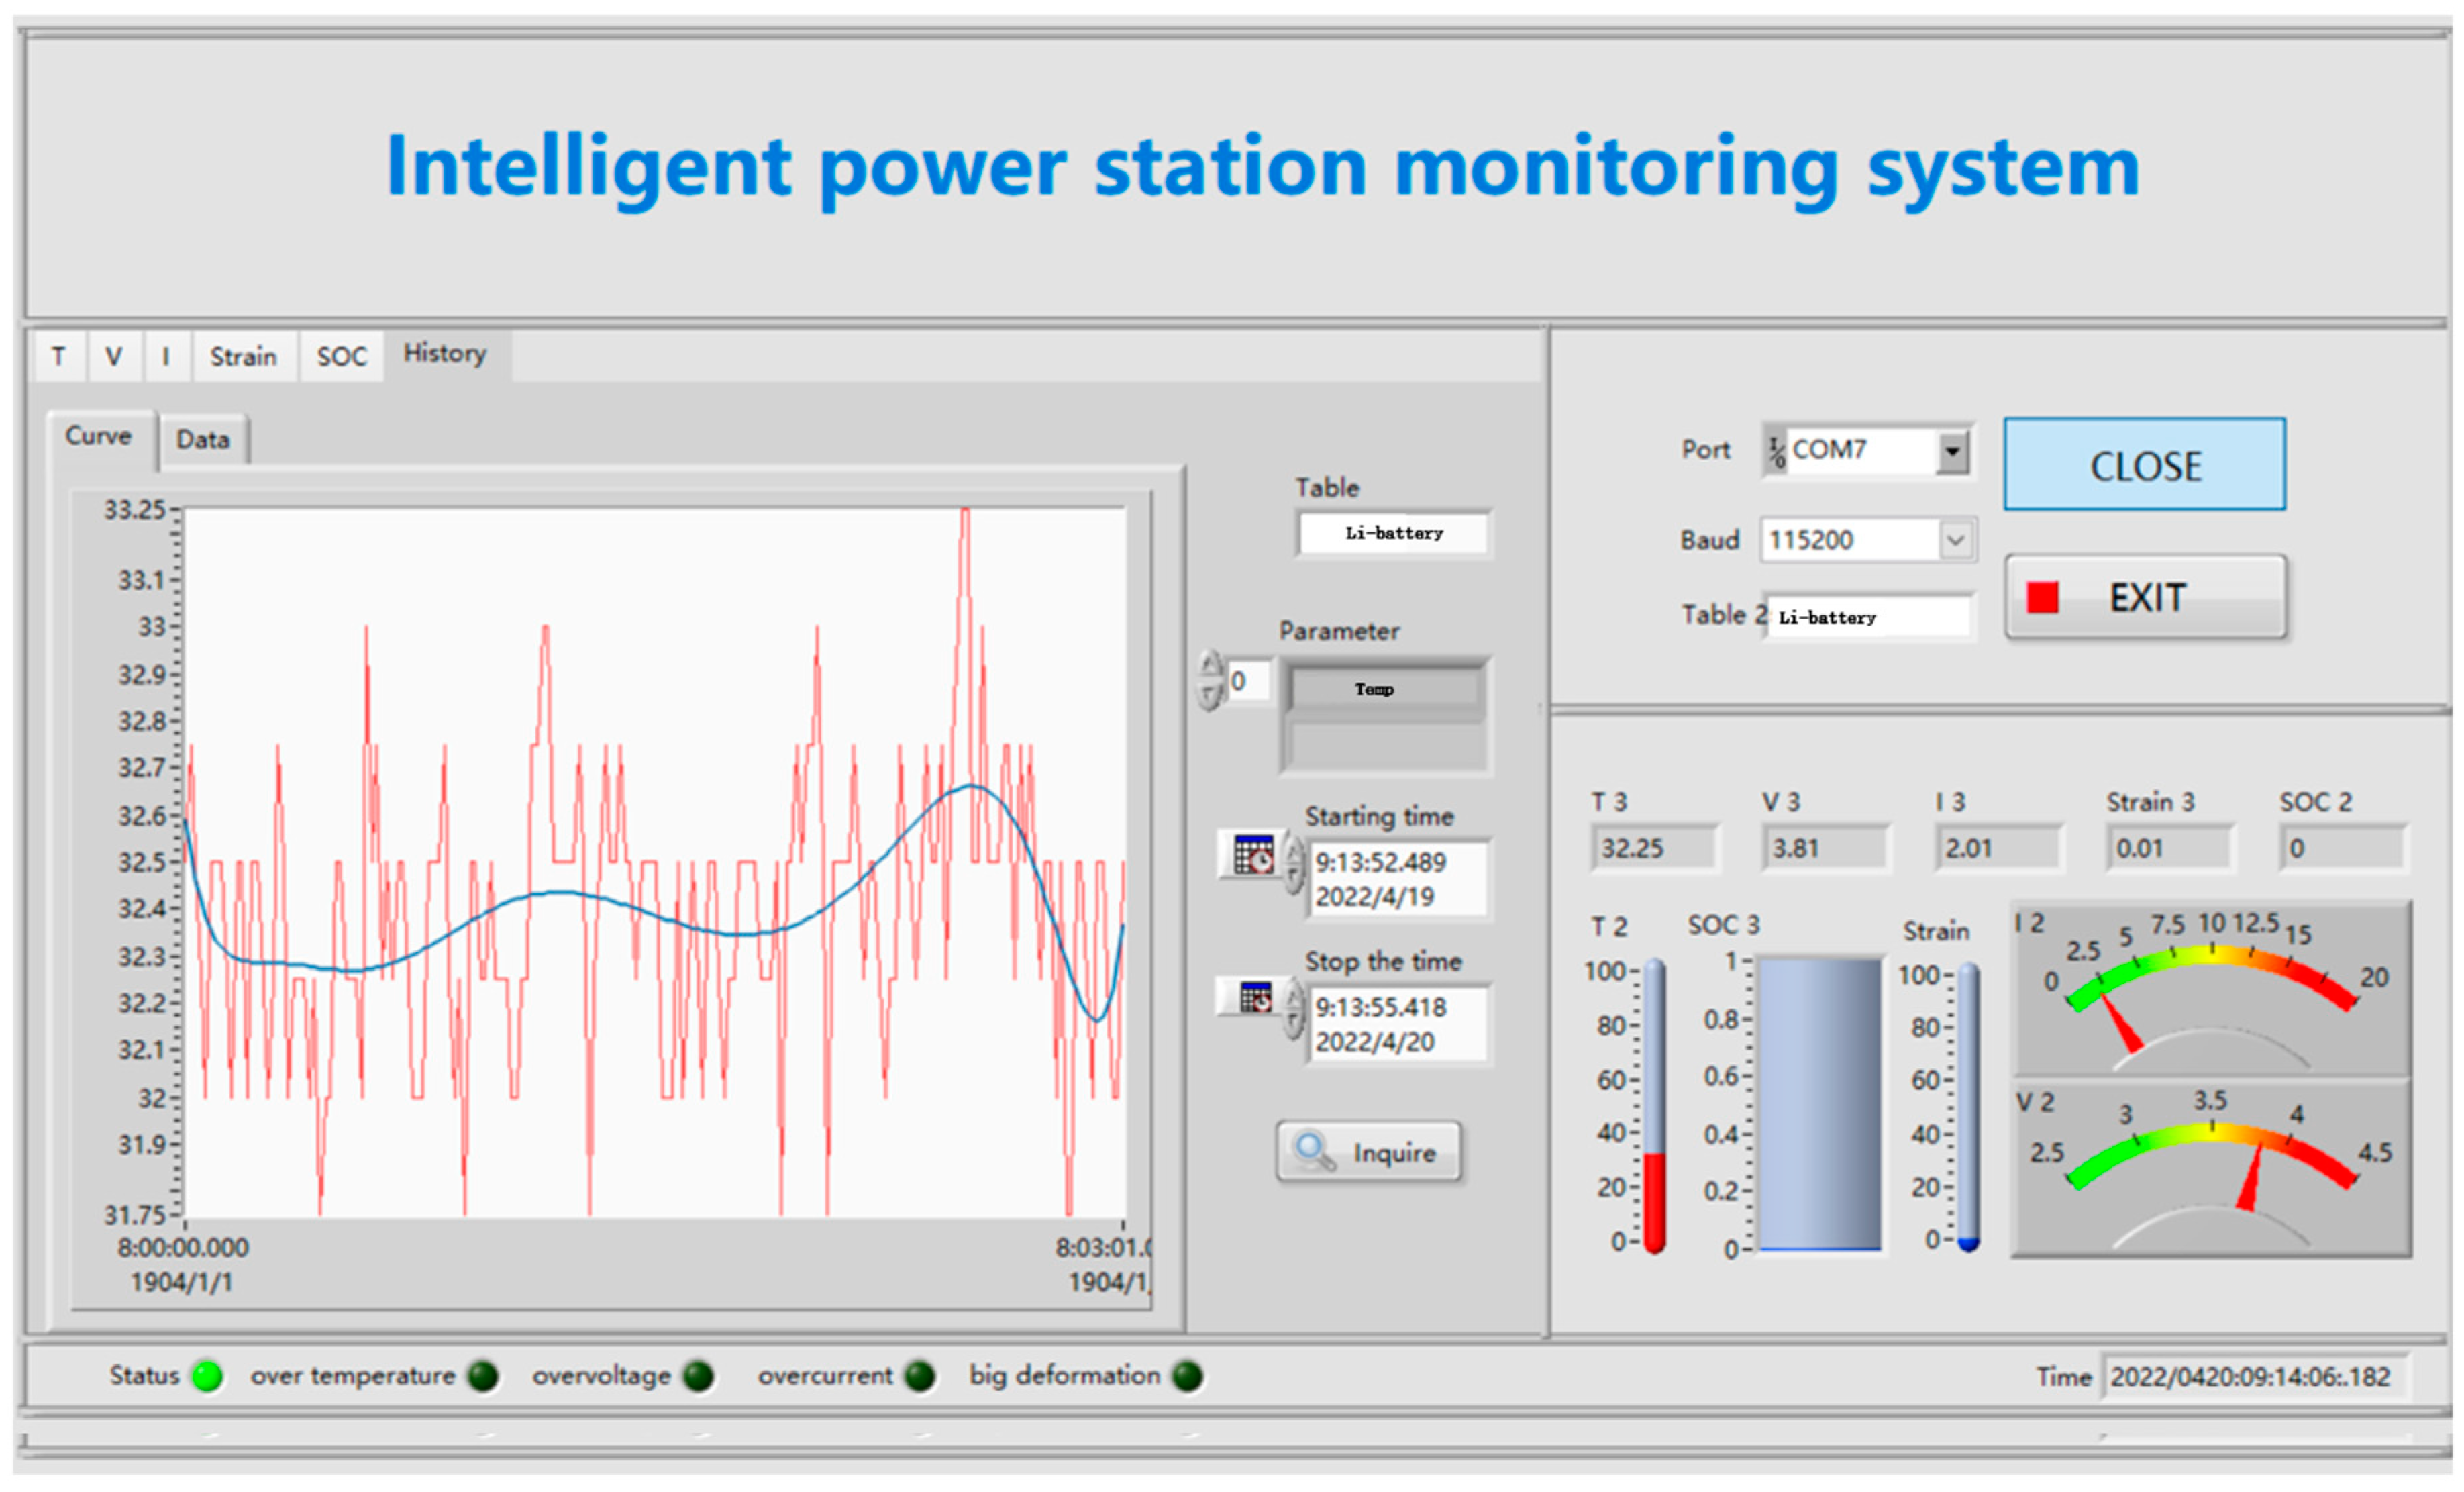
3.2.3. Data Query and Fitting

The data query module allows for the retrieval of historical monitoring data, as shown in Figure 10. To begin a data query, the user first selects the name of the storage table and then chooses the desired parameters to be queried. Next, the user selects the specific time range for the query, which will provide the required parameter data. After the query, the data can also be subjected to fitting analysis. The data query and fitting facilitate parameter analysis, enable data comparison among different operators, and help to identify patterns of change before the occurrence of faults. This information can be used to determine the safe operating range of the batteries based on parameter thresholds.

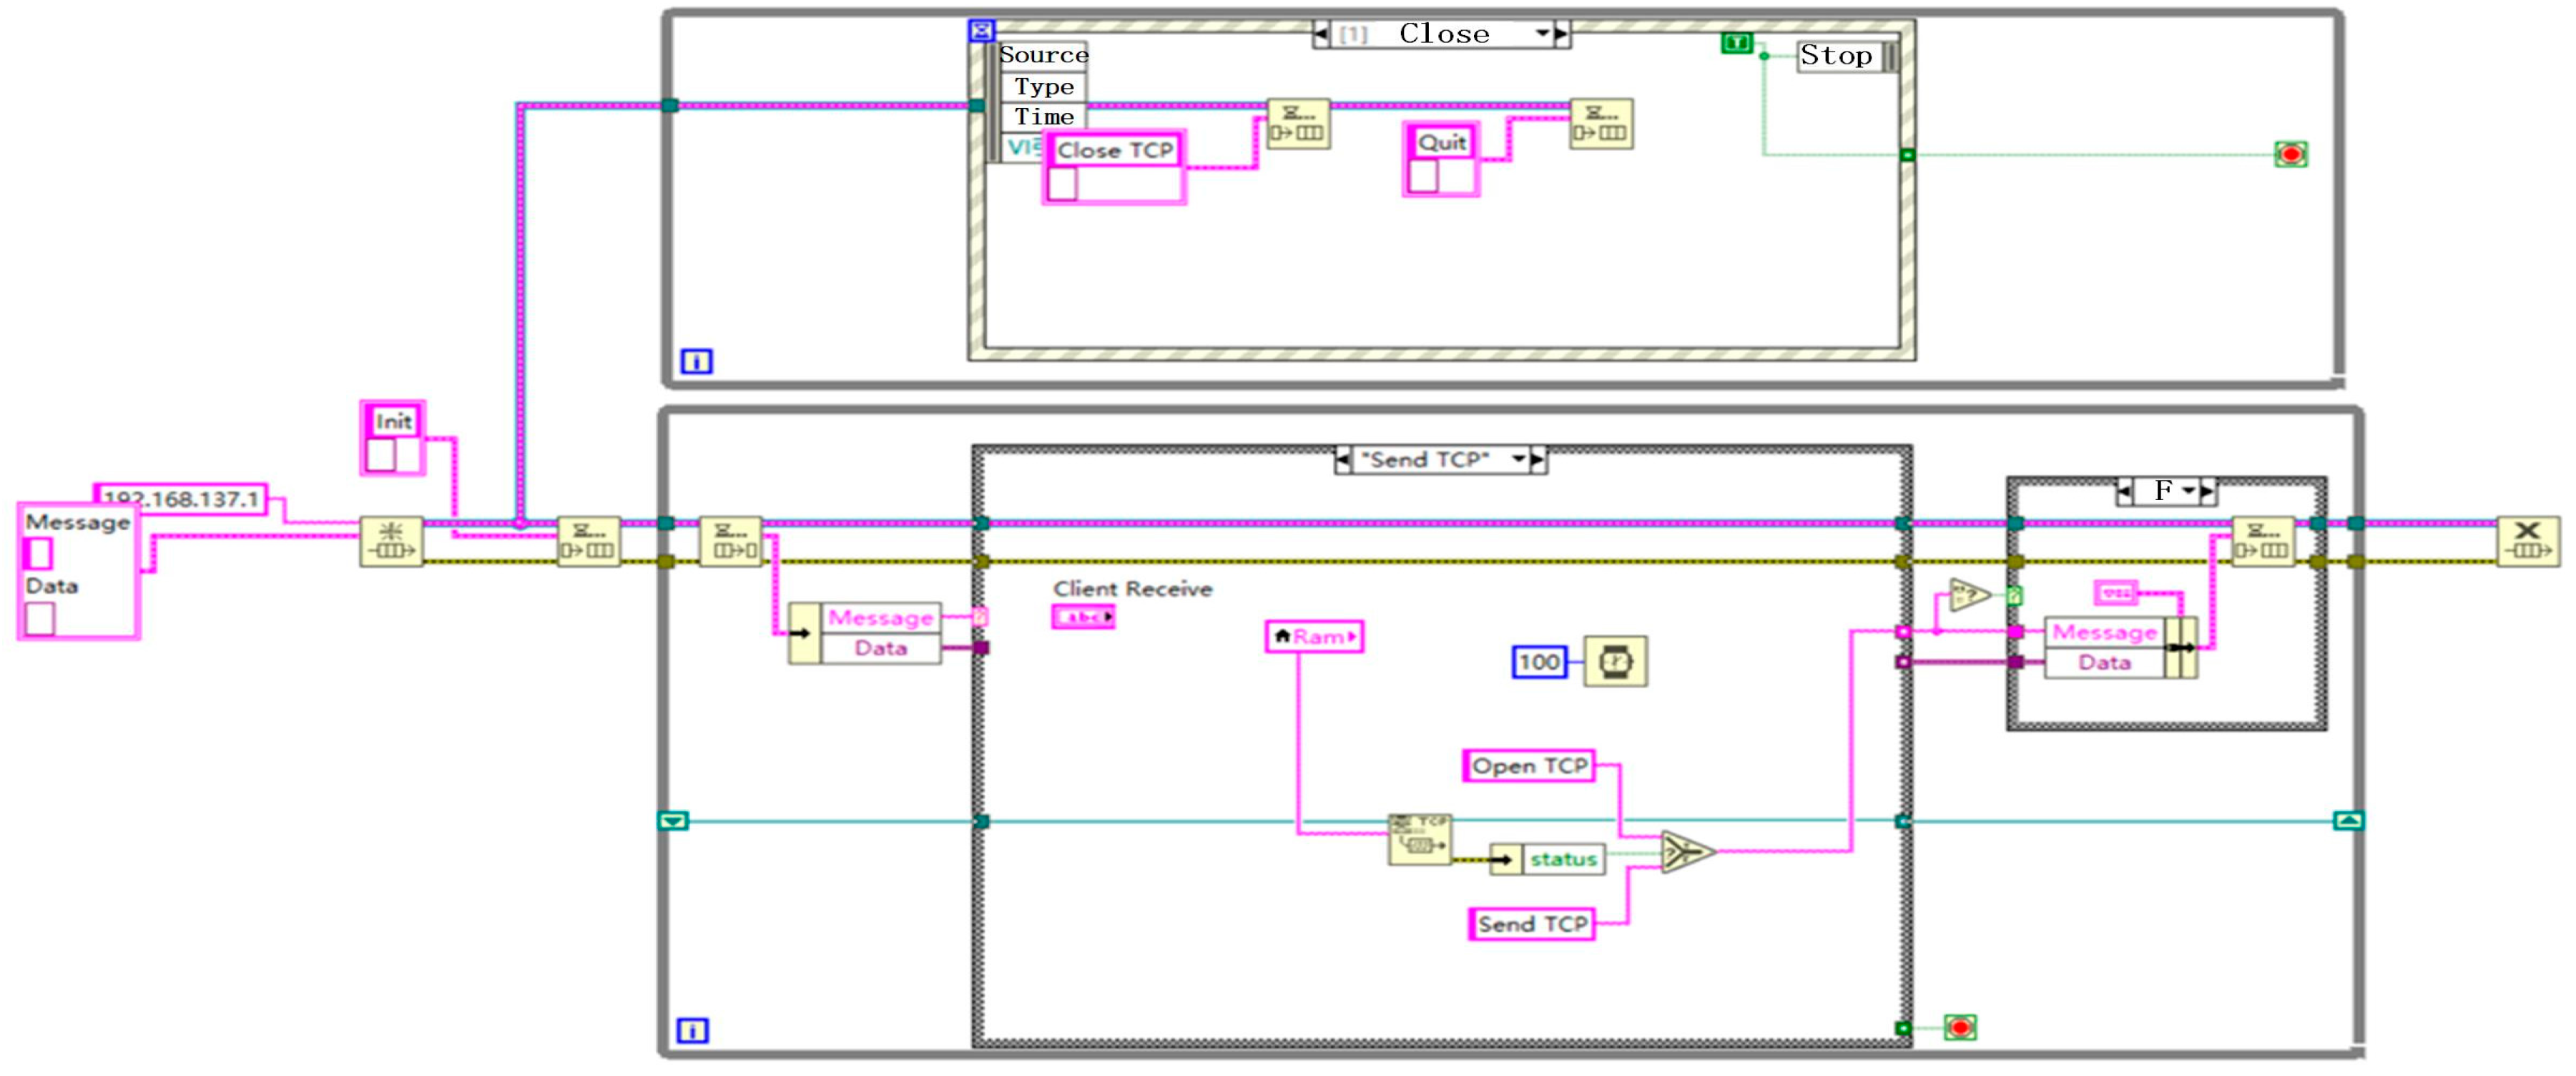
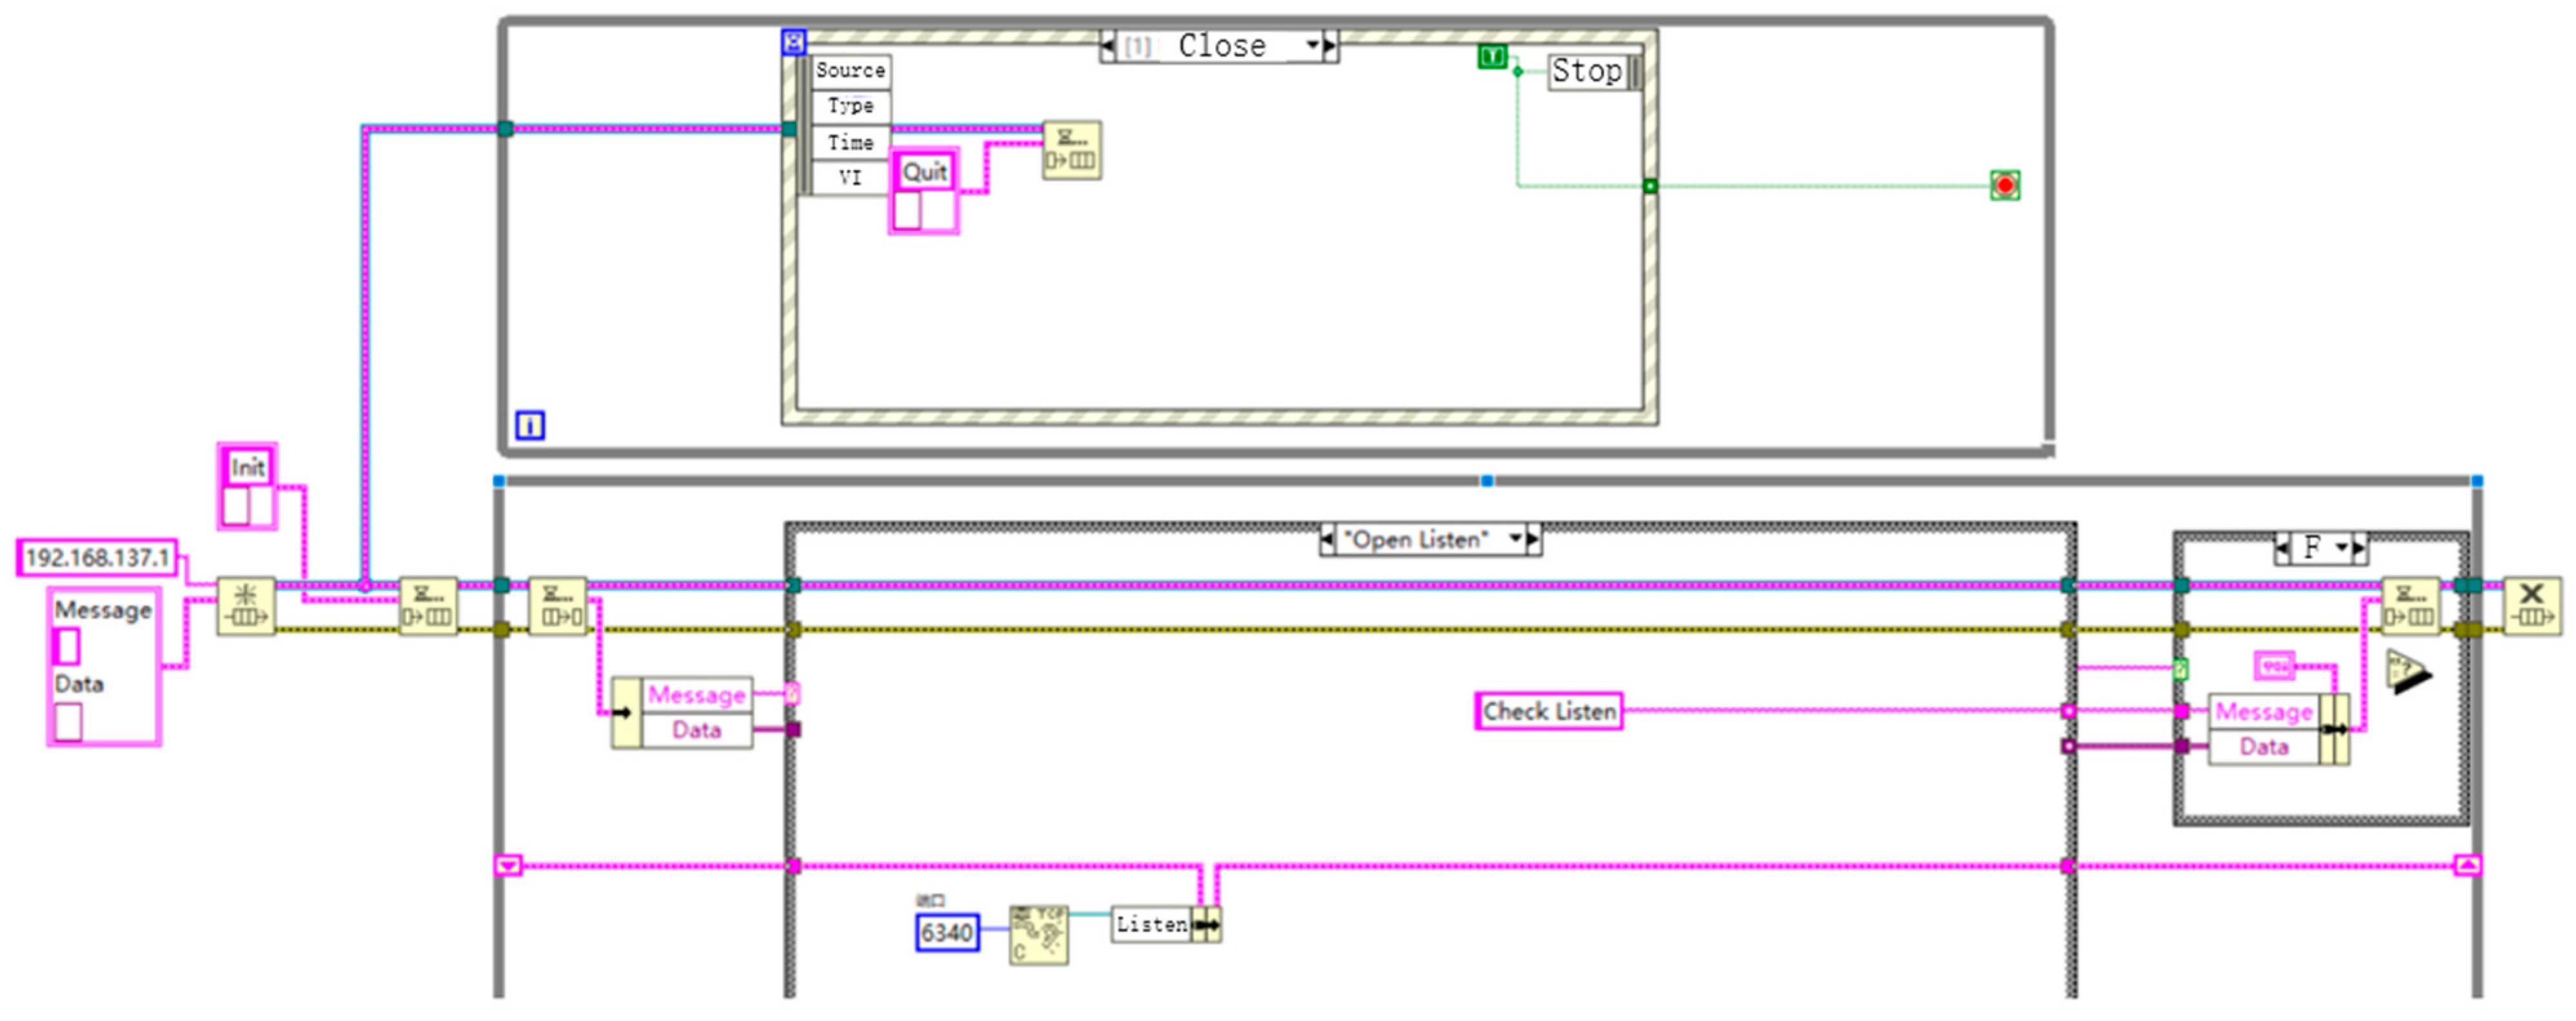
3.2.4. Remote Communication

The communication between the local host computer and the local monitoring center can be achieved using the TCP/IP communication protocol provided by LabVIEW. The remote communication involves a server-side and a client-side, with the local host computer acting as the client and the local monitoring center acting as the server. Firstly, the server is established, and the client uses the TCP listening function to establish a connection with the server once the server’s TCP port is detected. After the connection is established, the client sends the data from the queue to the server. The program block diagrams for the server-side and client-side are shown in Figure 11 and Figure 12, respectively. Once the connection is successful, the operational data of the lithium-ion battery can be displayed not only on the local host computer, but also on the local monitoring center.

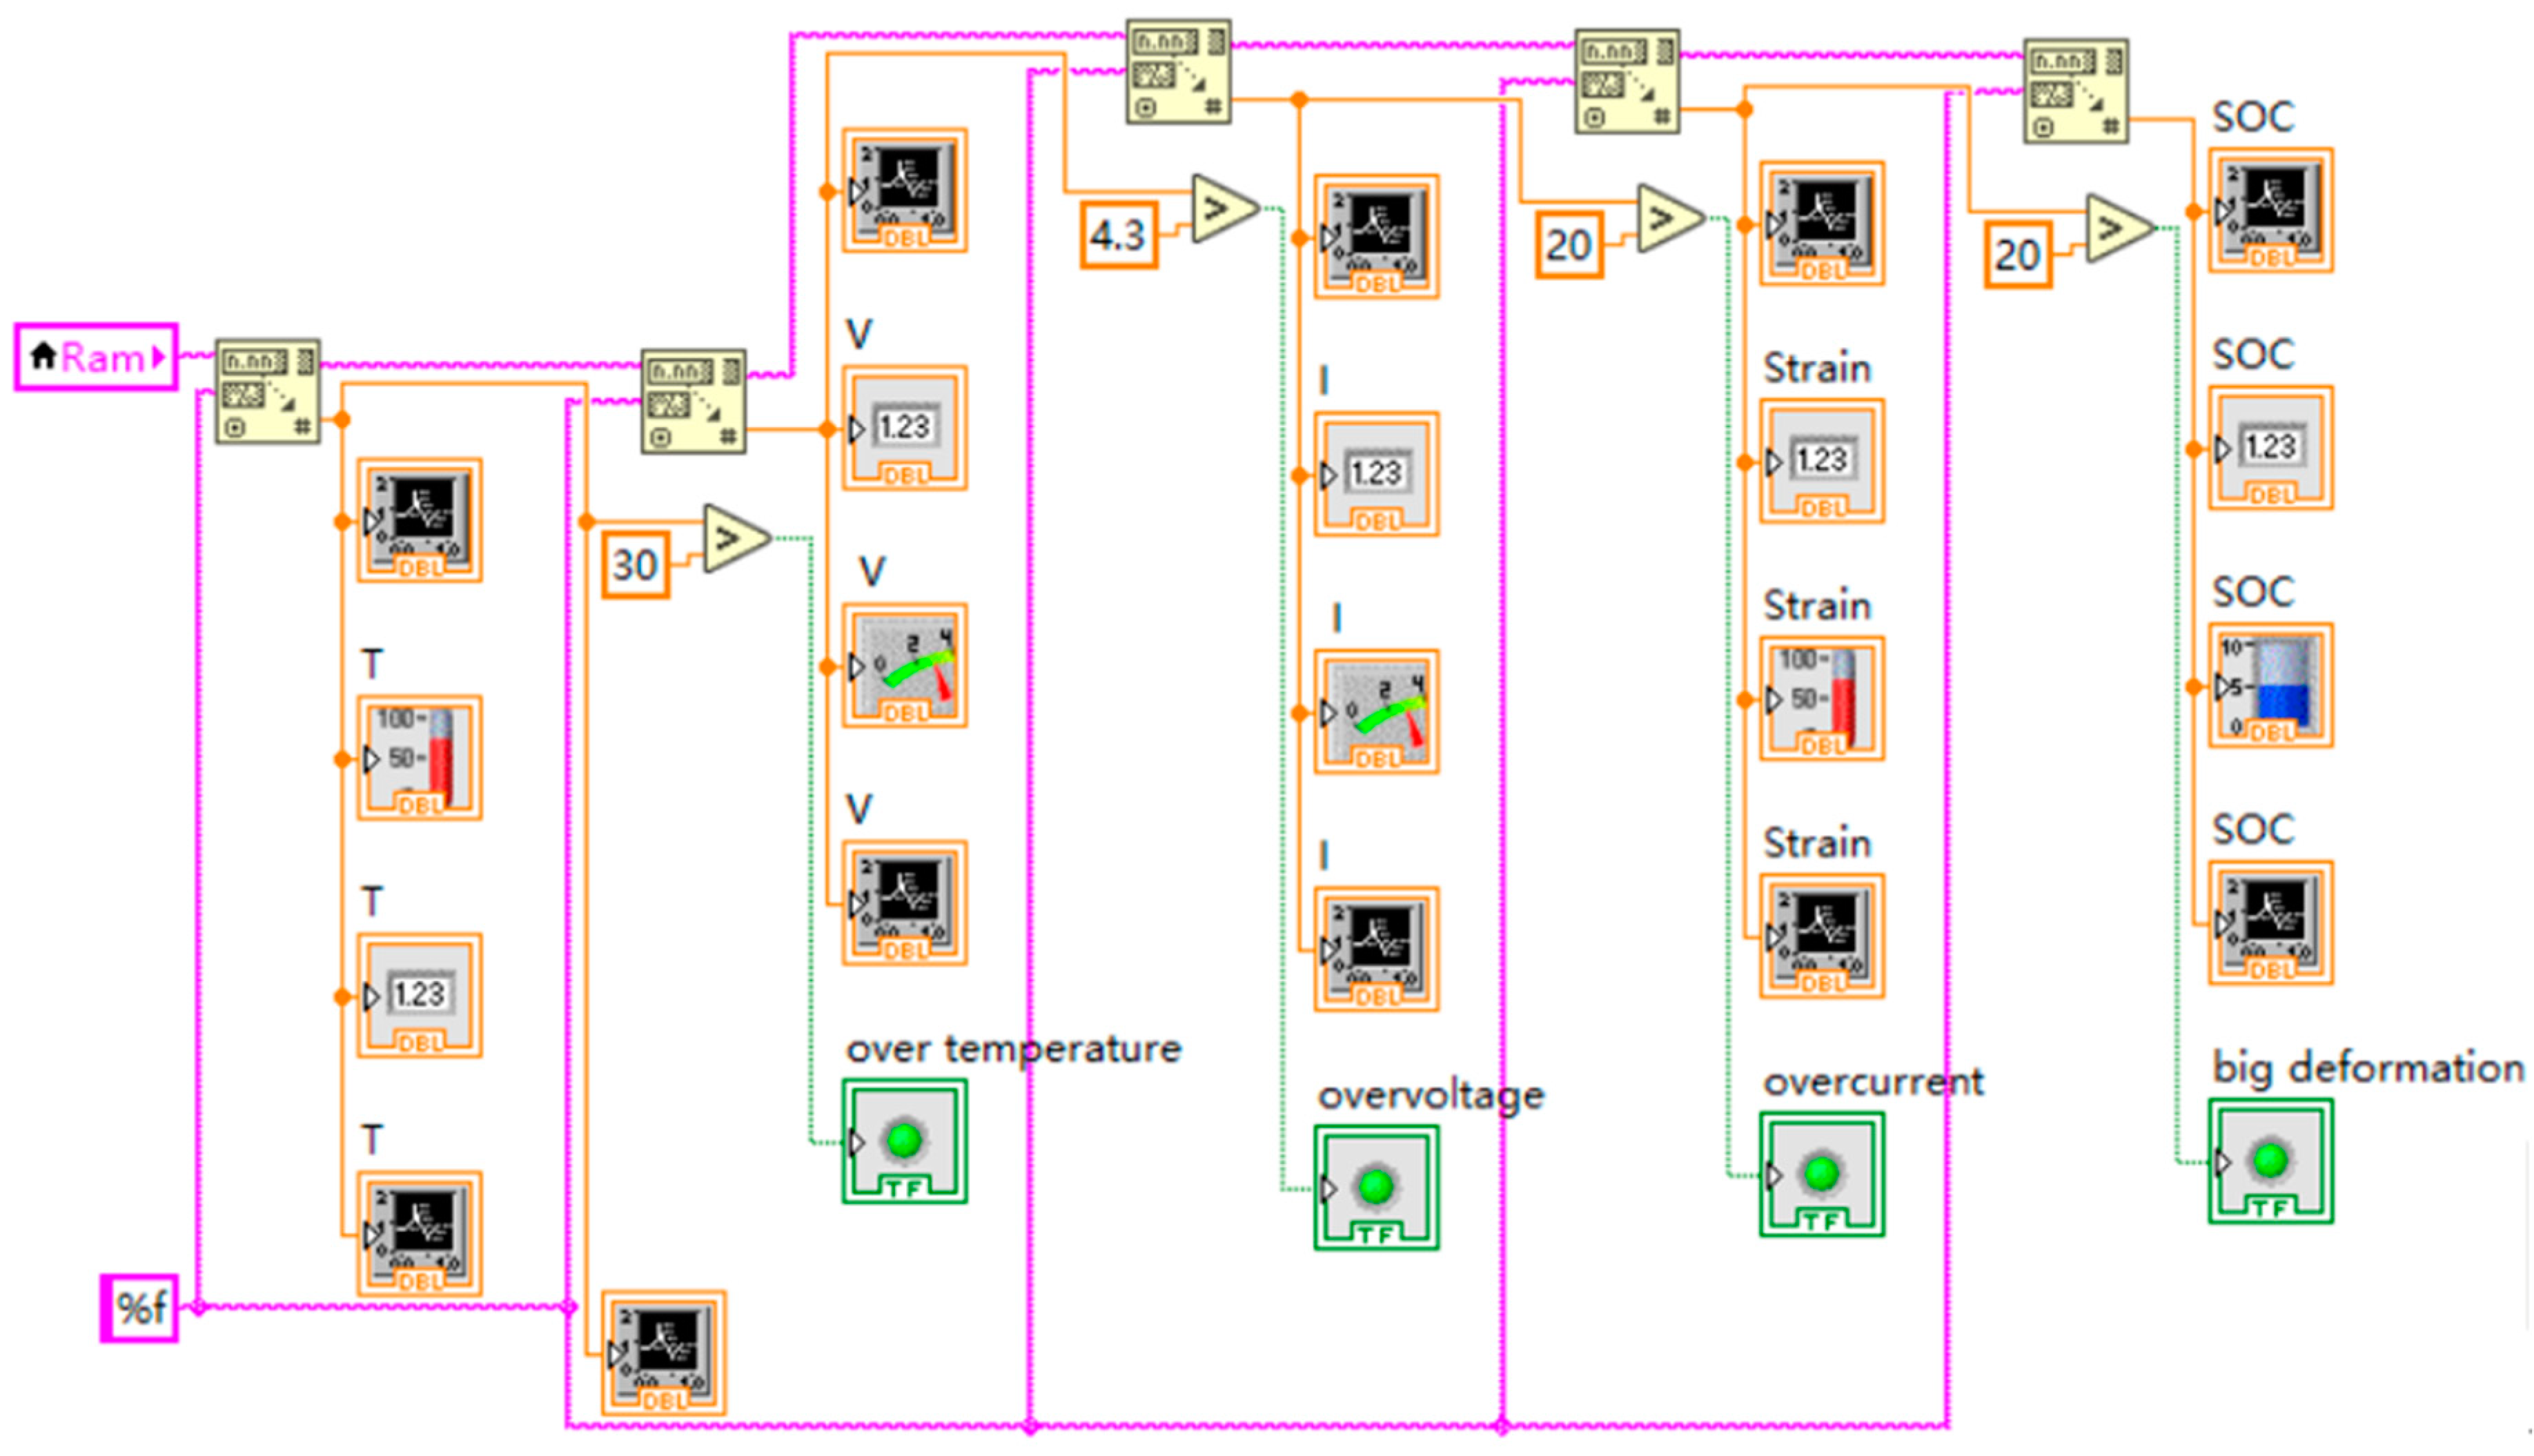
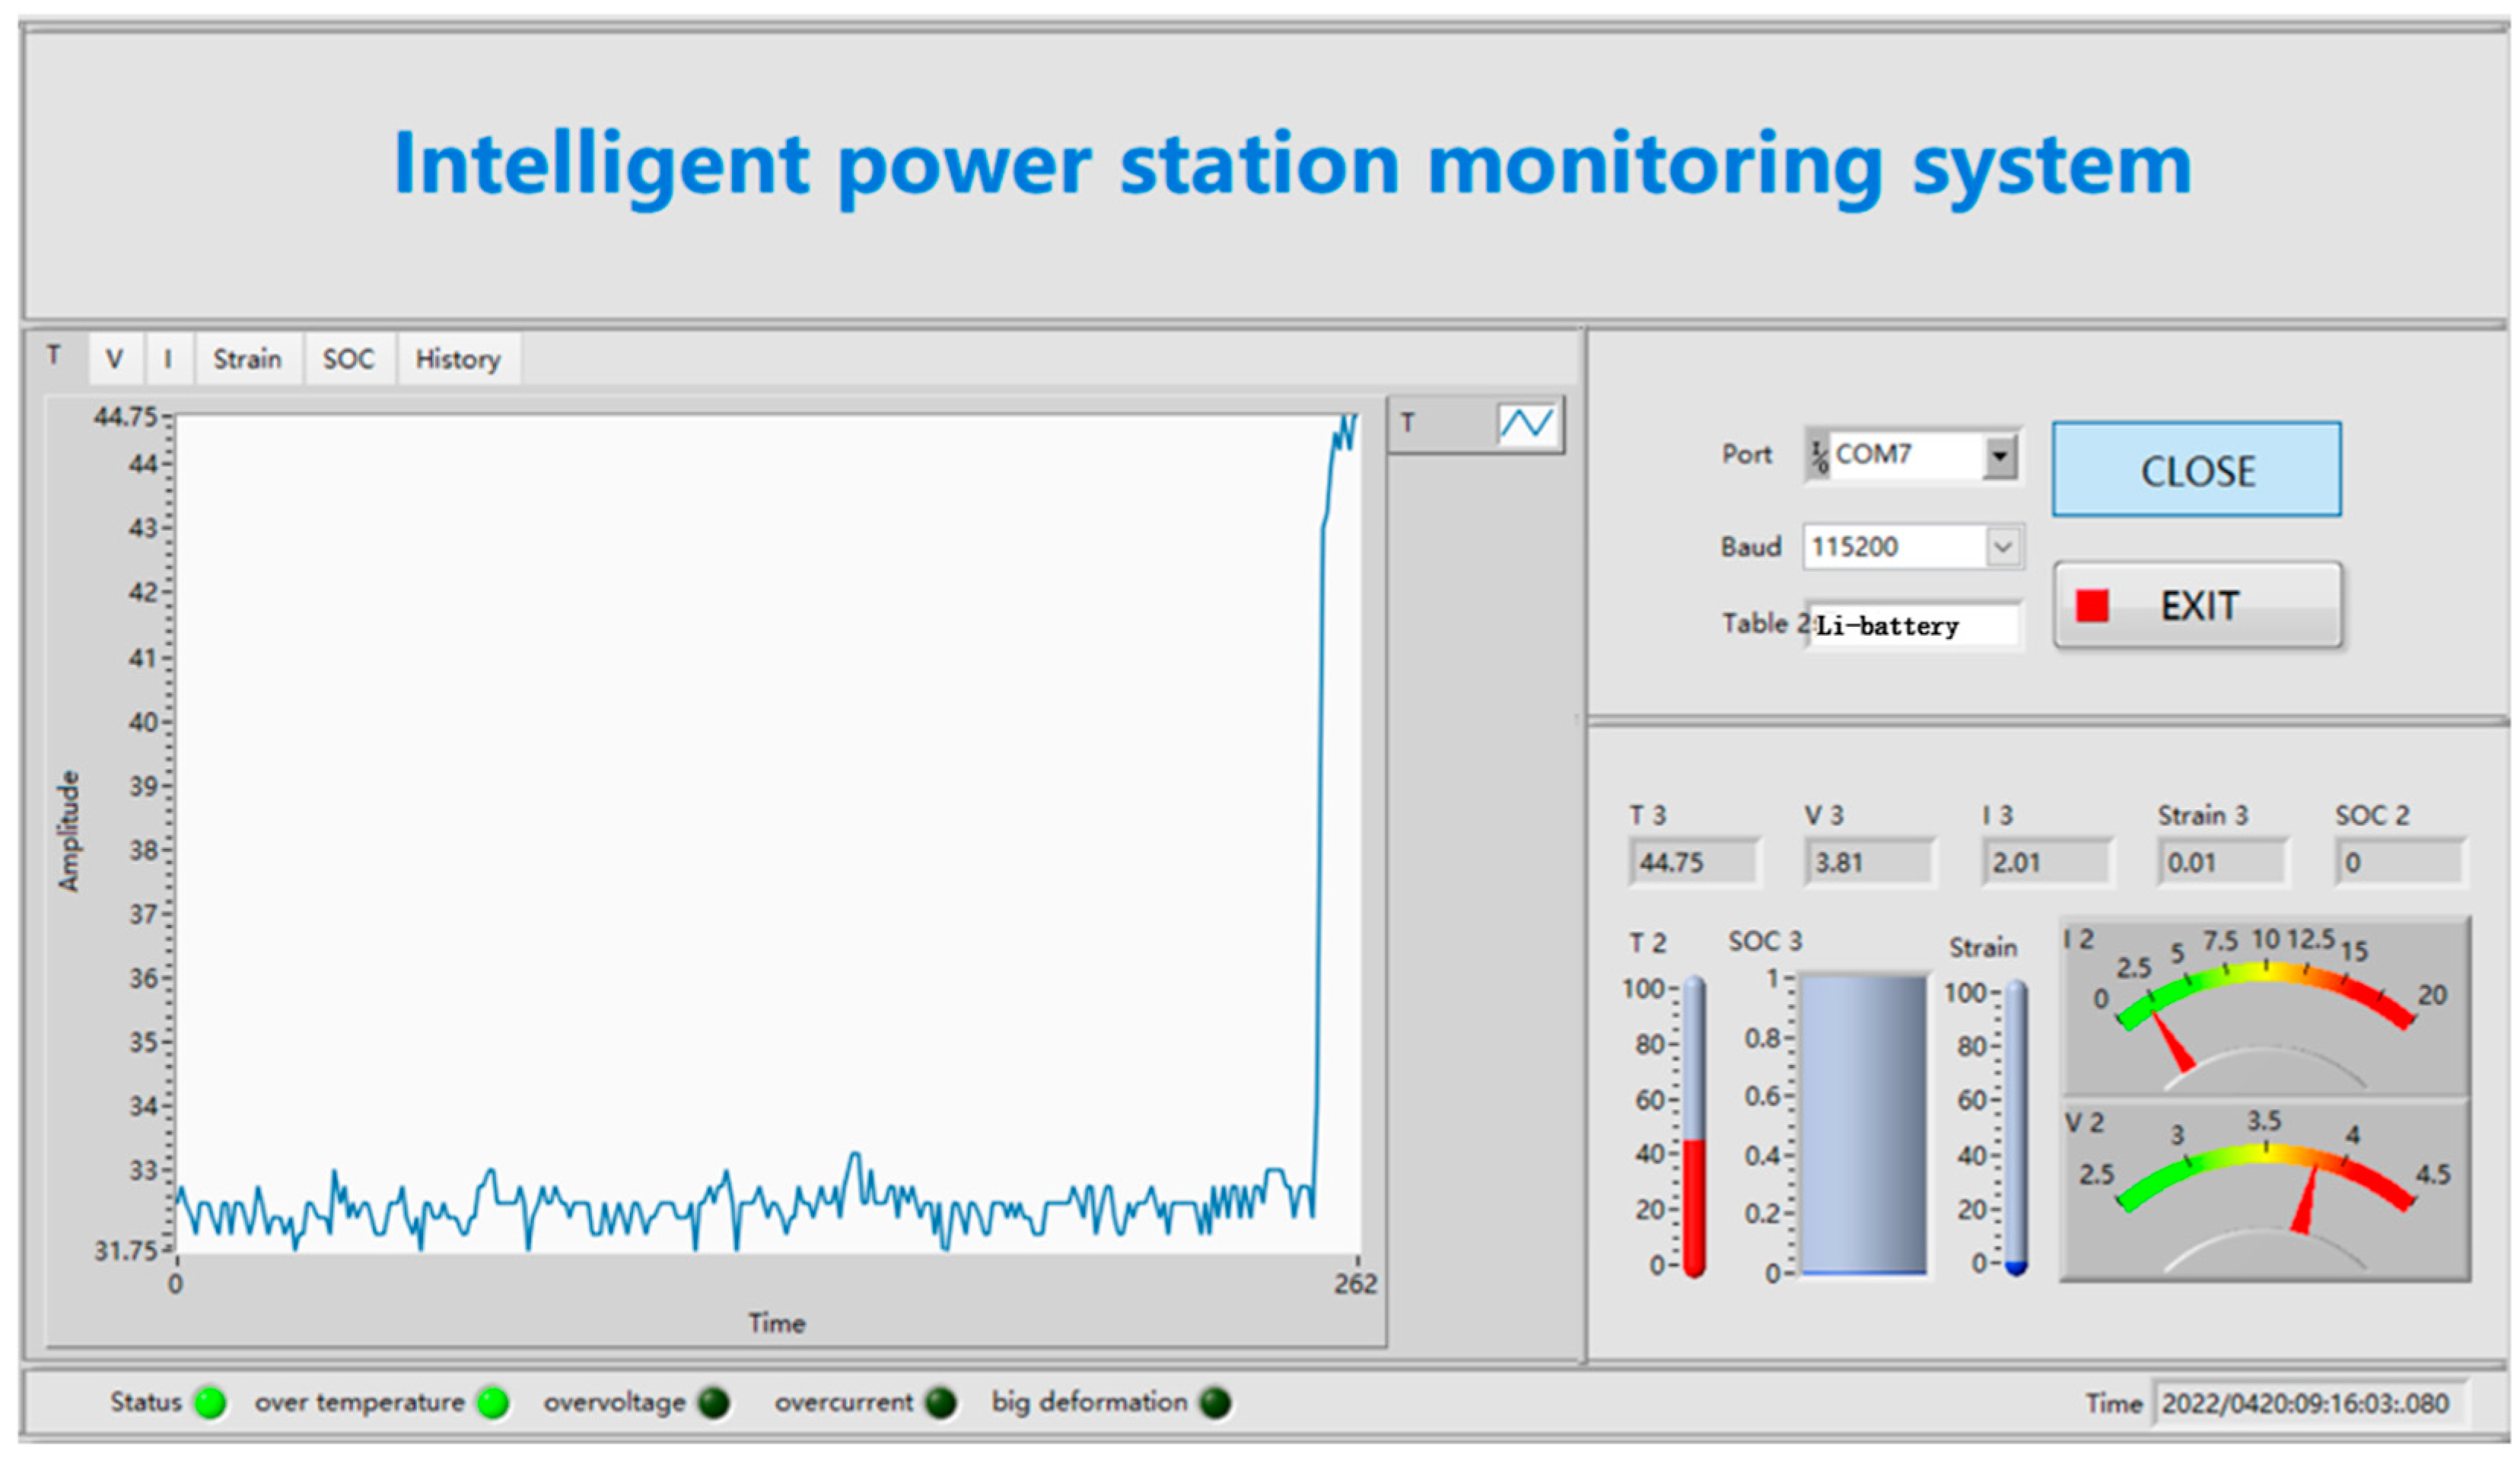
3.2.5. Warning Function

As shown in Figure 8, when the monitored battery parameters exceed the set safety range, the alarm indicator light will illuminate, displaying a warning message to the operators.
To verify the performance and measurement accuracy of the battery monitoring system, tests will be conducted on the data reception, data visualization, data storage, data fitting, and alarm functions. The collected values of the temperature, voltage, and current will be compared with those obtained from voltmeters, ammeters, and thermometers.

4. Testing

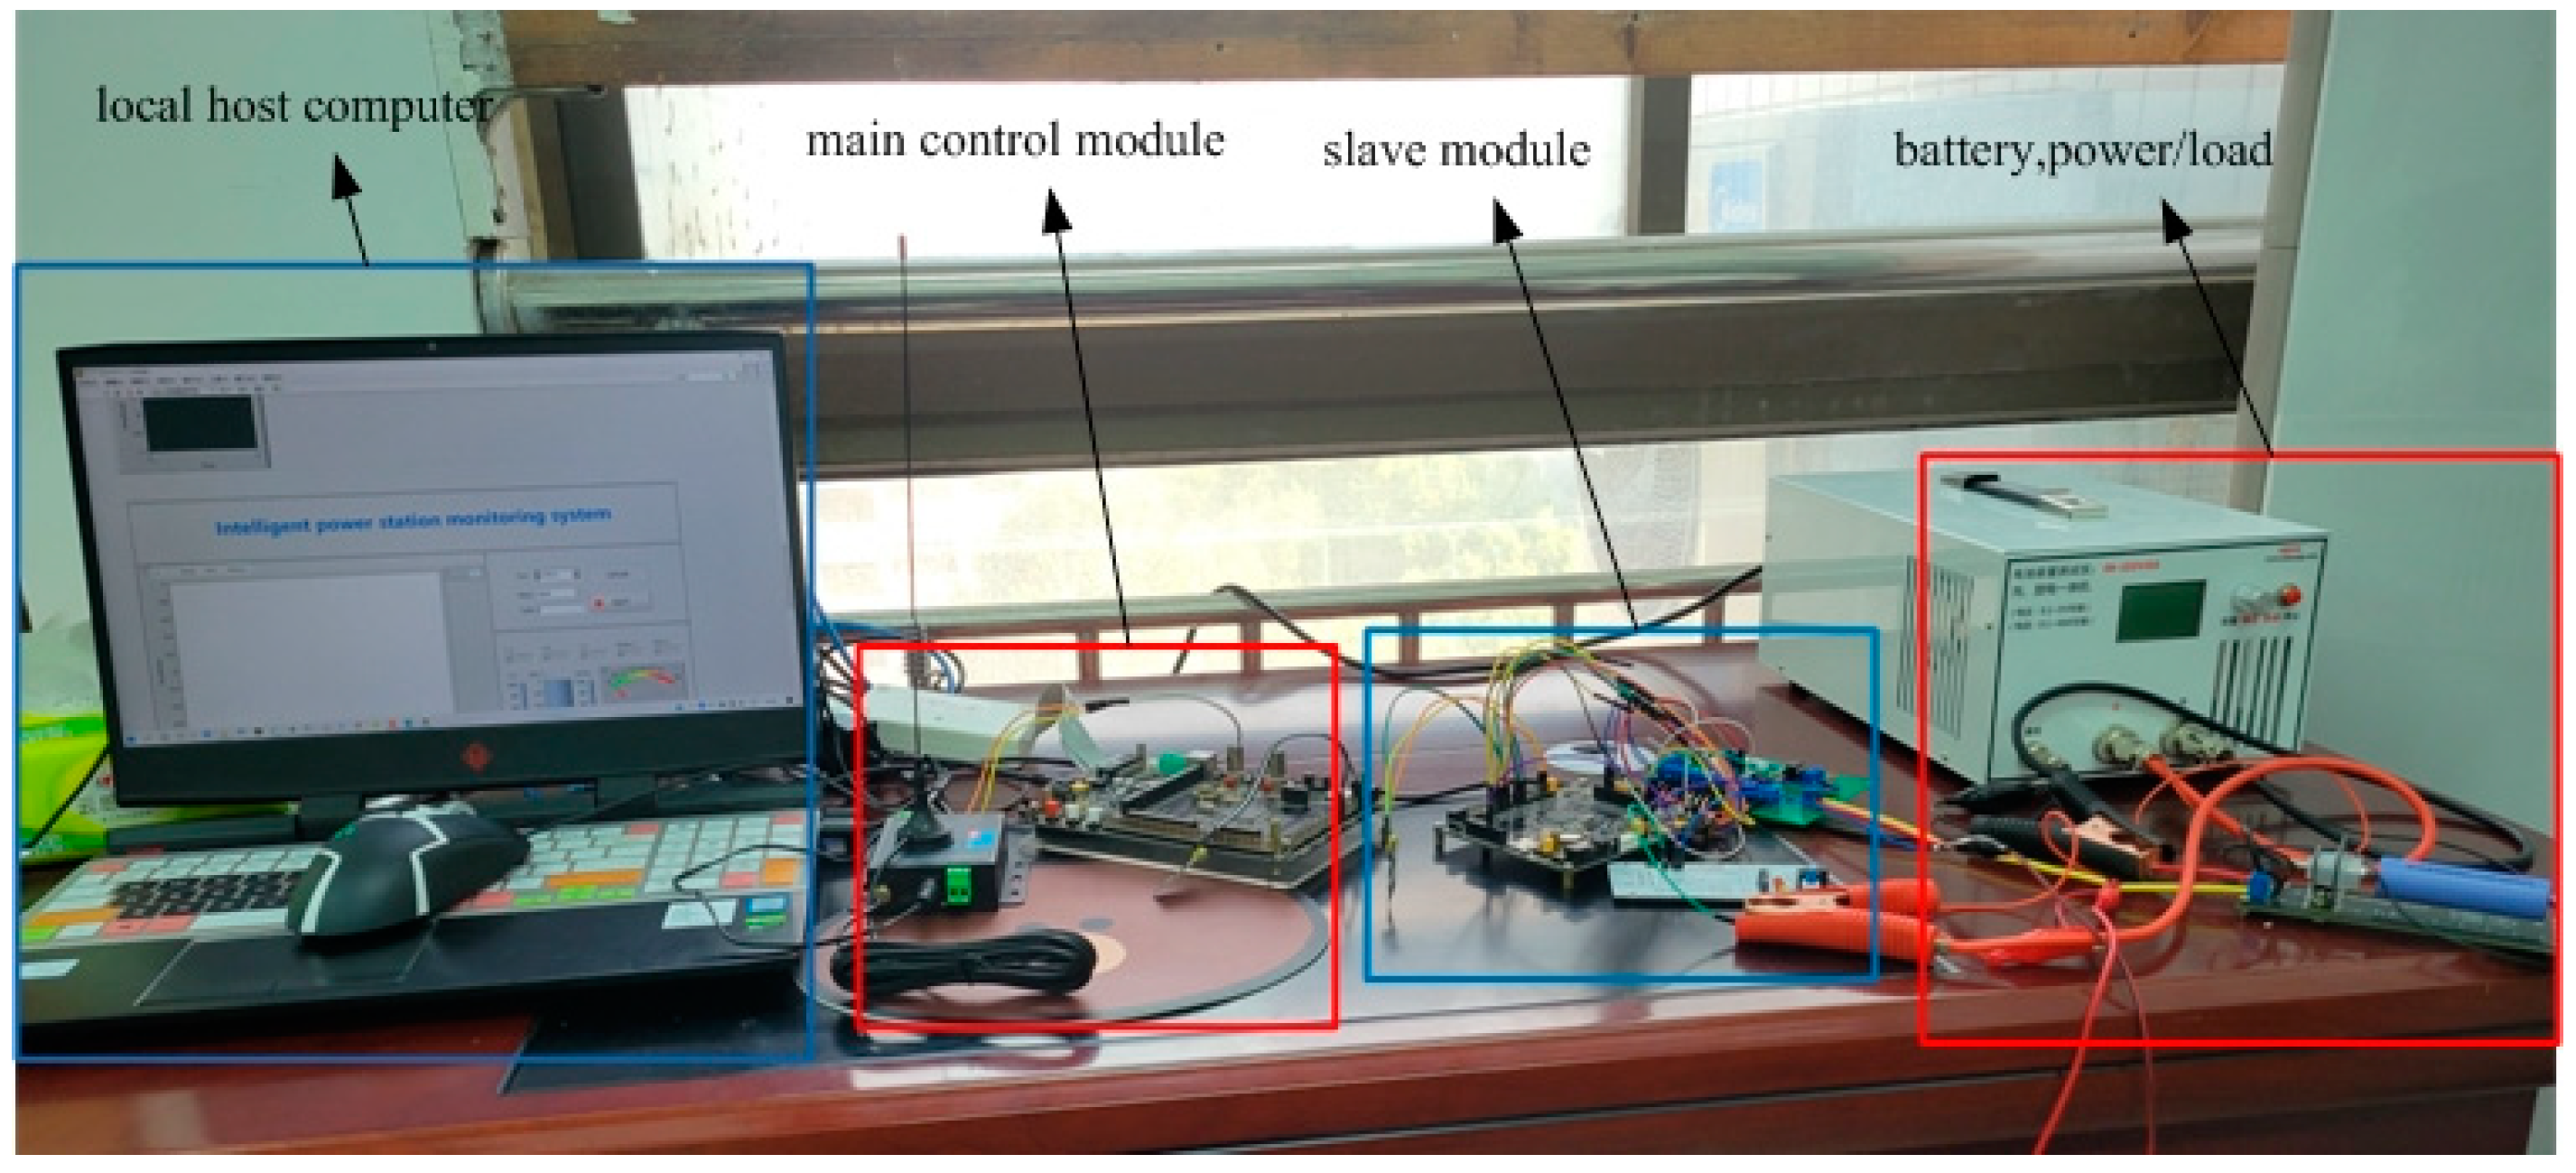
4.1. Functional Testing

This test will be conducted in the Comprehensive Laboratory Building 1107 at North China University of Water Resources and Electric Power. Figure 13 shows the experimental equipment, while Figure 14 displays the interfaces of the local host computer, local monitoring center, and cloud platform monitoring. As shown in Figure 15, this system is capable of the real-time monitoring of the operation information of the energy storage station and visualizing the data. Figure 16 shows the data query and fitting interface of the local host computer and local monitoring center, demonstrating that this monitoring system can store the operational data of the energy storage station and accurately plot its change curve, assisting operators in quickly analyzing the battery’s performance. Figure 17 displays the high-temperature alarm state, where the temperature warning light will turn on when the temperature exceeds the threshold.

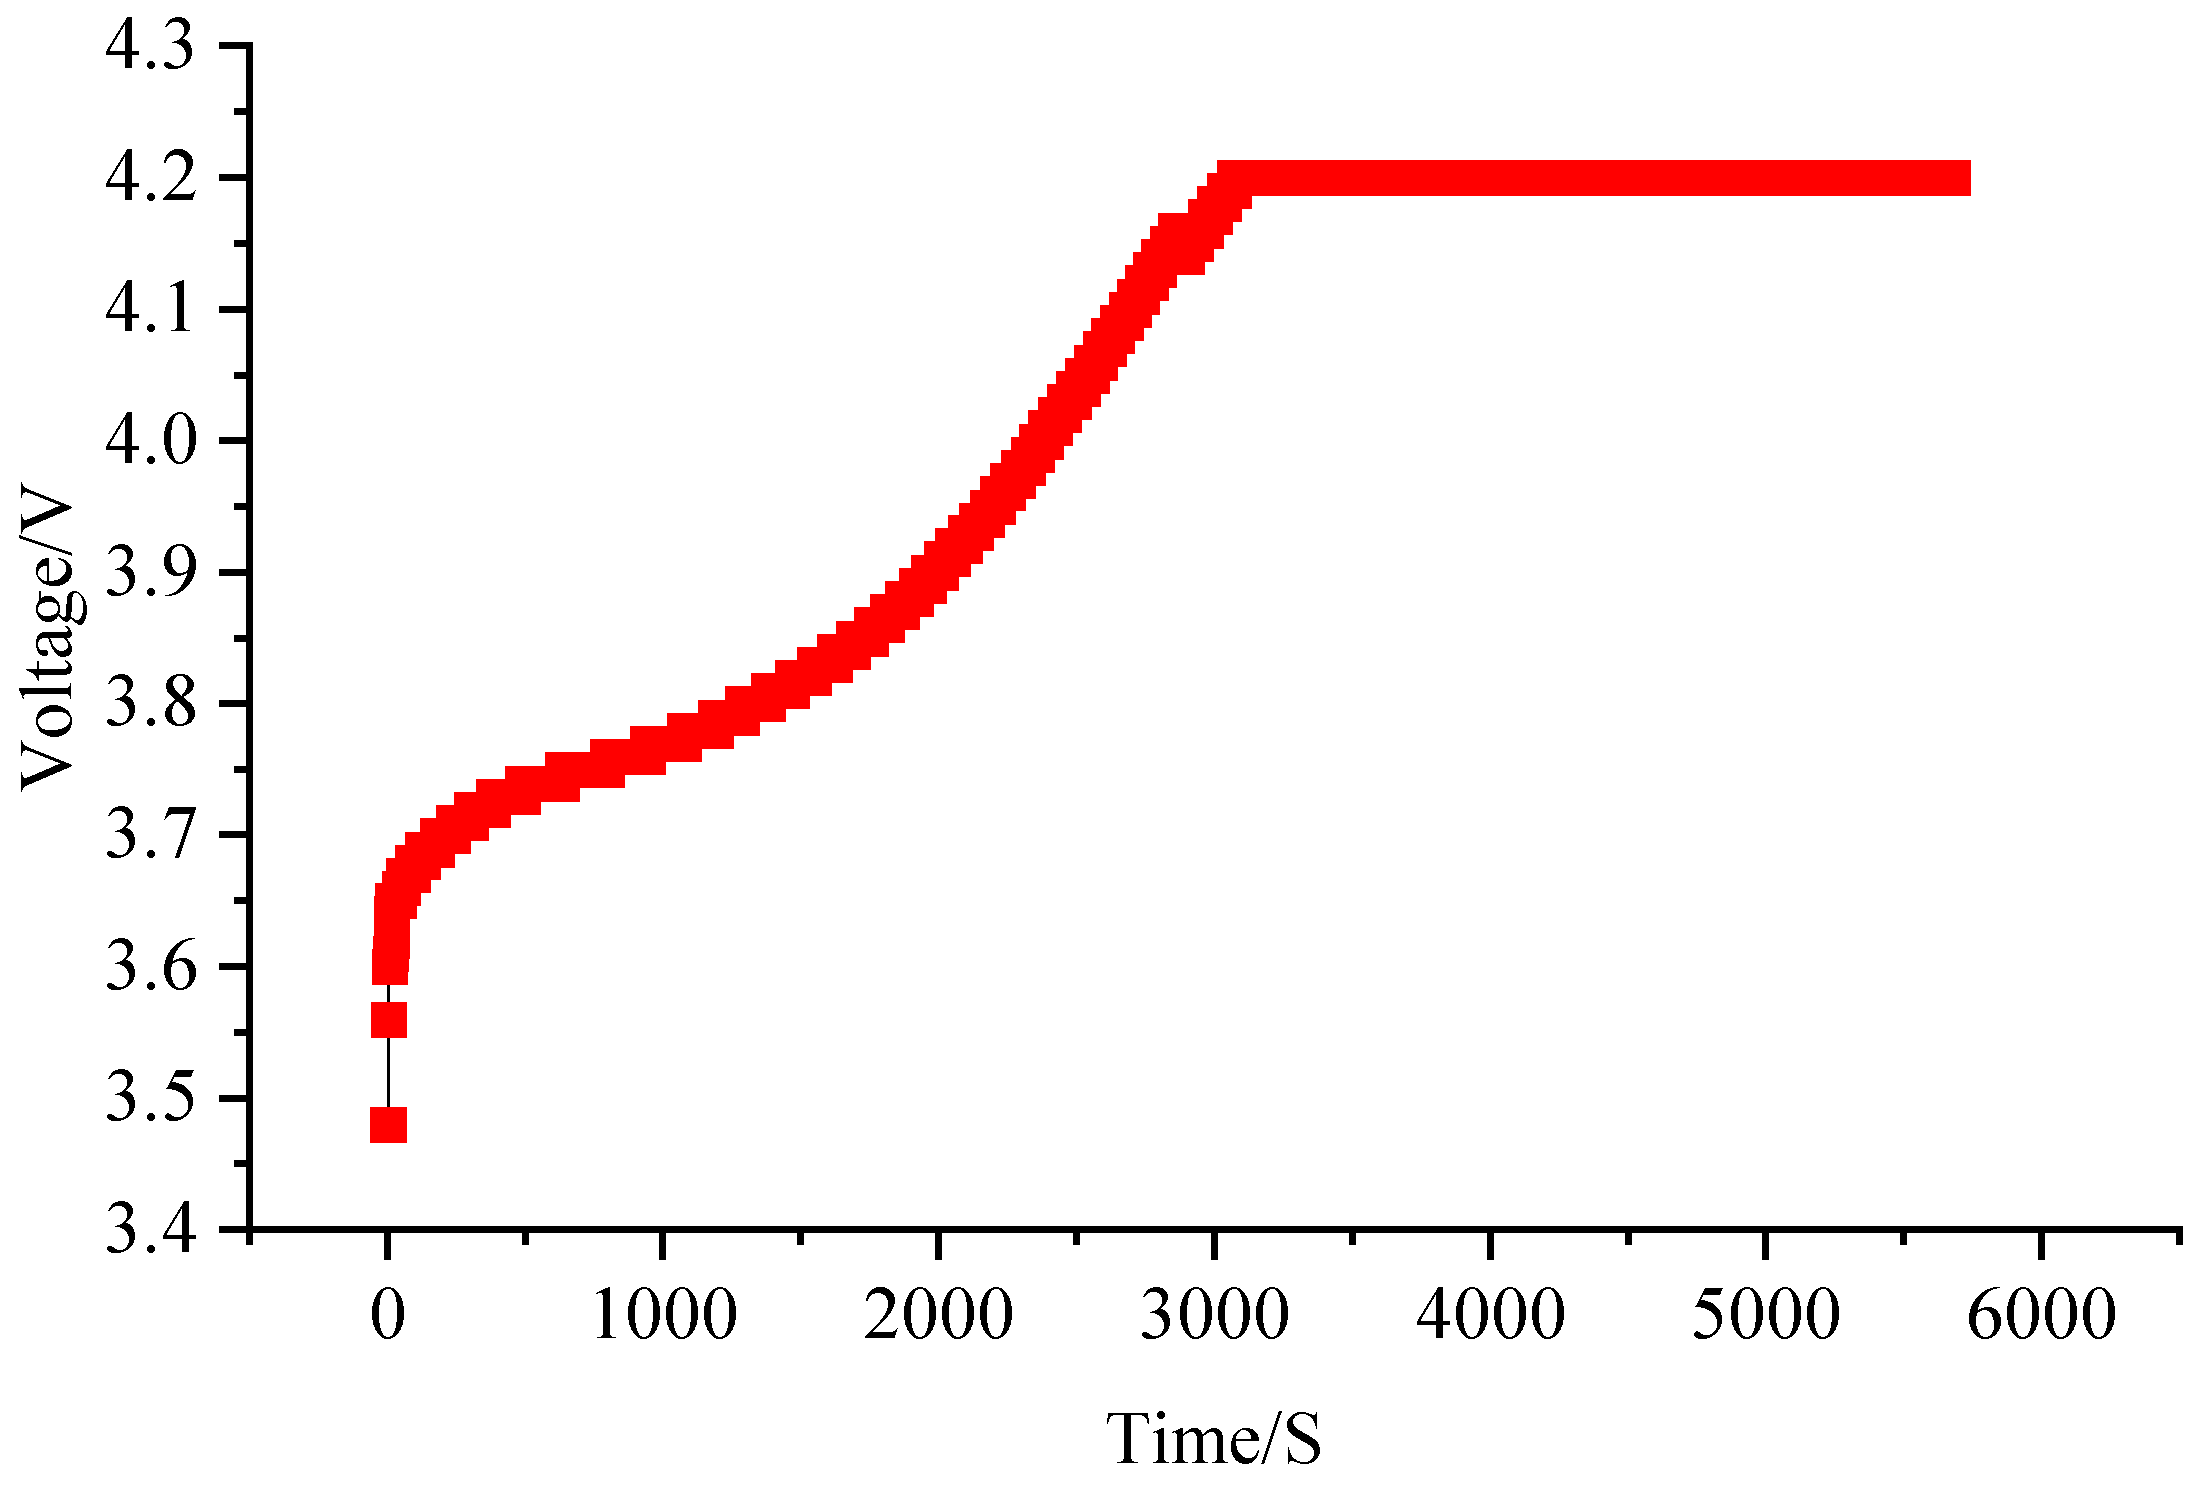
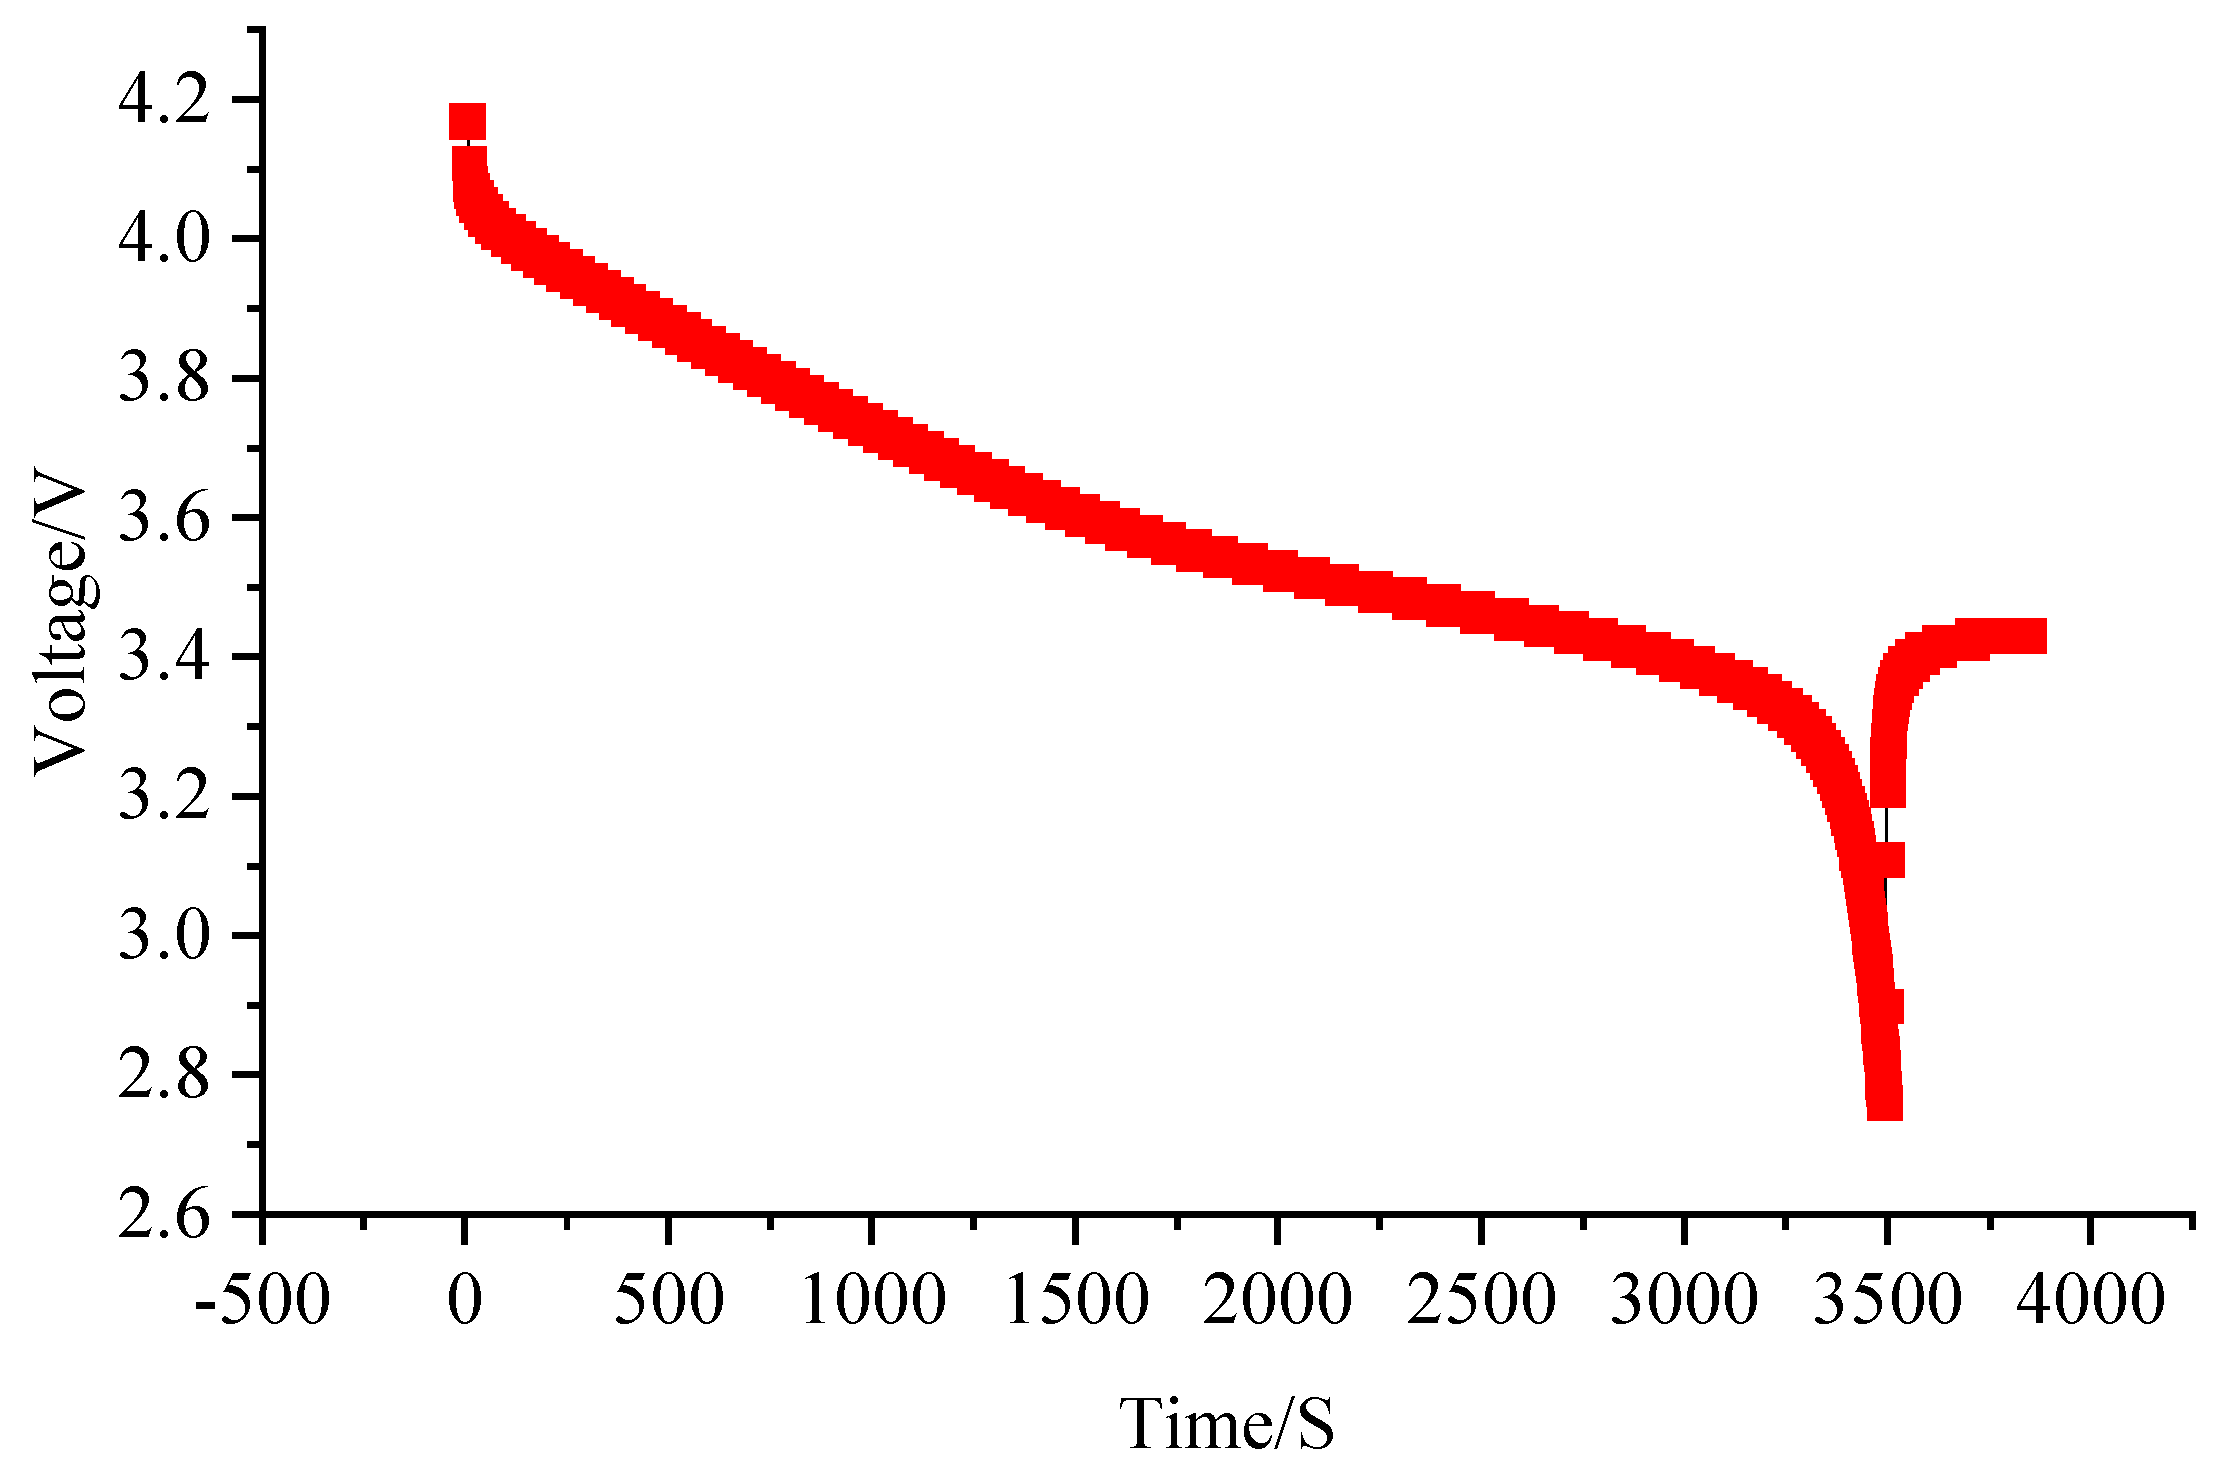
4.2. Voltage Testing

The voltage measurement test is divided into two parts. Firstly, the charging voltage measurement is performed. The individual battery is discharged to 2.75 V and left to rest for a period of time. Then, it is charged with a current of 2 A. When the battery is charged to 4.2 V, it switches to constant current charging until the current decreases to 0.1 A. Since the battery has ohmic and polarization resistances, it has a minimum discharge voltage of 2.75 V, and after a period of standing, its voltage will gradually rise back up so that the minimum voltage in Figure 18 is 3.45 V. During the charging process, the voltage is recorded by both the monitoring platform and the charge-discharge instrument. The voltage errors recorded by the monitoring platform and the charge-discharge recorder are compared, as shown in Table 1. Figure 18 shows the charging curve recorded by the monitoring platform.
The first column of Table 1 and Table 2 are the measured values, because this study uses the DS2438 chip to measure the battery voltage, and the measurement precision of DS2438 is only two decimal places, and the second column is measured by using professional instruments with a precision of three places. The comparison of the two values in Table 1 and Table 2 to derive their errors is to ensure the accuracy of the monitoring values of the lithium-ion battery monitoring system in the experiment.
Next is the discharge voltage measurement. Firstly, the individual battery is charged to 4.2 V and left to rest for a period of time. Then, it is discharged with a current of 2 A until the battery reaches 2.75 V. During the discharge process, the voltage is recorded by both the monitoring platform and the charge-discharge instrument. The voltage errors recorded by the monitoring platform and charge-discharge recorder are compared, as shown in Table 2. Figure 19 shows the discharge curve recorded by the monitoring platform.

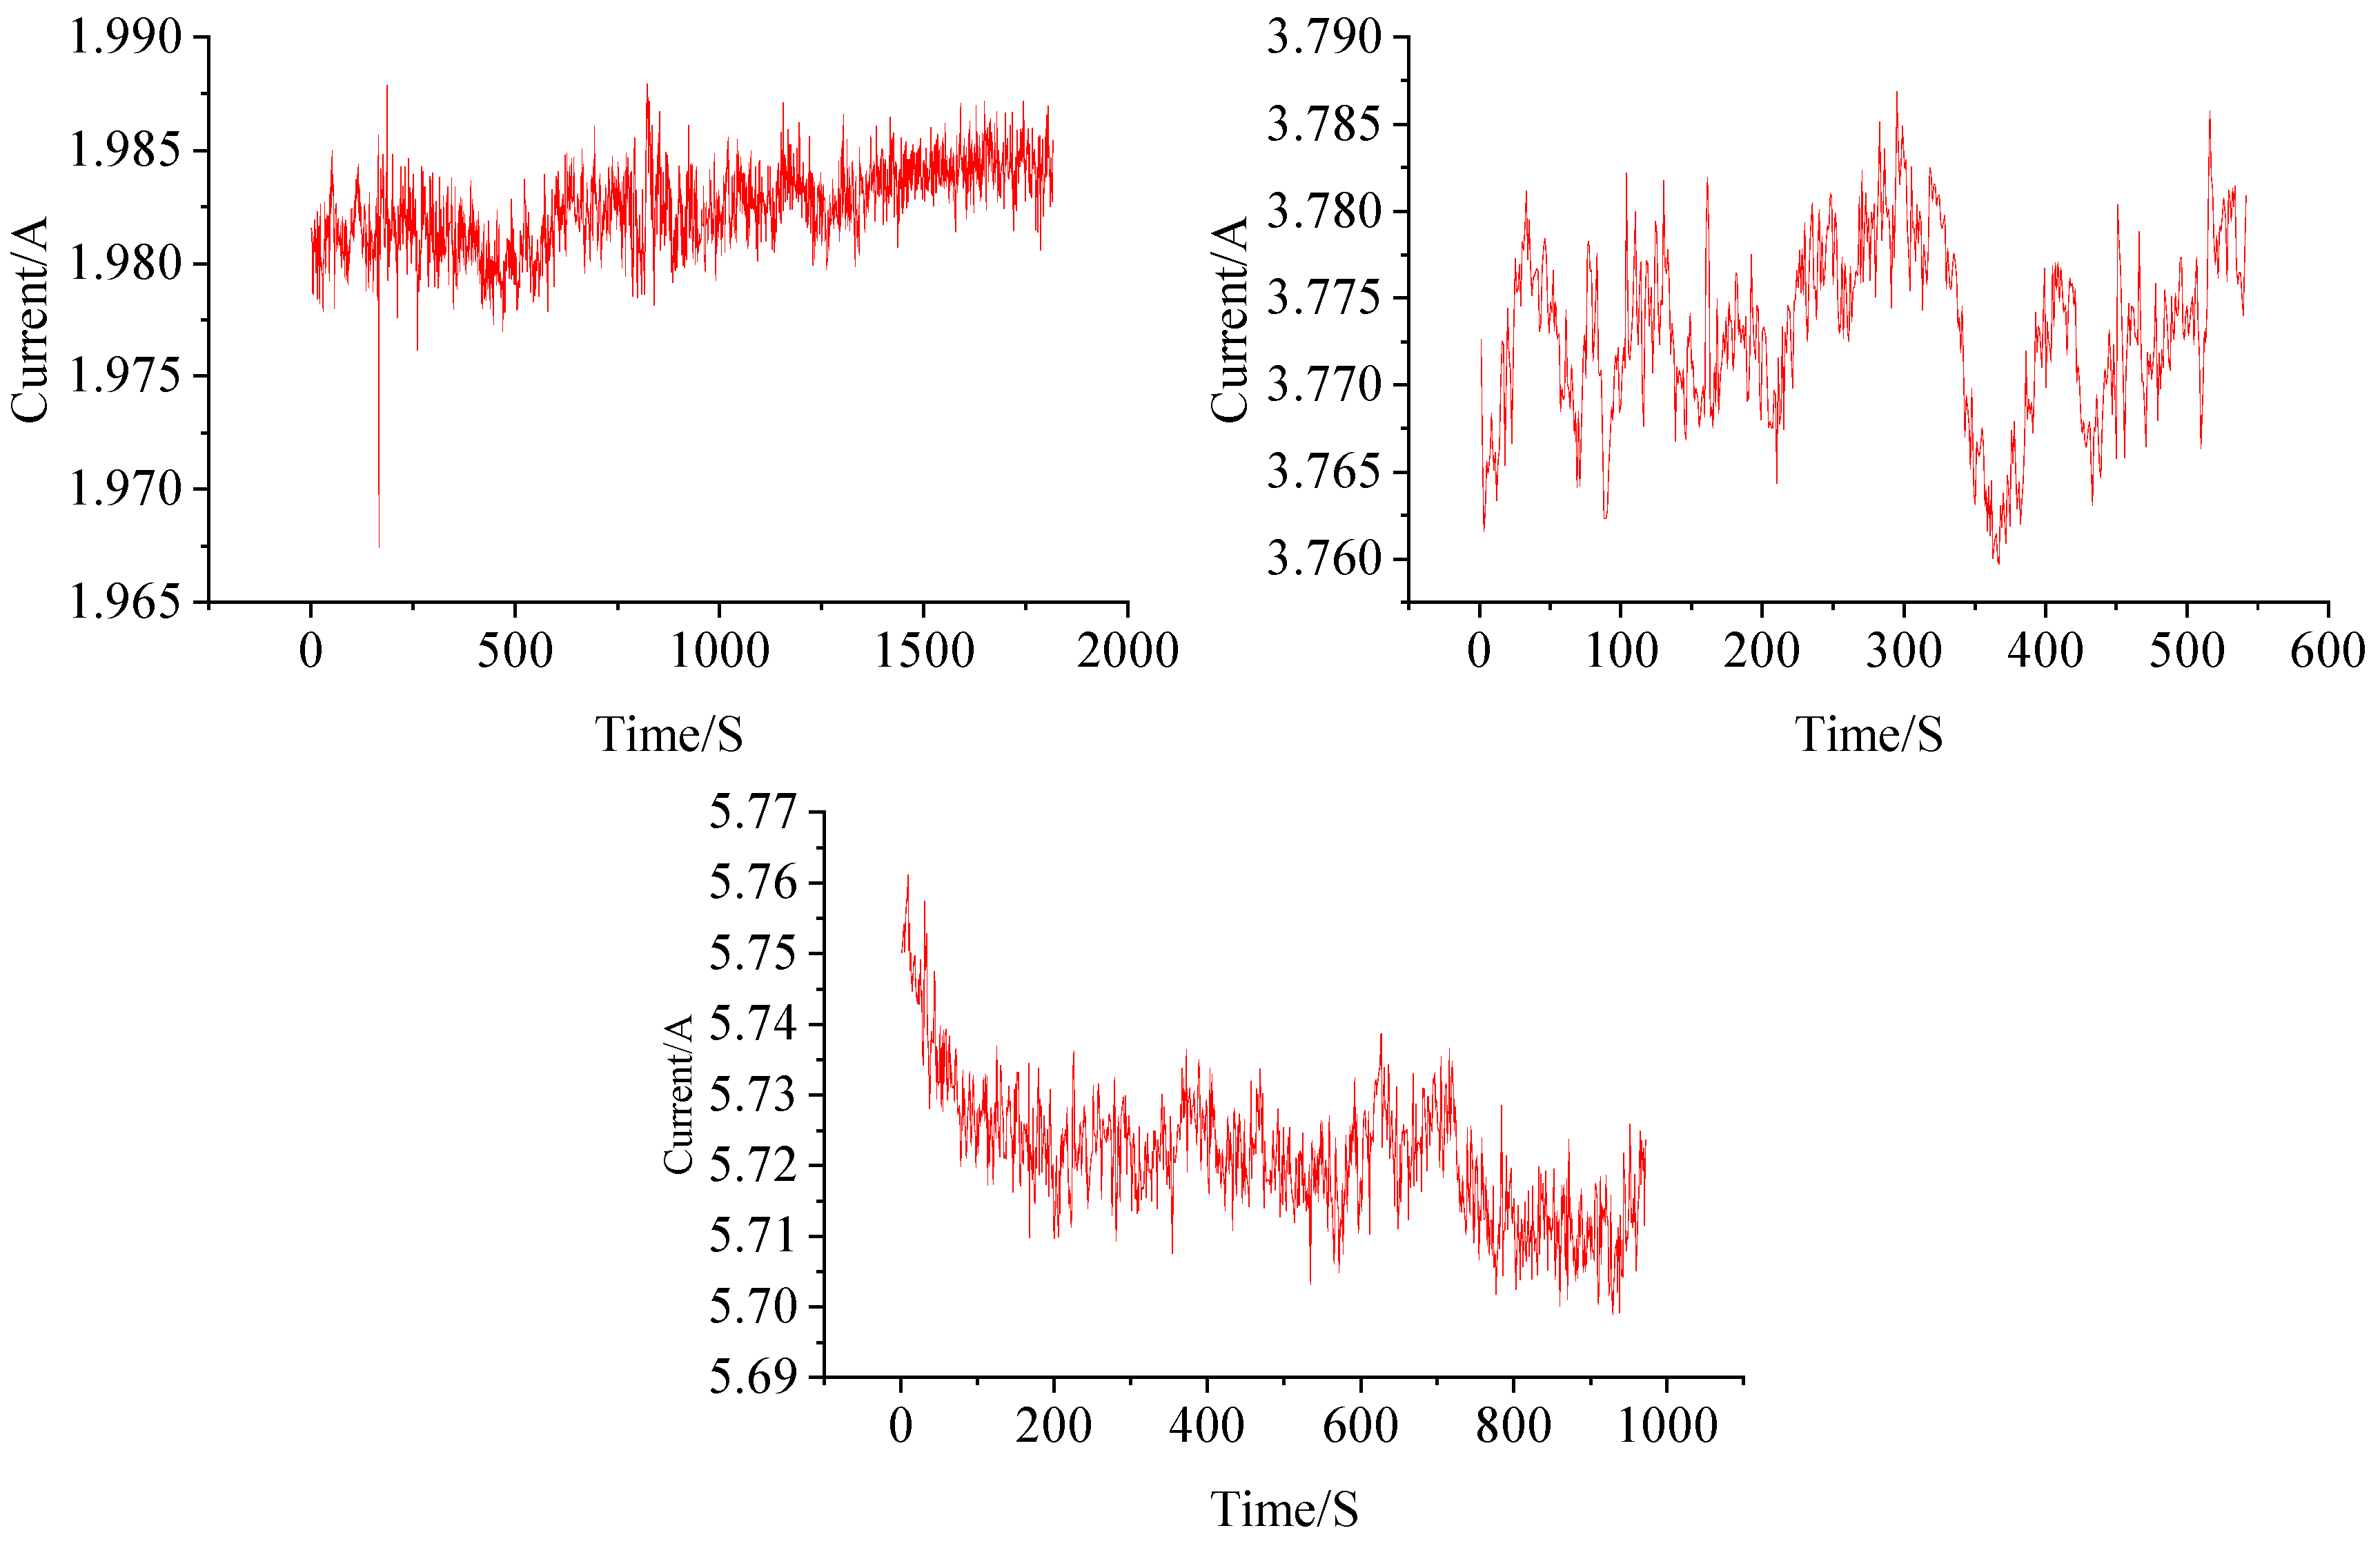
4.3. Current Measurement

The maximum discharge current of the batteries used in this study is 6 A. During operation, the current may vary depending on the working conditions. The current measurement is used to verify whether the system can function properly under different discharge currents. In this study, a charge-discharge tester is used to discharge the battery at currents of 2 A, 3.8 A, and 5.7 A. As shown in Figure 20, the measurement results indicate that the current measurement error is within 0.1 A, which meets the requirements for usage.

4.4. Protection Function Testing

To verify the operation of the protection module designed in this study, a test was conducted on the overcharging fault. The test examined whether the processor would send a signal and turn off the MOSFET to stop the battery charging when the voltage exceeded the set threshold. The temperature, voltage, and current of the battery during the test process are shown in Figure 21.

5. Conclusions

The study initially highlights the drawbacks of the energy storage station monitoring system and suggests a lithium-ion battery monitoring system that utilizes NB-IoT-ZigBee. NB-IoT exhibits specific restrictions when the immediate warning about thermal runaway is of high priority. This study recommends the inclusion of a local host computer, local monitoring center, and edge computing for the prompt action of thermal runaway incidents. The system can also store the collected data in the host computer and local monitoring center and retrieve and fit it. Through testing, the designed system successfully achieves the aforementioned functions and effectively monitors and protects the battery’s status. Nevertheless, the remaining capacity of the battery was not assessed in this study. Although the current used in the test was constant, it should be noted that the current of the energy storage station may vary in real-time during actual usage.

Author Contributions

Conceptualization, X.L.; methodology, C.W.; software, S.J.; validation, D.P.; formal analysis, X.L.; investigation, D.P.; resources, C.W. and S.J.; data curation, C.W.; writing—original draft preparation, X.L.; writing—review and editing, C.W.; visualization, D.P.; supervision, X.W.; project administration, J.Z. and L.W.; funding acquisition, L.W. All authors have read and agreed to the published version of the manuscript.

Funding

This research was funded by the Foreign Expert Project of Ministry of Science and Technology of the PRC (G2022026016L), “ZHONGYUAN Talent Program” (ZYYCYU202012112), Henan International Joint Laboratory of Thermo-Fluid Electro Chemical System for New Energy Vehicle (Yuke2020-23), Zhengzhou Measurement and Control Technology and Instrument Key Laboratory (121PYFZX181), and the Fund of Innovative Education Program for PhD Graduate Students at North China University of Water Resources and Electric Power (NCWUBC202326).

Data Availability Statement

The data involved in this research were obtained experimentally and have been shown in full in the study.

Conflicts of Interest

The authors declare no conflict of interest.

References

  1. Grey, C.P.; Tarascon, J.M. Sustainability and in situ monitoring in battery development. Nat. Mater. 2017, 16, 45–56. [Google Scholar] [CrossRef] [PubMed]
  2. Waag, W.; Fleischer, C.; Sauer, D.U. Critical review of the methods for monitoring of lithium-ion batteries in electric and hybrid vehicles. J. Power Sources 2014, 258, 321–339. [Google Scholar] [CrossRef]
  3. Zou, Y.; Hu, X.; Ma, H.; Li, S.E. Combined State of Charge and State of Health estimation over lithium-ion battery cell cycle lifespan for electric vehicles. J. Power Sources 2015, 273, 793–803. [Google Scholar] [CrossRef]
  4. Cai, L.; Thornhill, N.F.; Kuenzel, S.; Pal, B.C. A Test Model of a Power Grid With Battery Energy Storage and Wide-Area Monitoring. IEEE Trans. Power Syst. 2019, 34, 380–390. [Google Scholar] [CrossRef]
  5. Chen, D.; Zhao, Q.; Zheng, Y.; Xu, Y.; Chen, Y.; Ni, J.; Zhao, Y. Recent Progress in Lithium-Ion Battery Safety Monitoring Based on Fiber Bragg Grating Sensors. Sensors 2023, 23, 5609. [Google Scholar] [CrossRef] [PubMed]
  6. Chen, Z.; Li, S.; Cai, X.; Zhou, N.; Cui, J. Online state of health monitoring of lithium-ion battery based on model error spectrum for electric vehicle applications. J. Energy Storage 2022, 45, 103507. [Google Scholar] [CrossRef]
  7. Conway, T. An Isolated Active Balancing and Monitoring System for Lithium Ion Battery Stacks Utilizing a Single Transformer Per Cell. IEEE Trans. Power Electron. 2021, 36, 3727–3734. [Google Scholar] [CrossRef]
  8. Dost, P.; Kipke, V.; Sourkounis, C. Direct active cell balancing with integrated cell monitoring. IET Electr. Syst. Transp. 2019, 9, 244–250. [Google Scholar] [CrossRef]
  9. Hao, W.; Cao, S.-S.; Su, J.-H.; Xu, H.-T.; Zhen, W.; Zheng, J.-J.; Wei, W. Temperature field monitoring of lithium battery pack based on double-clad fiber Bragg grating sensor. Acta Phys. Sin. 2022, 71, 104207. [Google Scholar] [CrossRef]
  10. Hu, X.; Jiang, Z.; Yan, L.; Yang, G.; Xie, J.; Liu, S.; Zhang, Q.; Xiang, Y.; Min, H.; Peng, X. Real-time visualized battery health monitoring sensor with piezoelectric/pyroelectric poly (vinylidene fluoride-trifluoroethylene) and thin film transistor array by in-situ poling. J. Power Sources 2020, 467, 228367. [Google Scholar] [CrossRef]
  11. Jin, Y.; Zhou, L.; Yu, J.; Liang, J.; Cai, W.; Zhang, H.; Zhu, S.; Zhu, J. In operando plasmonic monitoring of electrochemical evolution of lithium metal. Proc. Natl. Acad. Sci. USA 2018, 115, 11168–11173. [Google Scholar] [CrossRef] [PubMed]
  12. Kim, C.-H.; Kim, M.-Y.; Moon, G.-W. A Modularized Charge Equalizer Using a Battery Monitoring IC for Series-Connected Li-Ion Battery Strings in Electric Vehicles. IEEE Trans. Power Electron. 2013, 28, 3779–3787. [Google Scholar] [CrossRef]
  13. Kim, T.; Makwana, D.; Adhikaree, A.; Vagdoda, J.S.; Lee, Y. Cloud-Based Battery Condition Monitoring and Fault Diagnosis Platform for Large-Scale Lithium-Ion Battery Energy Storage Systems. Energies 2018, 11, 125. [Google Scholar] [CrossRef]
  14. Li, Y.; Zhang, Y.; Li, Z.; Yan, Z.; Xiao, X.; Liu, X.; Chen, J.; Shen, Y.; Sun, Q.; Huang, Y. Operando Decoding of Surface Strain in Anode-Free Lithium Metal Batteries via Optical Fiber Sensor. Adv. Sci. 2022, 9, 2203247. [Google Scholar] [CrossRef] [PubMed]
  15. Liao, Z.; Zhang, S.; Li, K.; Zhang, G.; Habetler, T.G. A survey of methods for monitoring and detecting thermal runaway of lithium-ion batteries. J. Power Sources 2019, 436, 226879. [Google Scholar] [CrossRef]
  16. Liu, Y.; Liu, Z.; Mei, W.; Han, X.; Liu, P.; Wang, C.; Xia, X.; Li, K.; Wang, S.; Wang, Q.; et al. Operando monitoring Lithium-ion battery temperature via implanting femtosecond-laser-inscribed optical fiber sensors. Measurement 2022, 203, 111961. [Google Scholar] [CrossRef]
  17. Peng, J.; Zhou, X.; Jia, S.; Jin, Y.; Xu, S.; Chen, J. High precision strain monitoring for lithium ion batteries based on fiber Bragg grating sensors. J. Power Sources 2019, 433, 226692. [Google Scholar] [CrossRef]
  18. Qin, P.; Wang, S.; Cheng, Y.; Jiang, L.; Duan, Q.; Jin, K.; Sun, J.; Wang, Q. A novel algorithm for heat generation and core temperature based on single-temperature in-situ measurement of lithium ion cells. J. Power Sources 2022, 542, 231731. [Google Scholar] [CrossRef]
  19. Wang, Z.; Tong, X.; Liu, K.; Shu, C.-M.; Jiang, F.; Luo, Q.; Wang, H. Calculation methods of heat produced by a lithium-ion battery under charging-discharging condition. Fire Mater. 2019, 43, 219–226. [Google Scholar] [CrossRef]
  20. Wu, Y.; Wang, Y.; Yung, W.K.C.; Pecht, M. Ultrasonic Health Monitoring of Lithium-Ion Batteries. Electronics 2019, 8, 751. [Google Scholar] [CrossRef]
  21. Yu, Y.; Vincent, T.; Sansom, J.; Greenwood, D.; Marco, J. Distributed internal thermal monitoring of lithium ion batteries with fibre sensors. J. Energy Storage 2022, 50, 104291. [Google Scholar] [CrossRef]
  22. Zhang, X.; Han, Y.; Zhang, W.-P. A Review of Factors Affecting the Lifespan of Lithium-ion Battery and its Health Estimation Methods. Trans. Electr. Electron. Mater. 2021, 22, 567–574. [Google Scholar] [CrossRef]
Figure 1. Monitoring system architecture.
Electronics 12 03561 g001
Figure 2. Hardware structure diagram.
Electronics 12 03561 g002
Figure 3. Physical image of a battery.
Electronics 12 03561 g003
Figure 4. Temperature filtering.
Electronics 12 03561 g004
Figure 5. Current acquisition circuit and AD584 circuit.
Electronics 12 03561 g005
Figure 6. Host monitoring platform.
Electronics 12 03561 g006
Figure 7. Serial port configuration program.
Electronics 12 03561 g007
Figure 8. Visualization program.
Electronics 12 03561 g008
Figure 9. Data storage program.
Electronics 12 03561 g009
Figure 10. Data query and fitting program.
Electronics 12 03561 g010
Figure 11. Server program.
Electronics 12 03561 g011
Figure 12. Client program.
Electronics 12 03561 g012
Figure 13. Testing equipment.
Electronics 12 03561 g013
Figure 14. Local monitoring center.
Electronics 12 03561 g014
Figure 15. Local host computer, local monitoring center, and cloud platform interface.
Electronics 12 03561 g015
Figure 16. Data query and fitting function.
Electronics 12 03561 g016
Figure 17. High-temperature alarm function.
Electronics 12 03561 g017
Figure 18. Charging voltage curve.
Electronics 12 03561 g018
Figure 19. Discharge voltage curve.
Electronics 12 03561 g019
Figure 20. Current measurement accuracy test.
Electronics 12 03561 g020
Figure 21. Overcharging protection test.
Electronics 12 03561 g021
Table 1. Discharge voltage error comparison.
NOMeasured ValueTruth ValueError
13.483.4810.001
23.653.6460.004
33.743.7370.003
43.833.8320.002
53.923.9210.001
63.963.9610.001
74.034.0260.004
84.114.1140.004
94.174.1730.003
104.24.20
Table 2. Charging voltage error comparison.
NOMeasured ValueTruth ValueError
14.074.0730.003
23.913.9060.004
33.723.7150.005
43.623.6160.004
53.493.4920.002
63.473.4690.001
73.443.4370.003
83.333.3330.003
93.073.0710.001
102.782.7770.003
Disclaimer/Publisher’s Note: The statements, opinions and data contained in all publications are solely those of the individual author(s) and contributor(s) and not of MDPI and/or the editor(s). MDPI and/or the editor(s) disclaim responsibility for any injury to people or property resulting from any ideas, methods, instructions or products referred to in the content.

