1. Introduction
Explosion fields can result in significant destruction, mainly through shock wave overpressure, fragmentation, and thermal damage. Contemporary studies in this domain primarily focus on the first two damage types, as the range of harm caused by shock wave pressure and fragments tends to be more extensive than that caused by thermal damage. Moreover, the transient thermal effect within the explosive field is brief, and the testing conditions are arduous. This has led to a scarcity of effective testing methodologies that simultaneously offer superior dynamic characteristics and impact resistance [
1]. A particularly challenging aspect is the study of the thermal damage mechanism of explosive fireballs (high-temperature, high-pressure luminous gas masses formed around the detonation core) in enclosed and partially enclosed explosive locations, an area that has become a significant research focus both nationally and internationally.
In thermal damage assessments of explosive fields, Huang Lei et al. utilized an HFM-6D/H heat flux sensor to examine the explosive thermal effects of liquid-solid composite aluminium-containing agents and investigated the fireball’s thermal radiation and heat convection following a shock wave [
2]. However, their attribution of the second peak to heat convection’s influence requires further validation. Chen Aiyan’s team employed an E12 thermocouple to measure a 27 kg TNT explosion temperature and a G25 Gardon gauge to ascertain heat flux, theoretically exploring the correlation between temperature and heat flux [
3]. Regrettably, the Gardon gauge’s response time of up to 100 milliseconds led to significant dynamic errors in the test results. Ji Jianrong et al. gathered explosion field temperature data using a custom WRe5/26 thermocouple and computed heat convection flux via the lumped parameter method. This method’s accuracy hinges on the thermocouple’s thermophysical property parameters, and neglect of fireball thermal radiation results in a substantial error in the heat flux density calculation [
4]. Zhang Junfeng and team utilized a thermal-capacitive type sensor to gauge heat flux density in confined spaces, but the sensor’s considerable response time hindered the capture of the peak value’s rising stage of explosion heat impact [
5]. Recently, Zhipeng Liu and others employed single-crystal Bi
2Te
3 to create an atomic layer thermopile (ALTP) heat flux sensor with a 51 μs rise time for measuring thermal flux values in explosion-driven shock tubes but did not perform large-equivalent reagent field tests [
6].
Internationally, researchers like Samuel Goroshin et al. evaluated the detonation heat of 1 kg of sensitized nitromethane using a rapid response spectrometer in conjunction with a tri-color pyrometer. The explosive fireball’s progression can be systematically divided into three separate phases. 1. **Initial Phase**: This stage is characterized by the intense light radiation convergence on the detonation’s exterior surface, the adiabatic compression of air within the shockwave, and the presence of high-temperature explosive residues. This process undergoes swift attenuation, occurring merely 0.5 ms after the detonation event. 2. **Second Phase**: During this period, a low-amplitude spike emerges as the ground-reflected shockwave combines with and intensifies the fireball’s spectral radiation. 3. **Third Phase**: This final stage indicates that the dispersed fuel integrates with the ambient air, initiating secondary combustion [
7]. Min-Gyu Jeon and associates applied the TDLD (tunable diode laser detection) method to determine the blast temperature of a small equivalent TNT charge inside a shock tube. However, the test temperature was limited to 119 °C, and the response rate was found to be 20.7 ms faster than that of the thermocouple [
8]. Further, R.C. Ripley and co-workers theorized that the near-field overpressure impulse of metallized explosives originates from the complex interaction between the ground-reflected shockwave and the fireball. This interaction contributes to the reheating of the detonation byproducts and the deformation of the fireball interface, thus promoting subsequent post-combustion chemical reactions [
9]. This line of investigation provides valuable insights for exploring the behavior of near-ground explosion heat, particularly from the viewpoint of explosion shockwave overpressure.
In summary, traditional contact heat flux sensors are constrained by their slow spectral response speed, rendering them incapable of accurately measuring radiant heat flux at the moment of explosion. Non-contact optical devices are similarly limited, only detecting the intensity of heat radiation from the explosive fireball. Neither approach allows for a fast and precise test of composite heat flux in the explosion field. However, with its ultra-fast spectral response and capability to test convective heat transfer, the atomic layer thermopile sensor (ALTP) emerges as a potentially effective device for composite heat flux tests under large-equivalent thermobaric explosion environments. The challenge lies in the lack of application experience and analytical methods under such demanding conditions.
Before explosive field testing, it is essential to complete both the static calibration and dynamic performance evaluation of ALTP in a laboratory setting. Zhipeng Liu utilized a 915 nm wavelength laser for the static calibration of the sensor, yet this single wavelength radiant heat flux diverges fundamentally from the actual thermal radiation of explosive fireballs [
6]. T. Meier innovatively contrasted the static calibration results of ALTP under two boundary conditions: laser heat radiation and impinging jet convection heat transfer. However, the large number of measured parameters led to significant uncertainty [
10]. The dynamic response of ALTP under thermal convection remains an unexplored area of study. Huber K et al. compared the calibration of various heat flux sensors in both radiation- and convection-based sub- and supersonic operations. They discovered that sensitivity transfer between radiation-calibrated sensors used in predominantly convective environments is not always feasible, potentially leading to substantial systematic errors [
11]. They were also the first to apply ALTP to measure heat flux on an internal combustion engine’s combustion chamber wall, recording values as high as 1250 W/cm
2 [
12]. Furthermore, Huber, K and Rodiger, T introduced a novel atomic layer thermopile sensor capable of directly measuring temperature and heat flow simultaneously. Tests on the subsonic hot air jet’s hysteresis point yielded good agreement, offering a new method for testing the thermal parameters of engine combustion chambers and hypersonic vehicle surfaces [
13]. Recent work by Chen, X et al. prepared an ALTP heat flux sensor with a sensitivity of 0.017 mV/(kW/m
2), though they did not discuss the thermoelectric output characteristics of the sensor under thermal convection boundaries [
14]. Chen Suyu’s comparative calibration of ALTP through shock wind tunnel experiments produced relatively stable measurements under varying flow field parameters [
15], despite the high cost of such experimentation. The preceding research has predominantly focused on ALTP’s static calibration under convective boundaries, neglecting the sensor’s dynamic performance under convective heat flux excitation. If experimental methods are employed to analyze ALTP under the thermal convection boundary, the error may be considerable and the costs high due to the extensive number of parameters measured.
In view of the above difficulties in the composite heat flux test of explosion field, the significance of this research is the development of an ultra-fast response atomic layer thermopile heat flux sensor (ALTP), a novel application in the large yield explosion measurement domain. The sensitivity calibration of ALTP was conducted using a high-temperature blackbody source, more closely approximating the spectral radiation characteristics of an explosive fireball compared to the single-wavelength lasers of previous studies. By pulsed laser transient measurement, the temporal resolution of ALTP was found to surpass that of the thermal resistance thin film heat flux sensor (TFHF). This ensures ALTP’s capability to promptly measure thermal radiation from intensely illuminated fireballs during explosive initiation. Recognizing the lengthy thermal interaction time between the high-temperature flow generated by the explosive field and the sensor, a first-ever three-dimensional static and dynamic model of high-temperature jet impact based on ALTP was established. This simulation model, encompassing turbulence, solid and fluid heat transfer, and the thermoelectric effect, visually analyzes different flow field parameter influences on ALTP. It offers a fresh method for examining both the static and dynamic characteristics of ALTP under heat convection boundaries. In static simulation, the influences of fluid velocity and temperature on ALTP’s sensitivity drift were explored. Dynamic simulation innovatively assessed the effects of factors such as fluid velocity, temperature, ALTP-jet outlet distance, and sensor surface temperature on ALTP’s dynamic properties. The high costs and complex error analysis typically associated with shock wind tunnel tests and multi-parameter heat gun experiments were circumvented. It also provides a new way to analyze the error of explosive heat flux measurement caused by sensitivity fluctuation and insufficient dynamic performance. During thermobaric explosive testing, ALTP successfully performed heat flux assessments in both semi-closed and open environments, reflecting the explosive fireball’s radiation and convective heat action process. The presence of two distinct peaks in the test curves was confirmed using fast-response tungsten-rhenium wire thermocouples. The results highlight ALTP’s unique advantage in explosive field heat flux measurements, attributed to its ultra-fast spectral response and convective heat transfer characteristics. It allows for rapid detection of composite heat flux, making it an irreplaceable alternative to traditional contact heat flux sensors and optical heat measurement instruments.
2. Working Principle of ALTP
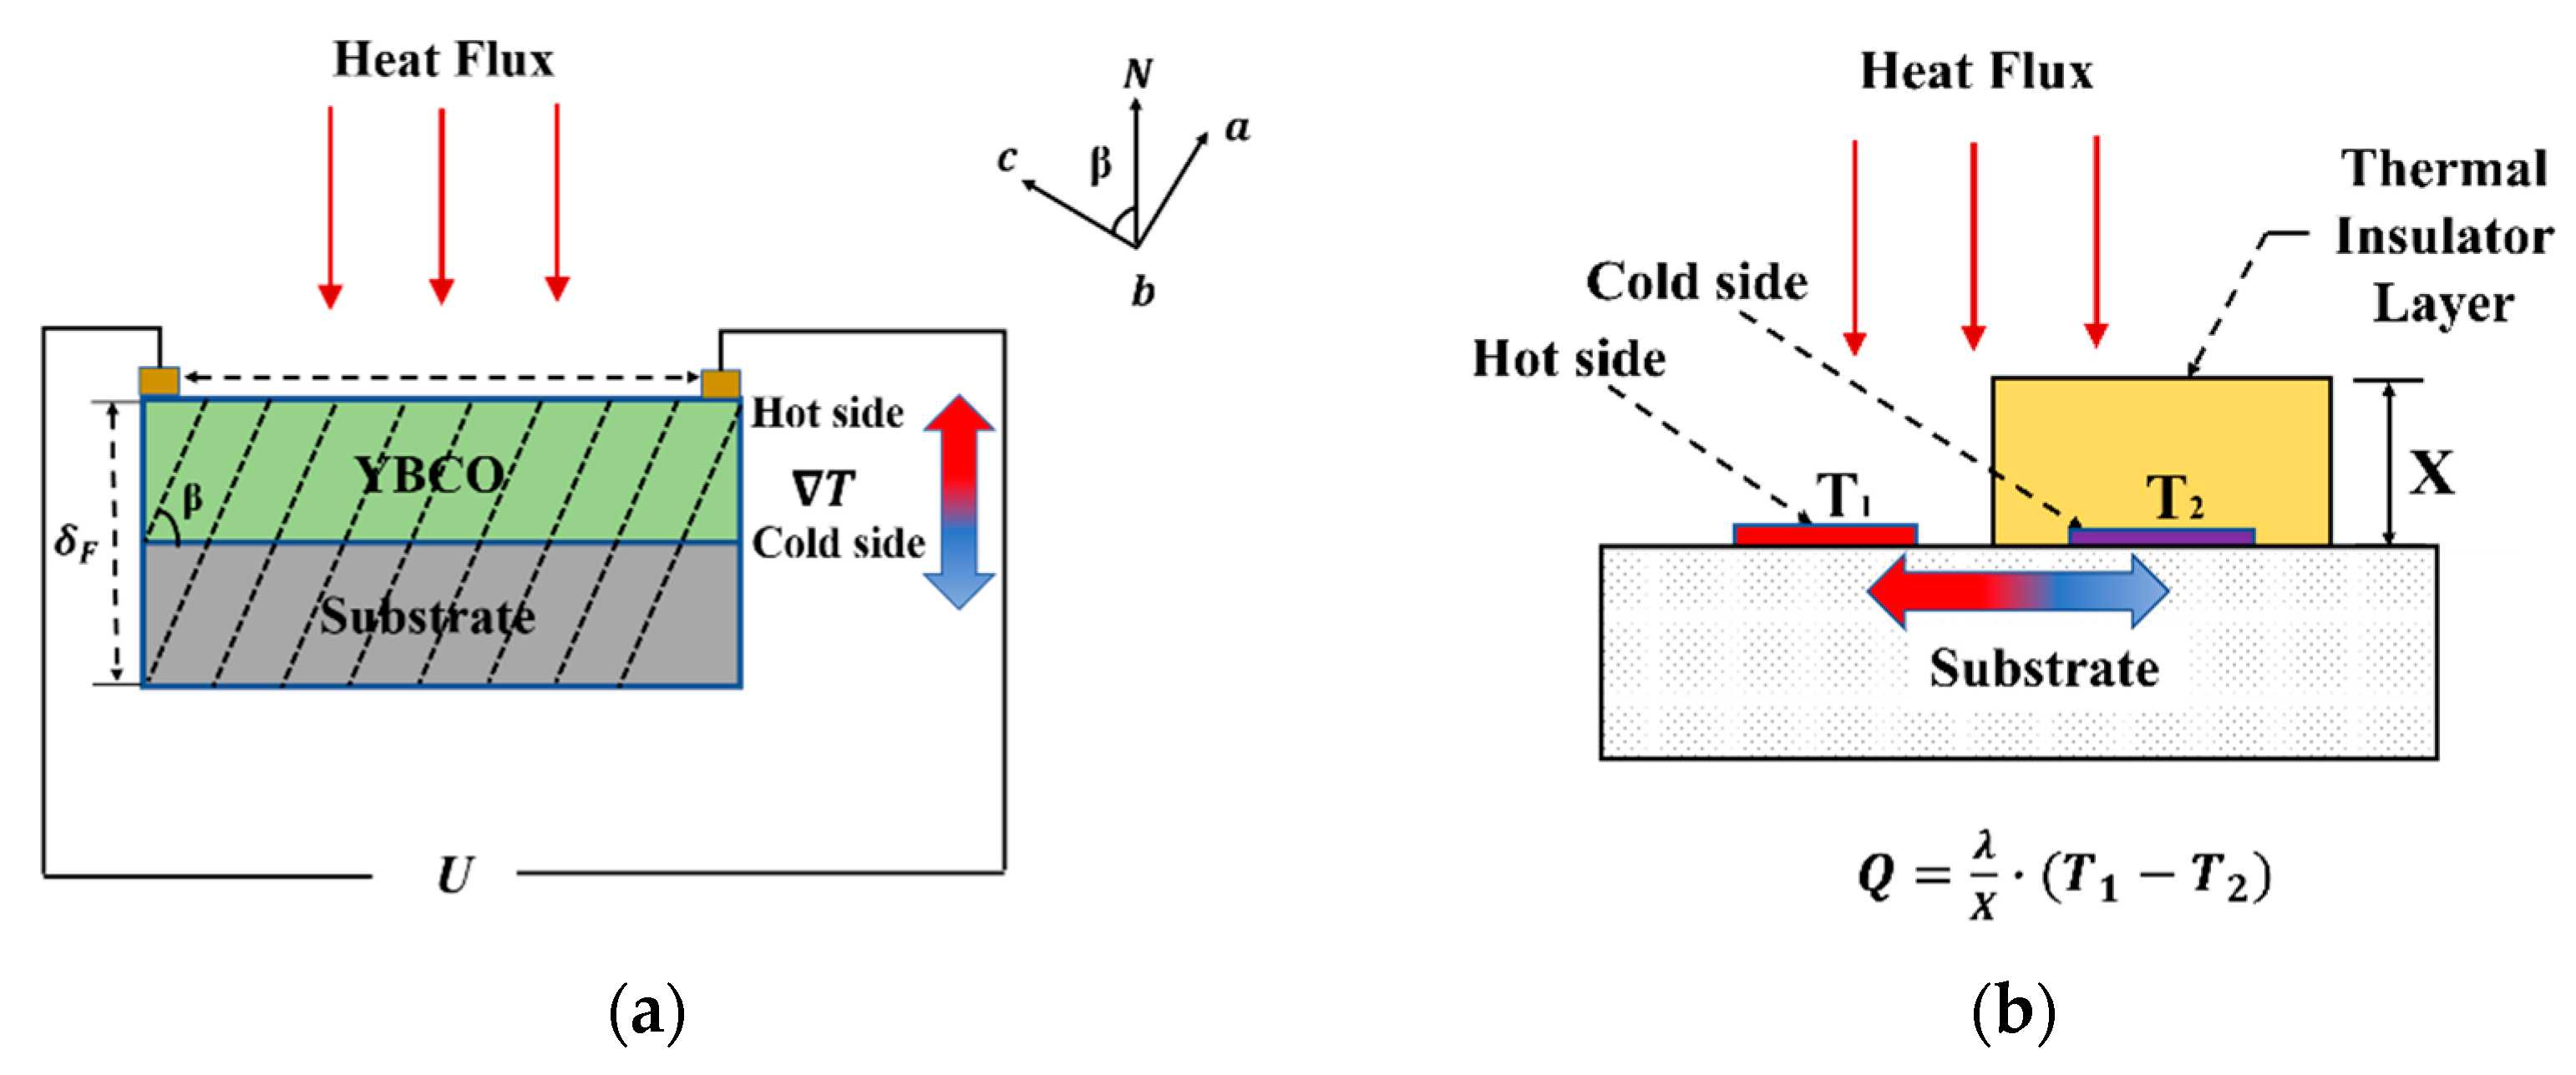
The operational principle of the ALTP designed in this research is founded on the thermoelectric potential (transverse Seebeck effect) generated by the temperature gradient on the YBa
2Cu
3O
7 crystal (YBCO). As illustrated in
Figure 1a’s cross-section, the sensitive layer comprises the CuO
2 and YBCO layer (thickness 200 nm). The thin film was cultivated on the substrate (LaAlO
3) through the laser ablation technique. Because this material is more conducive to the growth of single crystal YBCO film with a tilted angle on its surface and is easy to process, the substrate can be cut at a specific angle
(53°) of the crystal plane, and the entire sensor can be considered an atomic layer thermopile due to the formation of a series of atomic thermocouples between the CuO
2 and YBCO layers. When a temperature gradient occurs on the hot and cold sides of the YBCO film, the generated thermoelectric potential
can be expressed as:
where
represents the second-order Seebeck tensor and
represents the temperature gradient on the hot and cold sides of sensitive films, as depicted in
Figure 1a. When the tilt angle of the YBCO crystal is
, the Seebeck tensor
can be expressed as:
In Equation (2),
and
denote the Seebeck coefficient components of the YBCO thin film along the
axis and within the
plane orthogonal to the
-axis, respectively. YBCO films absorb radiant or convective heat flux, generating longitudinal temperature gradients on their upper and lower surfaces [
10]. For unit-length YBCO films, the thermoelectric potential component of
in the horizontal direction equals
. Given a film crystal length of
, the thermoelectric potential produced along the
direction is
. According to Equation (3),
represents the film thickness,
represents the temperature difference between the film’s upper and lower surface, and
.
Traditional TFHF relies on temperature gradients created by a thermal insulator layer. The thermoelectric effect in TFHF is contingent on a series of thermocouples, as illustrated in
Figure 1b. The TFHF response rate is inversely proportional to the thermal insulator layer thickness, while its sensitivity is directly proportional to the thickness of the thermal resistance layer. This dual dependence presents a challenge in balancing the dynamic characteristics and resolution of the heat flux test [
16]. Furthermore, lateral heat conduction between the TFHF’s cold and hot sides may introduce errors in the longitudinal intake heat flux measurements. In contrast, both the temperature difference generator and thermoelectric conversion element of the ALTP are YBCO crystals, obviating the need for a thermal insulator layer to generate the temperature gradient. The uniform horizontal temperature distribution minimizes lateral heat transfer errors, addressing the sensitivity and response speed optimization issue of TFHF, which are typically inversely proportional. The ALTP can be adjusted by reducing the crystal thickness to enhance response speed or by increasing the crystal width to improve sensitivity.
3. Sensitivity Test of ALTP via High-Temperature Blackbody Radiation
The sensitivity of ALTP was measured to be 0.022 mV/(kW/m
2) after static calibration with a high-temperature blackbody furnace, slightly exceeding the 0.017 mV/(kW/m
2) reported in reference [
14]. The furnace, which incorporates a graphite tube heating body and a quartz glass window, serves as a standard heat source, radiating stable heat for the flux measurement system. In the experiment, the GD-B3-50K Gardon gauge acted as the standard heat flux sensor, with its output value serving as the benchmark. The DAQ6510 multi-loop digital display meter collected the thermoelectric potential signal from both the ALTP and Gardon gauges. The output values of the Gardon gauge and the ALTP were recorded in the blackbody furnace’s temperature range of 1000 °C to 1450 °C, with a sampling interval of 50 °C. At each temperature point, a 5 min waiting period was observed to record the data from DAQ6510 when the ALTP’s thermoelectric output stabilized. Then, the Gardon gauge was placed in the same position via a 3D displacement platform, thus completing the comparative calibration experiment.
To ensure the same amount of thermal radiation was received by Gardon and ALTP, blackbody paint with an absorption rate of 0.95 was sprayed on the surface of both the Gardon gauge and ALTP. Compared with laser thermal radiation, blackbody thermal radiation can avoid the spectral dependence of a single wavelength on the surface of the sensitive element and is closer to the thermal radiation generated by the high-temperature fireball in the explosion field. The calibration system and the linear fitting results of the sensitivity are shown in
Figure 2.
The uncertainty sources of this calibration mainly include two types: the uncertainty caused by statistical error is class A, and the uncertainty caused by the factory error of the equipment is class B. Each uncertainty component is shown in
Table 1. The relative expanded uncertainty is 6.43%, calculated by equation
, and the confidence probability is 95% (k = 2).
4. Transient Measurement of ALTP via Pulsed Laser Radiation Heat Flux
Findings from relevant researchers indicate that thermal effects in an explosion field stem from the interplay of fireball thermal radiation and shock wave thermal convection. As the typical detonation reaction time for explosives is in the order of microseconds, conventional contact heat flux sensors struggle to capture these effects without distortion.
Given the research foundation, achieving an accurate transient radiant heat flux measurement at the moment of detonation with ALTP requires high temporal resolution. This section utilizes a semiconductor laser to initially gauge ALTP response time. This method is preferred over using blackbody furnaces, graphite plates, or halogen lamps, as the high-frequency response characteristic of the heat flux sensor can be assessed via a narrow-pulse laser. The laser’s parameters include a maximum power of 6000 W, a minimum pulse width of 10 μs, and a wavelength of 915 nm in the infrared region under monopulse emission mode. The test system comprises a semiconductor laser, function generator, collimator, focusing lens set, high-speed infrared radiation thermometer, a THORLABS DET10A/M silicon photodetector (rise time 1 ns, wavelength range: 200 nm–1100 nm), and a data acquisition system incorporating an anti-aliasing signal amplifier. The function generator modulates the laser’s output signal for different pulse widths, and the beam-shaping component is tasked with collimating and focusing the laser with a divergence angle. The photodetector monitors the laser’s output signal, while the radiation thermometer continuously measures ALTP’s surface temperature to avoid exceeding the rated temperature during calibration.
Figure 3 delineates the principle of the test system.
The laser was configured at a power of 3000 W, and pulse widths were set at 50 μs, 40 μs, 30 μs, 20 μs, and 10 μs, respectively.
Figure 4a displays the corresponding test curve derived from the data acquisition system. The amplitude of the ALTP impulse response is observed to remain stable at 0.22 V. Experimental results affirm that the amplitude of the ALTP’s impulse response stays virtually undistorted, reflecting excellent dynamic performance even as the laser pulse width decreases. Under the current experimental conditions, the fastest response time of the ALTP is 10 μs. According to reference [
7], the rise time of a high-brightness fireball’s thermal radiation at the moment of initiation is approximately 40 μs, allowing the ALTP to theoretically detect the radiant heat flux in an explosion field.
Figure 4b illustrates the TFHF’s experimental results under varied laser pulse durations (0.3 ms to 3 ms) [
17]. A reduction in pulse width results in the TFHF’s potential output value decreasing from 0.05 V to 0.032 V, with a pronounced attenuation of amplitude. Utilizing the same laser power, the TFHF can only respond to millisecond laser pulses, and the sensor’s output signal amplitude diminishes progressively to the sub-millisecond range, leading to increased distortion. Consequently, it can be inferred that the ALTP’s temporal resolution is markedly superior.
The response time error of ALTP was also examined with respect to uncertainty. Class A uncertainty (μA) was found to be 0.096 μs after repeated testing with consistent parameters, while class B uncertainty (μB) was primarily influenced by the acquisition device’s sampling rate (10 MHz), measured at 0.057 μs. Subsequent calculations revealed an extended uncertainty of 0.195 μs, with a temporal resolution confidence interval of 10 ± 0.195 μs, at a 95% confidence level.
5. Simulation Analysis of ALTP via Convective Heat Flux
In this section, the COMSOL Multi-Physical Finite Element Simulation technology was employed to investigate the factors influencing the ALTP’s static and dynamic characteristics under high-temperature jet impact. To align closely with real experimental conditions, the simulation model integrated two physical fields, non-isothermal flow and thermoelectric effect, and analyzed five dependent variables: turbulent kinetic energy, pressure, temperature, velocity field, and electric potential. Utilizing a computer with a CPU frequency of 3.6 GHz and 24.0 GB of Random Access Memory (RAM), the static simulation model averaged an operation time of 125 min, while the transient model required 23.2 h [
18,
19].
5.1. Design of Finite Element Model
As depicted in
Figure 5, the ALTP sample was positioned in an open space at a specific distance from the jet outlet. To reduce computational load, the geometric model was simplified using the plane of symmetry, resulting in 27,117 mesh cells with a total degree of freedom of 434,876. The k-ω model, founded on the Reynolds average method (RANS), was applied to analyze turbulent kinetic energy and turbulent dissipation rate, incorporating wall functions near the wall. Due to the strong nonlinearity induced by turbulence in ALTP geometry, efforts were made to avoid large aspect ratios, leading to the establishment of a non-scaled-up model. This choice, however, did not affect the qualitative analysis of ALTP. The thicknesses of the sensitive layer YBCO and substrate material LaAlO
3 are 20 μm and 0.1 mm, respectively, with the ALTP’s distance from the jet outlet set at 0.3 mm [
20,
21].
5.2. Analysis of Influencing Factors of ALTP Static Characteristics
In the combined solid and fluid heat transfer physical field interface, the initial temperature of the geometric domain is set at 293.15 K. Upstream temperatures () at the jet inlet are defined as 973.15 K, 873.15 K, 773.15 K, and 673.15 K, respectively. Since the ALTP is in an open space, heat convection primarily facilitates the heat transfer between the sensor’s upper surface and the high-temperature jet. Surface radiation boundary conditions are applied to the sensor’s side and bottom surfaces, with surface emissivity determined by material properties and the ambient temperature maintained at 293.15 K.
In the turbulent physical field interface, both the initial values of the velocity field and pressure throughout the geometric domain are set to 0 m/s and 0 Pa, respectively, and a 9 m/s velocity () boundary load is applied to the jet inlet. The relative static pressure of the boundary in the open space remains at 0 Pa, with reflux inhibited. In the physical field interface affected by YBCO with the sensitive film, the initial value of the potential is 0 V, with the sensitive film’s right-end face designated as the ground boundary. The ALTP’s normal convective heat flux, surface temperature, and horizontal potential difference were recorded using boundary probes in the software.
The standard k-ω model is used to calculate the flow field, which has high accuracy for the inverse pressure gradient and is suitable for the simulation of jet problems. Assuming that the gas in the flow channel is incompressible, the governing equation for turbulent kinetic energy
k is:
The governing equation of turbulent dissipation rate
ω is:
where
is the density,
is the turbulent viscosity coefficient,
is the fluid velocity, and
and
are the Pran coefficients of turbulent kinetic energy
k and dissipation rate
ω, respectively. The boundary condition of the jet inlet is shown in Equation (6), where turbulence intensity
= 0.05 and turbulence length
= 0.01 m.
For solid and fluid heat transfer interfaces, the governing equations is:
The jet inlet boundary conditions is:
The jet outlet boundary conditions is:
In Equations (7)–(9), the upstream temperature ()* = 873.15 K. The specific heat capacity at constant pressure, enthalpy change , heat source term , and other parameters can be determined by the thermal and physical properties of the material.
For example, with fluid temperature (
) = 873.15 K and fluid velocity (
) = 9 m/s,
Figure 6 illustrates the temperature distribution, flow field velocity distribution, pressure distribution, and sensitive layer potential distribution within the model. Subsequently, to investigate the influence of fluid velocity on the static characteristics of ALTP,
was set at 9 m/s, 8 m/s, 7 m/s, and 6 m/s, with
remaining constant at 873.15 K.
Table 2 summarizes the output voltage of the sensor (
U), the incident convective heat flux (
), and the surface temperature of ALTP (
).
After conducting linear fitting, it was observed that the ALTP’s linearity is satisfactory when the fluid velocity (
) is constant and the fluid temperature (
) is variable. Conversely, when Tf is constant and
varies, the ALTP’s linearity is suboptimal. Furthermore, the heightened calculated sensitivity indicates that
variations interfere with the sensor’s linearity. As illustrated in
Figure 7,
discrepancies modify the ALTP’s sensitivity under convective heat transfer, leading to measurement errors. By evaluating linear fittings 1 and 2, it becomes apparent that the sensitivity error caused by velocity variation is as much as 71%, a significant figure that cannot be overlooked. Reference [
10] determined the sensor sensitivity’s confidence interval, through a convection calibration experiment, to be
= 1.3 + 0.5 μVm
2/kW, exhibiting considerable fluctuation. Furthermore, the findings of reference [
11] emphasized that sensitivity transfer between radiation-calibrated sensors in convective settings may lead to severe systematic errors, underscoring the feasibility of the multi-physics simulation model devised in this work.
Additionally, it was discerned that variations in fluid velocity minimally affect ALTP surface temperature (), displaying a positive correlation with flow rate. This relationship reveals that the sensor output’s linearity is not governed by Ts, but rather is significantly influenced by irregular flow field disturbances induced by changes in . It is worth noting that thermal radiation calibration is unaffected by this issue.
5.3. Analysis of Influencing Factors of ALTP Dynamic Characteristics
To investigate the interplay between ALTP’s dynamic response and flow field parameters such as fluid temperature, fluid velocity, and distance between ALTP and jet outlet (AOD), a dynamic simulation model for ALTP jet impact was created. The boundary condition settings resemble those of the static model, but a discrete transient solver was employed. A total of nine controlled simulation experiments were executed, with varying boundary load parameters detailed in
Table 3. For dynamic models, the governing equation for turbulent kinetic energy
k is:
The governing equation of turbulent dissipation rate
ω is:
For solid and fluid heat transfer interfaces, the governing equations is:
It can be seen that only the transient term on the left side of the formula is added. As for the boundary condition equation, it is similar to the static model in
Section 5.2, so it will not be repeated.
Figure 8 depicts the model’s velocity distribution at different times. The ALTP’s positioning in open space at room temperature is notably distinct from the thermal convection phenomenon in the wind tunnel and is more representative of the sensor being exposed to high-temperature air resulting from an outdoor explosion field.
Table 3.
Set-points achieved by jet impact of ALTP.
Table 3.
Set-points achieved by jet impact of ALTP.
| Emulation Number | AOD (mm) | Tf (K) | Vf (m/s) |
|---|
| 1 | 0.05 | 893.15 | 6 |
| 2 | 0.05 | 893.15 | 8 |
| 3 | 0.05 | 893.15 | 10 |
| 4 | 0.05 | 893.15 | 15 |
| 5 | 0.25 | 893.15 | 15 |
| 6 | 0.35 | 893.15 | 15 |
| 7 | 0.35 | 793.15 | 15 |
| 9 | 0.35 | 993.15 | 15 |
The simulations’ results, as shown in
Figure 9a, reveal that
Vf profoundly influences ALTP’s dynamic response. An increase in air velocity enables the sensor to attain a steady state more rapidly, characterized by a smaller time constant and steady-state value. Chen Kangqi’s step response experiment on the Gardon gauge under a convective heat boundary validates the transient simulation model [
22].
Figure 9b exhibits the step response curve of ALTP surface temperature, indicating that the equilibrium time of surface temperature lags behind the heat flux. Furthermore,
Vf significantly impacts the sensor’s surface temperature, as the heat transfer efficiency (h) in the stagnation zone is primarily governed by the airflow Reynolds number (Re).
Figure 10a illustrates the response curves of ALTP at varying distances between ALTP and the jet outlet (AOD), as derived from simulations 4 to 6. The results demonstrate that an increase in AOD leads to a decrease in the steady-state value reached by the sensor, though the impact on ALTP’s time constant is minimal. Moreover, the thermoelectric potential output exhibits substantial fluctuations when the sensor is farther from the jet outlet. It is inferred that the influence of the fluid diminishes, and the interference from open space amplifies. As presented in
Figure 10b, an increase in fluid temperature augments ALTP’s steady-state value but leaves the time constant unaffected.
7. Conclusions
In this research, I engineered an ALTP heat flux sensor, exploiting the anisotropic Seebeck effect, performed static calibration via a blackbody furnace, and implemented it to assess composite heat flux in both semi-enclosed and open explosive settings. Acknowledging the swift nature of thermal radiation and the unique behavior of ALTP under convective boundaries during the explosion of a substantial equivalent agent, I completed the transient ALTP test using pulsed laser irradiation. Moreover, I established the finite element simulation model of ALTP under jet impact through COMSOL software, considering the high-temperature effects. By integrating turbulence, solid and fluid heat transfer, and the thermoelectric effect across three physical fields, the static and dynamic influence patterns of flow field parameters on ALTP were analyzed from a simulation standpoint. The following conclusions were reached:
- (1).
Owing to traceability calibration, ALTP exhibited a sensitivity of 0.022 mV/(kW/m2), and the uncertainty of static calibration was 6.43%. After the pulsed laser test, it had a time resolution of 10 μs, with a confidence interval of 10 ± 0.195 μs, at a 95% confidence level. In contrast to TFHF, ALTP demonstrated diminished amplitude response errors and negated errors stemming from lateral heat conduction.
- (2).
ALTP facilitated the capture of high-temporal resolution transient explosive heat flux curves, with the swiftest response recorded at 16 µs. The peak heat flux, measured at 3 m from the detonation center, reached 535 kW/m2 during a 1 kg thermobaric agent detonation test. Moreover, the radiant and delayed convective heat fluxes could be accurately distinguished based on the double-wave test curve.
- (3).
The peak timing of the armor-tungsten-rhenium thermocouples coincided with ALTP wave 2, with a deviation of less than 5 ms. This concurrence verified that the principal component of ALTP wave 2 was the convective heat flux following the explosion shock wave.
- (4).
A comparison with fluid temperature reveals that fluid velocity has a more pronounced interference with ALTP linearity, engendering sensitivity errors as substantial as 71%, as evidenced by simulation. In the transient simulation, the fluid velocity appears to constrain the time constant of ALTP, exerting a marked influence on the sensor surface temperature. Meanwhile, the distance between the sensor and the jet outlet, along with the fluid temperature, merely affects the steady-state value of the step response. This modeling approach offers an innovative method to scrutinize the performance of heat flux sensors in a forced heat convection environment, and it circumvents the errors stemming from multi-parameter testing during experimentation. The simulation findings are corroborated by the experimental conclusions presented in references [
10,
11,
18], affirming the reliability of both static and dynamic simulation models established in this research. Moreover, owing to constraints in experimental conditions, conducting pneumatic heating experiments to ascertain the usage error is problematic, as both cost and precision cannot be guaranteed. Thus, establishing correlations between parameters through simulation analysis holds practical significance.
The limitations of this study are evident in the minimal data obtained from the thermobaric explosion test, which hinders an effective error analysis from a statistical standpoint. Furthermore, the absence of recorded physical quantities, such as fluid velocity and pressure within the explosive field, leads to a failure in evaluating measurement accuracy from the angles of sensitivity fluctuations and dynamic errors.

