Article

Enhanced Infrared Detection Algorithm for Weak Targets in Complex Backgrounds

1
School of Optoelectronic Engineering, Changchun University of Science and Technology, Changchun 130022, China
2
Jilin Provincial Key Laboratory of Space Optoelectronics Technology, Changchun 130022, China
*
Author to whom correspondence should be addressed.
Electronics 2023, 12(17), 3671; https://doi.org/10.3390/electronics12173671
Submission received: 1 August 2023 / Revised: 25 August 2023 / Accepted: 28 August 2023 / Published: 31 August 2023

Abstract

:
In this article, we design a new lightweight infrared optical system that fully meets airborne settings and greatly reduces the collection of invalid information. This new system targets the technical problems of stray light, strong invalid information, weak texture information of small targets, and low intensity of valid information under a complex background, which lead to difficult identification of small targets. Image enhancement of weak, small targets against complex backgrounds has been the key to improving small-target search and tracking technology. For the complex information that is still collected, an improved two-channel image enhancement processing algorithm is proposed: the A-channel adopts an improved nonlinear diffusion method and improved curvature filtering, and the B-channel adopts bootstrap filtering and a local contrast enhancement algorithm. The weak target is then extracted by the algorithm of weighted superposition. The false alarm rate is effectively weakened, and robustness is improved. As a result of the experimental data analysis, the method can effectively extract the weak targets in complex backgrounds, such as artificial backgrounds, surface vegetation, etc., enlarge the target gray value, and reduce Fa by 56%, compared with other advanced methods, while increasing Pd by 17%. The algorithm proposed in this paper is of great significance and value for weak target identification and tracking, and it has been successfully applied to industrial detection, medical detection, and in the military field.

1. Introduction

The accurate detection of weak targets in infrared motion against a complex background is a technical challenge. Infrared weak target detection technology is the core technology in infrared detection systems, infrared early-warning systems, precision guidance systems, satellite remote sensing systems, and other systems, and its performance directly affects the subsequent implementation of accurate search, tracking, and other tasks for long-distance targets [1,2]. Currently, the main difficulties in infrared weak target detection include the following: the small size and lack of shape and texture information of such targets, the presence of serious background noise and clutter in infrared images, resulting in low signal-to-noise ratios (SNR) of the target and easy submersion in complex backgrounds, and the difficulty in obtaining a large number of target samples for extracting effective features based on previous experience due to the complexity and variability of the background of the infrared image [3]. Complex backgrounds comprise manmade structures and natural environments, including surface vegetation and mountain peaks, which have rich texture structures and high-infrared reflectivity, but low-infrared radiation. Furthermore, manmade structures such as roads, signs, and buildings exhibit different shapes and infrared characteristics. The simultaneous appearance of these factors on an infrared image can cause significant interference in the detection of weak targets. Traditional infrared weak target enhancement algorithms for coping with simple background infrared images mainly include detection algorithms of air domain filtering [4], time domain information and information entropy algorithms [5], and the top-hat transform (Top-Hat) algorithm [6]. These algorithms have good enhancement effects but are not applicable to infrared images with complex backgrounds because they are extremely robust.
In recent years, scholars have proposed numerous algorithms for weak target enhancement. One of these algorithms, suggested by Bai et al. [7], utilizes a double-layer ring structure to highlight the grayscale difference between the target and the background, thereby modifying the traditional morphological operator. However, while this algorithm is straightforward, it tends to diminish the brightness value of the target and does not yield significant improvements in the results. Another algorithm, put forth by Cai et al. [8], introduces the concept of local contrast to enhance the suppression of cluttered edges. Nevertheless, this algorithm proves to be ineffective in complex background scenarios with a low detection rate, as well as in artificial backgrounds. Gao et al. [9] proposed the infrared patch-image (IPI) detection method, which is capable of detecting both bright and dark small targets in an image. However, this algorithm exhibits high computational complexity, a long computation time, and a demanding hardware requirement. Li et al. [10] employed the DFT transform to calculate the amplitude and phase spectrum of an infrared image, and subsequently determined the spectral residual between the real target and its surroundings. However, the method suffers from a serious issue of false alarm. Conversely, Re et al. [11] trained the general representation of the target using offline training on a static infrared image dataset, and then learned the specific representation utilizing the target position in the initial frame during online training. The target motion model was predicted using the Kalman filter algorithm, leading to the completion of the infrared dim and small-target tracking operation. Nonetheless, this method suffers from a low detection accuracy, large errors, and low efficiency, resulting in suboptimal practical application.
In this paper, we design an airborne weak target detection system that includes an airborne infrared small-target optical acquisition system using a flight platform and an infrared weak target image processing system. We propose an optical system design and an infrared small-target image enhancement processing algorithm that perform well in complex backgrounds, with simple computation, a fast processing speed, and low hardware equipment requirements, improving the accuracy of weak target detection and reducing the false alarm rate.
The article is organized as follows: In the Introduction, the purpose and significance of this research are discussed, as are the current status of research and application areas. In the Methods Section, the theory and methods of the work are described in detail. In the Experiments and Results Section, the experimental process and evaluation criteria are described in detail, comparative experiments and ablation experiments are performed, and the results of the experiments are analyzed. The methods and algorithms proposed in this paper are discussed in the Discussion Section. Finally, research conclusions are drawn.

2. Materials and Methods

In this section, the proposed airborne infrared optical system design methodology and infrared image enhancement algorithm for weak target detection in complex backgrounds are discussed in detail.

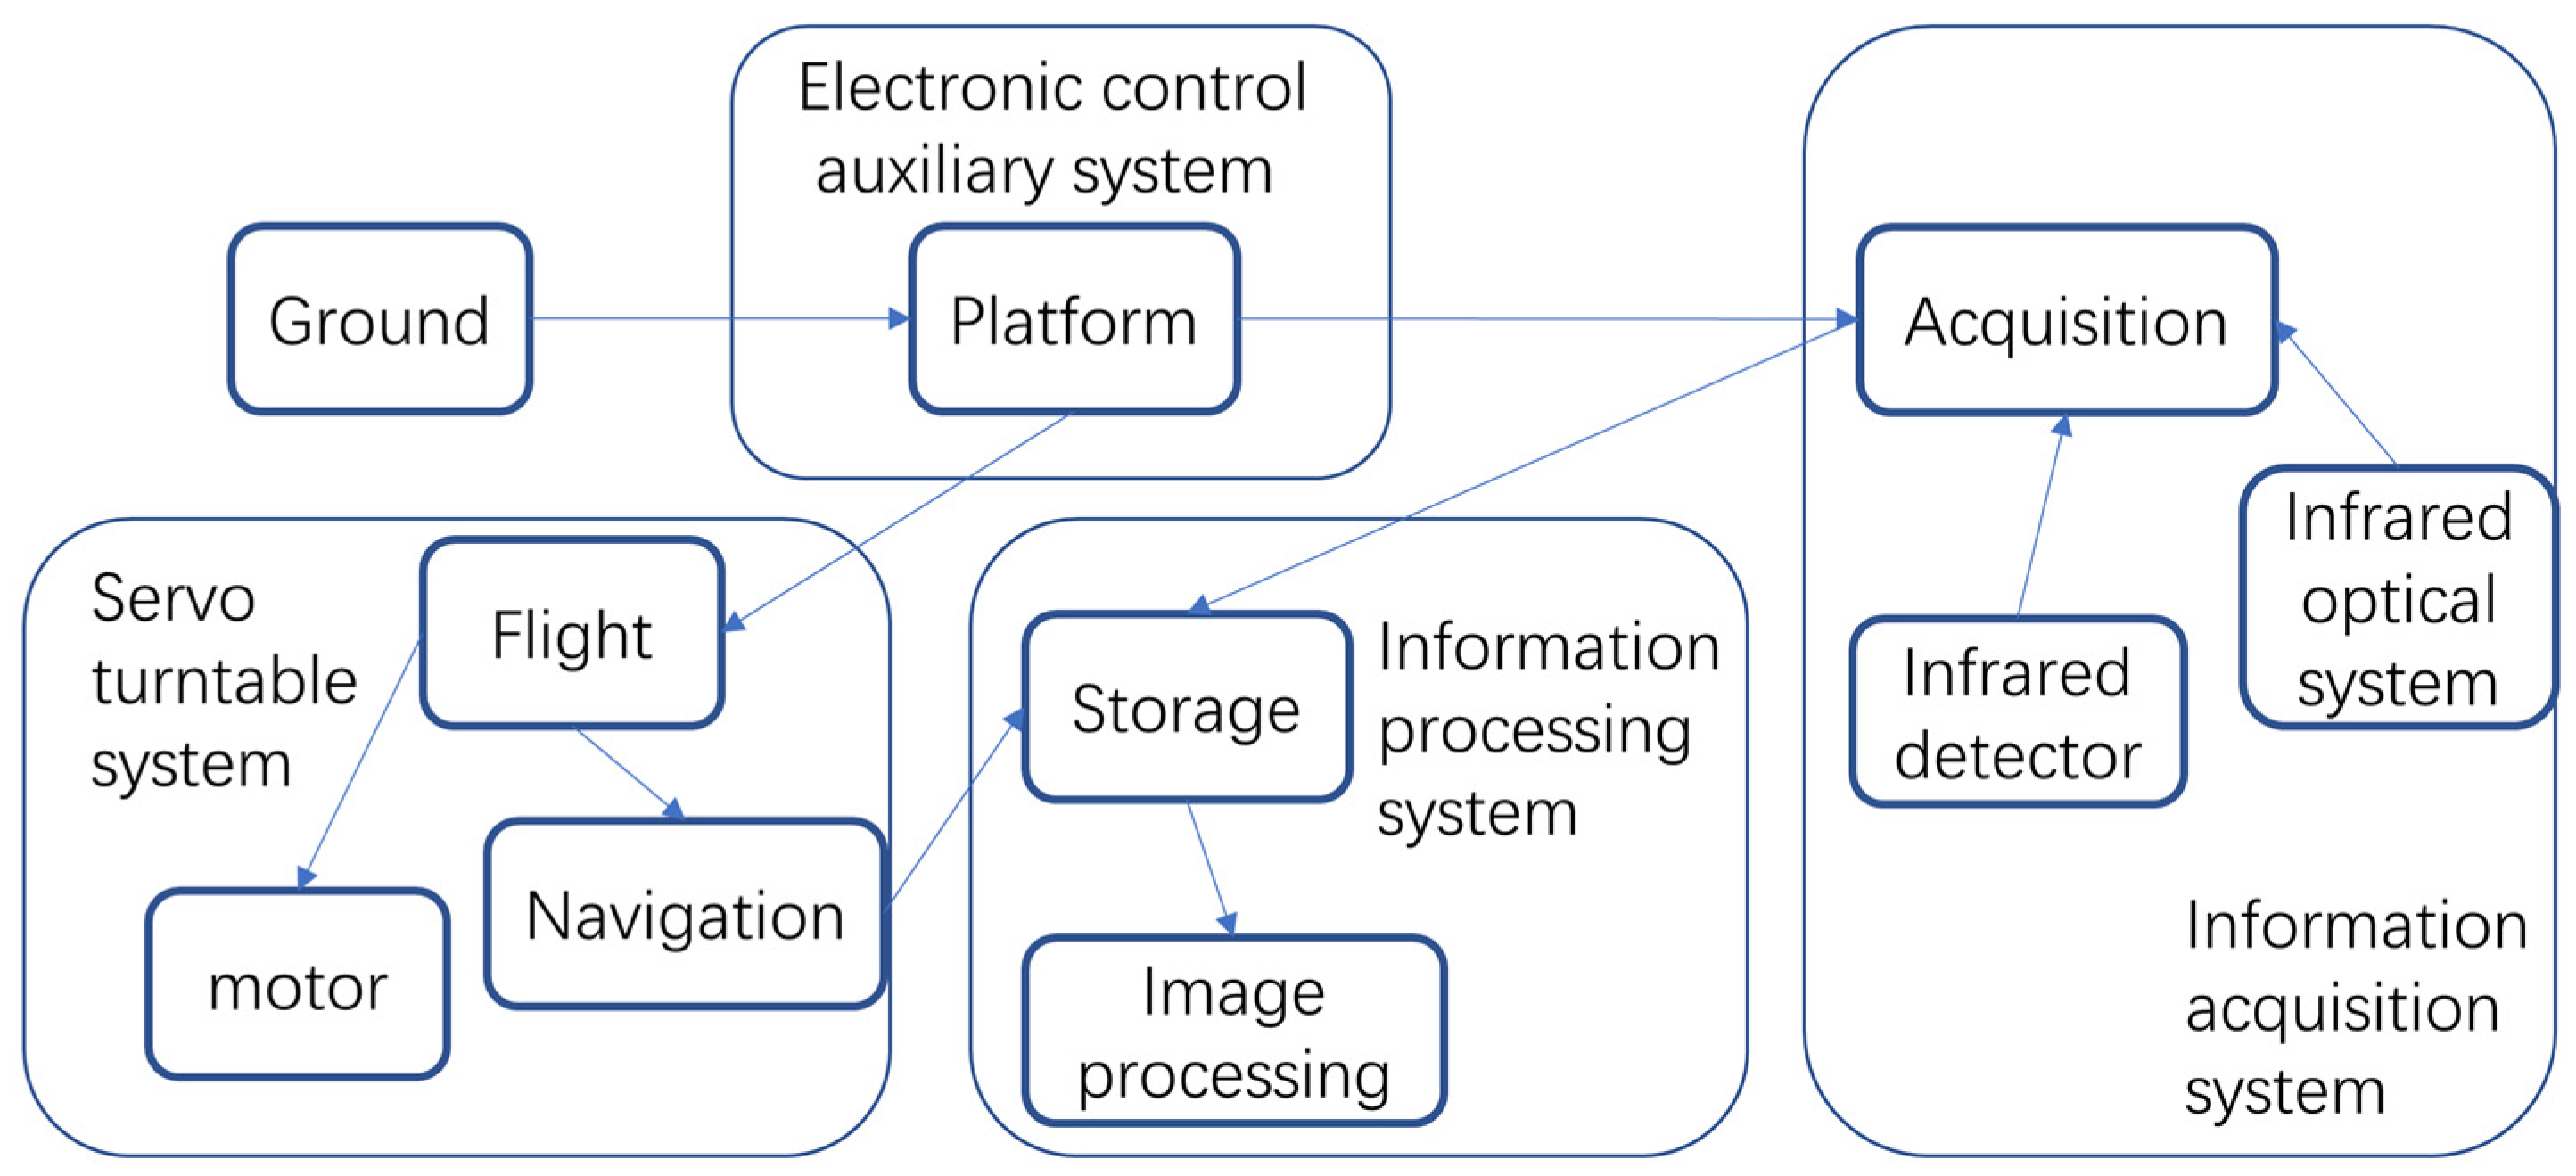
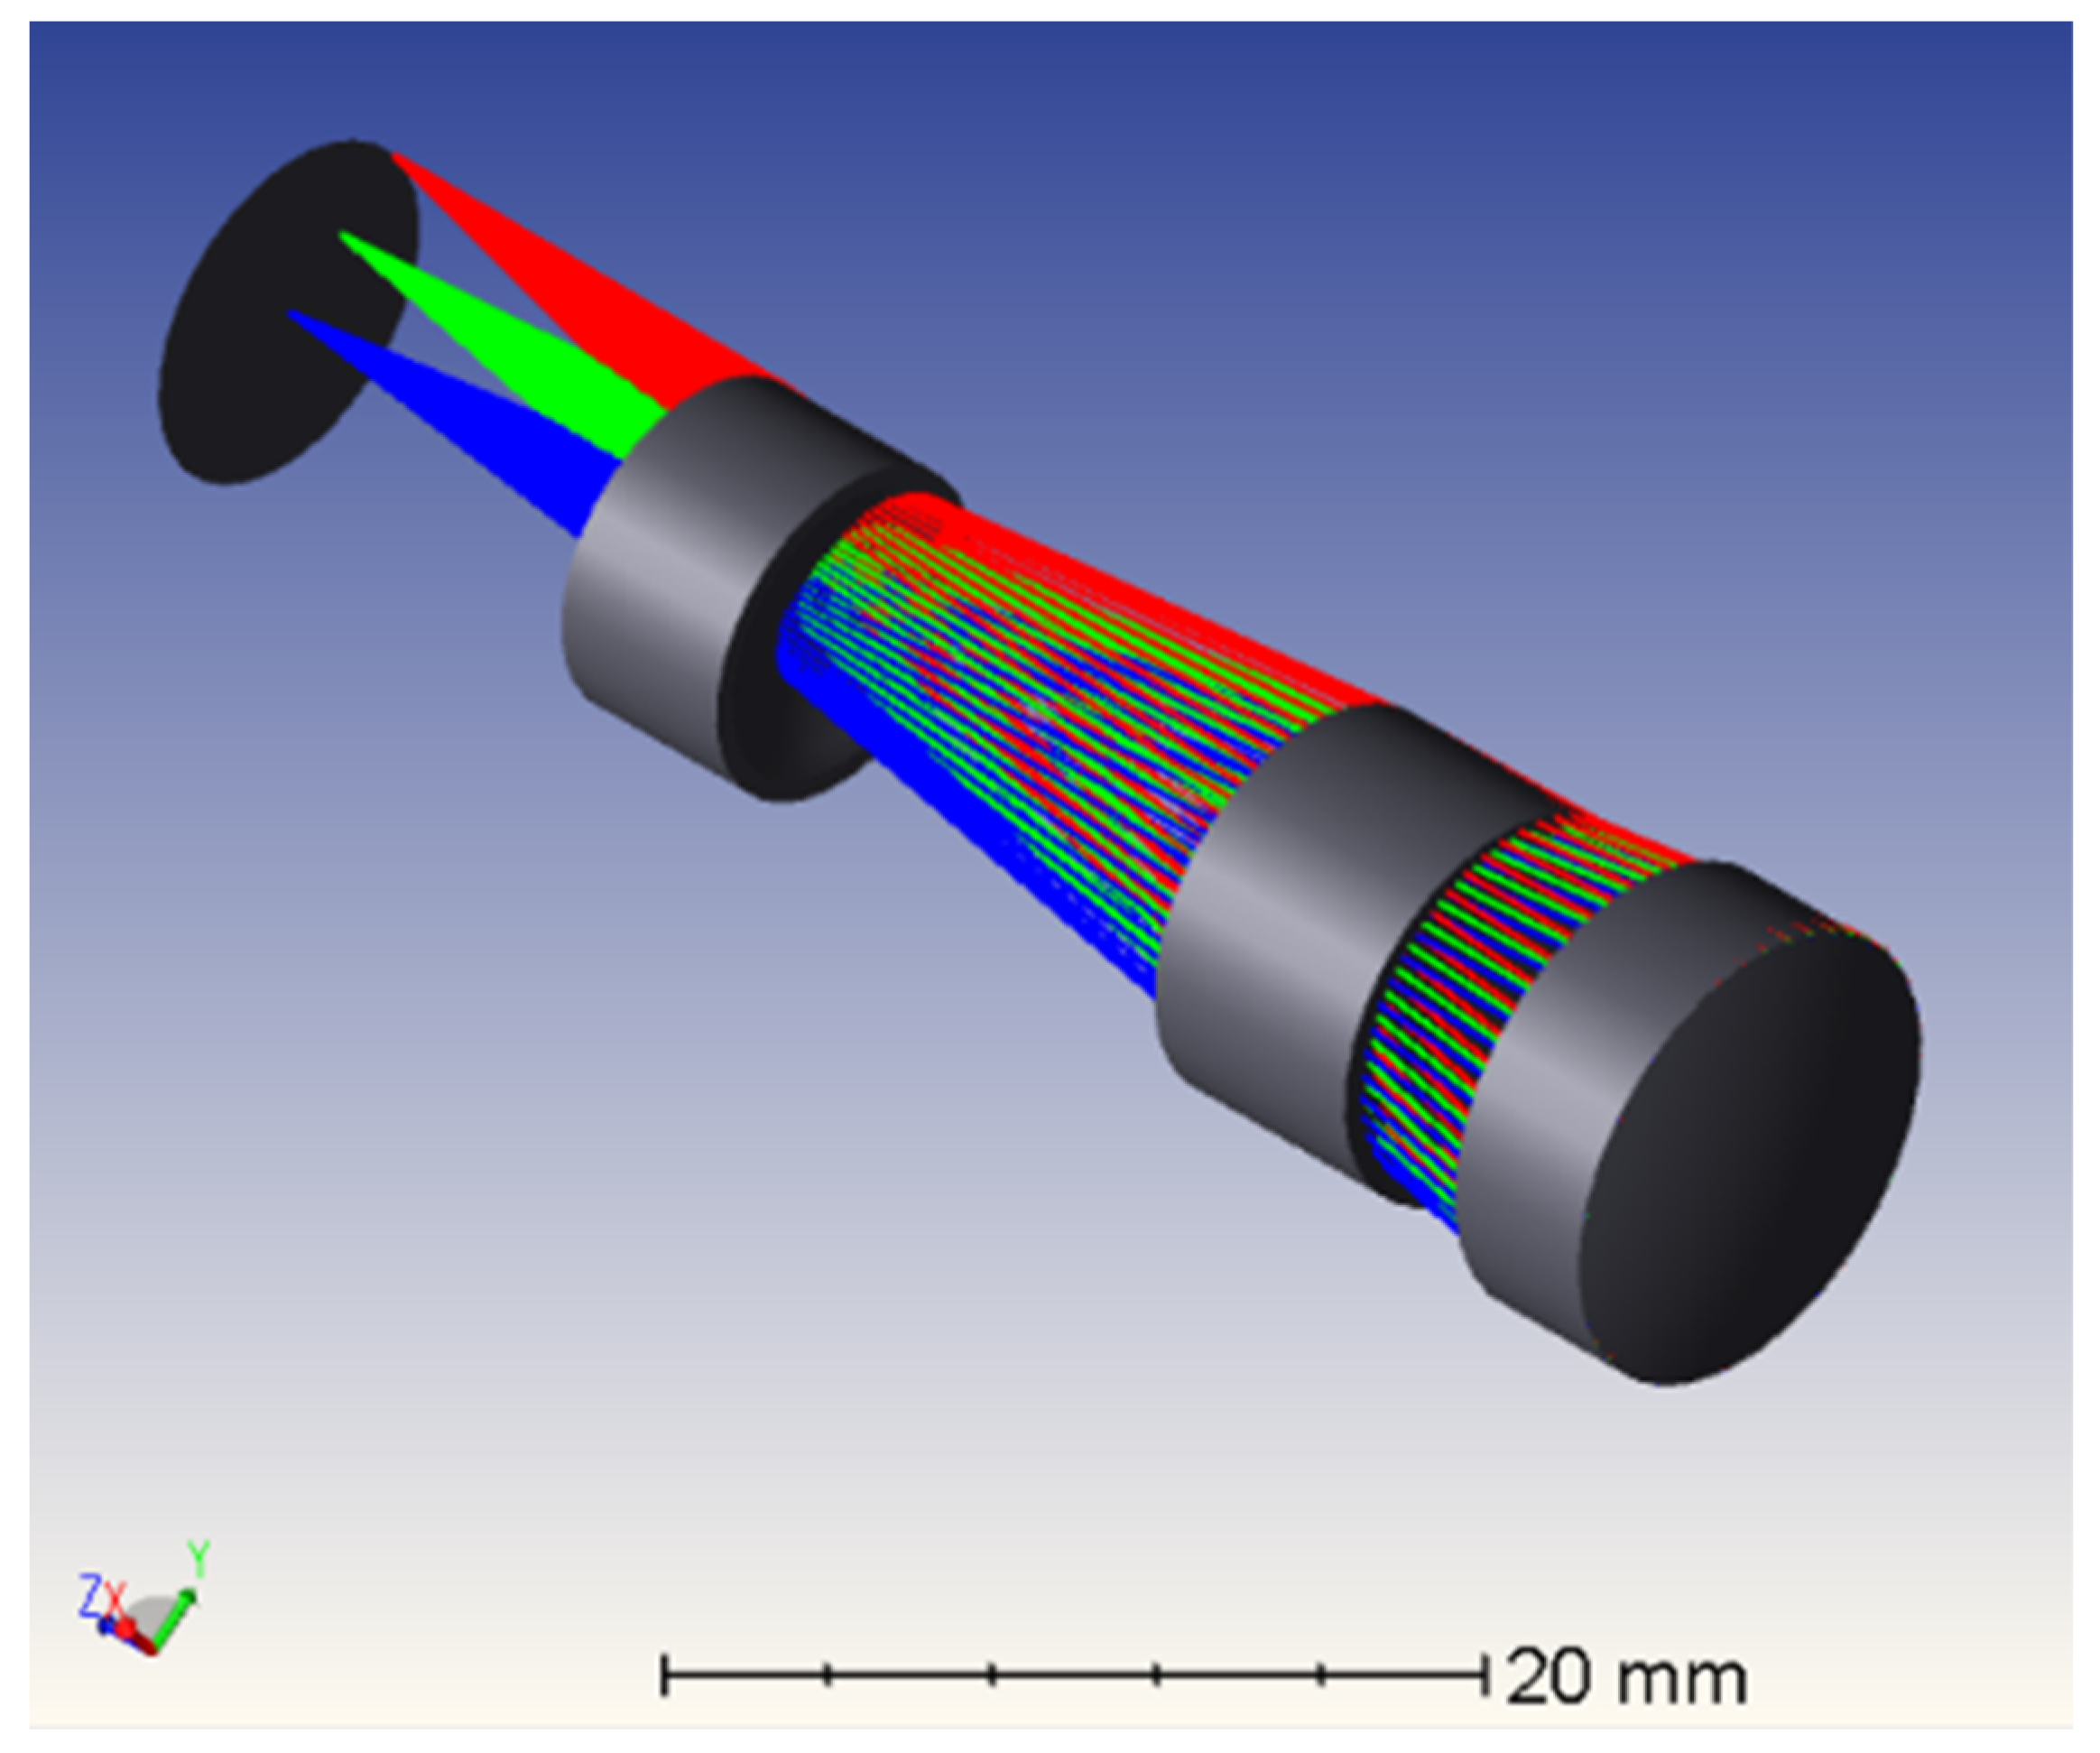
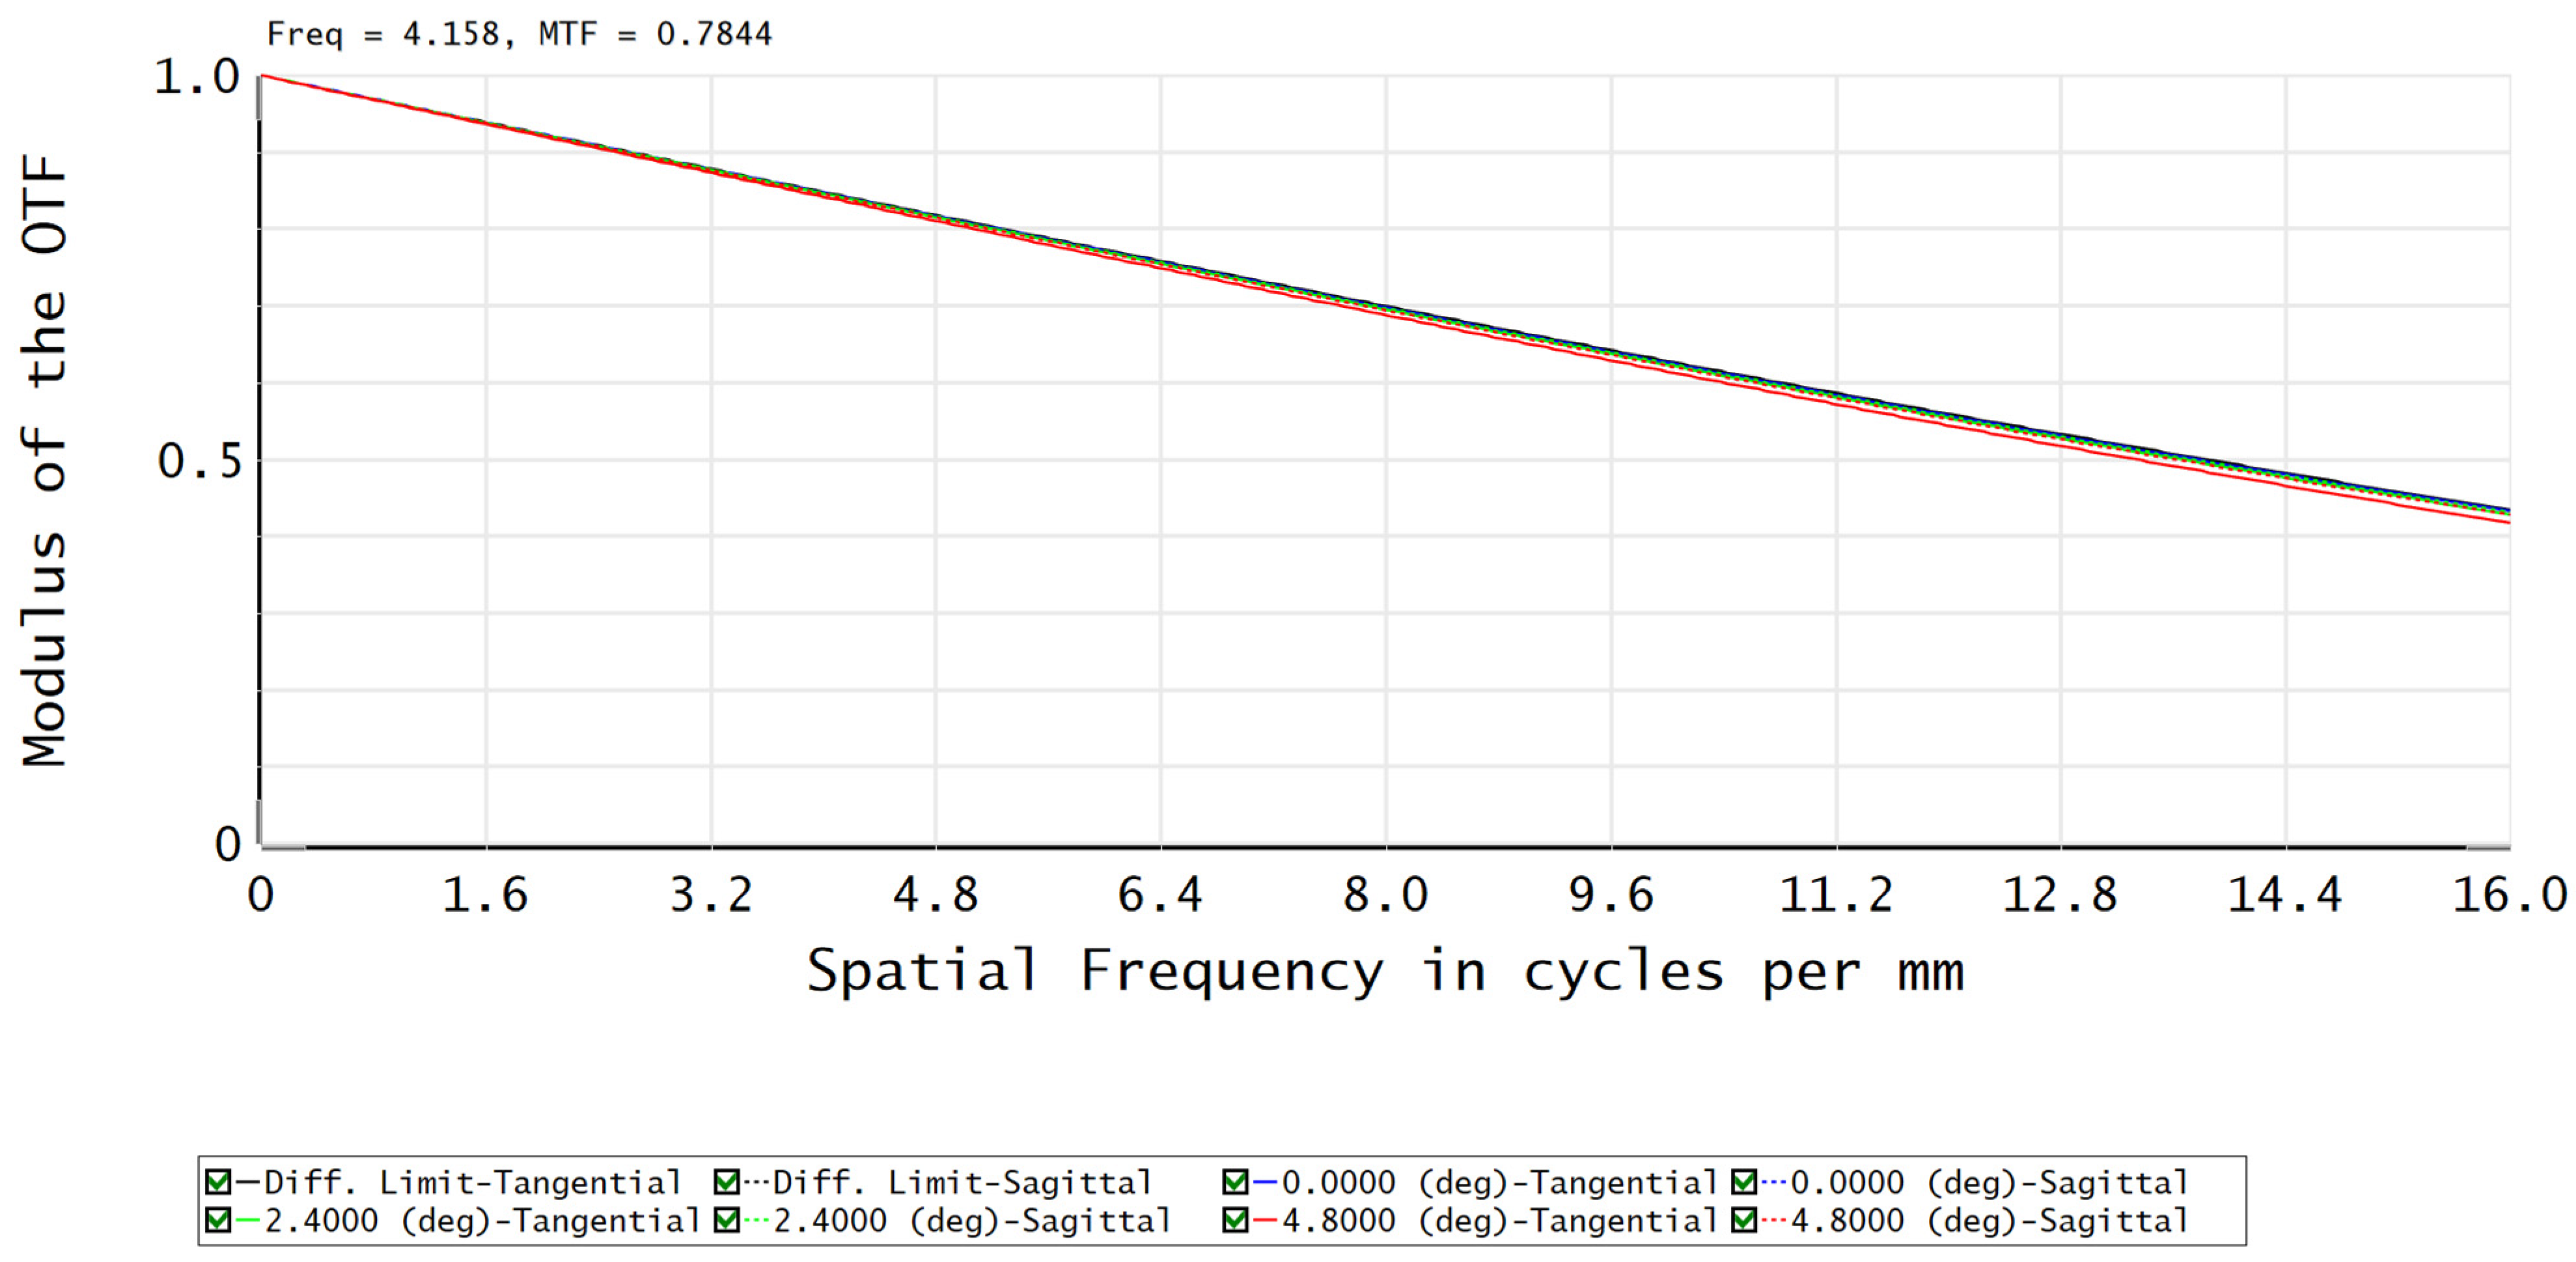
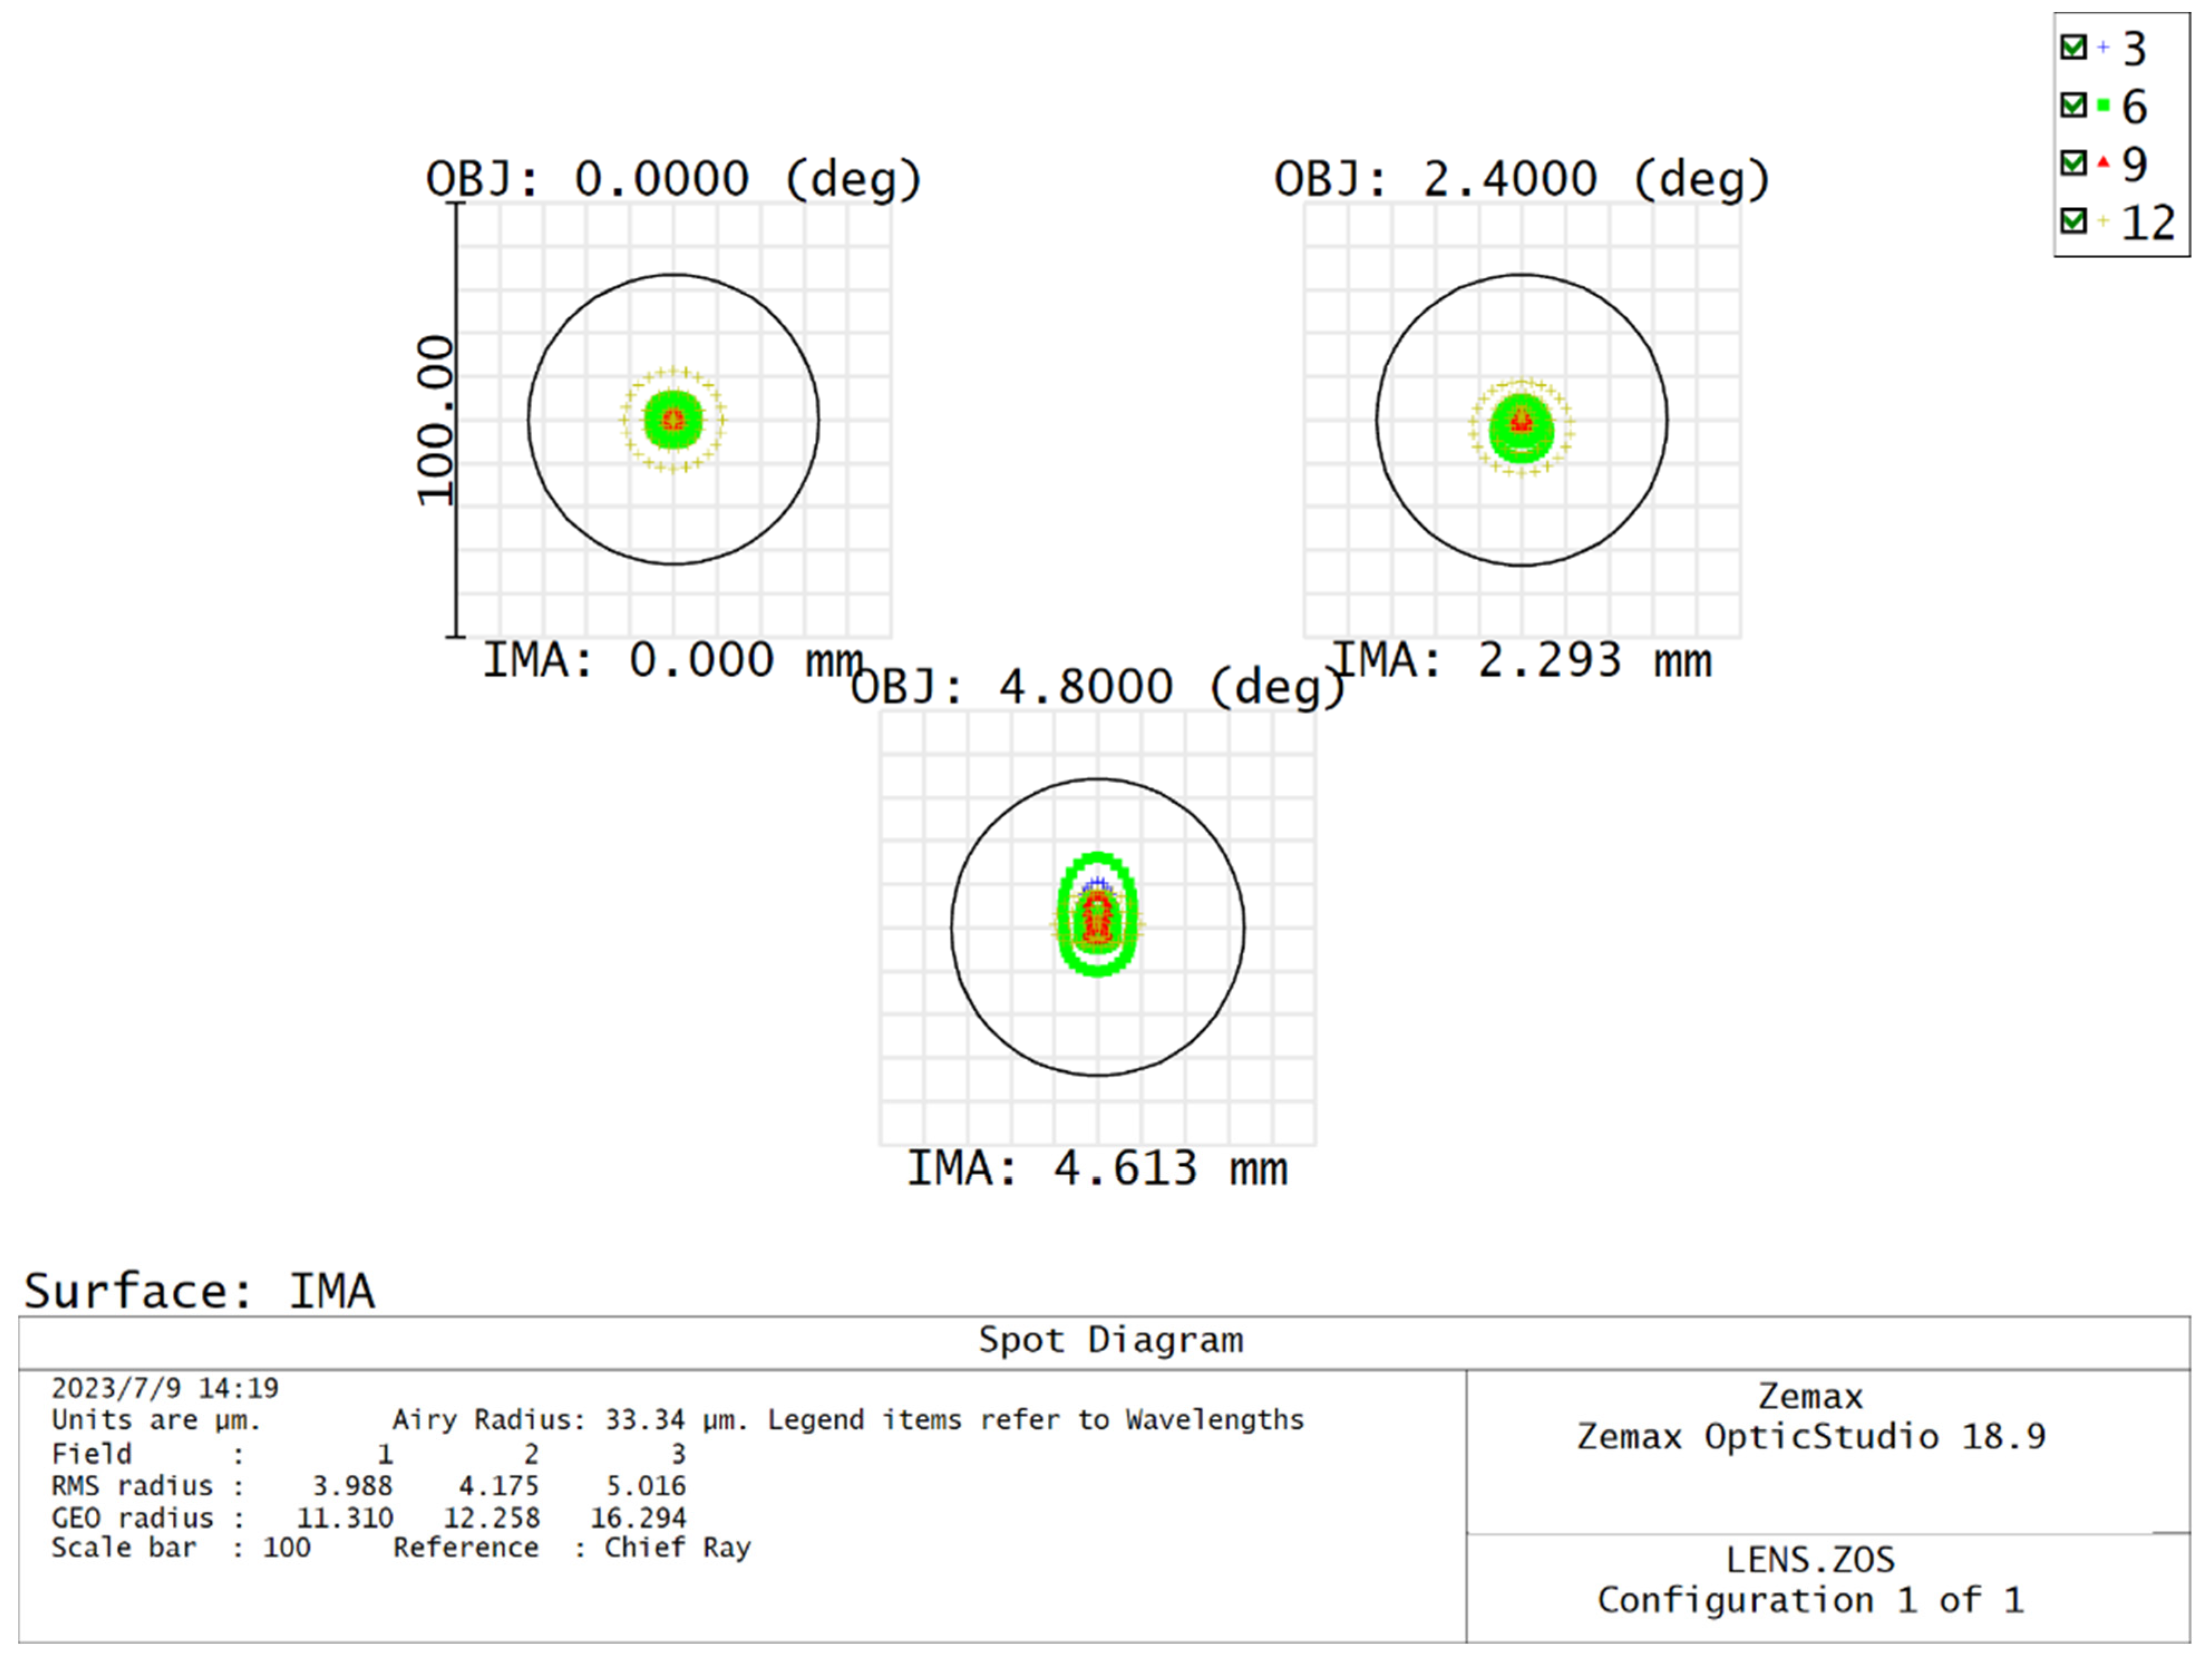
2.1. Infrared Small-Target Acquisition Optical System

Here, we present a proposed scheme for an airborne infrared small-target detection system. The system comprises an electronically controlled auxiliary subsystem, a servo turntable subsystem, an infrared information acquisition system, and an information processing system, as shown in Figure 1.
Unmanned airborne optoelectronic pods have extremely stringent conditions on the weight and volume of the load, and a miniaturized infrared optical system has been designed to meet the needs of airborne infrared detection.
Since the detector image element size used in this experiment is 12  μ m , when the aircraft is flying at an altitude of 1000 m, the target of 1.5 m in length occupies at least 9 image elements, i.e., the target resolution is 0.167 m. Theoretically derived from Equation (1), Johnson’s law [12], the focal length of the optical system is calculated as  72   mm :
Δ = L f d ,
f = 72 mm ,
where  Δ  is the target resolution,  L  is the object distance,  d  is the pixel size, and  f  is the focal length of the optical system. Then, the focal length of the optical system is  72   mm .
The system has a F-number of 4.5, an aperture of 16 mm, a total field of view of 9.6°, and an overall length of 50 mm. The structure of the optical system is shown in Figure 2, the transfer function (MTF) of the optical system is shown in Figure 3, and the standard spot diagrams (for the actual optical system, due to the existence of aberrations, after all the light emitted by an object point passes through the optical system, the intersection point with the image plane is no longer a point, but a diffuse spot, which are called standard spot diagrams) is shown in Figure 4. The optical system has good imaging quality, and the MTF value is close to the diffraction limit, which fully meets the airborne requirements.

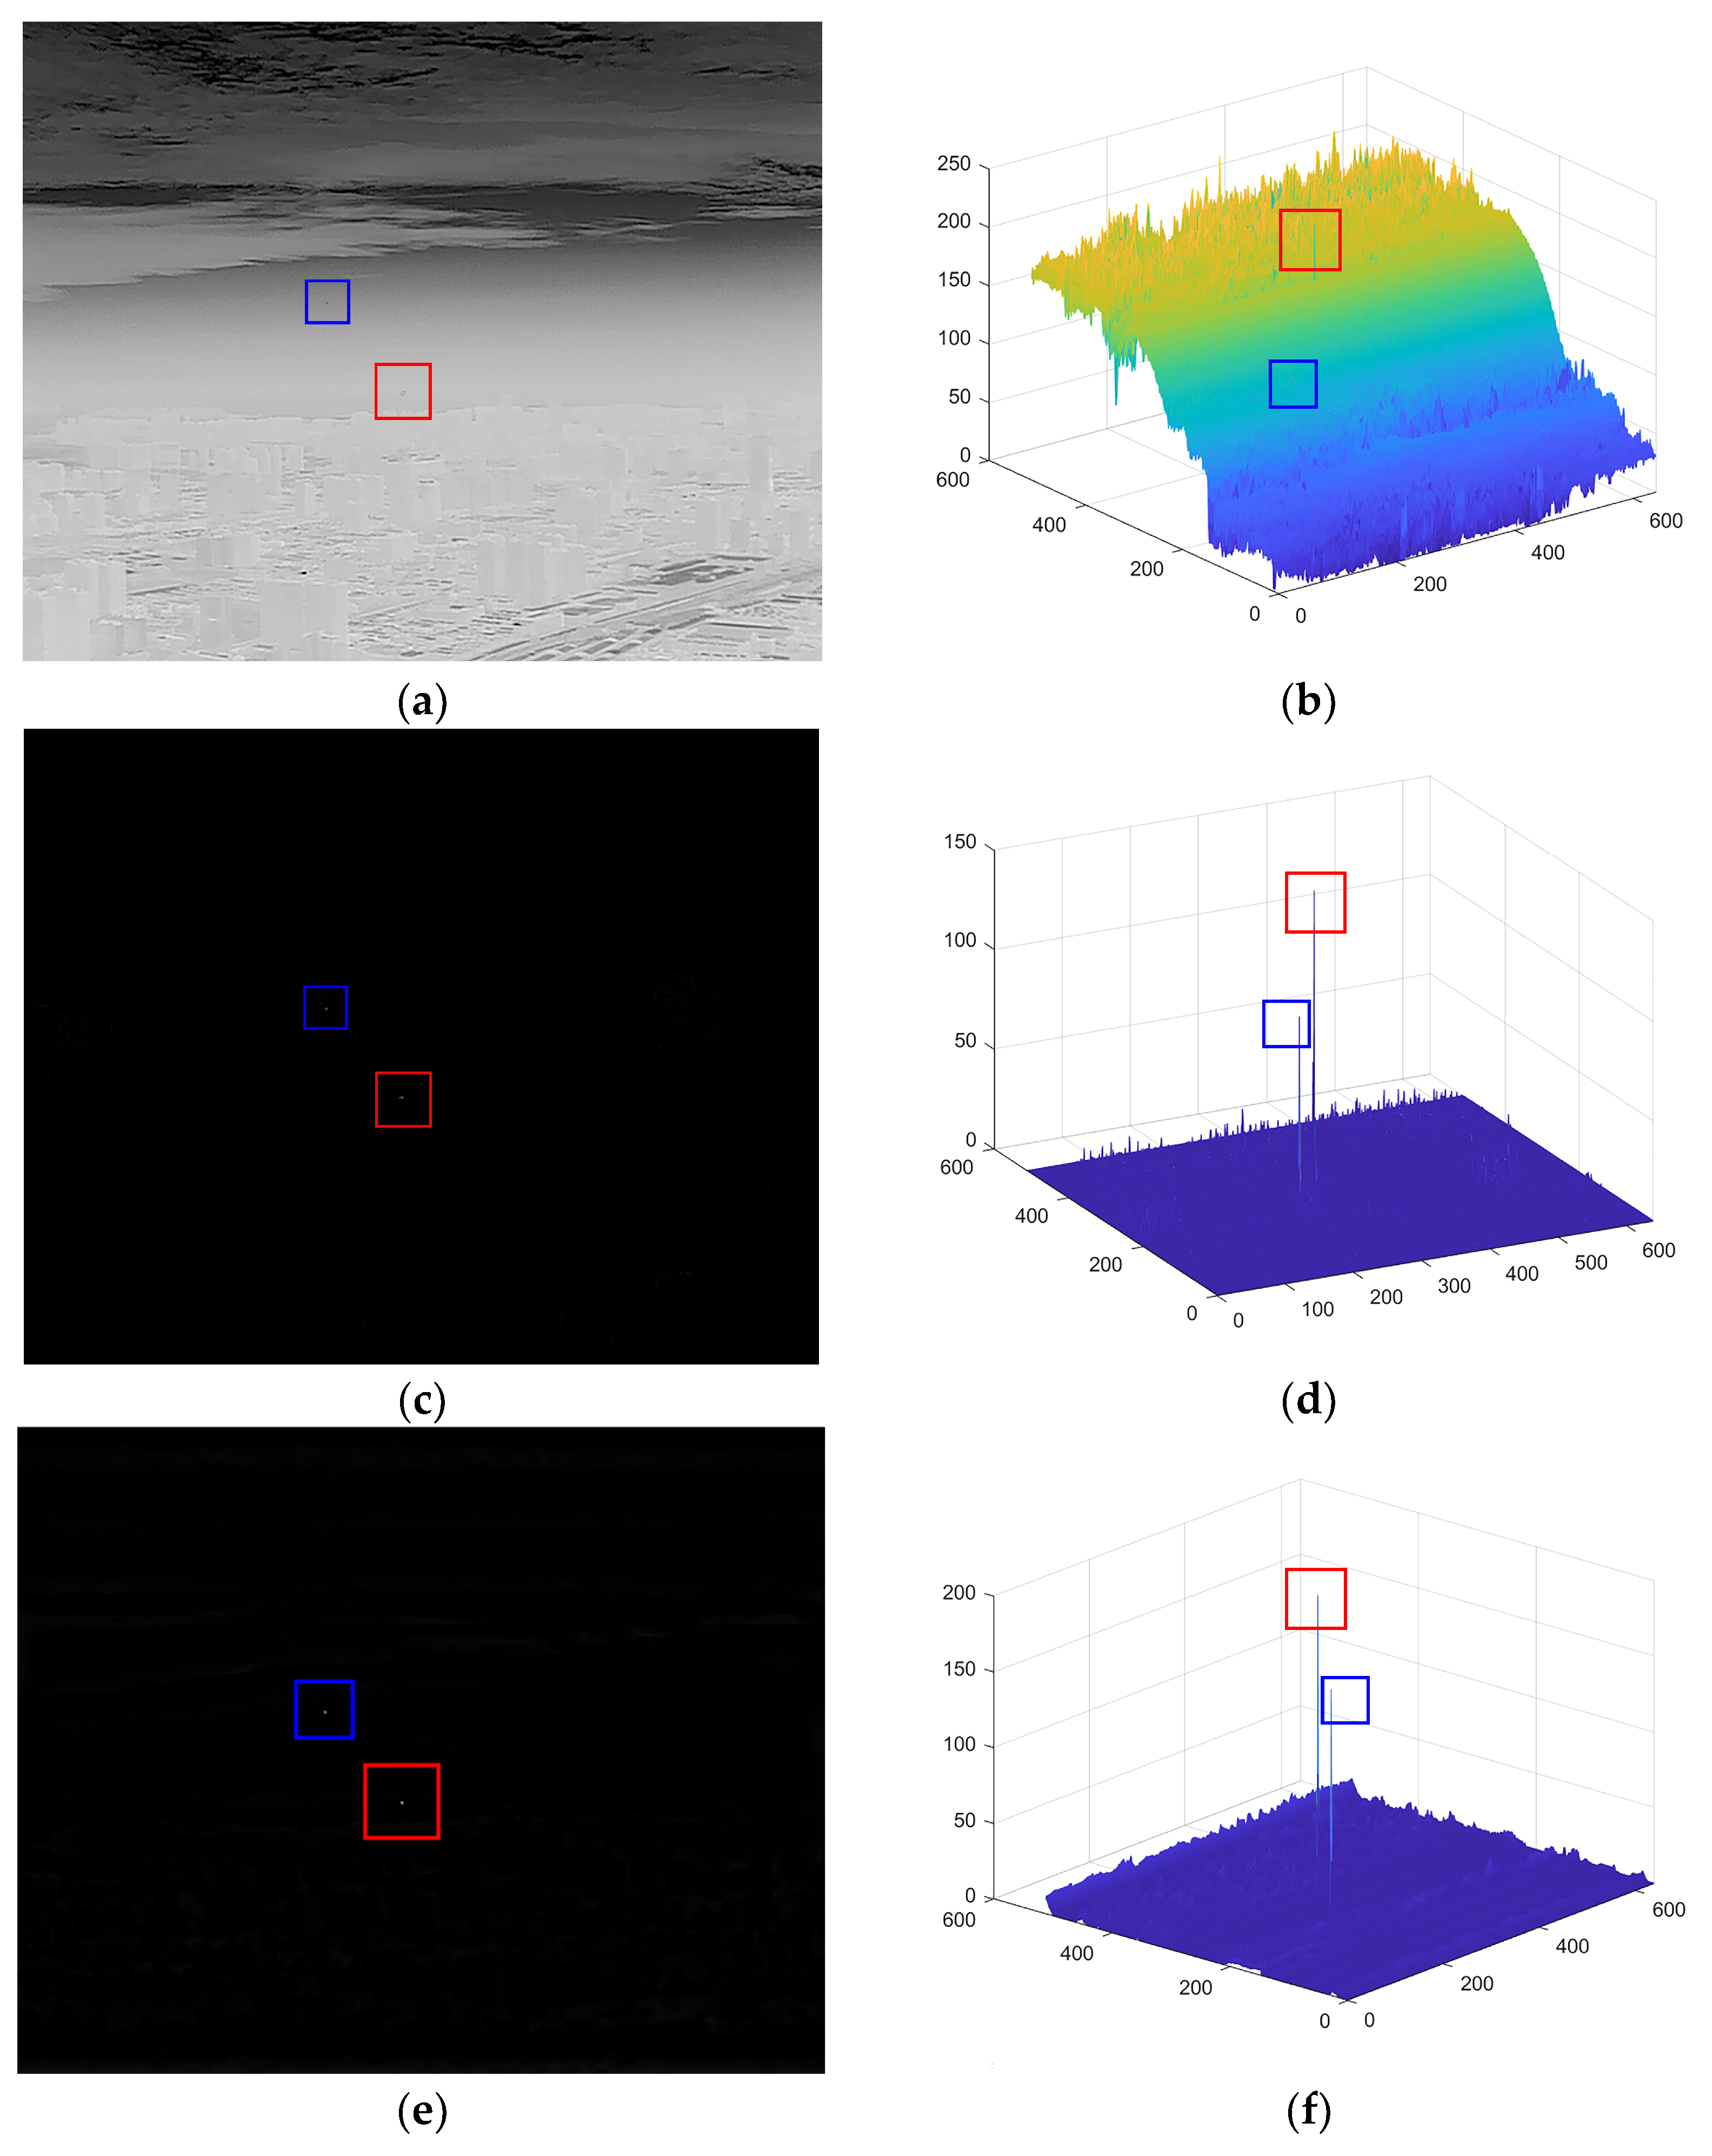
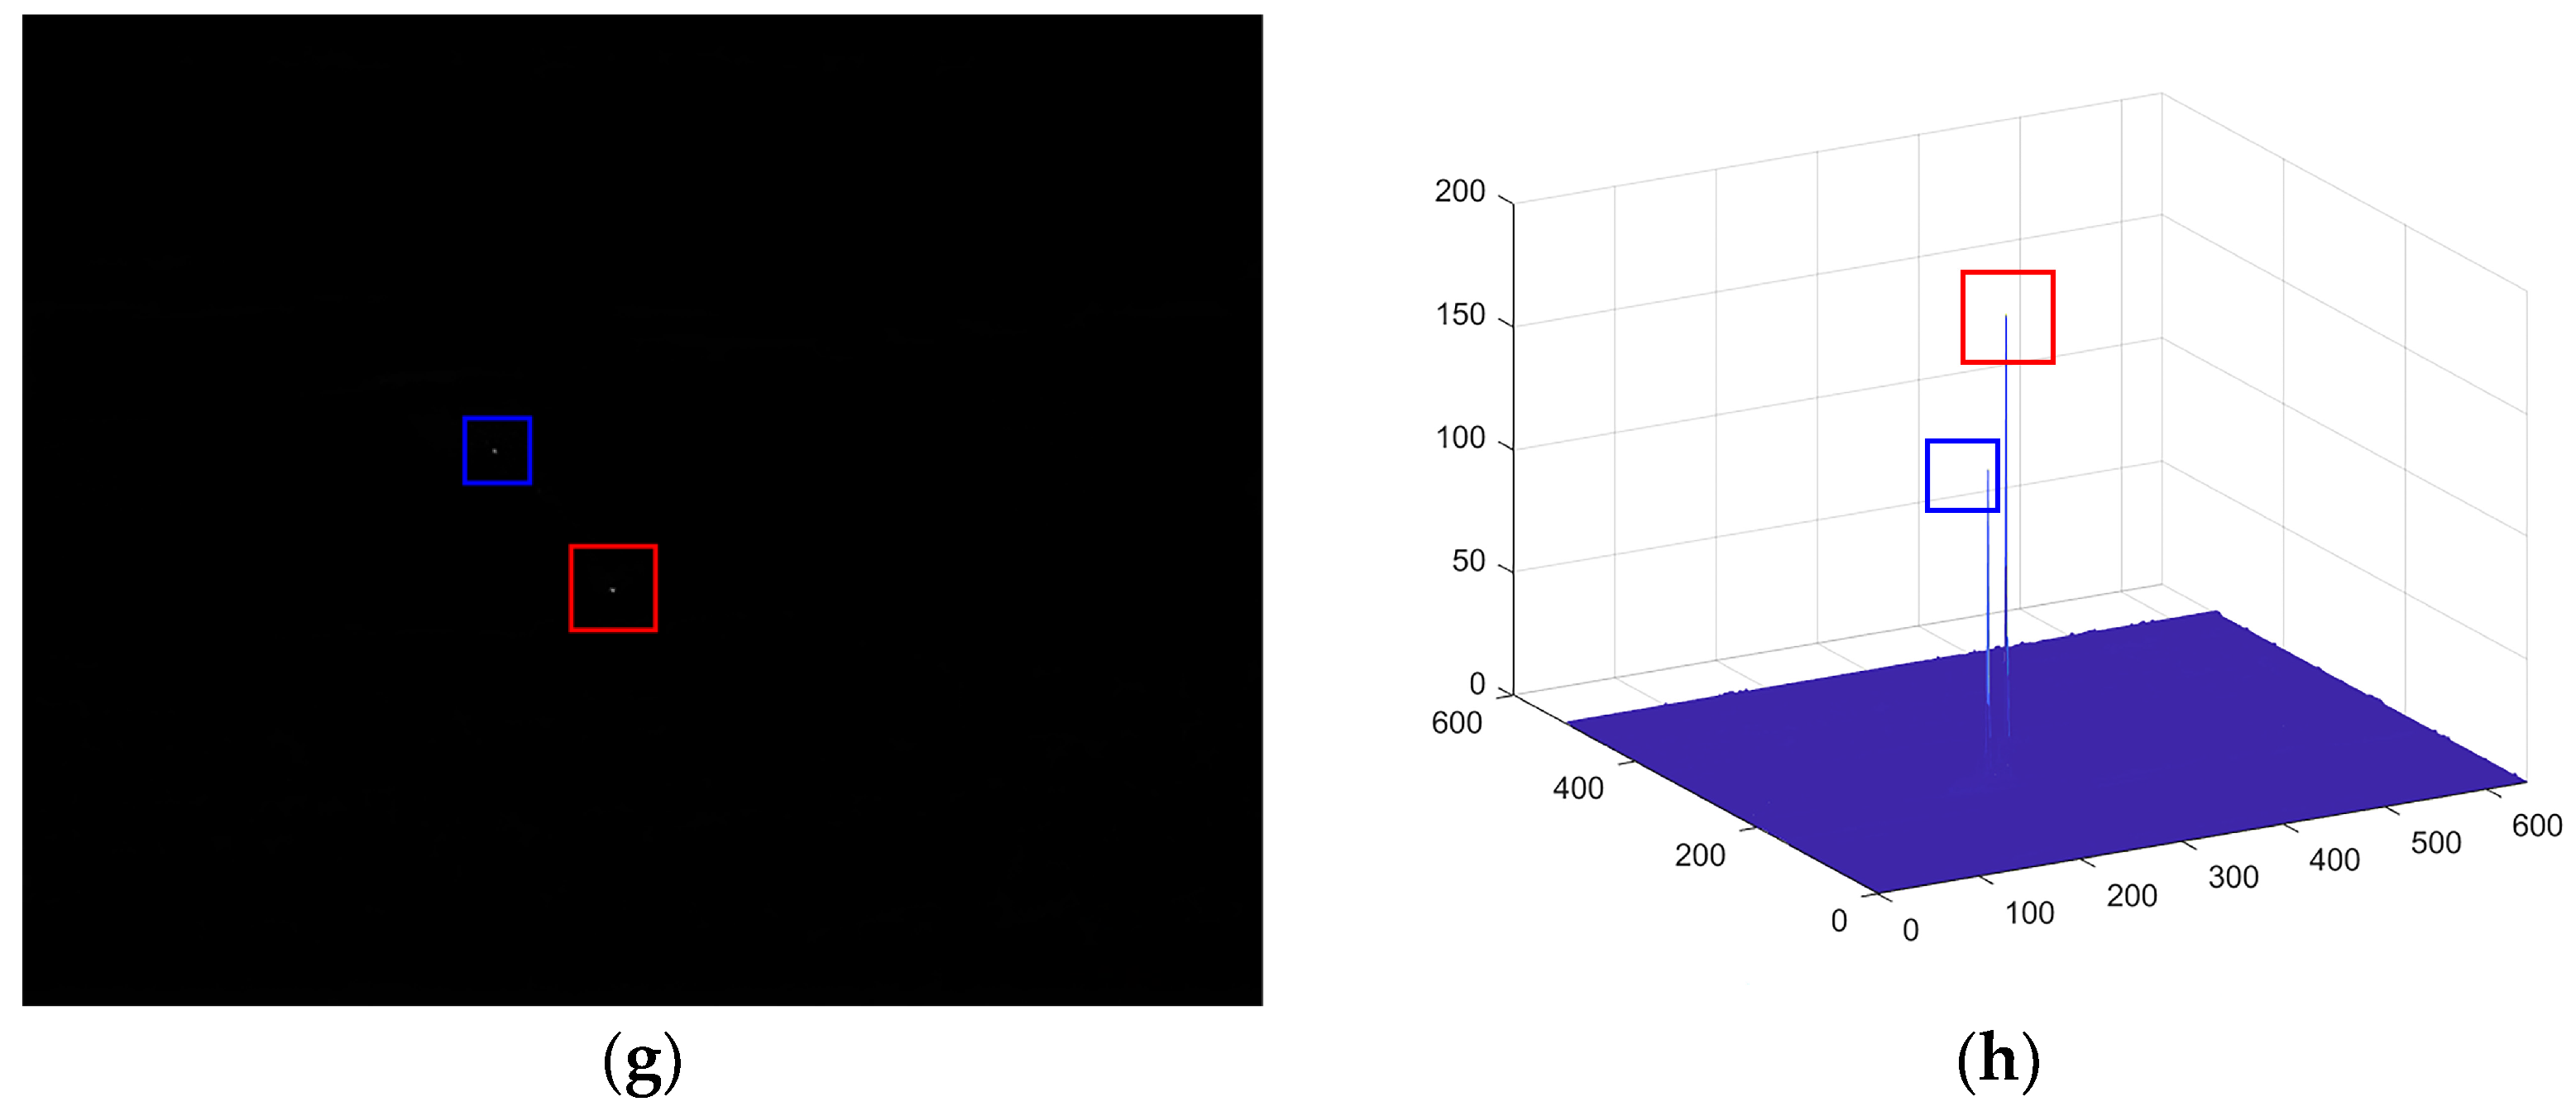
2.2. Infrared Weak Target Enhancement Algorithm

The IR weak target enhancement algorithm in this case consists of the following steps, as shown in Figure 5:
Step 1—Using the developed structural elements, the initial image is closed-computed to remove the prominent noise and retain the target as much as possible.
Step 2—Subsequentially, the candidate targets based on the layer information are obtained through the improved PM model algorithm and curvature filtering algorithms.
Step 3—The improved bootstrap filtering algorithm and the improved local contrast algorithm are sequentially used to extract the candidate targets based on spatial and frequency domain information.
Step 4—A weighted superposition method is used to combine the images enhanced in Steps 2 and 3 to enhance the weak target in the complex background of a single frame.

2.2.1. Image Pre-Processing

The open and closed operations consist of two fundamental operators: the expansion operation and the corrosion operation [13]. The open operation involves performing the corrosion operation first, followed by the expansion operation based on the outcome of the corrosion operation. Conversely, the closed operation entails executing the expansion operation first, and then implementing the corrosion operation using the result achieved from the expansion operation. By employing the open operation, infrared images containing small targets can effectively remove small, bright, dot-like interference targets, thus enabling a clear distinction between the interference targets and the genuine targets. Moreover, it ensures that the brightest region as well as the overall gray value of the image remain unaltered during the image pre-processing. Meanwhile, the closed operation filters out darker details that are slightly smaller than the structural elements, while preserving the original gray values and the darkest areas of the image. Ultimately, the combination of these two operations effectively eliminates various types of noise within both the dark and bright regions of the grayscale image.
The closed operations are as follows:
U · S = ( U S ) S ,
where   is the expansion operation,   is the corrosion operation,  U  is the image gray value, and  S  is the structural element.
The open arithmetic is as follows:
U S = ( U S ) S .
The expansion and corrosion arithmetic are as follows:
U S = { x : S ( x ) U } ,
U S = { x : S ( x ) U } .

2.2.2. A-Channel Image Enhancement Methods

Improved Perona–Malik Model

In general, weak infrared target images are composed of target, background, and noise [14], which are commonly expressed by the mathematical model shown in Equation (7):
U ( x , y ) = U t ( x , y ) + U b ( x , y ) + n ( x , y ) ,
where  ( x , y )  are the coordinates of a pixel point in the image, while  U t ( x , y ) U b ( x , y ) , and  n ( x , y )  are the gray values of the target, background, and noise, respectively.
The Perona–Malik equation [15] is a nonlinear diffusion coefficient added between the dispersion operator and the differential operator of the heat conduction equation:
U ( x , y , t ) t = div [ g ( U ) U ] U ( t = 0 ) = U 0 ,
where U is the grayscale image, div is the scatter operator, ∇ is the gradient operator, and g(∇U) is the edge stopping function.
According to the imaging characteristics of the infrared weak target, the traditional Perona–Malik model is improved by selecting the edge stopping function. This function aims to prevent the smoothing of the image region boundary, where the image gray gradient is larger, and enhance the smoothing of the image region interior, where the image gray gradient is smaller. By doing so, the image boundary information is preserved and not lost or moved during the image smoothing process. The traditional edge stopping function is presented in the following equation:
g 1 ( U ) = 1 1 + ( | U | / k ) 2 g 2 ( U ) = exp ( | U | / k ) 2 ,
where  k  is the gradient coefficient and is a constant greater than 0.
The improved Perona–Malik model is as follows:
U ( x , y , t ) t = div [ g 3 ( U ) U ] + λ I U ( t = 0 ) = U 0 ,
where  λ  is the intensity coefficient and  g 3 ( U )  is the edge stopping function based on the enhancement of small-target information.
g 3 ( U ) = exp [ ( | U + ( a × b / μ ) | / k ) 2 ] 1 ,
where a is the target-to-background contrast coefficient,  b  is the background contrast factor, and  μ  is the distance coefficient, and  b  and  μ  are shown below:
b = U ( p ) + U ( q ) U ( p ) U ( q ) ,
μ = | | p q | | ,
where  p  is the target point,  p = ( p x , p y )  is the background point within a certain range of the target point,  U ( p )  is the gray value of the  p  point, and  U ( q )  is the gray value of the  q  point.

Improved Curvature Filtering

For a single infrared weak target image, after weakening the background and noise, the target should also be appropriately strengthened, so the curvature filtering in the variational model is improved to obtain better results.
In each variational model, it is necessary to find a minimized energy function, where the energy is shown in the following equation [16]:
E ( U ) = E ϕ d ( U , U ) + η E ϕ r ( U ) ,
where  E  denotes the total energy and contains the data fitting term  E ϕ d , which measures how well the returned image  U  matches the input image  U , and the regular energy term  E ϕ r , which implements the formal use of prior knowledge about the image  U , and  η  is the weight of the regular energy.
The Gaussian curvature of image  U  is:
K ( U ) = U x x U y y U x y 2 ( 1 + U x 2 + U y 2 ) 2 ,
where  x  and  y  denote different directions of bias.
From the Gauss–Bonnet theorem [17], it is known that the total curvature of any surface is related to the surface topology. Therefore, for the total curvature to be topologically invariant, it can only be minimized by minimizing the total absolute curvature, which in turn updates the total energy formula to obtain the following equation:
E ( U ) = E ϕ d ( U , U ) + η E ϕ r ( U ) = Ω | U ( x ) U ( x ) | d x + η Ω | K ( U ) | d x .
For the above equation, the element in the finite set with the smallest change is selected and updated using the following method:
S min ( x ) = arg   min S ^ i ( x ) | S ^ i ( x ) U ( x ) | ,
where  S ^ i ( x )  is the minimization computed for each localization in the regular term,  i = 1 , , N .
The Gaussian curvature projection operator is as follows:
  1 . Input   image   U ( i , j )   2 . d 1 = ( U ( i 1 , j ) + U ( i + 1 , j ) ) / 2 U ( i , j )   3 . d 2 = ( U ( i , j 1 ) + U ( i , j + 1 ) ) / 2 U ( i , j )   4 . d 3 = ( U ( i 1 , j 1 ) + U ( i + 1 , j + 1 ) ) / 2 U ( i , j )   5 . d 4 = ( U ( i 1 , j + 1 ) + U ( i + 1 , j 1 ) ) / 2 U ( i , j )   6 . d 5 = U ( i 1 , j ) + U ( i , j 1 ) U ( i 1 , j 1 ) U ( i , j )   7 . d 6 = ( U ( i 1 , j ) + U ( i , j + 1 ) U ( i 1 , j + 1 ) U ( i , j )   8 . d 7 = ( U ( i , j 1 ) + U ( i + 1 , j ) U ( i + 1 , j 1 ) U ( i , j )   9 . d 8 = ( U ( i , j + 1 ) + U ( i + 1 , j ) U ( i + 1 , j + 1 ) U ( i , j ) 10 . d min = min d 1 , d 2 , , d 8 11 . Output   image   U ( i , j ) = U ( i , j ) + d min
Mean curvature filtering is introduced to address the problem of insufficient denoising in the Gaussian curvature model, which is used for complex background infrared weak target images full of noise. Although the Gaussian curvature model effectively preserves the image’s edge and texture detail information, it still lacks the ability to sufficiently reduce noise.
The new curvature model defined above is as follows:
K ( U ) = γ 1 + U x 2 U y y 2 U x U y U x y + 1 + U y 2 U x x 2 1 + U x 2 + U y 2 3 / 2 + ( 1 γ ) U x x U y y U x y 2 ( 1 + U x 2 + U y 2 ) 2 ,
where  γ  is the mean curvature participation factor.
Figure 6 shows that the energy function can converge to a more stable result after several iterations.
In turn, the projection operator under the new curvature model is derived as follows:
  1 . Input   image   U ( i , j )   2 . d 1 = 5 16 ( U ( i 1 , j ) + U ( i + 1 , j ) ) + 5 8 U ( i , j + 1 ) 1 8 ( U ( i 1 , j + 1 ) + U ( i + 1 , j + 1 ) ) U ( i , j )   3 . d 2 = 5 16 ( U ( i 1 , j ) + U ( i + 1 , j ) ) + 5 8 U ( i , j 1 ) 1 8 ( U ( i 1 , j 1 ) + U ( i + 1 , j 1 ) ) U ( i , j )   4 . d 3 = 5 16 ( U ( i , j 1 ) + U ( i , j + 1 ) ) + 5 8 U ( i 1 , j ) 1 8 ( U ( i 1 , j 1 ) + U ( i 1 , j + 1 ) ) U ( i , j )   5 . d 4 = 5 16 ( U ( i , j 1 ) + U ( i , j + 1 ) ) + 5 8 U ( i + 1 , j ) 1 8 ( U ( i + 1 , j 1 ) + U ( i + 1 , j + 1 ) ) U ( i , j )   6 . d min 1 = min d 1 , d 2 , , d 4   7 . d 5 = ( U ( i 1 , j ) + U ( i + 1 , j ) ) / 2 U ( i , j )   8 . d 6 = ( U ( i , j 1 ) + U ( i , j + 1 ) ) / 2 U ( i , j )   9 . d 7 = ( U ( i 1 , j 1 ) + U ( i + 1 , j + 1 ) ) / 2 U ( i , j ) 10 . d 8 = ( U ( i 1 , j + 1 ) + U ( i + 1 , j 1 ) ) / 2 U ( i , j ) 11 . d 9 = U ( i 1 , j ) + U ( i , j 1 ) U ( i 1 , j 1 ) U ( i , j ) 12 . d 10 = ( U ( i 1 , j ) + U ( i , j + 1 ) U ( i 1 , j + 1 ) U ( i , j ) 13 . d 11 = ( U ( i , j 1 ) + U ( i + 1 , j ) U ( i + 1 , j 1 ) U ( i , j ) 14 . d 12 = ( U ( i , j + 1 ) + U ( i + 1 , j ) U ( i + 1 , j + 1 ) U ( i , j ) 15 . d min 2 = min d 5 , d 6 , , d 12 16 . Output image I A ( i , j ) = U ( i , j ) + γ d min 1 + ( 1 γ ) d min 2

2.2.3. B-Channel Image Enhancement Methods

The infrared weak targets in a single infrared small-target image have different frequency and air domain characteristics, and this section retains the information according to the different characteristics, and finally reaches the purpose of rejecting the background.

Improved Bootstrap Filtering

In bootstrap filtering [18], three images are involved: the bootstrap image, the original image to be filtered, and the output image. The bootstrap image can be the filter image itself or another image. An image containing pixel values can be seen as a two-dimensional function, but the irregularity of the image prevents writing an analytical expression for the function. It is assumed that the output of this function, in a small two-dimensional window, follows a nonlinear relationship with the input due to the difference in grayscale properties between the small target and the background.
U i = a k I i 2 + b k I i + c k , i w k ,
where  U i  is the value of the output pixel,  I i  is the value of the input bootstrap pixel,  i  and  k  are pixel indices,  w k  is the window centered at  k , and  a k b k , and  c k  are the coefficients of the function.
We introduce a new cost function to enhance the gray value of the small target and weaken the background gray value according to the local gray gradient characteristics of the small target. The cost function is shown below:
E ( a k , b k , c k ) = i w k [ ( a k I i 2 + b k I i + c k + U i ) 2 + ε a k 2 ] ,
where  ε  is the enhancement factor.
Using the least squares method, the following are obtained:
a k = 1 | w | i w k μ k U k ¯ + U k ¯ 1 | w | i w k ( I i μ k ) 4 + ε ,
b k = a k σ k 2 + U k ¯ μ k ,
c k = a k σ k 2 b k μ k U k ¯ ,
where  | w |  is the number of pixel points in window  w k μ k  and  σ k 2  are the mean and variance of image  I  at window  w k , respectively, and  U k ¯  is the mean value of image  U  in window  w k .
For a pixel point of a small target in a 2D image, it is contained in multiple windows around it, i.e., the pixel point is described by multiple nonlinear functions. Therefore, the output value of a point is the average of the values of all the linear functions describing that point, that is:
U i = 1 | w | k , i w k ( a k I i 2 + b k I i + c k ) = a ¯ i I i 2 + b ¯ i I i + c ¯ i ,
where  a ¯ i  is the mean of  a k b ¯ i  is the mean of  b k , and  c ¯ i  is the mean of  c k .

Improved Local Contrast Algorithm

After the original image is processed, as in the previous section, the complex background is further weakened, at which time the local contrast near the small target is further enlarged. Inspired by the human eye’s visual system [19], we improve the PCM algorithm in this section by improving the local sliding window to carry out the extraction of small targets in infrared images. The nested structure is shown below:
D 3 = 1 3 2 j = 1 3 2 U i j ,
D 9 = 1 9 2 3 2 j = 1 9 2 3 2 U i j ,
where  D 3  is the grayscale feature of the central region of the weak target and  D 9  is the grayscale feature of the background region of the weak target.
Thus, the local contrast,  C , for weak targets and complex environments is expressed as:
C = D 3 D 9 D 3 + D 9 .
Therefore, this section outputs  I B  as:
I B = s F C .

2.2.4. Two-Channel Fusion with Weighted Superposition

The two-channel fusion method of weighted superposition has the advantages of a simple algorithm and a fast speed. When the A-channel and the B-channel are subjected to preliminary small-target enhancement, the following formula is used to perform a weighted superposition of the enhanced images of the two channels, and then the computed results are used to replace the enhanced image of the A-channel to form the fusion result:
F = ( 1 w ) I A + w I B w = σ σ m i n σ m a x σ m i n ( c 2 c 1 ) + c 1 ,
where  I A  and  I B  denote the A-channel and B-channel enhanced images, respectively, and F is the result of their fusion;  σ  is the mean value of the difference between the small target and the background after enhancement by the B-channel, and  σ m i n  and  σ m a x  are the minimum and maximum values in the difference between each small target and the background;  c 1  and  c 2  are the minimum fusion weights for the A-channel and the maximum fusion weights for the B-channel, with the general values of  c 1  ranging from around 0.3 to 0.6, and those of  c 2  from around 0.6 to 0.85.

3. Results

In this section, the effectiveness of the method used in this paper is evaluated and demonstrated. To showcase the performance of this method, several state-of-the-art methods were selected as baselines for comparison. These methods include the average absolute gray difference (AAGD) [20], the infrared patch-image model (IPI) [21], and the multiscale relative local contrast measure (RLCM) [22].

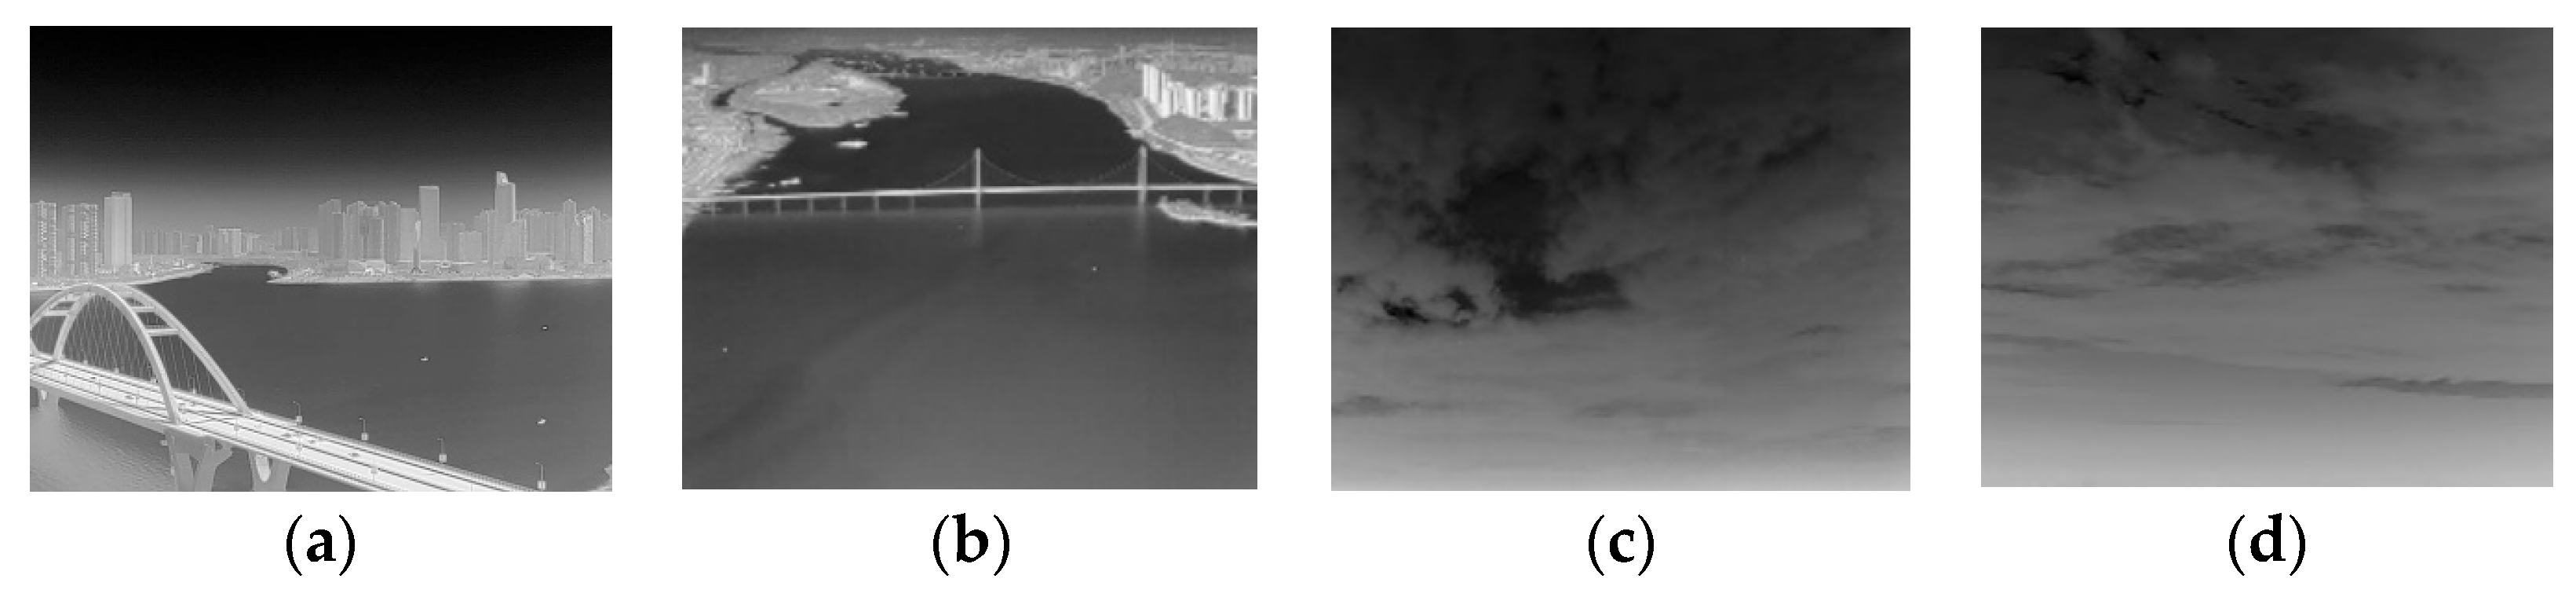
3.1. Sequential Experiments

In hazy weather, there is smoke, dust, water vapor, and other media in the air, which have a diffusing effect on the light. The outline of the target is no longer clear, and some of the details are not shown. In the background of haze, the weak targets are submerged in the high-brightness background, and the conventional image processing algorithms cannot recognize the weak targets. In order to further verify the usefulness of the proposed algorithms in this paper, a classical infrared small-target image with haze and a city as the background was selected, processed, and analyzed. Figure 7 shows the processing and results of the sequential experiments. There was a bright target and a dark target in the original image, and the bright target is shown in the red box, while the dark target is depicted in the blue box.

3.2. Assessment Criteria

Detection rate,  P d  [23]: The accuracy of target detection is measured by the comparison of the detection results with the true value, where the number of detected targets is  N p  and the number of true values is  N r :
P d = N p N r .
False alarm rate,  F a  [24]: The result is obtained by calculating the ratio of false prediction pixels to all pixels in the image, where  P f  is the false prediction pixel and  P a  is all pixels in the image:
F a = P f P a .
Mean intersection over union,  mIoU  [25]: mIoU is a measure of image segmentation accuracy. The higher the  mIoU , the better the performance. In Equation (32), intersection is the number of pixels in the intersecting region, and combine is the number of pixels in the merged region.
mIoU = 1 K i = 1 K i n t e r s e c t i o n C o m b i n e .
Recall [26]: The prediction result is the proportion of the actual number of positive samples in the positive samples compared to the positive samples in the whole sample:
R e c a l l = T r u e   P o s i t i v e / T r u e   P o s i t i v e + F a l s e   N e g a t i v e .
F1 score [26]: A weighted average of precision and recall:
F 1   s c o r e =   2 × P d × R e c a l l / P d + R e c a l l .

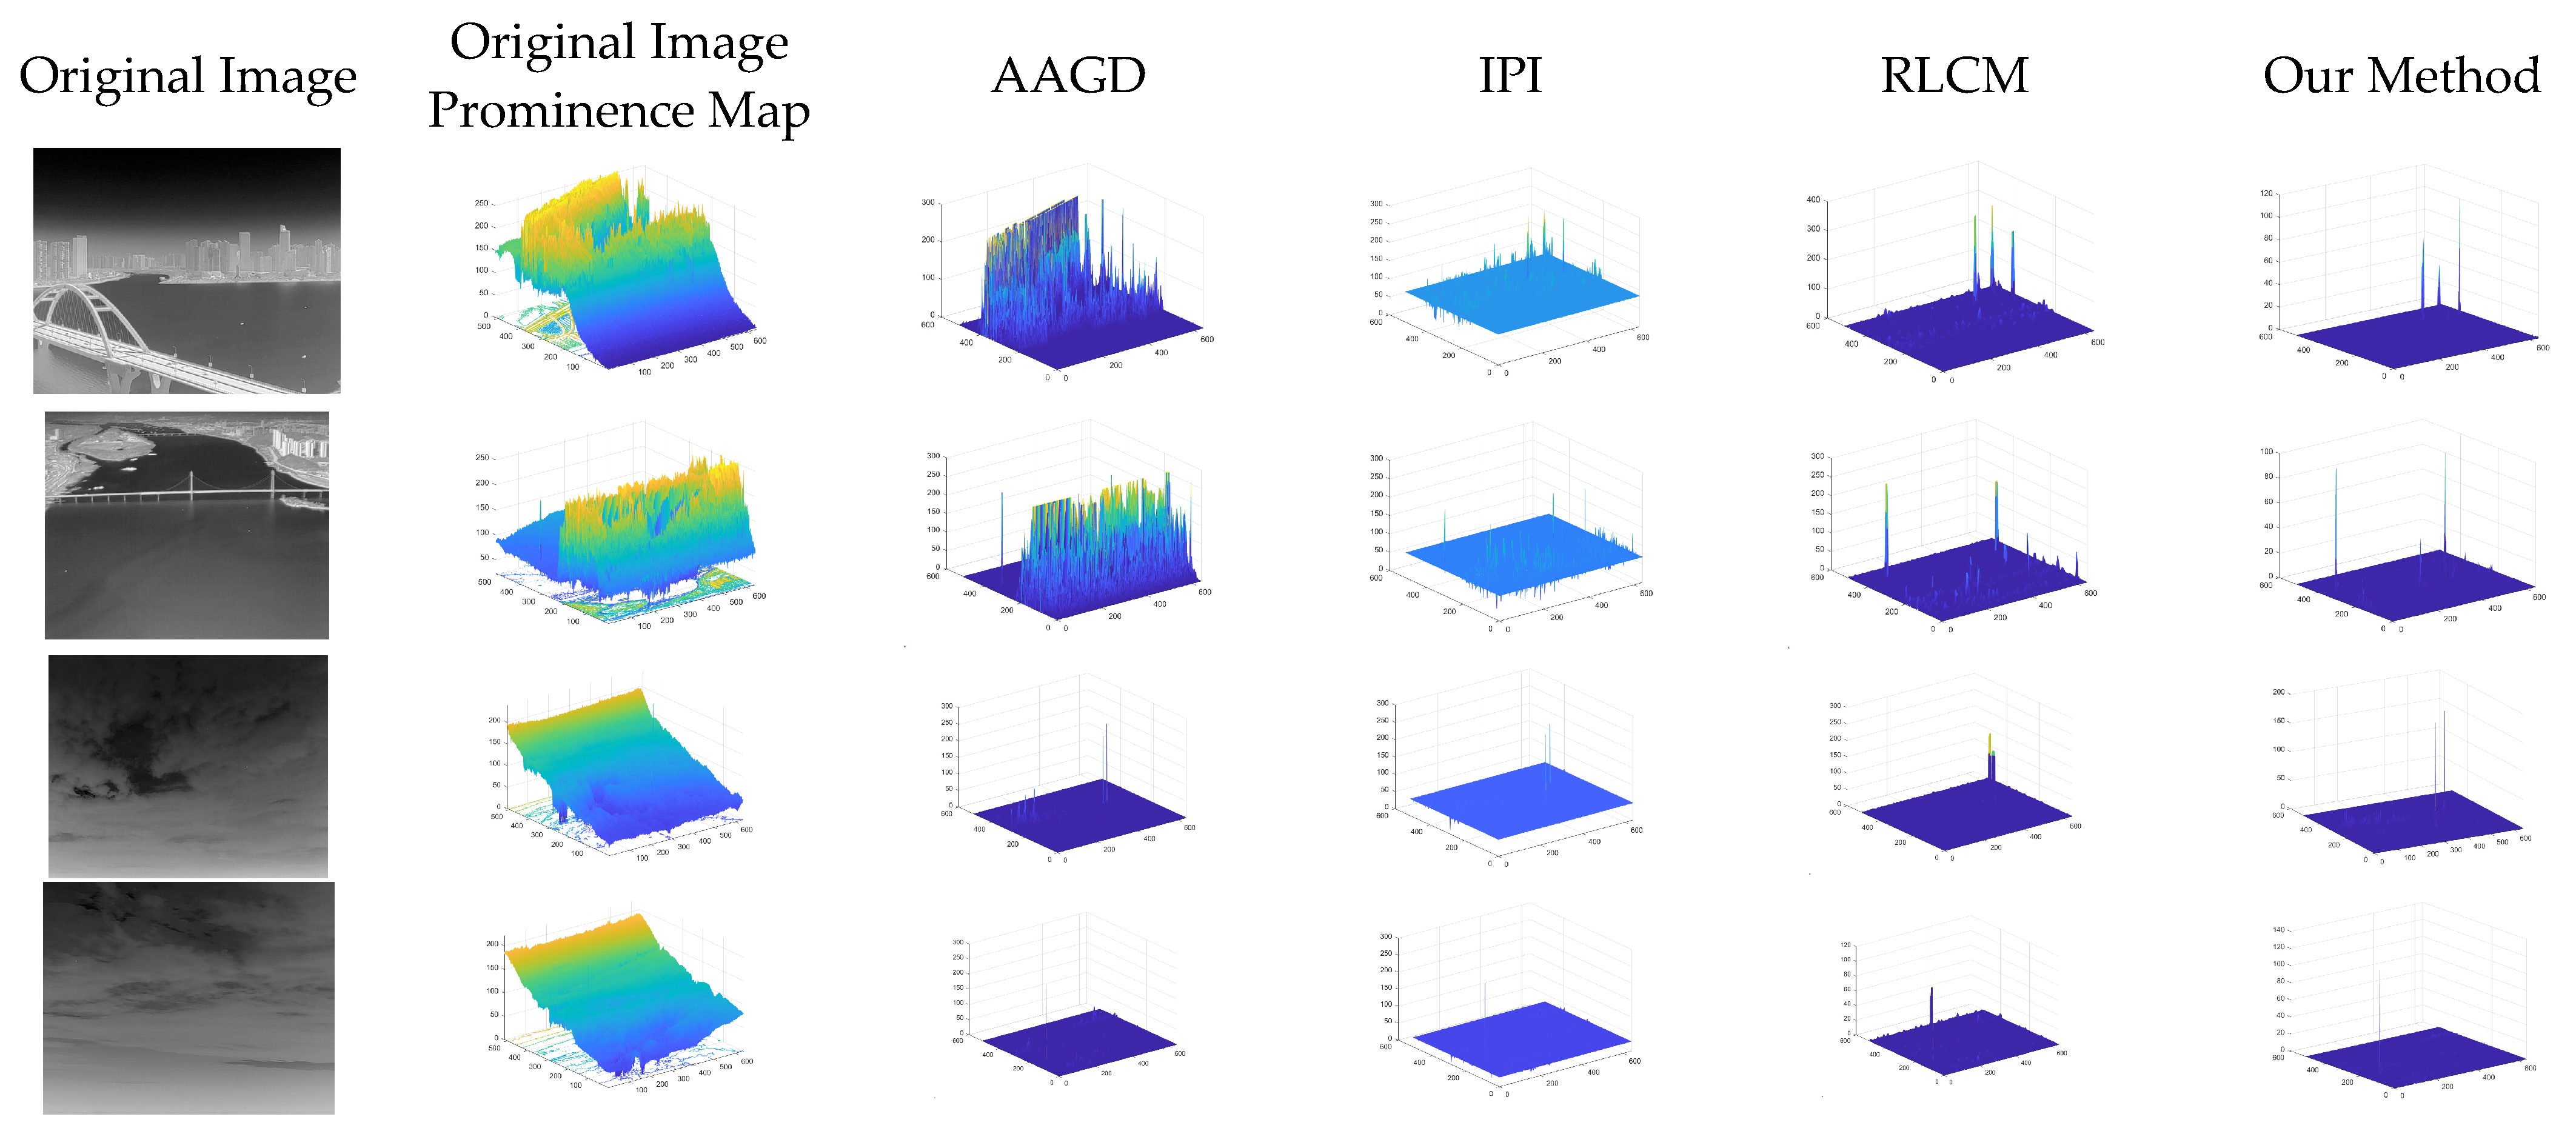
3.3. Comparative Experiments

The experimental dataset included 9000 infrared images with weak targets. We used a UAV-mounted optical system and infrared detection designed to acquire infrared small targets from the air during the month of May, targeting river boats, automobile paintings on bridges, cars and buildings on the ground, as well as a portion of the airborne small-target imagery from the ground, targeting airborne airplanes and flying birds. Figure 8 shows a portion of the infrared images used in this experiment for qualitative and quantitative comparisons of different methods.
Figure 9 demonstrates the comparison of the processing results between the method of this paper and other state-of-the-art methods, from which it is obvious that most of the methods correctly enhance the target, but the method proposed in this paper is the most effective.
To assess the effect of noise on the performance of our method, the above experiments were repeated in the presence of salt and pepper noise. Figure 10 and Figure 11 show the detection results of the test images with the addition of salt and pepper noise with a density of 0.001 and Gaussian noise with a variance of 0.001, respectively. Table 1 demonstrates the average values of the detection data for each method in this dataset. From these images, it can be seen that the algorithm of this paper shows the best performance in the face of noise, and it can be concluded that the presence of noise has little effect on the performance of this method.

3.4. Ablation Experiments

In this section, we perform ablation studies to validate the presented idea. To improve the detection effect, different characteristics of weak targets were exploited in channels A and B. In channel A, PM filtering was utilized, followed by curvature filtering to weaken the background and enhance the target information, aiming to retain very small targets. On the other hand, channel B applied bootstrap filtering and the local contrast algorithm to detect slightly larger weak targets. These two channels complement each other in improving the overall detection performance.
The algorithms in this section are compared between four methods: improved PM filtering only, improved PM filtering plus improved curvature filtering, local contrast algorithm only, and improved bootstrap filtering plus the improved local contrast algorithm. The reasons for using these methods for the experiments are as follows:
(1) Improved PM filtering only—only the background information is weakened, and the details and edges are enhanced.
(2) Improved PM filtering plus improved curvature filtering—single-channel detection of infrared weak target images, weakening the background information while enhancing the pixels of very small targets and increasing the target pixels.
(3) Adopting an improved local contrast algorithm only—detecting and retaining slightly larger targets that may be potentially weakened by the A-channel.
(4) Improved bootstrap filtering with an improved local contrast algorithm—detecting and retaining potential large targets that may be weakened by the A-channel while enhancing and increasing the target pixels.
According to the analysis of the ablation experiment data in Table 2, when only the improved PM filtering was used: Pd was reduced by 3.1%, Fa was reduced by 0.7%, mIoU was reduced by 9.5%, Recall was reduced by 2.8%, and F1 score was reduced by 3.0%. This is because the improved PM model is too strong for the background weakening, which identifies some of the larger targets as the background while other larger targets in the image are not recognized.
When the improved PM filter plus the improved curvature filter was used, there was no change in Pd, Fa, Recall, and F1 score relative to using only the improved PM filter algorithm, but there was a significant increase in mIoU, which indicates that the improved curvature filter is effective in augmenting pixels for very small targets and in increasing the target pixels.
When only the improved local contrast algorithm was used, Pd was reduced by 4.9%, Fa was reduced by 0.1%, mIoU was reduced by 19.8%, Recall was reduced by 3.7%, and F1 score was reduced by 4.3%. This is because this method is very inconspicuous in its handling of very small targets, which are usually undetectable, and has a significant disadvantage in complex backgrounds, but complementing all the methods perfectly solves the problems in the above analysis.
Using the improved bootstrap filter plus the improved local contrast algorithm, Pd was increased by 1.4%, Fa was increased by 0.1%, mIoU was increased by 7.1%, Recall was increased by 0.9%, and F1 score was increased by 1.1%, compared to the improved local contrast algorithm alone, indicating that the improved bootstrap filter can not only help the local contrast algorithm improve the small-target detection rate but can also effectively increase the mIoU.
Therefore, we combined several methods: in the A-channel, first to the image, we used improved PM filtering plus improved curvature filtering; in the B channel, we used improved bootstrap filtering plus an improved local contrast algorithm, and then we used weighted superposition of the two channels. It can be seen from the results that utilizing this method obtained the best results. The A-channel can effectively capture the complex background of the very weak small targets, and the B-channel can capture the slightly larger targets that the A-channel missed. These two methods, combined with the right thinking, can achieve the desired results.

4. Discussion

The process of designing the infrared weak target acquisition optical system involved optimizing the dot column diagram and the transfer function. This led to the optical system having good imaging quality and an MTF close to the diffraction limit. As a result, the misjudgment of small-target detection caused by poor imaging quality was essentially avoided. In addition, an infrared weak target enhancement algorithm was proposed for the infrared weak target acquisition optical system. The algorithm consisted of two channels: channel A included the improved PM model and the improved curvature filter, and channel B included the improved guided filter and the improved local contrast algorithm. These channels were then combined using weighted superposition to obtain the final output image. Overall, the infrared weak target acquisition optical system and the proposed enhancement algorithm aimed to address the challenges of miniaturization, light weighting, and unmanned operation in airborne infrared weak target detection.
When the parameters of the infrared weak small-target enhancement algorithm were optimized, it was found that the combination of the improved PM model and the improved curvature filter was very sensitive to the small fluctuations of the image, so this method was used for small-target enhancement, and the results also confirmed that this method was correct. In this paper, the proposed algorithm was validated by several experiments, among which the sequential and comparative experiments performed well, and the ablation experiment also proved that the process of this algorithm was correct. The comparative experimental data analysis verified that the algorithm can reach 0.988, which is significantly better than other advanced algorithms. During the experiment, it was found that when the background complexity was high, shortening the number of iterations could effectively suppress the background, indicating that compared with the general background, the processing speed and accuracy of this algorithm will be significantly improved when coping with small targets in a complex background.
Our method is still limited by the materials to be detected. Many materials can reduce or eliminate the radiation difference between the target and the background, which makes the detection difficult. Our method does not use polarization information and may not be effective for some targets to evade detection. In the future, our team will use the polarization detector to obtain the target polarization information, provide multi-dimensional data information for weak target detection, reduce the algorithm complexity, and improve the accuracy of weak target detection and recognition.
The proposed infrared image enhancement algorithm operates quickly, ensuring a compact and lightweight infrared optical system design. Additionally, the target enhancement effect is obvious, establishing the technical foundation for the research of the target identification and tracking algorithm in the later stage. Therefore, the optical system design and algorithm proposed in this paper have practical applications in various fields, such as airborne physical evidence search, medical detection, and military target detection and tracking.

5. Conclusions

In this paper, we proposed a lightweight airborne infrared optical detection system and designed an infrared enhancement algorithm for weak and small targets in complex backgrounds. The optical detection system was optimized for airborne use, with a design aperture of 16 mm and a total length of 50 mm, meeting the airborne flight conditions. Its imaging quality is excellent, and its transfer function is close to the diffraction limit. The small-target enhancement algorithm, utilizing the A-channel to enhance the pixels of particularly small targets and the B-channel to capture larger targets, effectively suppressed complex background noise while enhancing the target. The combination of these two channels yielded an average performance of 0.988 against complex backgrounds. When compared with other state-of-the-art algorithms, the Fa was reduced by 56%, while the Pd increased by 17%. The results demonstrate that the airborne optical system and infrared weak target enhancement algorithm designed in this paper can effectively detect and enhance weak targets in complex backgrounds. This technology has potential applications in airborne physical evidence searches, medical detection, and military fields, thereby providing a technical foundation for weak target identification and tracking.

Author Contributions

Conceptualization, Z.Z. and L.M.; methodology, Z.Z.; software, S.Y.; validation, H.S. and Q.F.; data curation, H.S. and S.Y.; writing—original draft preparation, Z.Z., L.M. and Y.L.; writing—review and editing, Z.Z. and L.M. All authors have read and agreed to the published version of the manuscript.

Funding

This research was funded by the Jilin Province Science and Technology Development Plan (DZJ202301ZYTS417), the National Natural Science Foundation of China (NSFC) (Nos. 61890964 and 62127813), and the Changchun Science and Technology Development Plan (No. 21ZY36).

Data Availability Statement

Not applicable.

Conflicts of Interest

The authors declare no conflict of interest.

References

  1. Rawat, S.S.; Verma, S.K.; Kumar, Y. Review on recent development in infrared small target detection algorithms. Procedia Comput. Sci. 2020, 167, 2496–2505. [Google Scholar] [CrossRef]
  2. Yang, J.; Cui, Y.; Song, F.; Lei, T. Infrared Small Target Detection Based on Non-Overlapping Patch Model via l0-l1 Norm. Electronics 2020, 9, 1426. [Google Scholar] [CrossRef]
  3. Andriyanov, N.A.; Dementiev, V.E. Developing and studying the algorithm for segmentation of simple images using detectors based on doubly stochastic random fields. Pattern Recognit. Image Anal. 2019, 29, 1–9. [Google Scholar] [CrossRef]
  4. Mammadov, R.; Lena, R.; Mammadov, G. Invariant Image Recognition of Objects Using the Radon Transform. In Proceedings of the International Conference on Software Testing, Validation and Verification (ICST), 24–28 October 2020; pp. 503–517. Available online: https://ceur-ws.org/Vol-2711/paper39.pdf (accessed on 1 January 2023).
  5. Andriyanov, N.A.; Dementiev, V.E.; Tashlinskiy, A.G. Detection of objects in the images: From likelihood relationships towards scalable and efficient neural networks. Comput. Opt. 2022, 46, 139–159. [Google Scholar] [CrossRef]
  6. Zhang, S.; Huang, X.; Wang, M. Background Suppression Algorithm for Infrared Images Based on Robinson Guard Filter. In Proceedings of the 2017 2nd International Conference on Multimedia and Image Processing (ICMIP), Wuhan, China, 17–19 March 2017; pp. 250–254. [Google Scholar] [CrossRef]
  7. Gong, Y.; Xie, Y. Linear approximation of mean curvature. In Proceedings of the 2017 IEEE International Conference on Image Processing (ICIP), Beijing, China, 17–20 September 2017; pp. 570–574. [Google Scholar] [CrossRef]
  8. Bai, X.; Zhou, F. Analysis of new top-hat transformation and the application for infrared dim small target detection. Pattern Recognit. 2010, 43, 2145–2156. [Google Scholar] [CrossRef]
  9. Bai, X.; Zhou, F. Infrared small target enhancement and detection based on modified top-hat transformations. Comput. Electr. Eng. 2010, 36, 1193–1201. [Google Scholar] [CrossRef]
  10. Cai, J.; Huang, Y.; Li, P.; Zhao, Z.; Deng, Q. Infrared small target detection algorithm using visual contrast mechanism. Syst. Eng. Electron. 2019, 41, 2416–2423. [Google Scholar] [CrossRef]
  11. Gao, C.; Meng, D.; Yang, Y.; Wang, Y.; Zhou, X.; Hauptmann, A.G. Infrared Patch-Image Model for Small Target Detection in a Single Image. IEEE Trans. Image Process. 2013, 22, 4996–5009. [Google Scholar] [CrossRef]
  12. Hao, S.; Xie, J.; Wen, M.; Wang, Y.; Yuan, L. Design and realization of light and small long-wave infrared optical system. Infrared Laser Eng. 2020, 49, 293–300. [Google Scholar] [CrossRef]
  13. Xi, T.; Yuan, L.; Sun, Q. A Combined Approach to Infrared Small-Target Detection with the Alternating Direction Method of Multipliers and an Improved Top-Hat Transformation. Sensors 2022, 22, 7327. [Google Scholar] [CrossRef]
  14. Wan, M.; Gu, G.; Cao, E.; Hu, X.; Qian, W.; Ren, K. In-frame and inter-frame information based infrared moving small target detection under complex cloud backgrounds. Infrared Phys. Technol. 2016, 76, 455–467. [Google Scholar] [CrossRef]
  15. Perona, P.; Malik, J. Scale-space and edge detection using anisotropic diffusion. IEEE Trans. Pattern Anal. Mach. Intell. 1990, 12, 629–639. [Google Scholar] [CrossRef]
  16. Gong, Y.; Sbalzarini, I.F. Curvature Filters Efficiently Reduce Certain Variational Energies. IEEE Trans. Image Process. 2017, 26, 1786–1798. [Google Scholar] [CrossRef]
  17. Thorpe, J.A. Some remarks on the Gauss-Bonnet integral. J. Math. Mech. 1969, 18, 779–786. Available online: http://www.jstor.org/stable/24893137 (accessed on 1 January 2023).
  18. He, K.; Sun, J.; Tang, X. Guided image filtering. IEEE Trans. Pattern Anal. Mach. Intell. 2012, 35, 1397–1409. [Google Scholar] [CrossRef]
  19. Kim, S.; Yang, Y.; Lee, J.; Park, Y. Small Target Detection Utilizing Robust Methods of the Human Visual System for IRST. J. Infrared Millim. Terahertz Waves 2009, 30, 994–1011. [Google Scholar] [CrossRef]
  20. Moradi, S.; Moallem, P.; Sabahi, M.F. A false-alarm aware methodology to develop robust and efficient multi-scale infrared small target detection algorithm. Infrared Phys. Technol. 2018, 89, 387–397, ISSN 1350-4495. [Google Scholar] [CrossRef]
  21. Dai, Y.; Wu, Y.; Song, Y. Infrared small target and background separation via column-wise weighted robust principal component analysis. Infrared Phys. Technol. 2016, 77, 421–430. [Google Scholar] [CrossRef]
  22. Han, J.; Moradi, S.; Faramarzi, I.; Liu, C.; Zhang, H.; Zhao, Q.; Li, N. Infrared Small Target Detection Based on the Weighted Strengthened Local Contrast Measure. IEEE Geosci. Remote Sens. Lett. 2020, 18, 1670–1674. [Google Scholar] [CrossRef]
  23. Uzair, M.; Brinkworth, R.S.A.; Finn, A. Detecting Small Size and Minimal Thermal Signature Targets in Infrared Imagery Using Biologically Inspired Vision. Sensors 2021, 21, 1812. [Google Scholar] [CrossRef]
  24. Sun, J.; Gao, H.; Wang, X.; Yu, J. Scale Enhancement Pyramid Network for Small Object Detection from UAV Images. Entropy 2022, 24, 1699. [Google Scholar] [CrossRef] [PubMed]
  25. Man, Y.; Yang, Q.; Chen, T. Infrared Single-Frame Small Target Detection Based on Block-Matching. Sensors 2022, 22, 8300. [Google Scholar] [CrossRef] [PubMed]
  26. Fu, Q.; Liu, N.; Guo, H.; Liu, X.; Yan, Y.; Geng, D.; Zhang, S.; Zhan, J.; Duan, J. Multi-Band Polarization Imaging in a Harsh Sea Fog Environment. Appl. Sci. 2023, 13, 202. [Google Scholar] [CrossRef]
Figure 1. Block diagram of system components.
Electronics 12 03671 g001
Figure 2. Optical system structure.
Electronics 12 03671 g002
Figure 3. Transfer function of an optical system.
Electronics 12 03671 g003
Figure 4. Standard point layout (SPL).
Electronics 12 03671 g004
Figure 5. Information processing flowchart.
Electronics 12 03671 g005
Figure 6. The energy function curve during the iteration.
Electronics 12 03671 g006
Figure 7. Sequential experimental processing. (a) an unprocessed image (b) a significant map of the unprocessed image (c) an A-channel detection result (d) a significant map of the A-channel detection result (e) a B-channel detection result (f) a significant map of the B-channel detection result (g) a dual-channel fusion result (h) is a significant map of the dual-channel fusion result.
Electronics 12 03671 g007aElectronics 12 03671 g007b
Figure 8. Weak target images with different backgrounds. (a,b) on the background of river small target images (c,d) on the background of complex cloud small target images.
Electronics 12 03671 g008
Figure 9. Experimental results of different methods.
Electronics 12 03671 g009
Figure 10. Image detection plot with added pretzel noise of density 0.001.
Electronics 12 03671 g010
Figure 11. Image detection plot with Gaussian white noise with added variance of 0.001.
Electronics 12 03671 g011
Table 1. Average metrics for different algorithms in complex contexts.
AAGDIPIRLCMOur Method
P d 0.7910.8240.9300.988
F a 0.5550.5050.3150.070
mIoU 0.1350.3230.5760.893
R e c a l l 0.8260.8470.9340.980
F 1   s c o r e 0.8080.8360.9320.984
Table 2. Ablation experiment data.
P d F a mIoU R e c a l l F 1   s c o r e
Improved PM filtering only0.9570.0630.7980.9520.954
Improved PM filtering plus improved curvature filtering0.9570.0630.9030.9520.954
Improved local contrast algorithm only0.9390.0690.6950.9430.941
Improved bootstrap filtering plus improved local contrast algorithm0.9530.0700.7660.9520.952
Use of complete algorithms0.9930.0790.8930.9800.984
Disclaimer/Publisher’s Note: The statements, opinions and data contained in all publications are solely those of the individual author(s) and contributor(s) and not of MDPI and/or the editor(s). MDPI and/or the editor(s) disclaim responsibility for any injury to people or property resulting from any ideas, methods, instructions or products referred to in the content.

