Article

A Method for Restoring γ-Radiation Scene Images Based on Spatial Axial Gradient Discrimination

1
Xinjiang Technical Institute of Physics and Chemistry, Chinese Academy of Sciences, Urumqi 830011, China
2
Xinjiang Key Laboratory of Electronic Information Material and Device, Urumqi 830011, China
3
University of Chinese Academy of Sciences, Beijing 100049, China
*
Authors to whom correspondence should be addressed.
Electronics 2023, 12(17), 3734; https://doi.org/10.3390/electronics12173734
Submission received: 12 July 2023 / Revised: 17 August 2023 / Accepted: 28 August 2023 / Published: 4 September 2023
(This article belongs to the Section Microelectronics)

Abstract

:
Clear and reliable visual information is the premise and basis of work for nuclear robots. However, the ubiquitous γ rays in the nuclear environment will produce radiation effects on CMOS cameras and bring in complex visual noise. In this paper, combining the mechanism and characteristics of γ radiation noise, a method for restoring γ-radiation scene images based on spatial axial gradient discrimination is proposed. Firstly, interframe difference is used to determine the position of radiated noise on the image. Secondly, the gray gradients of different axes at noise pixels are calculated, and two axes with lager gray gradients are selected. Then, the adaptive medians are selected on the two axes, respectively and are weighted according to the gradient as the new value of the noise pixel. Finally, the Wallis sharpening filter is applied to enhance the detailed information and deblur the image. Plenty of experiments have been carried out on images collected in real γ radiation scenes, and image quality has been significantly improved, with Peak Signal to Noise ratio (PSNR) reaching 30.587 dB and Structural Similarity Index Mean (SSIM) reaching 0.82. It is obvious that this method has advanced performance in improving the quality of γ-radiation images. It can provide method guidance and technical support for the software module design of the anti-nuclear radiation camera.

1. Introduction

As an efficient and clean energy source, nuclear energy has long been widely valued. However, the high-energy particles and rays present in the intense nuclear radiation environment are harmful to human health; thus, the daily maintenance and emergency handling of accidents in nuclear power plants require the application of anti-radiation robots to achieve refined remote operations [1]. Clear and reliable visual information is the premise and basis of work for nuclear robots. The anti-radiation robot is equipped with a camera to acquire scene environment information [2]. The image sensor, as the core device of a camera, largely determines the imaging quality of the camera system. Compared with the CCD image sensor, the CMOS image sensor (CIS) has the advantages of small size, low cost, and strong anti-radiation ability; therefore, most cameras used in the nuclear industry generally adopt CIS as an imaging device [3], that is, the CMOS camera. However, the ubiquitous γ rays have the strongest penetration [4] in the nuclear environment and will produce radiation effects on CMOS cameras and introduce complex visual noise, reducing imaging quality [5,6] and even impeding the implementation of related engineering operations in severe cases, leading to catastrophic consequences.
In view of the problem that the visual information is unreliable due to radiation, the traditional solution is to strengthen the camera equipment against radiation from the perspectives of process, circuit design, and shielding materials [7], but it faces the challenges of high production cost, long cycle, low flexibility, and high technical complexity.
In recent years, with the development of the computer vision technique, scholars have tried to deal with image noise in radiation scenes in spatial domain filtering, transform domain analysis, and machine learning. For instance, Cao [8] used the time-domain median filtering method to remove the pulse noise caused by γ rays in medical images, but it mainly applied to point (single pixel) noise not patch noise. Wang [9] combined adaptive median filtering and wavelet transform to denoise. Zhang [10] combined the wavelet and Kalman filtering methods to reduce the noise of videos, and the SSIM was improved. Hosoya [11] combined spatial domain and time domain filtering to remove the noise of nuclear radiation image under static background. Chen [12] proposed a nonlinear filtering method based on spatial rows for the forward pulse noise generated by X-ray radiation. Ren [13] combined the adjacent pixel value comparison method and the four-direction method to determine the noise location and used the WNNM to filter the extracted noise. Sun [14] led the residual network learning model in training the radiation-induced noise image and the clean image and learned the mapping relationship between them by minimizing the Euclidean distance. Additionally, more and more researchers tried deep learning methods to solve the noise problem of radiation images [15,16].
Overall, the existing methods above have different limitations or disadvantages in dealing with the noise image under the real nuclear radiation environment. Specifically, the spatial filtering, such as median filter and Gaussian filter, has a better effect for pulse noise (single pixel) since it usually repairs noise by a fixed filter window but has the limitation in removal of patch noise (multi-pixel) caused by γ rays and will blur the image. The transform domain analysis and filter, such as Fourier and Wavelet transform, is mainly through the difference between the frequency information of noise and background information, but the frequency distribution of γ noise is not necessarily concentrated; when the frequency distributions of noise and background overlap, this method will result in a blurred image and incomplete noise reduction. The machine learning achieves image denoising mainly by learning the mapping relationship between clean images and noisy images. It is effective but needs multiple data sets to learn the mapping relationships. Considering the particularity and complexity of the radiation environment, the training data under different conditions are not easy to obtain, and the robustness of the acquired mapping relationship in the real radiation environment is uncertain. As the γ radiation noise is different from the typical noise in images, the effective method for restoring γ-radiation scene images should be proposed based on the mechanism and characteristics.
In this paper, after synthesizing the ideas and shortcomings of the existing radiation image denoising methods and analyzing the mechanism and characteristics of γ radiation noise, a γ radiation scene image restoration method based on spatial axial gradient discrimination is proposed. A large number of experiments are carried out on the video images collected in the real γ radiation scene, and the noise image quality has been obviously improved.

2. Mechanism and Characteristic of γ-Radiation Scene Image Noise

CMOS image sensors operating in the radiation environment will be affected by high-energy particles or rays, resulting in the ionization total dose effect (TID), the displacement damage (DD) effect, and the transient effect, which will degrade their photoelectric performance and deprave the image quality [17]. The image noise in the γ radiation scene mainly comes from the transient effect of γ rays on CIS, while Compton scattering is the main mode of action of the transient effect of γ rays on CIS [18]. The physical process of the Compton-scattering effect is shown in Figure 1, the red line denotes the track of photon or electron and black dot denotes the atom or electron, and the energy of the recoil electron [19] is shown in Equation (1).
E e = h v h v = h v 2 1 cos θ m c 2 + h v 1 cos θ
where hv is the photon energy, hv′ is the scattering photon energy, m is the electronic static mass, c is the speed of light, and θ is the angle between the incident photon and the scattering photon.
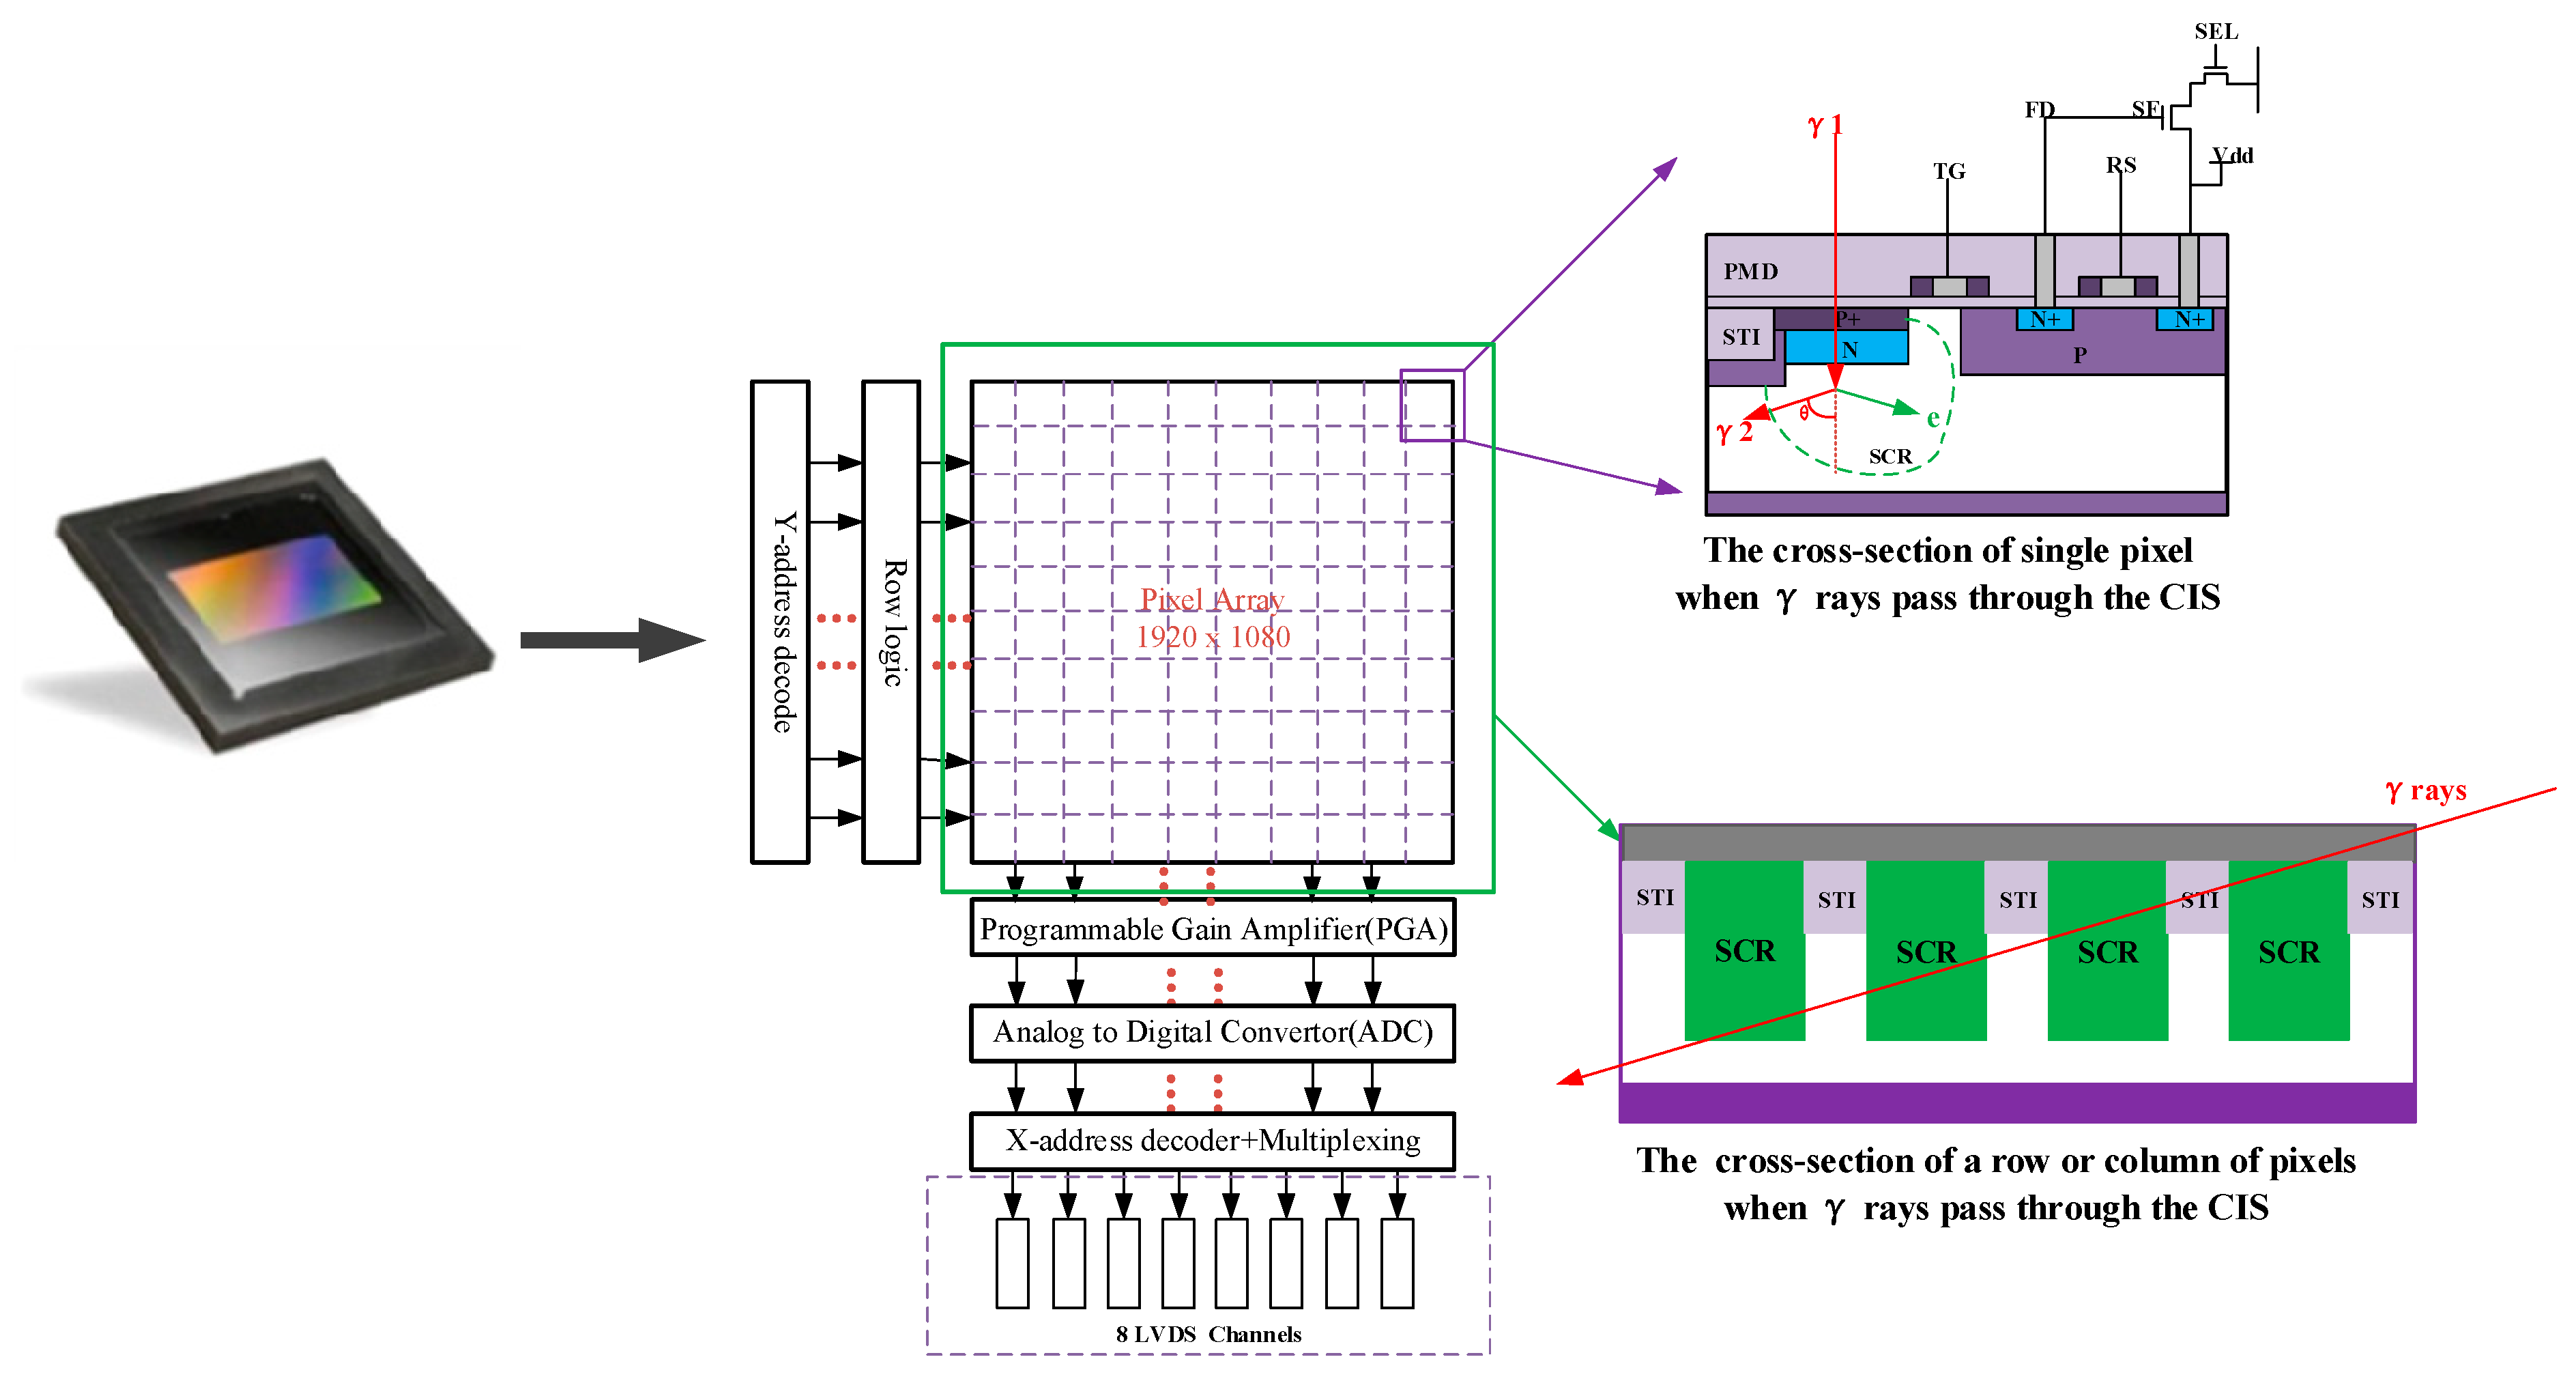
As shown in Figure 2, the recoil electrons generated by the Compton-scattering effect between γ rays and Si atoms in CIS will ionize extra electrons hole pairs other than photogenerated electrons in the space charge region (SCR) of pixels contained in the track of γ-ray and are collected as part of the output charge pack in the SCR. It will be embodied as the noise pixels, which are in the digital image with an abnormally high gray value after the CIS programmable gain amplification (PGA) and digital-to-analog conversion (ADC).
Furthermore, with the advancement of semiconductor technology, the thinner the shallow channel isolation (STI), the more the neighboring pixels passed through a single γ-ray, which is reflected as the random irregular linear shape noise region on the image. In addition, with the increase of the cumulative dose in CIS, the isolation ability of the STI layer between CIS pixels will decrease. When the radiation dose rate is high, the excess carriers generated by γ photons in the SCR of a single pixel are likely to break through the STI layer between pixels and diffuse to adjacent pixels, which is manifested as the broadening of linear shape noise on the image [20].
The generation mechanism of the γ-radiation scene image noise above is an important basis for the image restoration method proposed in this paper. Based on the noise generation mechanism, the noise characteristics of the γ-radiation image are summarized as follows:
The first one is the difference of pixel inside and outside the noise area. The excess carriers generated by the γ-photon energy deposited in the pixel are much larger than the background photogenerated electrons, so the gray value between the noise pixel and the normal pixel is obviously different and inconsistent. In addition, considering the continuity of energy attenuation when a single γ photon passes through adjacent pixels and the smoothness of excess carrier overflow caused by γ radiation in a single pixel, the gray value of a pixel in a single noise region has a continuous correlation.
The second one is the geometric characteristic. Due to the isotropy of the decay process of the radiation source, the incidence angle and motion trajectory of the high-energy γ photon acting on the CIS are independent of each other, and the motion trajectory of the recoil electron has a single direction at a certain time, resulting in the characteristics of non-uniform linear shape and random position of the noise [21]. From the perspective of local correlation of information in the noise area, the geometric features of γ radiation noise can be used to purify the radiation image.
The last one is the transient pulse characteristic. Since the transmission time of γ photon in CIS is much less than the integration time of the camera and CIS, the influence of a single photon on the imaging results is not continuous. Specifically, if the pixel position on a certain frame image is a radiation noise point, the probability of the same position on the image before and after this frame is extremely low.
The method proposed in this paper is mainly based on the mechanism and characteristics of the γ-radiation scene image noise mentioned in this section.

3. Proposed Method

In this paper, a γ radiation scene image restoration method is proposed. It mainly includes four steps: inter-frame differential detection of noise position, spatial axial gradient discrimination, axial adaptive weighted median filtering, and Wallis sharpening of the filtering. The specific implementation flow chart is shown in Figure 3.

3.1. Inter-Frame Differential for Detection of the Position of Noise

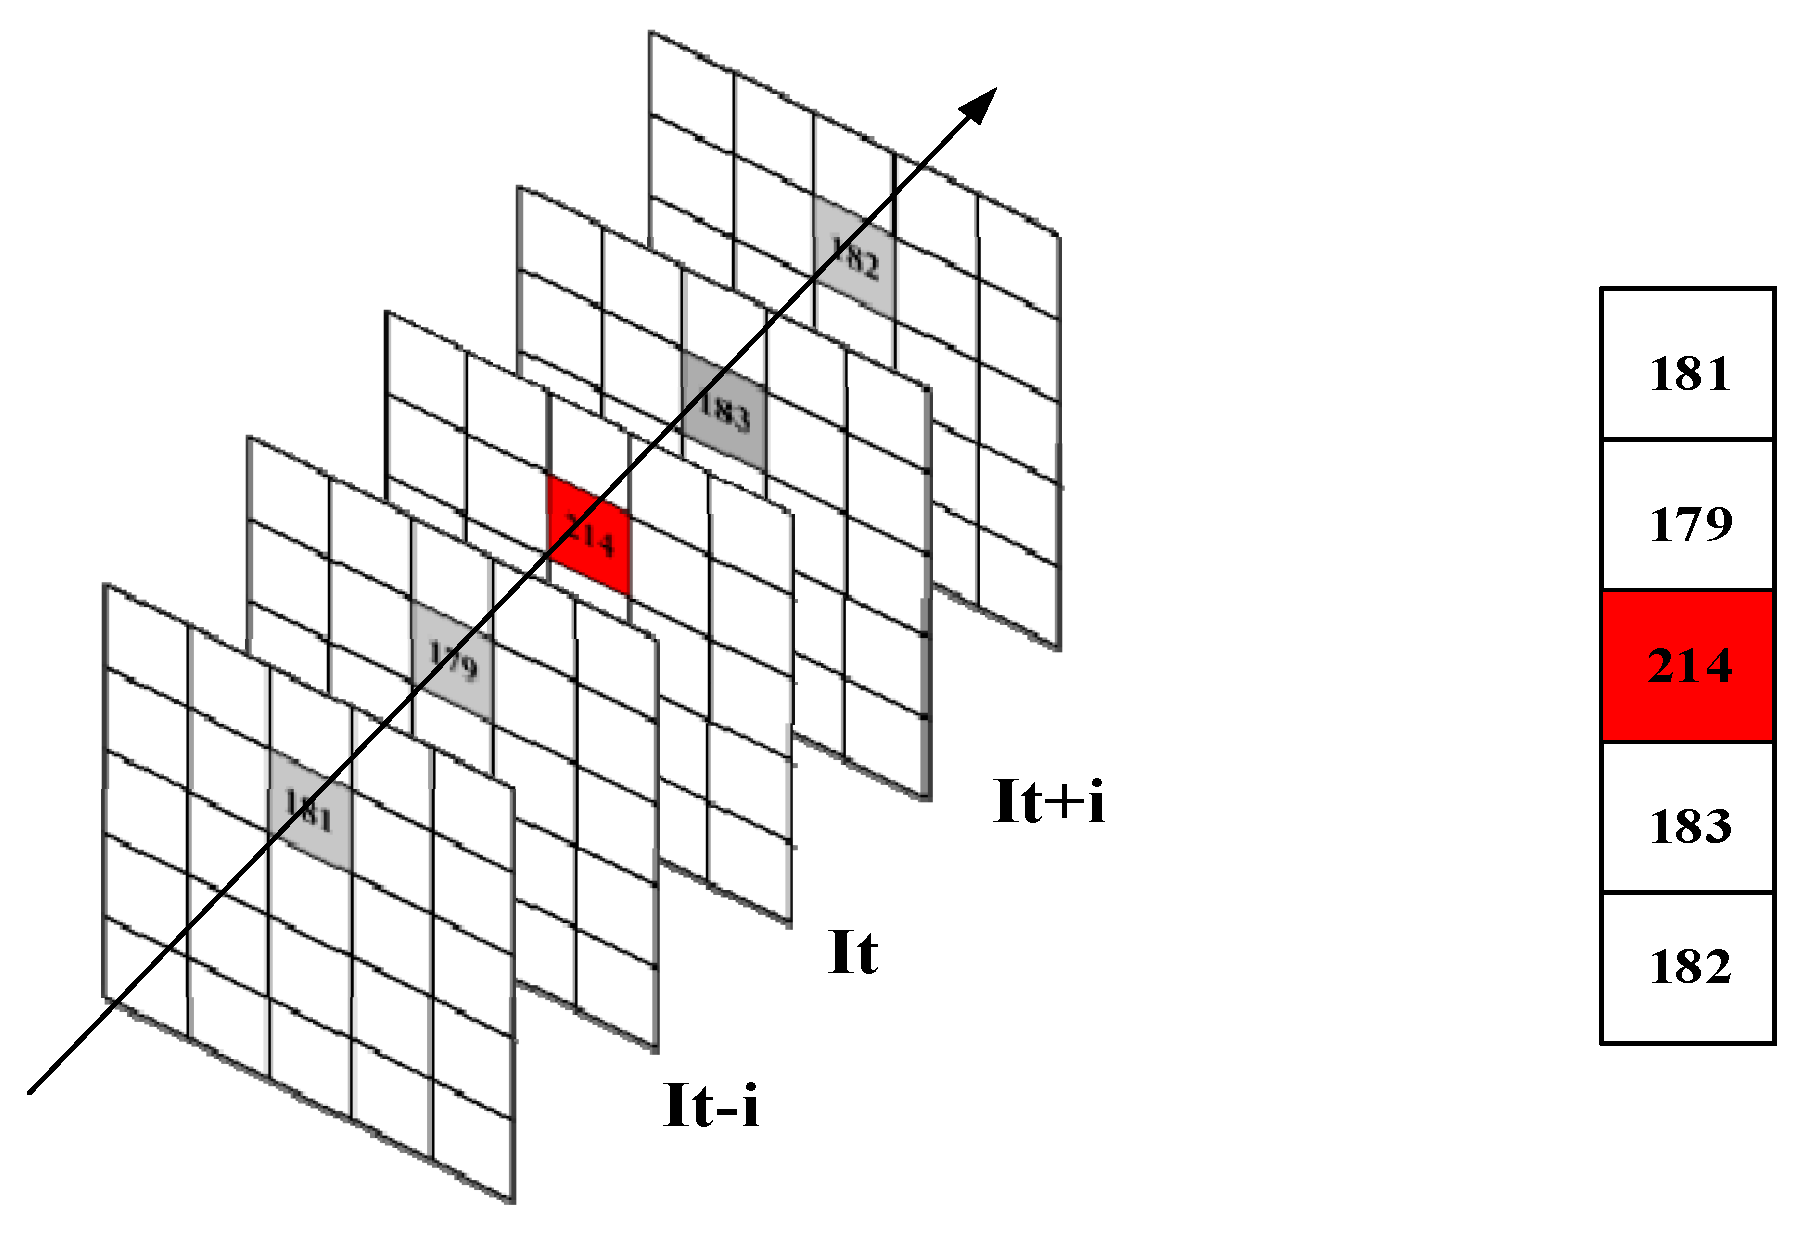
Considering the correlation of background information between adjacent frames in the static scene and the transience of noise pixels between adjacent frames, the probability that the pixel position affected by γ radiation is still noise at the same position on its adjacent frames is extremely low, so this paper adopts the method of inter-frame differential comparison to determine the location of noise on the image, as shown in Figure 4, the red square denotes the noise pixel detected in the It frame image, and the different gray squares dote normal pixels in adjacent frames in a same time series.
For the t-frame image I t , each f before and after the frame is expressed as I t f , I t f + 1 I t I t + f 1 , I t + f , the gray value of pixels (x, y) location in the current frame image can be expressed as I t ( x , y ) , and the Equation (2) can be used to judge whether (x, y) is noise:
R x , y = s g n { i = 1 f s g n ( | I t x , y I t ± i x , y T i k × f }
where the R x , y denotes the discriminant result of the (x, y) position in the current frame image as noise or not, 1 means yes, 0 means no; I t ( x , y ) represent the gray value of (x, y) location in current frame; I t ± i x , y represent the gray value of the (x, y) location in the i-frame image before or after the current frame; T i represent the threshold of the difference between the gray value of the noise pixel and the normal background pixel; k is the scale coefficient; sgn is the step response function, as shown in Equation (3)
s g n x = 1 ( x > 0 ) 0 ( x 0 )
If point (x, y) is judged to be a noisy pixel, subsequent processing is performed; otherwise, the point pixel is not processed.

3.2. Calculation and Discrimination of Spatial Axial Gradients

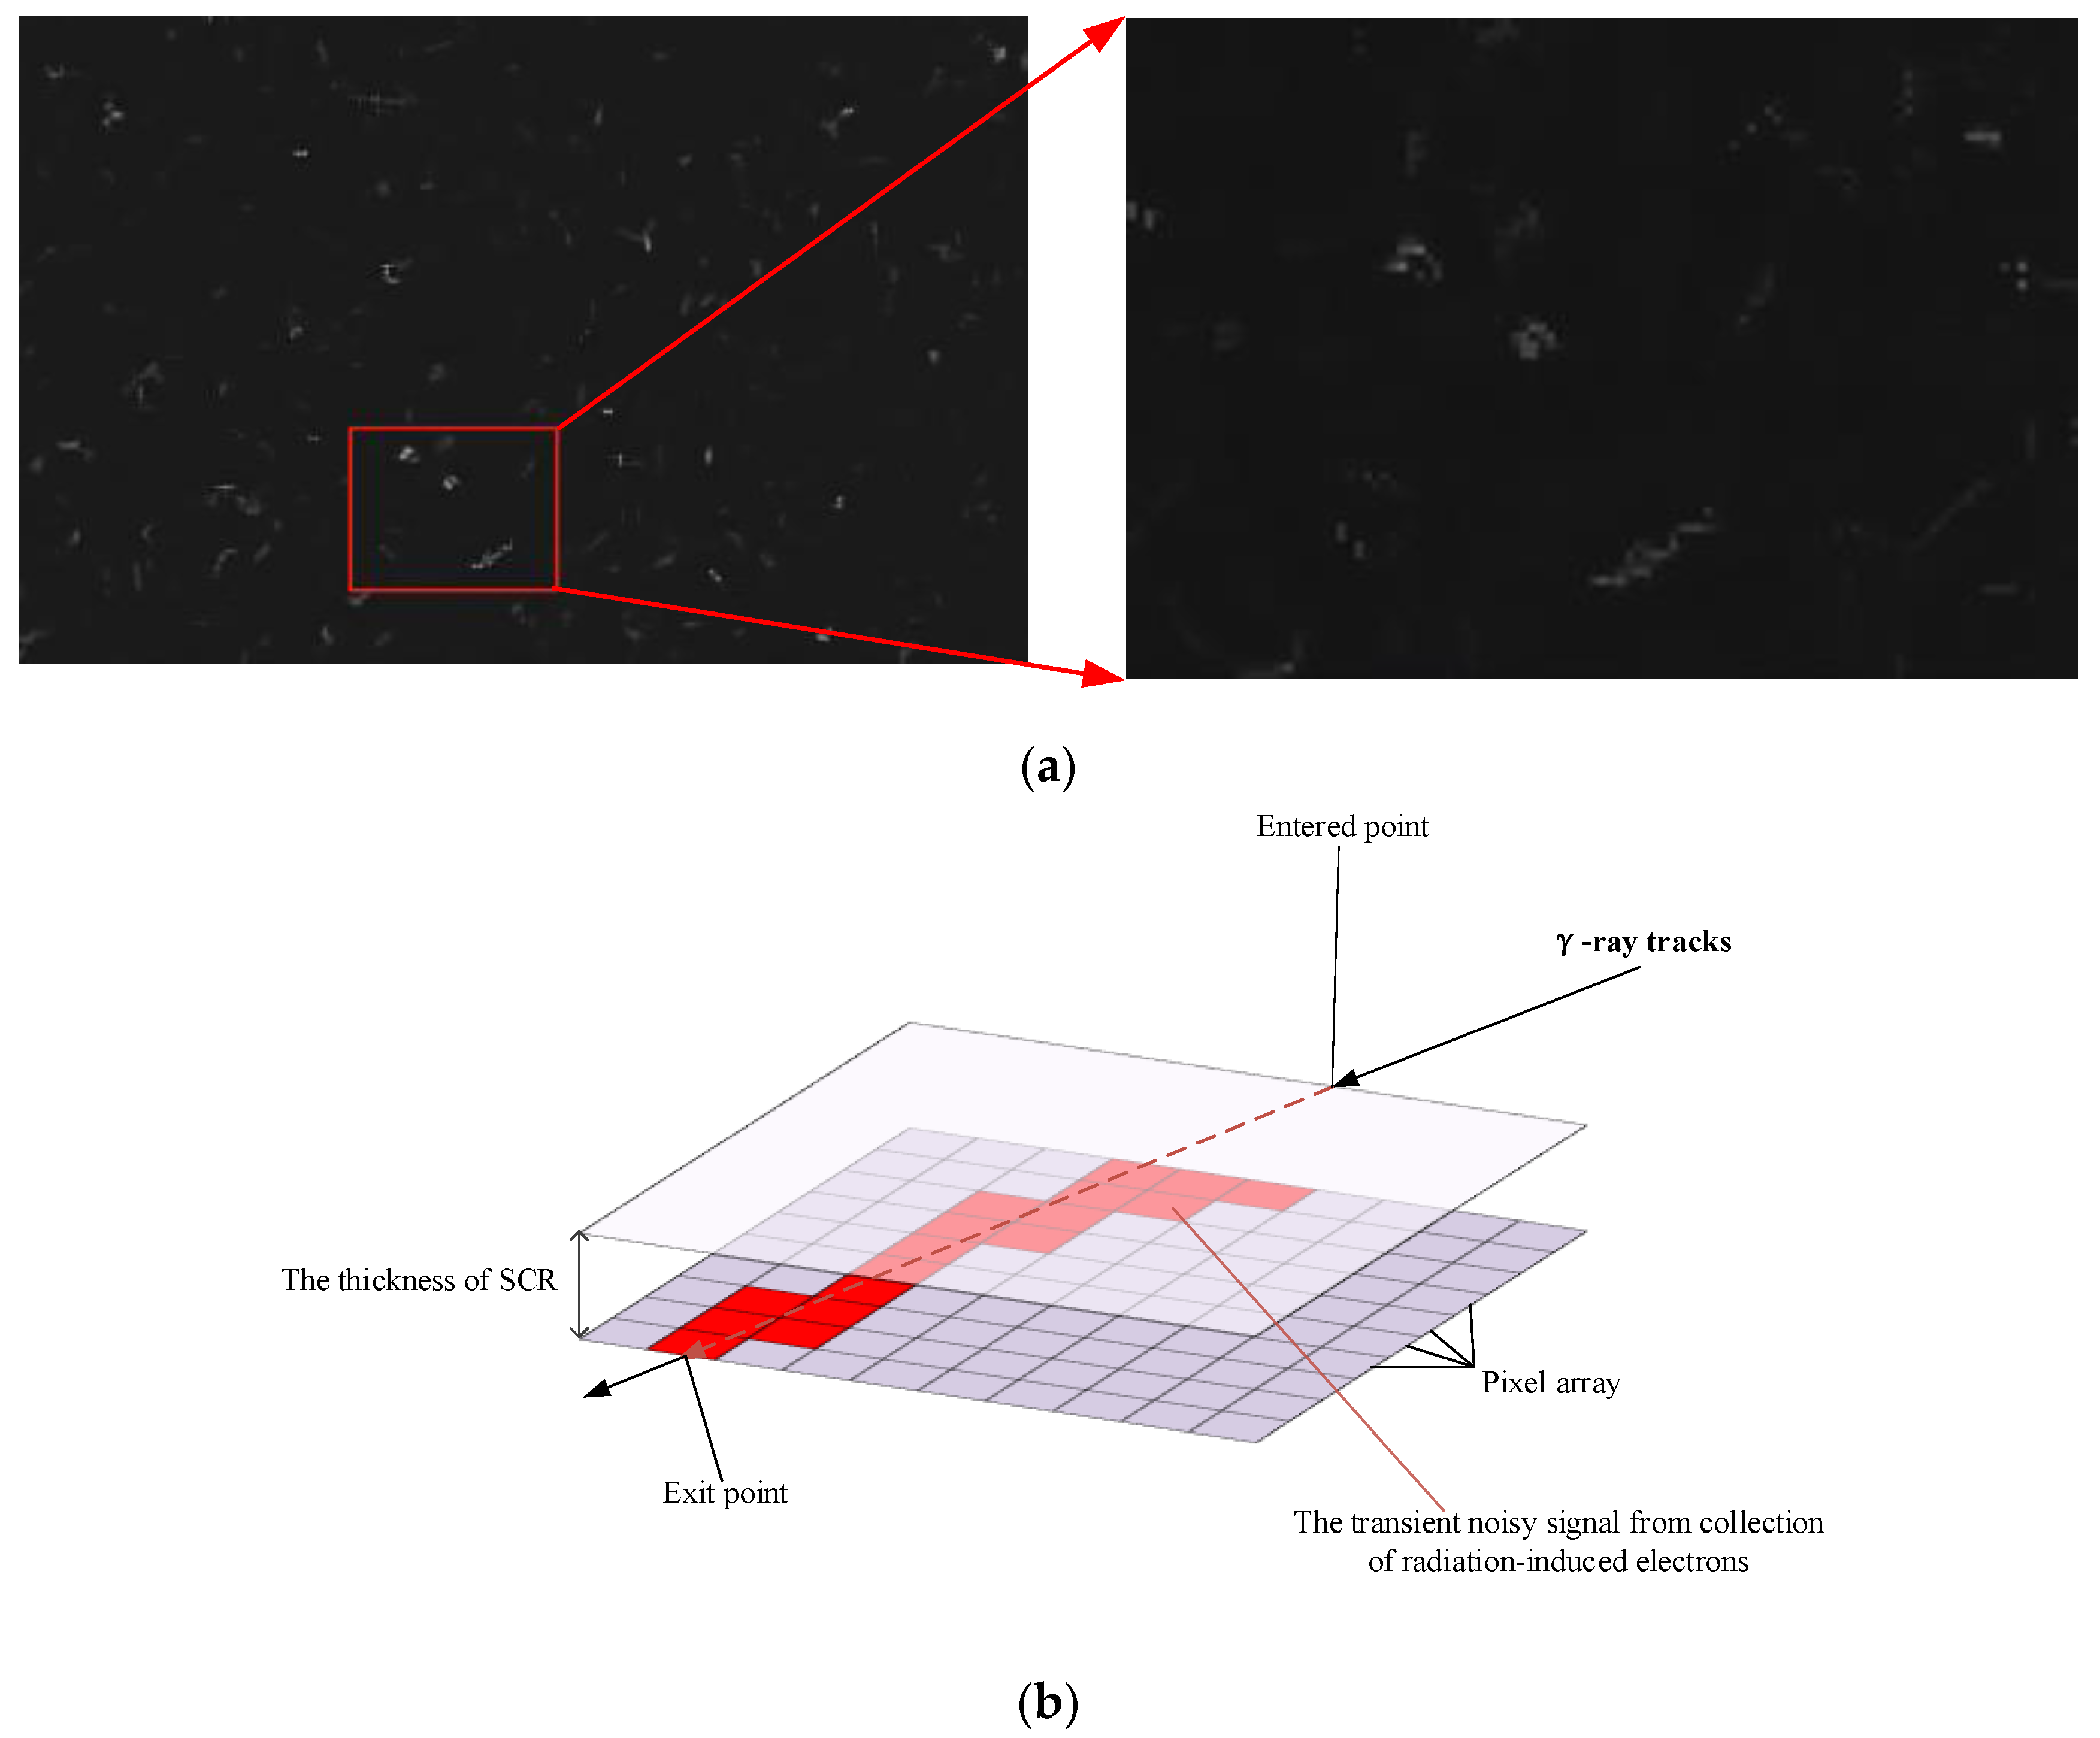
Since the moving path of the γ photons passing through pixels in CIS has a directional characteristic, the shape of noise in the γ radiation scene image is generally linear or curved. Figure 5a shows a γ radiation dark field scene image with a dose rate of 28 rad (Si)/s, and Figure 5b shows the process of energy deposition when γ-rays pass through CIS, the red squares denote pixels that have deposited energy from γ photon and the black arrows denote direction of incident γ photon. The shape of the single noise region is the reflection of γ-rays passing through the pixel path in CIS.
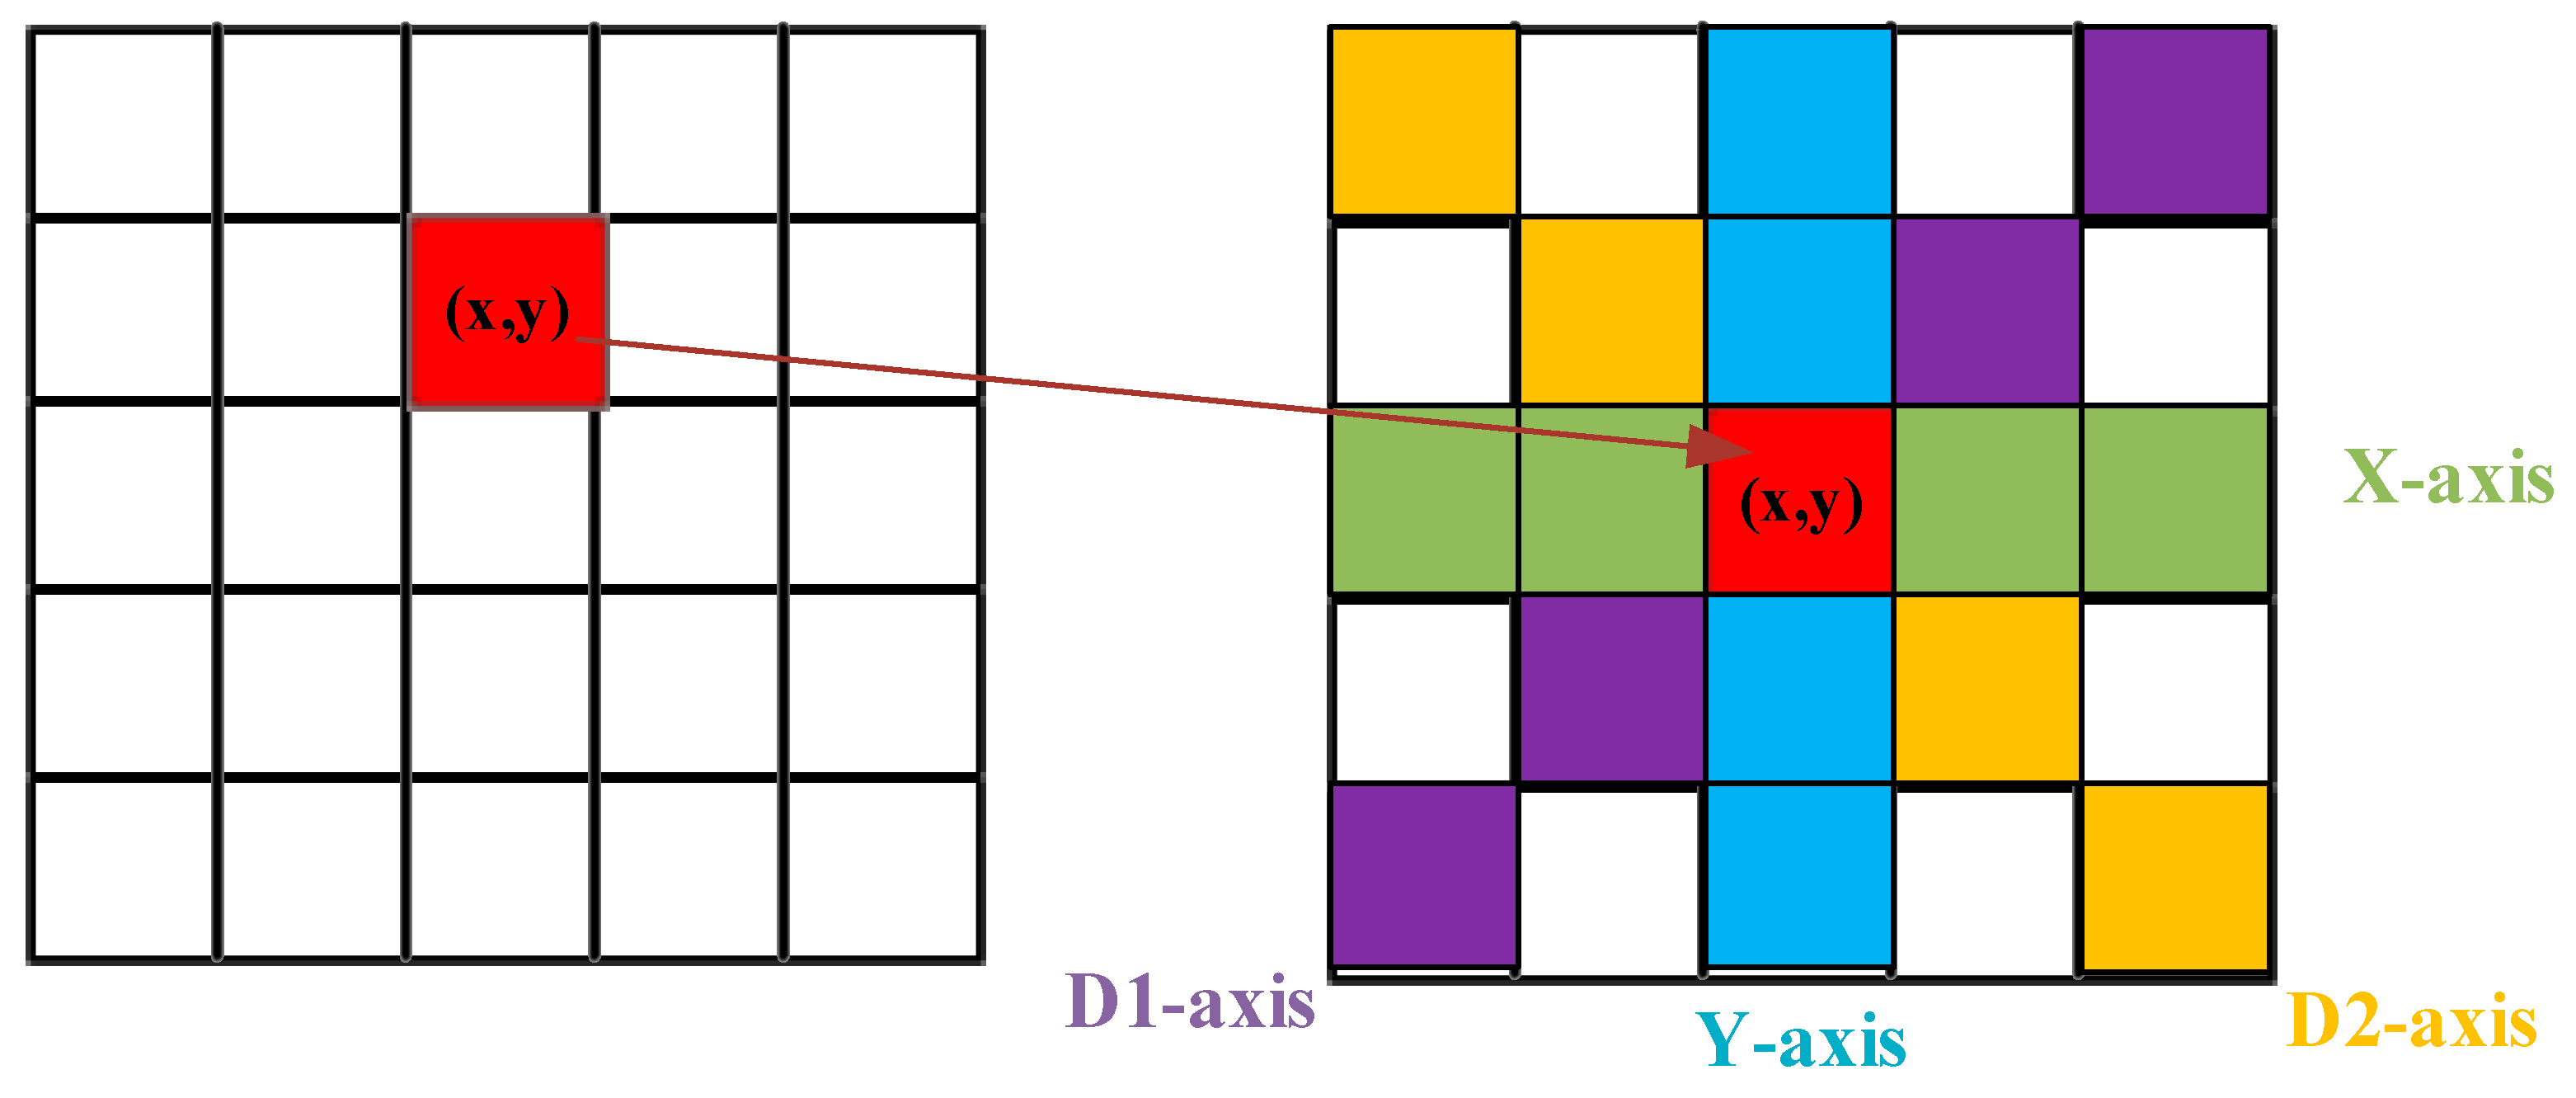
After analyzing the geometric characteristics of the γ-radiation scene image noise, it is found that the pixels in a single noise region mainly gather on a certain axis, that is, the moving path of γ-photon. Therefore, on the basis of step in Section 3.1, this section takes the location coordinates of the noise pixels detected in the image as the center and calculates the gray gradient values on their horizontal x axis, vertical y axis, and diagonal d1 and d2 axes, respectively, as shown in Figure 6, the red square denotes noise pixel, and green, blue, purple and yellow squares denote pixels adjacent to noise pixel on X-axis, Y-axis, D1-axis and D2-axis respectively.
By Equations (4)–(7) the four axial gradient values, G x , G y , G d 1 , and G d 2 , on the noise pixel position are calculated, respectively, and compared to Equations (8) and (9). Because of the correlation between the pixels in the noise spot and the difference between the noise spot and the background pixel, the axis with the smallest gradient value is most likely to be the main distribution aggregation axis of the noise pixels, and axes with higher gradient values are more likely to be clean pixels. Therefore, we calculate the gradient values of four axes and select the two axes with the larger gradient value.
G x = i = 1 n | I x , y I x , y ± i | n
G y = i = 1 n | I ( x , y ) I x ± i , y | n
G d 1 = i = 1 n | I ( x , y ) I x ± i , y ± i | n
G d 2 = i = 1 n | I ( x , y ) I x ± i , y ± i | n
G m a x 1 = m a x ( G x ,   G y ,   G d 1 ,   G d 2 )
G m a x 2 = m a x { ( G x ,   G y ,   G d 1 ,   G d 2 ) G m a x }
where n is the number of adjacent pixels selected when calculating the gradient value, which is set according to the dose rate. Generally speaking, the higher the dose rate, the larger the n is set. G m a x 1 and G m a x 2 , respectively, indicate the maximum gradient value and the larger gradient value.

3.3. Axially Adaptive Weighted Median Filtering

The two axes with maximum gradient value G m a x 1 and secondary large gradient value G m a x 2 , respectively, are chosen and are processed in this section. The adaptive median gray values of pixels other than the points on (x, y) are selected, respectively, on the two axes. The specific steps are as follows:
(A).
Assuming that Z x y is a collection of m pixel gray values adjacent to the (x, y) point on the axis, Z m a x , Z m i n , and Z m e d , respectively, denote the maximum, minimum, and middle values in Z x y . If Z m e d Z m a x < 0 and Z m e d Z m i n > 0 , then the output Z m e d is the middle value of axial; otherwise, it enters layer B;
(B).
Steps A after m = m + 2 are repeated until the output is reasonable, Zmed;
The two median values selected in two axes with maximum and secondary large gradient values are respectively marked as I z m a x and I z m e d . The two medians are weighted according to the gradient values on the corresponding axes as the new pixel values at (x, y), as shown in Equation (10), to achieve the purpose of denoising.
I ( x , y ) = G m a x G m a x + G m e d × I z m a x + G m e d G m a x + G m e d × I z m e d

3.4. Wallis Sharpening

Considering that the isolation ability of the shallow channel isolation (STI) layer in CIS to inter-pixel carriers gradually decreases with the increase of the γ-ray irradiation dose, which will cause the diffusion of noisy pixels and blur the image details to a certain extent, this section uses the Wallis-sharpening method to enhance the image details. The Wallis-sharpening algorithm is based on the Laplacian operator, considering that human visual characteristics contain a logarithmic link, so in sharpening, the logarithmic processing method is adopted to improve, as shown in Figure 5 and Equation (11), and the dark area details can be improved after being sharpened.
P x , y = 46 × 5 log P x , y + 1 i = 1 4 l o g P i x , y + 1 ,   1
where P x , y denotes the pixel gray value of the (x, y) point before sharpening, and P x , y denotes the pixel gray value of the (x, y) point after sharpening.

4. Experiment Conditions and Platform

The irradiation experiment was carried out on the 60Co-γ radiation source of Xinjiang Institute of Physics and Chemistry, Chinese Academy of Sciences. Figure 7 is the schematic diagram of the irradiation experiment. The modular camera system that contains the hardened lens, CIS, and shielding mainboard was used to capture the standard test card under the 28 rad(Si)/s dose rate irradiation; the images captured by the camera were transmitted to the PC through the network cable.
The program development platform is Intel Core [email protected] GHz, and the programming environment is Visual Studio 2022@OpenCV 4.7 on an 8 GB computer. The noise image of the γ radiation scene used is derived from the video image collected in the above camera γ irradiation test.

5. Result and Discussion

5.1. Visual Contrastive Analysis

In order to clearly and intuitively evaluate and measure the performance of the proposed method, this paper conducted a full pre- and post-processing comparison experiment on real γ radiation images with the dose rate of 28 rad/s, as shown in Figure 8, one of the typical pre- and post-processing comparison images.
As shown in Figure 8a, the image of the standard test card was taken in a γ radiation environment. It can obviously be seen that a large number of white pixel noises with high gray value caused by γ photons are randomly distributed on the image, intuitively affecting the visual effect and reducing the image quality. Figure 8b is the result of Figure 8a processed by the method proposed in this paper. It can be seen that noisy pixels have been significantly repaired, image details blocked by noise are reproduced, and image quality has been significantly improved.

5.2. Quantitative Index Analysis

It is difficult to objectively and accurately evaluate the restoration effect of the algorithm only with a single visual comparison. Therefore, two typical image quality quantification indexes, PSNR and SSIM, are used in this paper to evaluate the restoration performance of the method.
PSNR indicates the power ratio of the non-noisy signal to the noisy signal in the image, and the larger the PSNR is, the better the image quality is. Its mathematical expression is shown in Equation (12). From the perspective of image structural similarity, SSIM comprehensively analyzes the similarity of brightness, contrast, and structure between the post-processing image and the clean image. The larger the SSIM value is, the closer the post-processing image is to the clean image, that is, the better the image quality is. Its mathematical description is shown in Equation (13).
M S E = 1 M × N i = 1 M j = 1 N ( G i , j F i , j ) 2 P S N R = 10 l o g 10 2 N 1 2 M S E                                                                              
l = 2 μ G μ F + C 1 μ G 2 + μ F 2 + C 1 c = 2 σ G σ F + C 2 σ G 2 + σ F 2 + C 2 SSIM = l × c × s s = σ G F + C 3 σ G σ F + C 2        
where G and F represent the image after restoration and the clean image, respectively; MSE is the mean square error between the post-processing image and the clean image. μ G and μ F , respectively, correspond to the image pixel grayscale averages; σ G and σ F , respectively, correspond to the image pixel gray variances; σ G F is the covariance between the two images; C 1 , C 2 , and C 3 were constant.
In order to verify the effectiveness of the restoration method proposed in this paper, we conducted ablation experiments on tunable parameters, such as the number of adjacent pixels n selected for calculating the axial gradient value in the implementation step, the gray value threshold T selected for determining the position of noisy pixels by inter-frame difference, and the number of adjacent frames f selected for difference. The images used for ablation experiments were all γ radiation scene images with a dose rate of 28 rad(Si)/s.

5.2.1. Effect of the Adjacent Pixels Number n

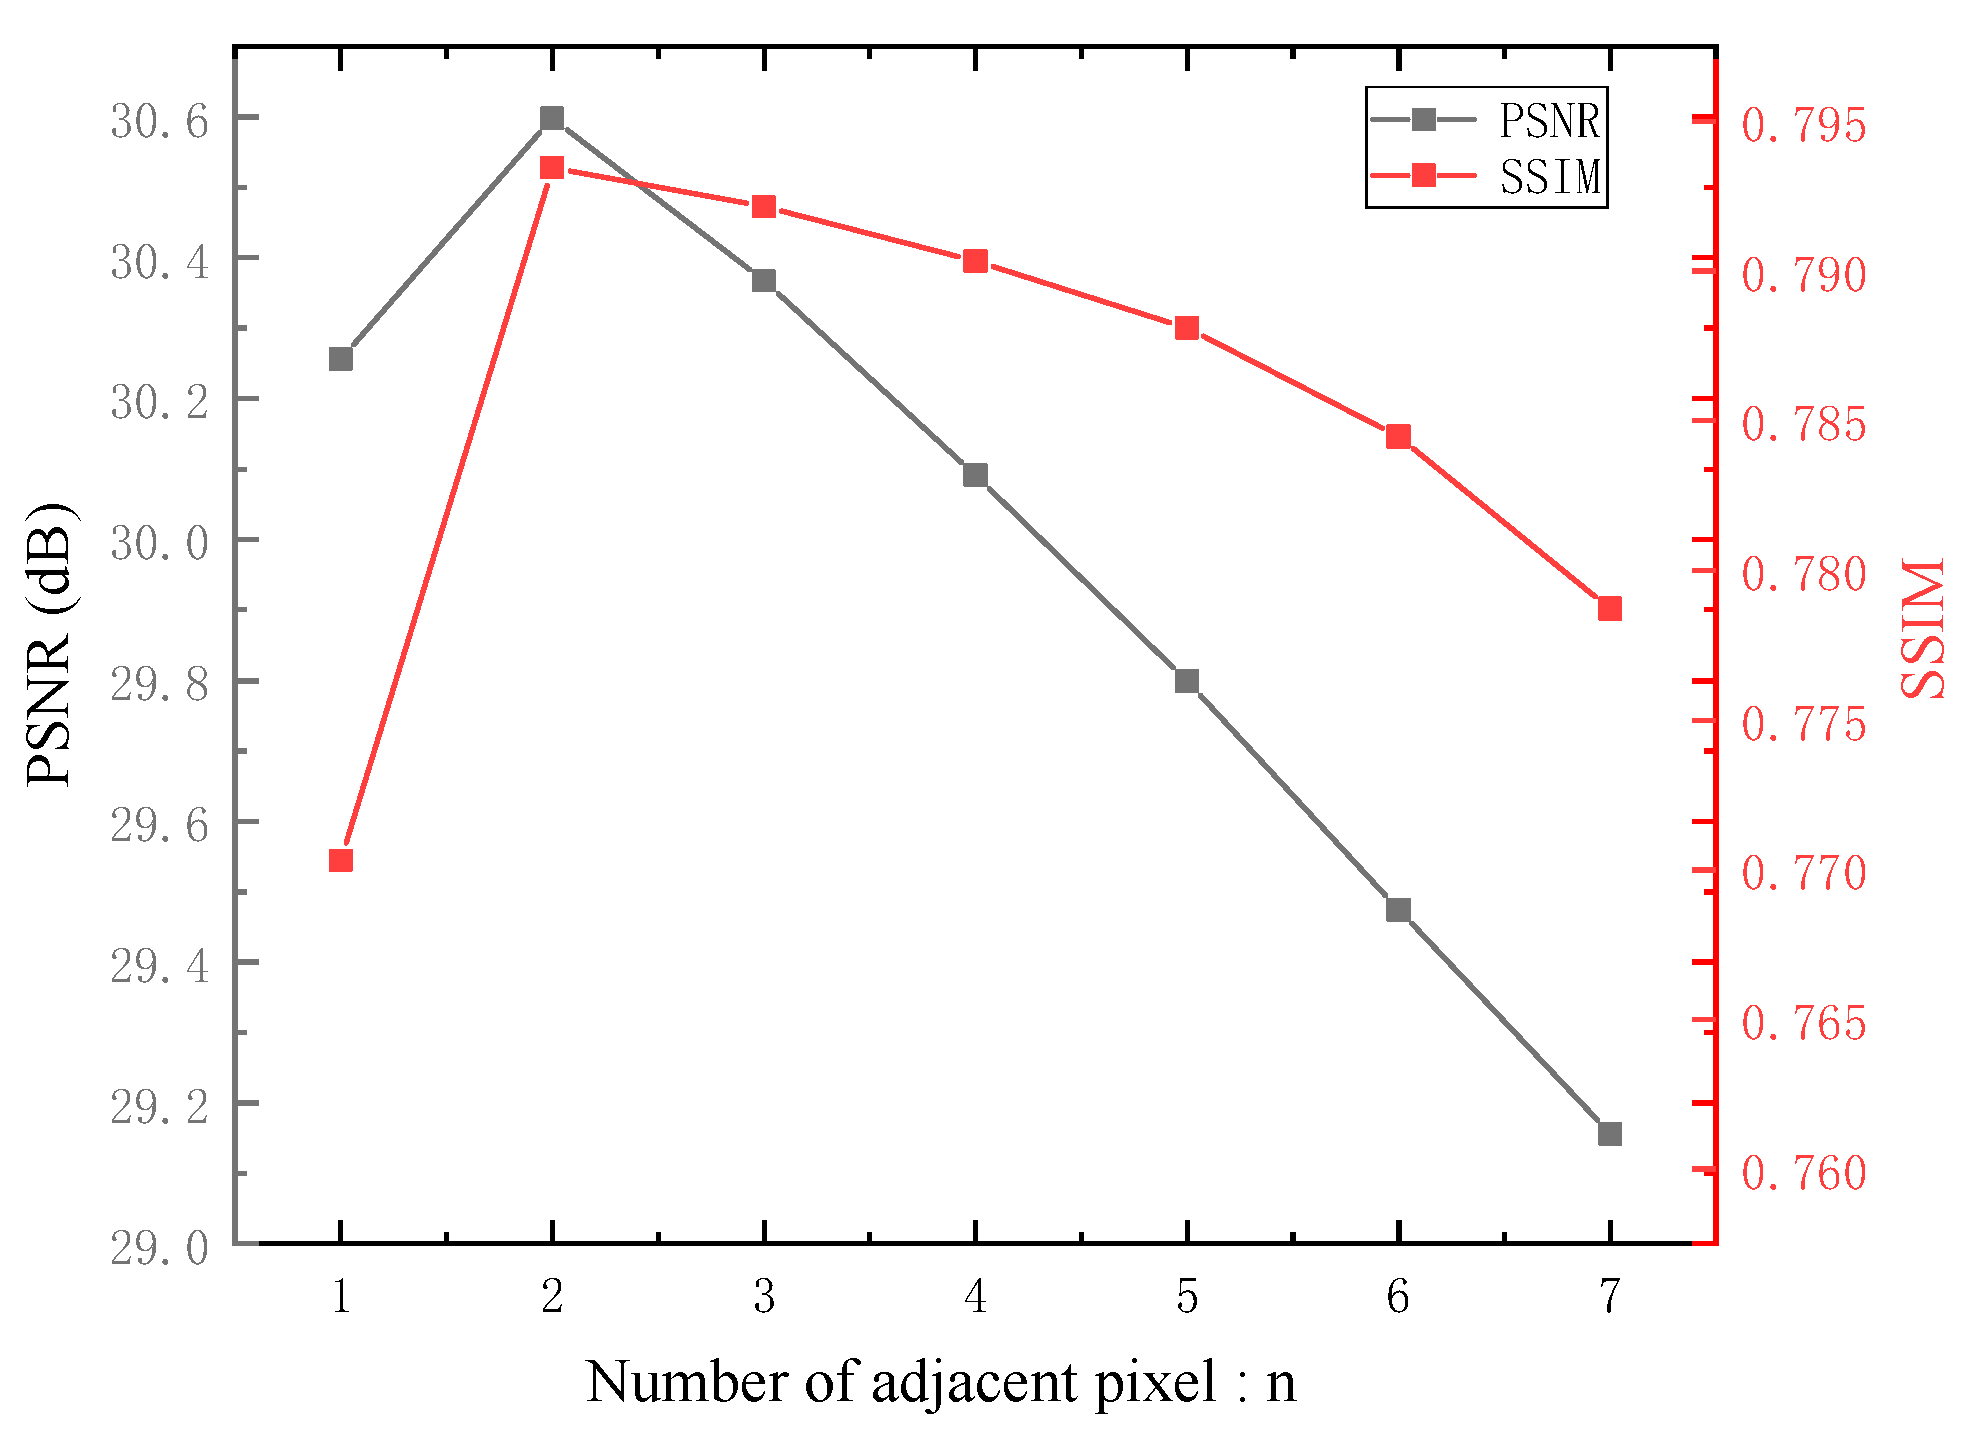
The calculation of axial gradients at the noise pixel is the core of the proposed method in this paper, and the selection of the number of adjacent pixels n at the noise pixel is particularly important when calculating the gradient. If n is too small, the range of the calculated gradient cannot fully include the noise area, which will lead to incomplete noise reduction. If n is too large, the calculation amount of the method will increase, and the image will become blurry after noise reduction. Generally, the larger the noise area, the larger n should be selected, so the selection of the number of adjacent pixels n is often related to the dose rate of the radiation environment. Figure 9 shows the quantitative comparison of the denoising effect when the number of different adjacent pixels n is selected.
It can be seen from Figure 9 that with the increase of the number of adjacent pixels n, the peak signal-to-noise ratio (PSNR) and structural similarity (SSIM) both show a trend of first increasing and then decreasing, and when n = 2, the method can achieve the best effect.

5.2.2. Effect of the Threshold T in Interframe Difference

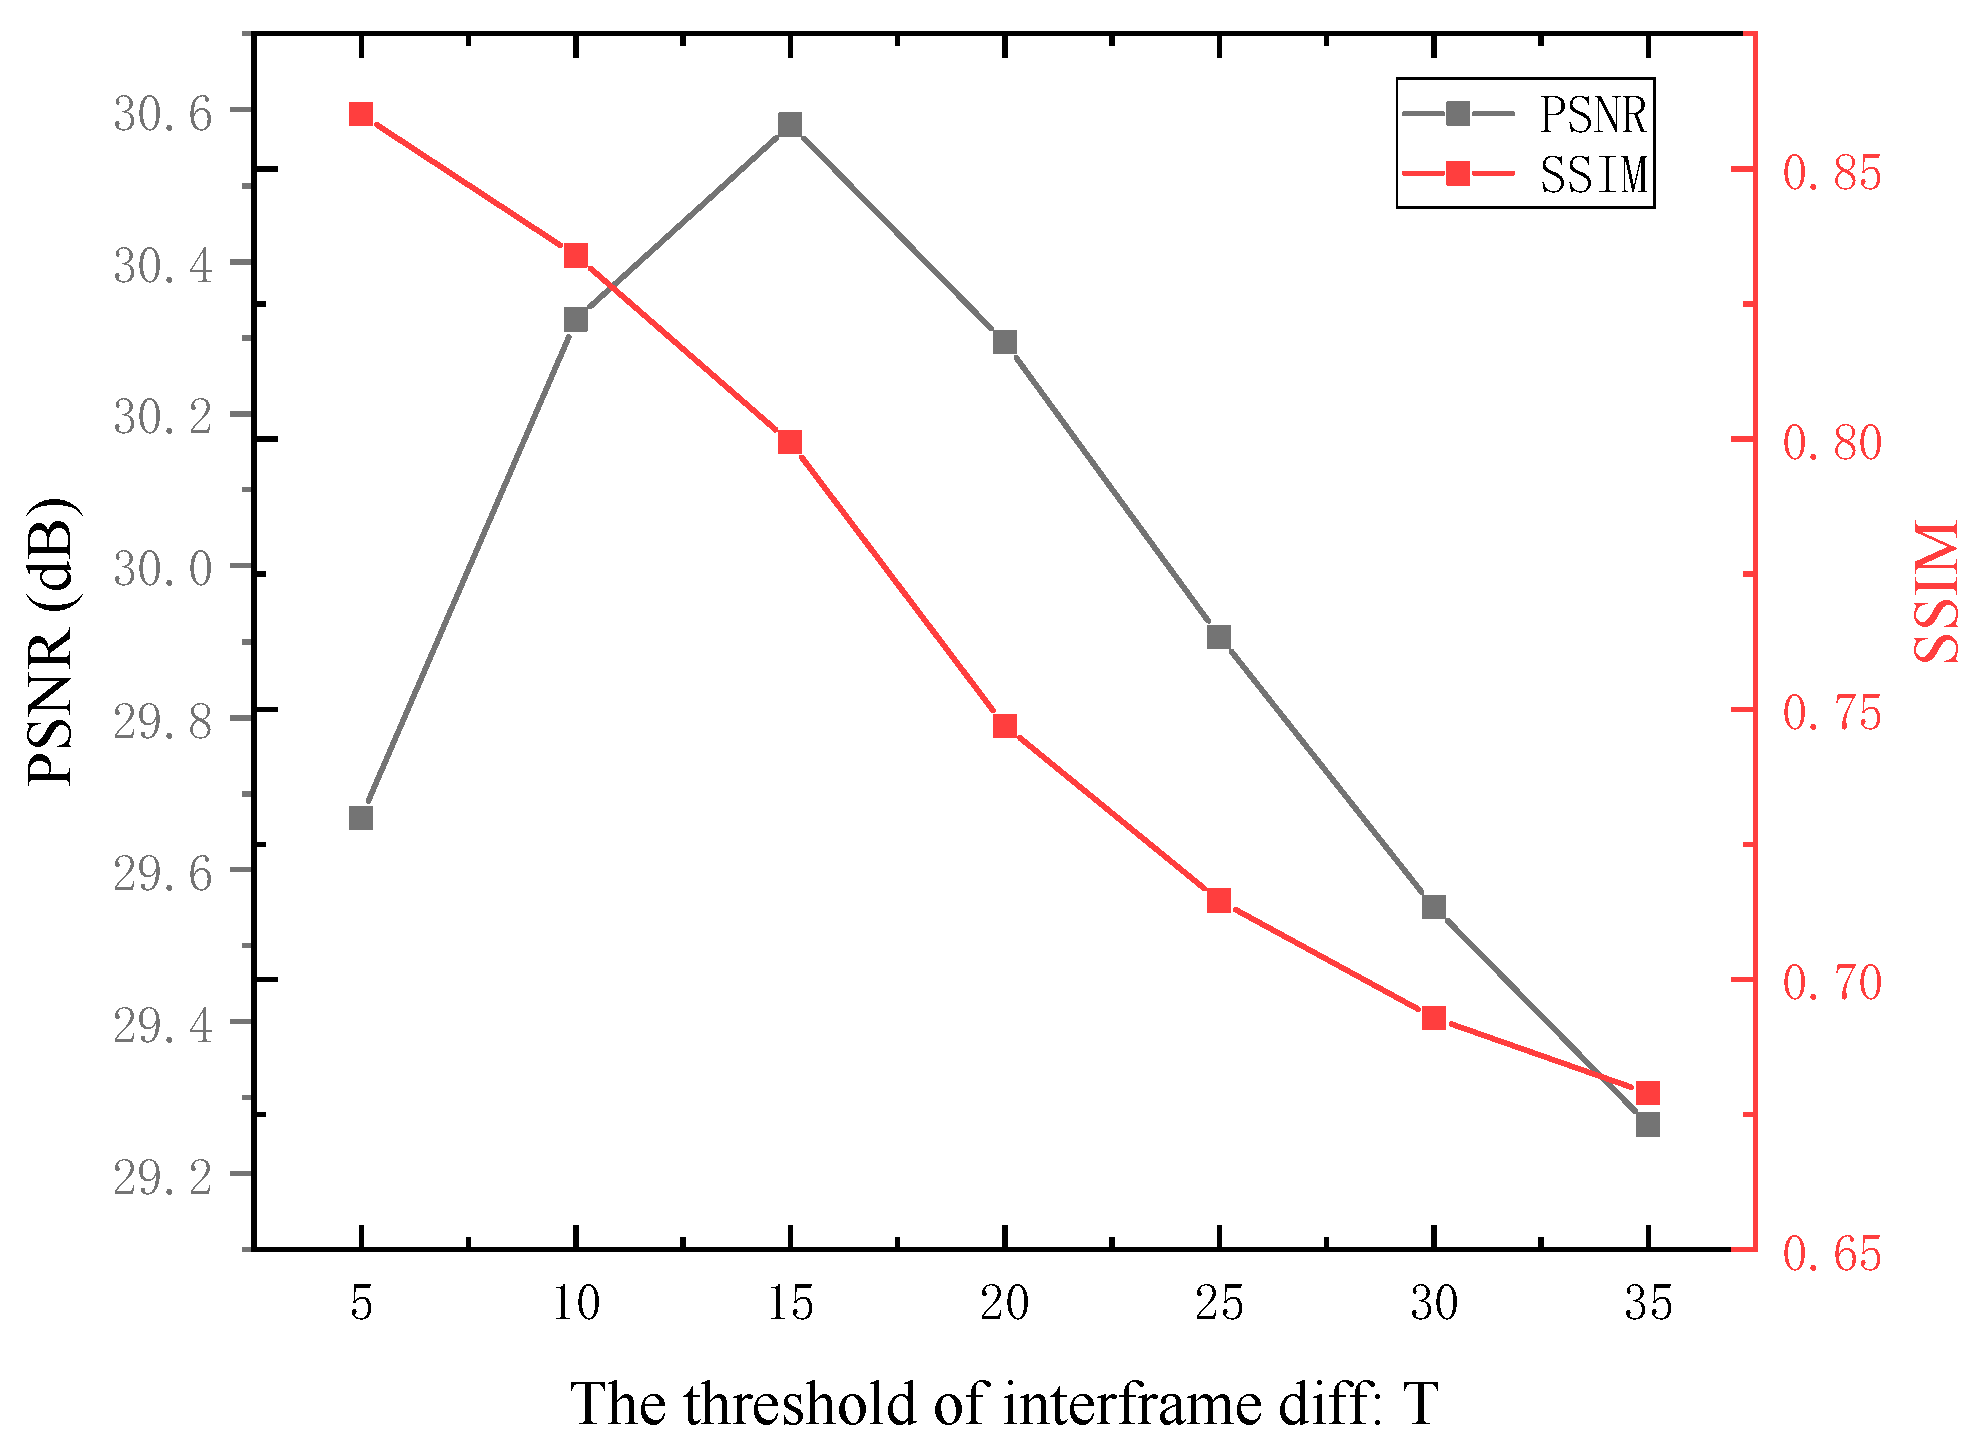
The step of determining the noise position by inter-frame difference is the basis of the proposed method. The selection of inter-frame difference threshold is very important for the accurate location of noise position. If the threshold is too high, the invisible noise will be missed, while selecting too low a threshold will mistake some clean pixels for noise. In general, when the general gray value of noise pixels is higher, the threshold T should be larger, and vice versa, the threshold T should be smaller. Therefore, the selection of the inter-frame difference threshold T is often related to the cumulative dose and dose rate of the radiation environment. Figure 10 shows the quantitative comparison of the denoising effect when the difference threshold T is selected in the step of interframe difference.
It can be seen from Figure 10 that with the increase of threshold T in the interframe difference, the PSNR first increases and then decreases, while the SSIM keeps decreasing. Therefore, when the PSNR is the highest, that is, T = 15, the method achieves the best performance.

5.2.3. Effect of the Frame Number f in Interframe Difference

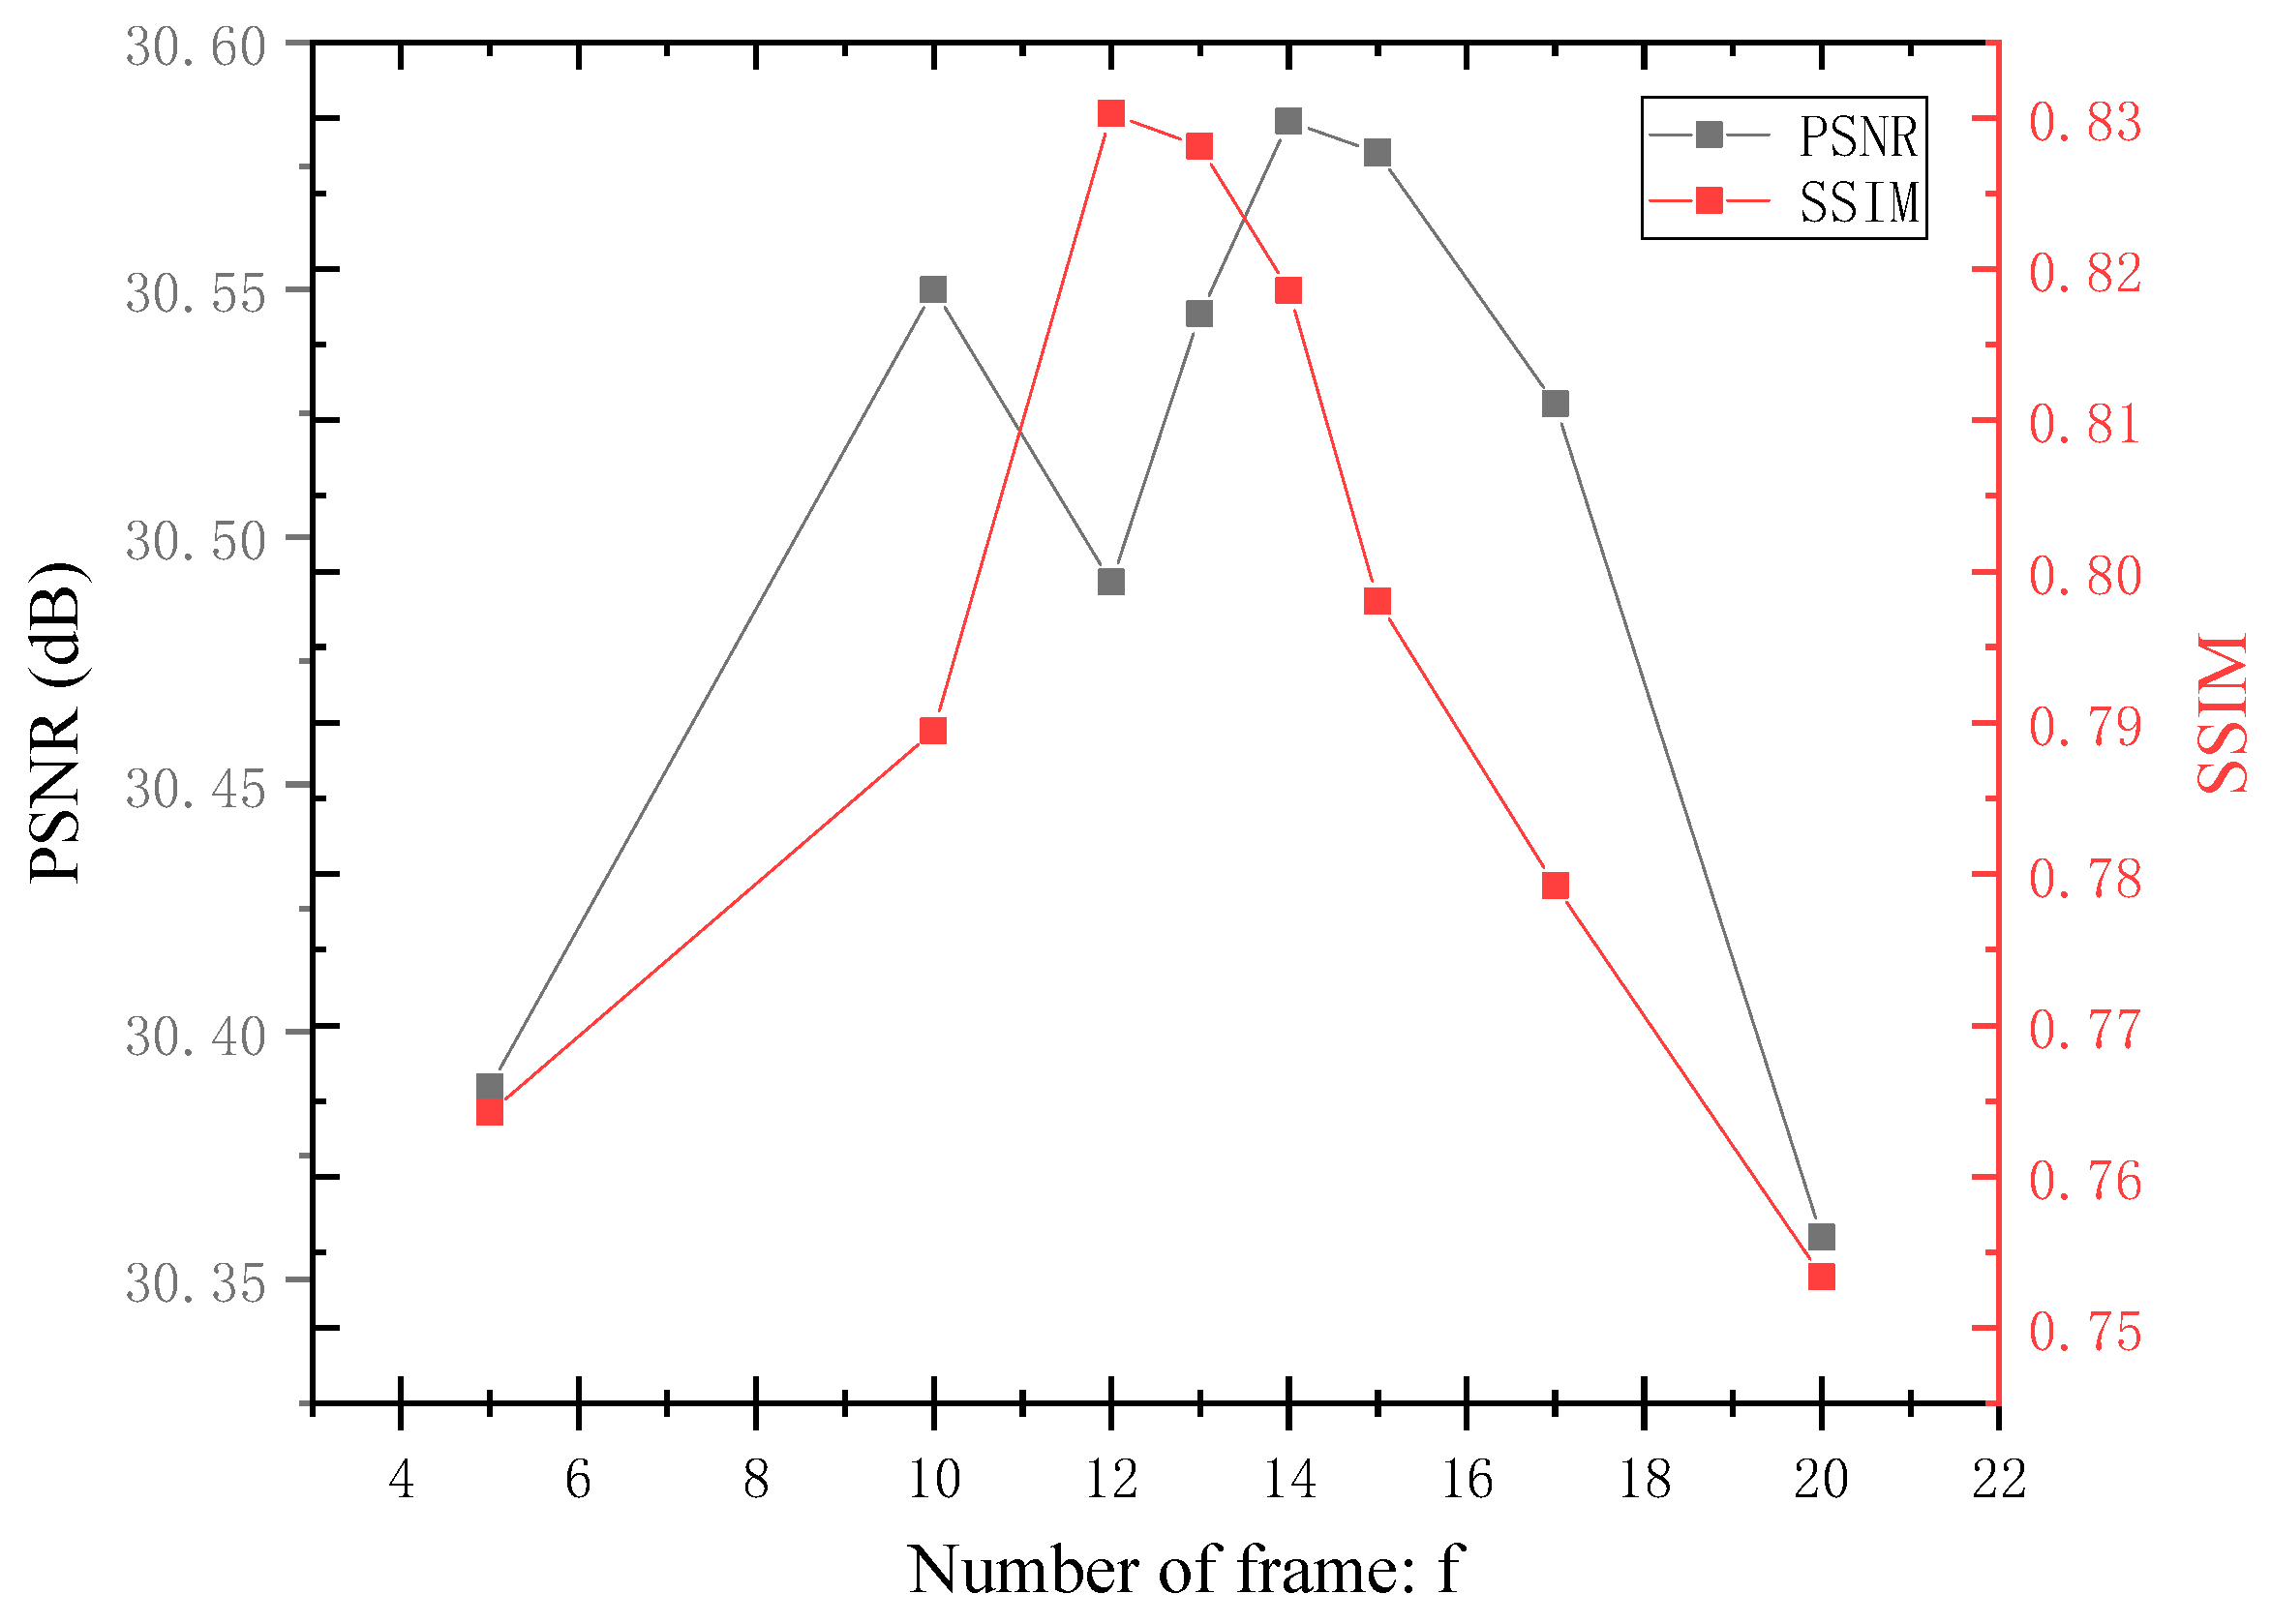
The step of determining the noise position through inter-frame difference is the basis of the method proposed in this paper. Just as with the selection of inter-frame difference threshold, the selection of inter-frame difference frame number f is also very important for accurately locating the noise position. Figure 11 shows the quantitative comparison of denoising effects when a different differential frame number f is selected.
It can be seen from Figure 11 that the PSNR and SSIM fluctuate with the increase of differential frame number f. When f = 14, the method achieves the best noise reduction effect.
In summary, for 28 rad(Si)/s γ-radiation scene noise images, the method proposed in this paper achieves the best noise reduction effect when n = 2, T = 15, f = 14.

5.3. Comparative Analysis

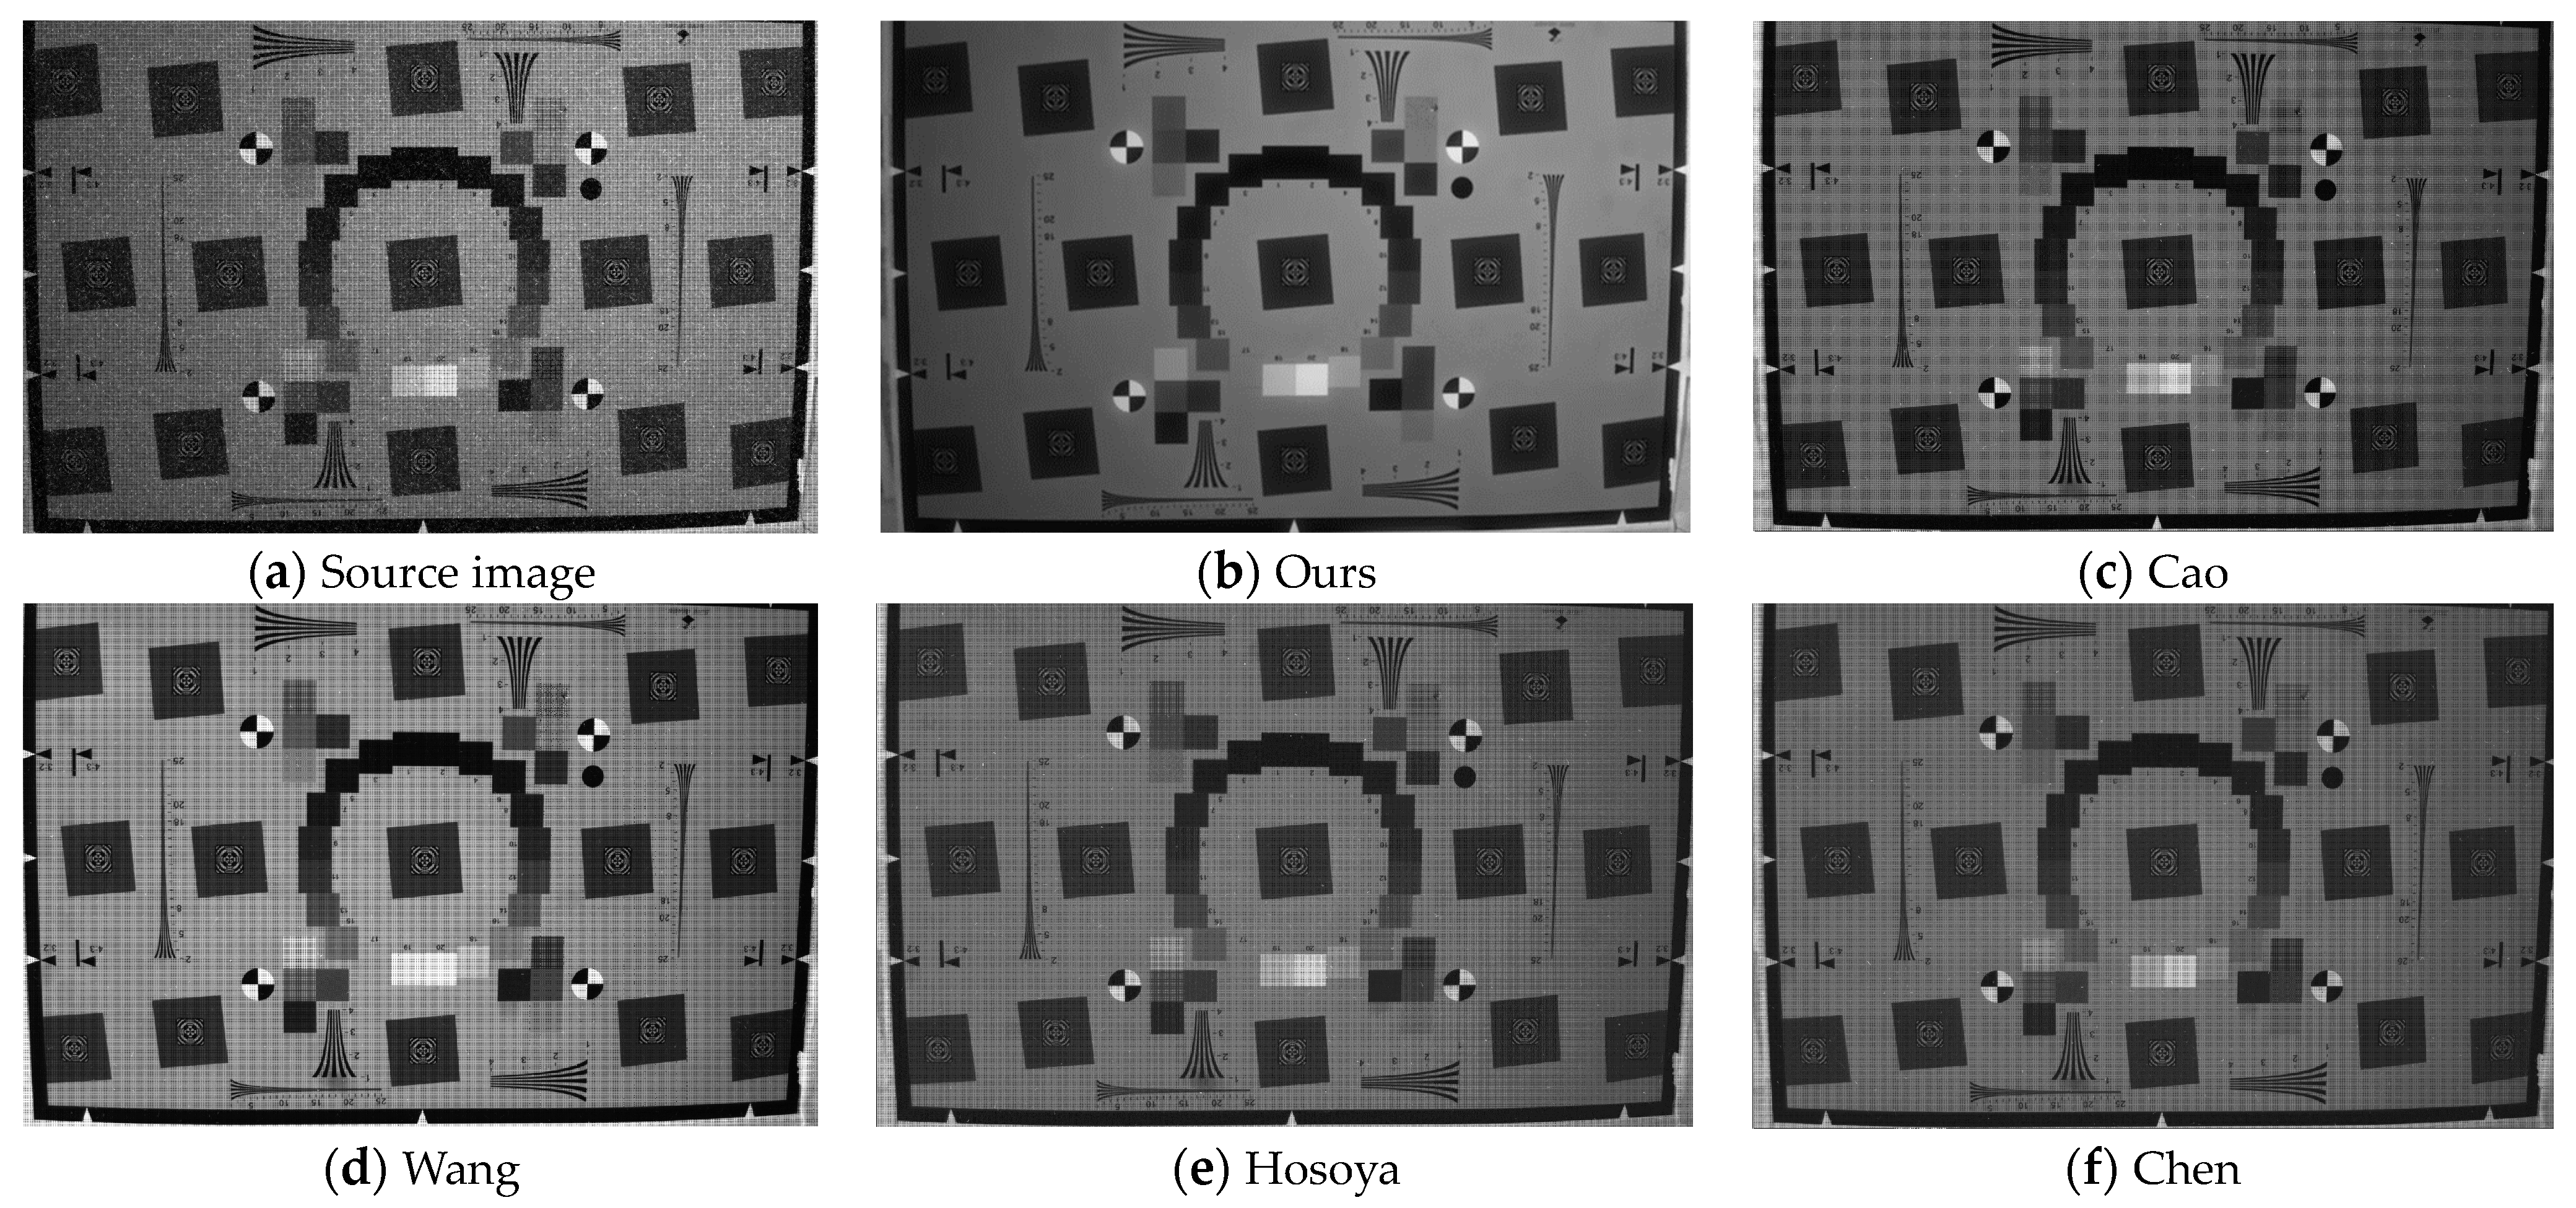
In order to certify the efficacy of the proposed method in this paper, some comparative experiments were carried out in the 28 rad (Si)/s real γ radiation images. The intuitive visual comparison results are shown in Figure 12, the quantitative performance comparisons are shown in Table 1, and the optimal result has been bolded.
It can be seen from Figure 12 and Table 1 that the proposed method performs optimal in both visual effects and quantitative evaluation. This method repaired the noise pixel based on the mechanism and characteristic and then used the Wallis-sharpening filter to enhance the marginal and detailed information; thus, it achieved the best result. Cao [9] used the time-domain median filter to remove the γ ray noise, which is appropriate for pulse noise and is poor at weak noise. Then, it blurred the image, and the weak noise removal was not complete. Wang [10] used adaptive median filtering to preprocess the noise image and then used wavelet transform to denoise. However, due to the complexity of γ radiation noise, its frequency domain distribution was not concentrated; this method may ignore the low-frequency noise. Hosoya [12] combined spatial domain and time domain filtering to remove the noise of nuclear radiation image, but multiple filtering operations tend to cause image blurring. Chen [13] used the nonlinear filtering method based on spatial rows for the forward pulse noise generated by X-ray radiation, but the γ-ray radiation noise is not just distributed in the row direction; thus, noise has gathered in other directions on the processed image.

6. Conclusions

In this paper, according to the mechanism of γ noise generated in the image under the nuclear environment and the characteristics of noise in the time domain and geometry domain, an image restoration method based on spatial axial gradient discrimination is proposed. The effectiveness of this method is proven by experiments in a real γ radiation environment. The image quality of the γ radiation scene was further improved by adjusting the input parameters through ablation experiments, and the denoising effect of PSNR reaching 30.587 dB and SSIM reaching 0.82 was achieved. It solves the problem that the camera’s visual information is not reliable under the influence of γ-rays in the nuclear radiation environment and provides method guidance and technical support for the design of the software module of the anti-radiation camera.

Author Contributions

Conceptualization, K.-F.L. and J.F.; methodology, K.-F.L.; software, K.-F.L. and Y.-J.K.; validation, K.-F.L., Y.-J.K. and Y.-D.L.; formal analysis, J.F.; investigation, Y.-D.L. and L.W.; resources, L.W.; data curation, K.-F.L., J.F. and Y.-J.K.; writing—original draft preparation, K.-F.L.; writing—review and editing, J.F. and Y.-D.L.; visualization, K.-F.L.; supervision, Y.-D.L., J.F. and L.W.; project administration, L.W. and Q.G.; funding acquisition, J.F., Y.-D.L. and Q.G. All authors have read and agreed to the published version of the manuscript.

Funding

This research was funded by the West Light Talent Training Plan of the Chinese Academy of Sciences No. 2022-XBQNXZ-010, the Youth Science and Technology Talents Project of Xinjiang Uygur Autonomous Region No. 2022TSYCCX0094, and the Tianshan Innovation Team Program of Xinjiang Uygur Autonomous Region No. 2022D14003.

Institutional Review Board Statement

Not applicable.

Informed Consent Statement

Not applicable.

Data Availability Statement

Not applicable.

Conflicts of Interest

The authors declare no conflict of interest.

References

  1. Marques, L.; Vale, A.; Vaz, P. State-of-the-Art Mobile Radiation Detection Systems for Different Scenarios. Sensors 2021, 21, 1051. [Google Scholar] [CrossRef] [PubMed]
  2. Tsitsimpelis, I.; Taylor, C.J.; Lennox, B.; Joyce, M.J. A review of ground-based robotic systems for the characterization of nuclear environments.Prog. Nucl. Energy 2019, 111, 109–124. [Google Scholar] [CrossRef]
  3. Lu, X. Research on Color Image Reconstruction Method of Contact Image Sensor. Ph.D. Thesis, Wuhan University, Wuhan, China, 2017. [Google Scholar]
  4. Liu, C.; Yan, Z.; Deng, J. Research status and key technology analysis of emergency robot in nuclear power plant. Nucl. Sci. Eng. 2013, 33, 97–105. [Google Scholar] [CrossRef]
  5. Wang, H.; Feng, J. Influence of noise of CMOS image sensor on camera resolution in strong radiation environment. Energy Sci. Technol. 2022, 56, 775–782. [Google Scholar]
  6. Feng, J.; Wang, H.-C.; Li, Y.-D.; Wen, L.; Guo, Q. Mechanism of Total Ionizing Dose Effects of CMOS Image Sensors on Camera Resolution. Electronics 2023, 12, 2667. [Google Scholar] [CrossRef]
  7. Zhang, H.; Lin, S. Research Progress with Membrane Shielding Materials for Electromagnetic/Radiation Contamination. Membranes 2023, 13, 315. [Google Scholar] [CrossRef] [PubMed]
  8. Cao, X.; Li, Y.; Zhan, Y.; Chen, X.; Kang, F.; Wang, J.; Liang, J. Removing Noises Induced by Gamma Radiation in Cerenkov Luminescence Imaging Using a Temporal Median Filter. BioMed Res. Int. 2016, 2016, 1–9. [Google Scholar] [CrossRef] [PubMed]
  9. Wang, H.; Sang, R.; Zhang, H.; Xie, X. A new method for image noise reduction under intense radiation environment monitoring. Transducer Microsyst. Technol. 2011, 30, 59–61. [Google Scholar]
  10. Zhang, Z.; Cheng, Y.; Zhao, J. Video in radiation environments denoise using Wavelet and Kalman filter. In Proceedings of the 2019 16th International Computer Conference on Wavelet Active Media Technology and Information Processing, Chengdu, China, 14–15 December 2019; IEEE: Piscataway, NJ, USA, 2019; pp. 290–294. [Google Scholar]
  11. Hosoya, N.; Miyamoto, A.; Naganuma, J. Real-Time Color Image Improvement System for Visual Testing of Nuclear Reactors. IEICE Trans. Inf. Syst. 2018, 101, 1243–1250. [Google Scholar] [CrossRef]
  12. Chen, S.; Qiu, Y.; Feng, J. A Nonlinear Filter Based on Row and Column Operation for Positive Impulsive Noise Reduction. In Proceedings of the 2009 Asia-Pacific Conference on Information Processing, Shenzhen, China, 18–19 July 2009; IEEE: Piscataway, NJ, USA, 2009; Volume 2, pp. 44–46. [Google Scholar]
  13. Ren, Z. Research on Radiation-Degraded Image Information Recognition Technology Based on Deep Learning. Master’s Thesis, Harbin University of Science and Technology, Harbin, China, 2022. [Google Scholar]
  14. Sun, Y.; Liu, H.; Cong, P.; Li, L.; Xiang, X.; Guo, X. Research on noise reduction method of radiation image based on convolutional neural network. Energy Sci. Technol. 2017, 51, 1678–1682. [Google Scholar]
  15. Lehtinen, J.; Munkberg, J.; Hasselgren, J.; Laine, S.; Karras, T.; Aittala, M.; Aila, T. Noise2Noise: Learning Image Restoration without Clean Data. arXiv 2018. [Google Scholar] [CrossRef]
  16. Tian, C.; Fei, L.; Zheng, W.; Xu, Y.; Zuo, W.; Lin, C.W. Deep learning on image denoising: An overview. Neural Netw. 2020, 131, 251–275. [Google Scholar] [CrossRef] [PubMed]
  17. Goiffon, V.; Estribeau, M.; Magnan, P. Overview of Ionizing Radiation Effects in Image Sensors Fabricated in a Deep-Submicrometer CMOS Imaging Technology. IEEE Trans. Electron Devices 2009, 56, 2594–2601. [Google Scholar] [CrossRef]
  18. Niccolai, S.; Chatagnon, P.; Hoballah, M.; Marchand, D.; Camacho, C.M.; Voutier, E. Deeply virtual Compton scattering on the neutron with positron beam. Eur. Phys. J. A 2021, 57, 1–6. [Google Scholar] [CrossRef]
  19. Ali, M.M.M.; Zhao, H.; Rawashdeh, A.; Mohammed, Y.A. Assessment of Radiation Hazard Indices for Sand Samples from Ma’rib in Yemen. Int. J. Radiat. Res. 2021, 19, 615–623. [Google Scholar] [CrossRef]
  20. Xue, Y.; Wang, Z.; Liu, M.; Xu, R.; Ning, H.; Zhao, W.; He, B.; Yao, Z.; Sheng, J.; Ma, W. Analyzing the Transient Effects of 60Co Υ-Rays in a CIS by Monte Carlo Method. Nucl. Sci. Tech. 2019, 30, 116. [Google Scholar] [CrossRef]
  21. Belloir, J.-M.; Virmontois, C.; Estribeau, M.; Goiffon, V.; Magnan, P.; Materne, A.; Bardoux, A. Radiation Effects in Pinned Photodiode CMOS Image Sensors: Variation of Photodiode Implant Dose. IEEE Trans. Nucl. Sci. 2019, 66, 1671–1681. [Google Scholar] [CrossRef]
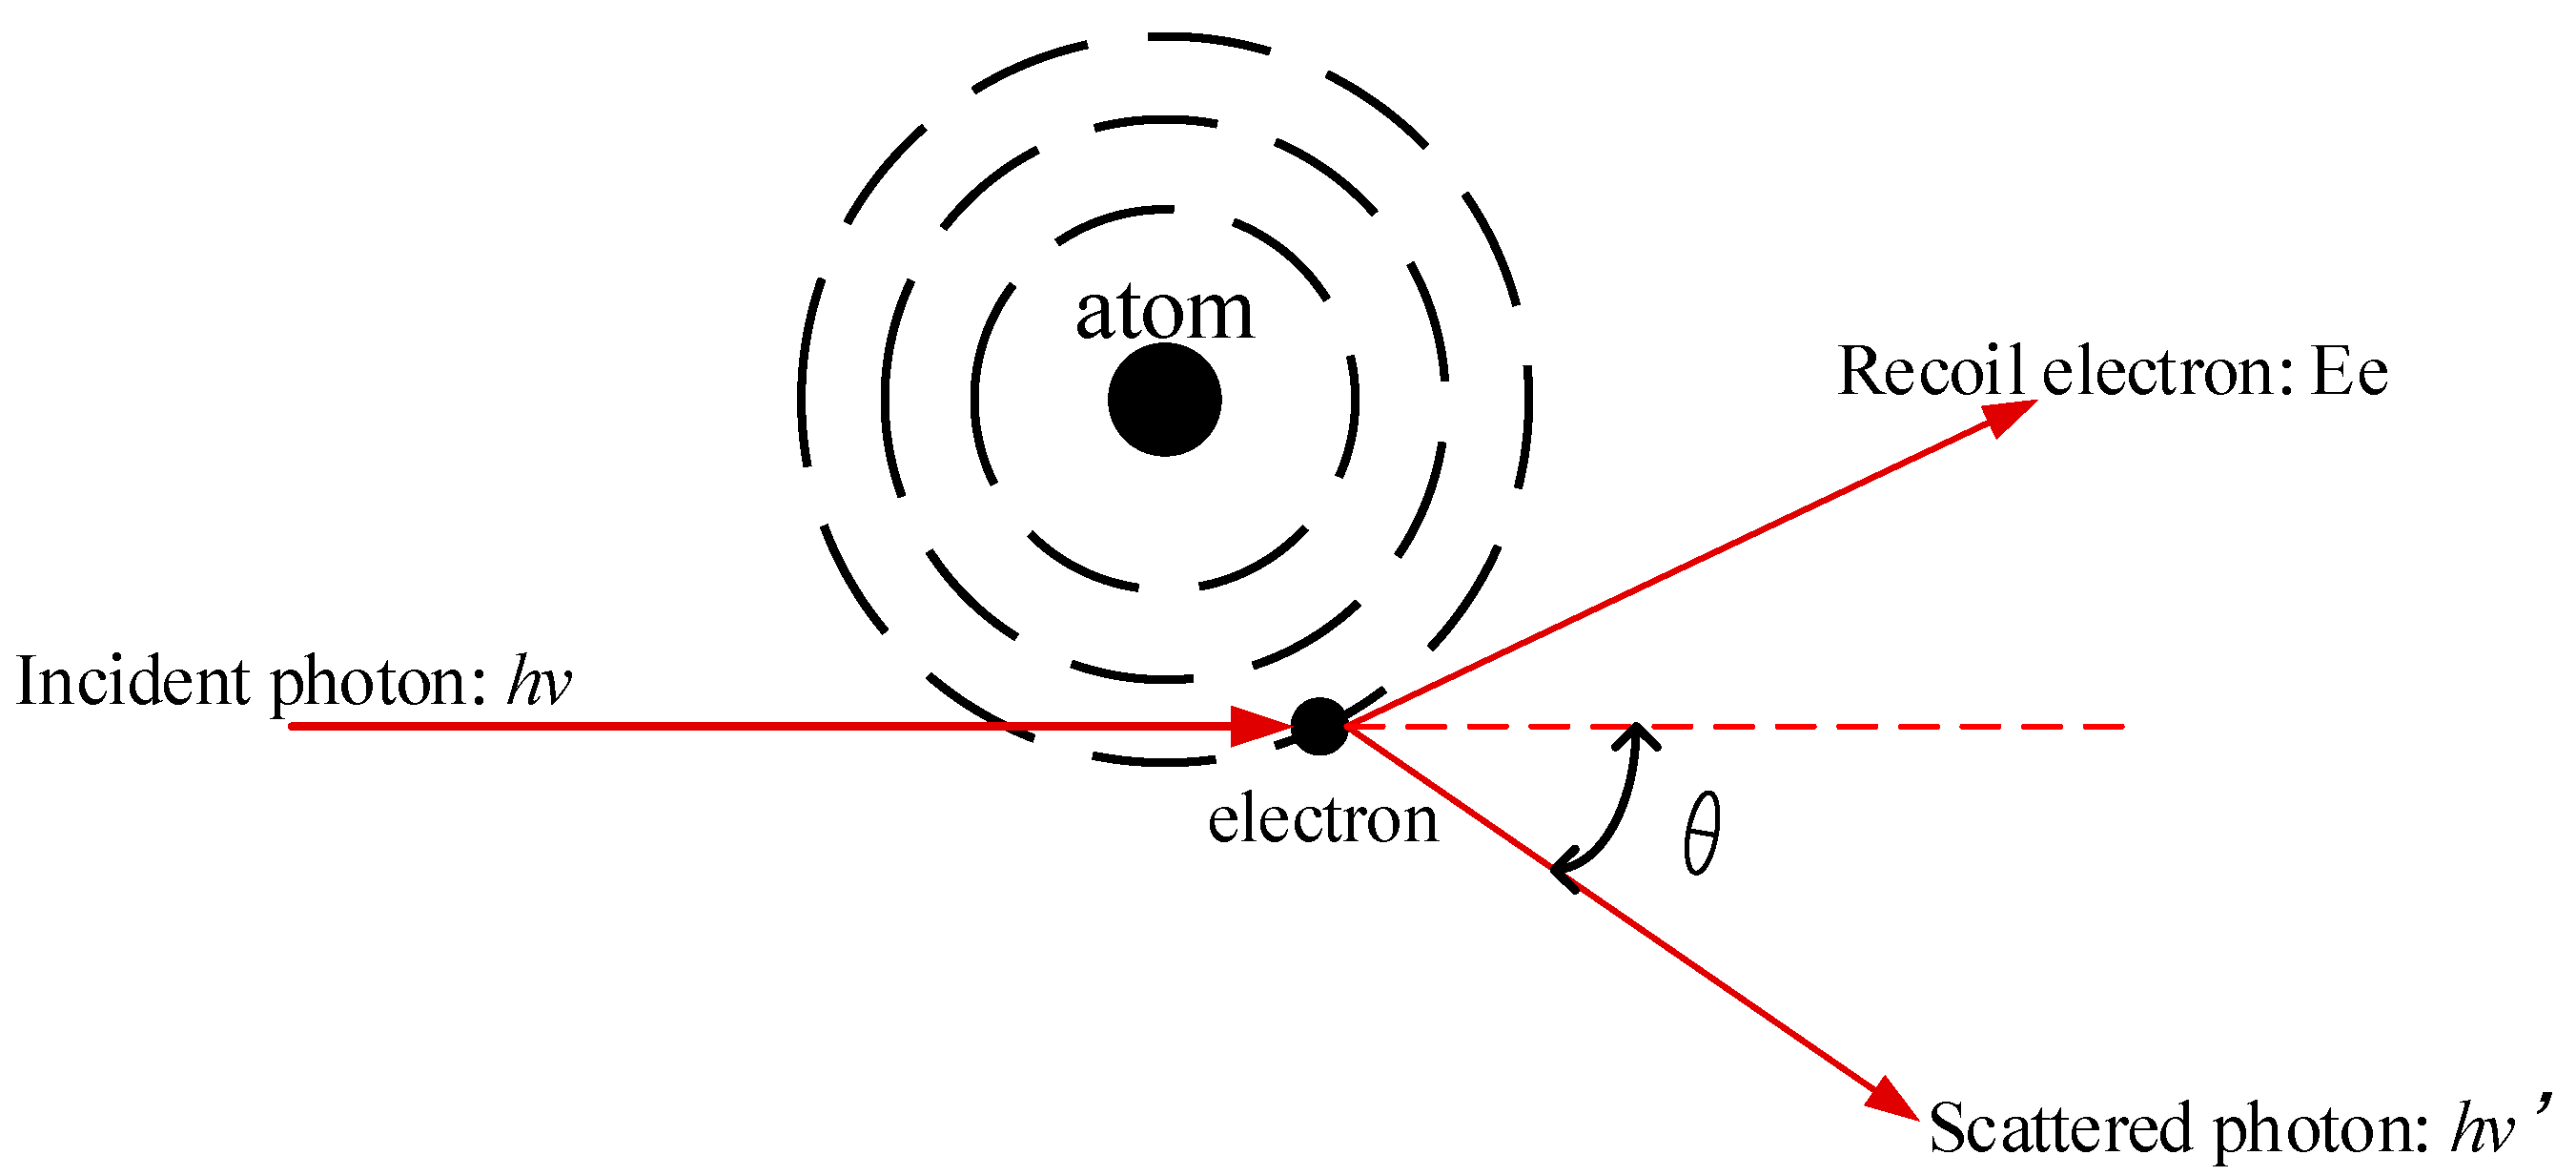
Figure 1. Description of Compton-scattering effect.
Electronics 12 03734 g001
Figure 2. Mechanism of γ radiation noise generation in CIS.
Electronics 12 03734 g002
Figure 3. Schematic diagram of proposed method.
Electronics 12 03734 g003
Figure 4. Interframe differential to determine the position of noise pixel.
Electronics 12 03734 g004
Figure 5. The γ radiation noise in image (a) γ radiation dark field scene image; (b)process of energy deposition when γ-rays pass through h CIS.
Electronics 12 03734 g005
Figure 6. Location and different spatial axis of noise pixels.
Electronics 12 03734 g006
Figure 7. Schematic diagram of irradiation experiment apparatus.
Electronics 12 03734 g007
Figure 8. Visual contrast result: (a) Real γ-radiation scene image; (b)The image after restoring.
Electronics 12 03734 g008
Figure 9. Quantitative comparison of the restoring effect by the number of adjacent pixels.
Electronics 12 03734 g009
Figure 10. Quantitative comparison of the restoring effect by the threshold T of interframe difference.
Electronics 12 03734 g010
Figure 11. Quantitative comparison of the restoring effect by frame number f of interframe difference.
Electronics 12 03734 g011
Figure 12. Comparison of γ-radiation scene image restorting results.
Electronics 12 03734 g012
Table 1. Quantitative performance comparisons.
Index Source
Image
OursCaoWangHosoyaChen
PSNR (dB)20.130.5924.727.825.626.4
SSIM0.470.820.590.730.650.70
Disclaimer/Publisher’s Note: The statements, opinions and data contained in all publications are solely those of the individual author(s) and contributor(s) and not of MDPI and/or the editor(s). MDPI and/or the editor(s) disclaim responsibility for any injury to people or property resulting from any ideas, methods, instructions or products referred to in the content.