Article

Real Time Assessment of Smart Concrete Inspection with Piezoelectric Sensors

1
Singapore Center for 3D Printing, School of Mechanical & Aerospace Engineering, Nanyang Technological University, Singapore 639798, Singapore
2
Rolls-Royce@NTU Corporate Lab., Nanyang Technological University, Singapore 639798, Singapore
*
Author to whom correspondence should be addressed.
Electronics 2023, 12(18), 3762; https://doi.org/10.3390/electronics12183762
Submission received: 27 July 2023 / Revised: 21 August 2023 / Accepted: 25 August 2023 / Published: 6 September 2023
(This article belongs to the Special Issue Smart Sensing, Monitoring, and Control in Industry 4.0)

Abstract

:
Utilization of an Electromechanical impedance (EMI) technique with Piezoelectric (PZT) sensors has showed potential for Structural Health Monitoring (SHM). The changes in mechanical structure via flexural bending and cracking can be detected by monitoring the deviations in electrical impedance signals recorded with embedded PZT sensors. This paper has conducted a comprehensive study on the potential of an EMI technique with embedded PZT sensors with 3D Concrete Printing (3DCP) structures subjected to flexural bending test until plastic failure. The impact of different Piezoelectric housing methods and materials has been studied comprehensively through the monitoring of EMI signals. Experimental results indicate that material housing types and thickness affect the sensitivity of EMI readings but also performed as a reinforcement when a load is directly applied. The embedded PZT sensors with the EMI technique have shown strong potential to address the cost and lifecycle challenges posed by traditional construction methods as the insertion of PZT sensors seamlessly functions with 3DCP workflows. Further developmental work can be carried out to address the sensitivity of the sensor, performance as a reinforcement, and installation automation. The results proved that the coated sensors could detect fractures in 3DCP concrete with decreased sensitivity on thicker coating layers through the variance in materials and coating thickness in the paper.

1. Introduction

Structural Health Monitoring (SHM) enforces the safety and integrity of concrete structures. SHM provides a valuable process flow for tracking damage development, predicting performance degradation, and carries out continuous in-situ structural safety assessments [1]. Various non-destructive testing (NDT) techniques have been employed in the SHM of concrete structures such as Acoustic Emission [2], Fibre Optic Sensors [3], X-rays [4], Infrared Thermography [5], Ground Penetrating Radar [6], Pulse Velocity [7], and Piezoelectric sensors [8]. The NDT methods usually interpret the response signals after the emission waves propagate through the host structure to detect cracks, voids, delamination, moisture levels, etc. Depending on each technique, the signals used could be varied, including acoustic sound, electromagnetic waves, or ultrasonic pulses. Real-time structural health inspection is also a useful approach for identifying weaknesses in the structure and expediting repair procedures [8,9,10,11]. SHM with NDT methods facilitate rapid and effective concrete structure inspection by offering a quick and effective method to collect data on the structural condition. However, each method has its own limitations in terms of installation and application range [12]. Despite the potential benefits of embedding sensors into concrete structures for long-term evaluation, the successful application of smart concrete technologies remains a challenge due to high fabrication costs and poor material lifecycles. Further research is needed to overcome these obstacles and fully realise the potential of SHM in ensuring the safety and longevity of concrete structures [13,14].
The development of contour crafting in construction, commonly known as 3-Dimensional Concrete Printing (3DCP), has been introduced as an alternative construction method that can potentially reduce manpower and overall construction costs by up to 80% [15]. Three-Dimensional Concrete Printing aims to improve the overall process by optimising the concrete mixture to improve the rheological properties needed to build tall and complex structures [16,17,18,19,20]. However, printing defects are currently present due to the complexity involving environmental, material, and process parameters [21]. For example, poor cohesiveness between adjoining layers, known as a weak interlayer bond, contributes to the anisotropic property in 3DCP, and has been extensively studied and linked to the open time, plastic shrinkage, dynamic yield strength, and surface moisture. The Interlayer Bond Strength is a time-dependent factor that can be adjusted by the change in deposition rates, that is, the Nozzle Travel Speed and Material Flow Rate [22]. These effects are also heavily dependent on the rheological properties of the composite material [18,23,24,25,26], where it should be viscous for a sufficient time but should strengthen quickly to improve the load bearing capacity sufficiently for the weight of the subsequent layers. These effects, while not consequentially exclusive, pose a printable upper limit that is attributed to the filament width to structure height ratio. A thin wall (filament width << structural height) would result in poor structural stability and result in plastic collapse or elastic buckling [27,28]. Buildability is defined by the ability for the concrete to withstand compressive stresses exerted from the time it takes to harden. It is dependent on the material yield stress, structural buildup, and the cross-sectional area of the layer. It is also an assessment criterion that has been independently evaluated via rheological tests, hence real-world structural conditions were ignored. While there have been innovative solutions in the field in recent years with the use of automation technologies [21,29,30,31,32,33], real-time data such as internal stresses for structural analysis are not widely explored.
The need for cost reduction and real-time data collection mentioned above presents an opportunity for 3DCP to develop embedded autonomous technologies that go beyond the capabilities of its construction predecessors [34,35,36]. The layer-by-layer deposition method should position itself as a gateway to embed sensors within the structure easily, without the high manufacturing costs associated with the traditional mode of construction. Three-Dimensional Concrete Printing could also benefit from the addition of sensors, as robustness and repeatability remain an ongoing challenge in the field [37]. Among the non-destructive evaluation methods, Piezoelectric material lead zirconate titanate (PZT) has been considered for SHM in concrete structures for the feasibility assessment of embedded sensors [38,39,40]. As PZT patches are customizable to a unique size, we postulate that it is a good gateway to proving the concept of embedded sensors in 3DCP applications. PZT patches can be used with an Electromechanical impedance (EMI) technique using the electromechanical coupling between the bonded/embedded sensors and concrete structure [41,42]. The change in the mechanical impedance of the host structure can be detected via the electrical impedance of the Piezoelectric element. By analysing the response of the electrical impedance signal at a specified frequency range, various structural damages can be detected and monitored, such as crack propagation, development of voids, or delamination between layers caused by a poor interlayer bond [23,25,43,44]. The root mean square deviation (RMSD) has been used extensively as an analytical tool for the EMI technique, where it compiles the frequency responses captured by the sensors’ electrical impedance to relate to the mechanical changes in the concrete structure.
The application of a PZT sensor in 3DCP can be implanted into the concrete structure during the printing process as compared to the casted concrete [45]. Embedding sensors, however, poses additional considerations to the existing challenges. For example, sensor insertion may cause larger interlayer voids [25], and studies suggest that sensor performance can be affected by the host environment [46], hence PZT coating performance should also be evaluated. Nonetheless, inserting a smart sensor presents an opportunity to incorporate non-destructive, real-time, ad-hoc, and continuous monitoring strategies for SHM. The sensor embedment allows the recording and comparison of the electrical impedance between the initial and current mechanical states of the concrete structure. Therefore, any irreversible mechanical stresses within the host structure will cause a mechanical impedance to change, which results in a different response of the electrical impedance of the sensor [41,47].
Negi et al. [45] studied the effectiveness of the EMI signal from different orientations of the PZT in the reinforced concrete beam, which are 0 (horizontal), 45 (inclined), and 90 (vertical) degrees with the axis of the study prototype (see Figure 1). The results revealed that meaningful EMI signals can be captured from the PZT element positioned perpendicular to the ground due to the loading effects of the structure on the actuator. This positioning is ideal for 3DCP as the one-dimensional disk-shaped form factor can be easily inserted into the 3DCP layered deposition method to minimize filament displacement at the interfacial layers.
In this study, a PZT sensor will be implanted horizontally within the layer of 3DCP structure to study the EMI technique in quantifying the mechanical behaviour of concrete subjected to varying test conditions. Different coating types and layers of protection for PZT sensor are studied to suggest a suitable coating solution for embedded sensors in 3DCP structures. Four-point bending tests are conducted as a baseline to evaluate the effectiveness of these coating layers with an EMI technique. Through these studies, this research also demonstrates the feasibility of embedding Piezoelectric sensors for detecting the early-age strength of 3DCP structures by correlating the electrical impedance recorded from PZT with the mechanical changes in 3D printed concrete structures during compression tests, and to quantify the presence of large cracks displaced vertically across the concrete slab until it yields.

2. Methodology

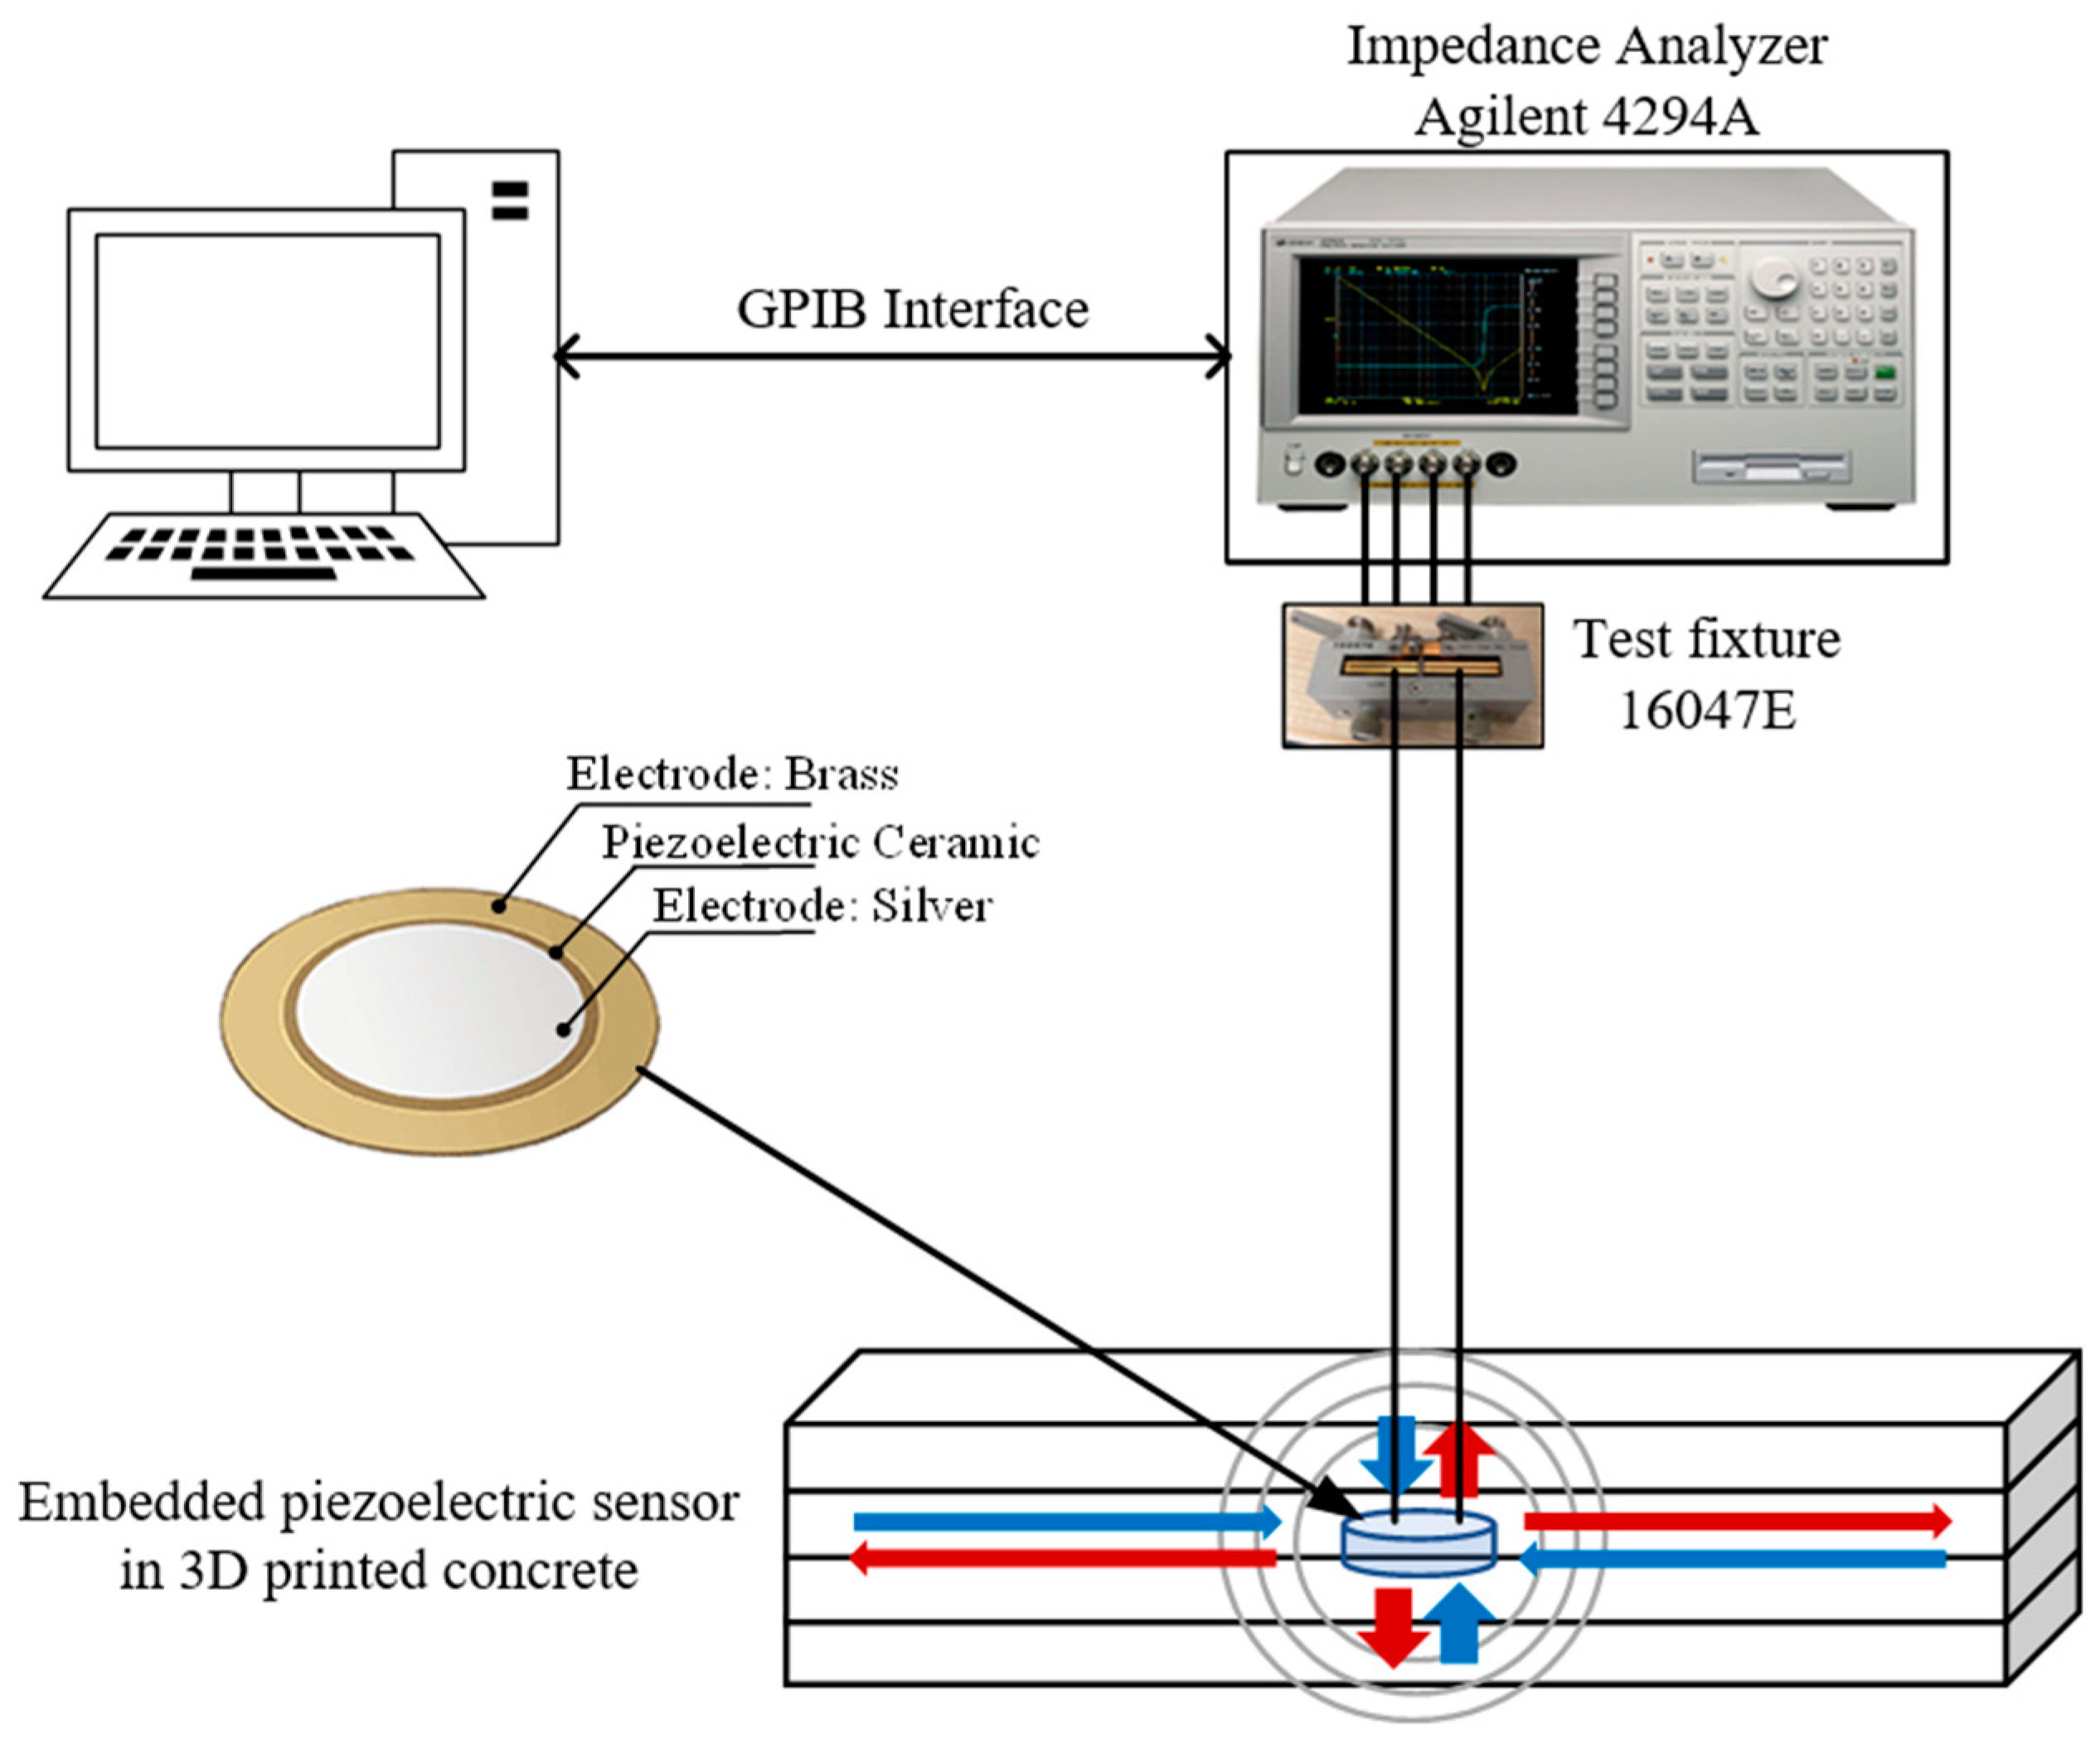
2.1. Electromechanical Impedance Method

The Electromechanical impedance (EMI) technique actuates harmonically with the presence of an electrical field. The electrical response, caused by a harmonic force reaction from the host structure, is typically measured and visualised as an electrical impedance against frequency plot. The Piezoelectric ceramic transducer is embedded into the host structure during the in-process stages of concrete 3D printing (as illustrated in Figure 1). The electrical impedance signal from PZT is recorded by the Impedance magnitude and Phase angle components (Z, θ) over a frequency range f. The change in electrical impedance reflects the change in mechanical impedance of the host structure, where it provides a quantitative response to the charge of internal stresses.
The test setup is shown in Figure 2. The Piezoelectric diaphragm model 7BB-20-6 from Murata [48] was selected as the embedded sensor with the Piezoelectric diameter of 12.8 mm, an overall diameter including the electrodes of 20 mm, and a total thickness of 0.42 mm. The Piezoelectric diaphragm and wiring components were encapsuled in a protective housing structure to protect them from the alkaline corrosion of a Portland cement hydration by-product, Calcium Hydroxide or Ca(OH)2. The Precision Impedance Analyser Agilent 4294A with 4 terminal test fixture 16047E was used to measure the electrical impedance under different test conditions with the frequency sweep from 1 kHz to 1 MHz to find the effective frequency range for the investigation. A VBA Macro program on the computer was used to log the measurement values via the GPIB interface feature for later signal analysis.
The RMSD method was employed as a quantitative measurement to determine any changes in electrical impedance between the initial state ( G i 0 ) and current states ( G i 1 ) of the concrete specimen (see Equation (1)).
R M S D   ( % ) = i = 1 N ( G i 1 G i 0 ) 2 i = 1 N ( G i 0 ) 2   × 100

2.2. Three-Dimensional Printing Setup

A gantry printer was attached with a square nozzle orifice with a 20 mm × 20 mm dimension. All printing jobs were set with a fixed layer height of 15 mm per layer to optimize the interlayer bond from the induced extrusion pressure. The graphical representation is shown in Figure 3. The square nozzle was chosen for its versatility in structural design for the following experiments, whose design variations will be further elaborated in later parts of this paper. PZT sensors will be inserted between the middle section of two interface layers and were placed approximately at the centre of the structure.
The mix design aimed to meet the requirement of pumpability during delivery through the hose and shape retention after extrusion. The material needed to be delivered by means of pumping through a hose with a diameter of 2.54 mm and the maximum allowable particle size by the pump is 2 mm. Ordinary Portland cement (OPC, ASTM Type 1, Grade 42.5), Silica Fume (Unidentified, Elkem), Fly Ash (Class F), river sand, and water were used in this work. No additives were incorporated in this printing job as the main objective was to improve the inter-bonding layer and the addition of additives may increase the complexity of this study. A Hobart mixer was used to prepare the material. Dry components were dry-mixed at 59 rpm for 5 min. Water was then added to the mixture for mixing at a slow speed (59 rpm) for 1-min and followed by 7-min of high-speed mixing (198 rpm).
After printing, to prevent evaporation of the water from the fresh concrete, the samples were covered with a plastic wrap. Samples were then cured in the laboratory environment for 28 days under a temperature of 23 ± 2 °C and relative humidity of 60%. This concrete mixture was consistent throughout the experiments in this paper. The mass ratios of the raw materials were cement (0.7), Fly Ash (0.2), Silica Fume (0.1), sand (0.6), and water (0.36).

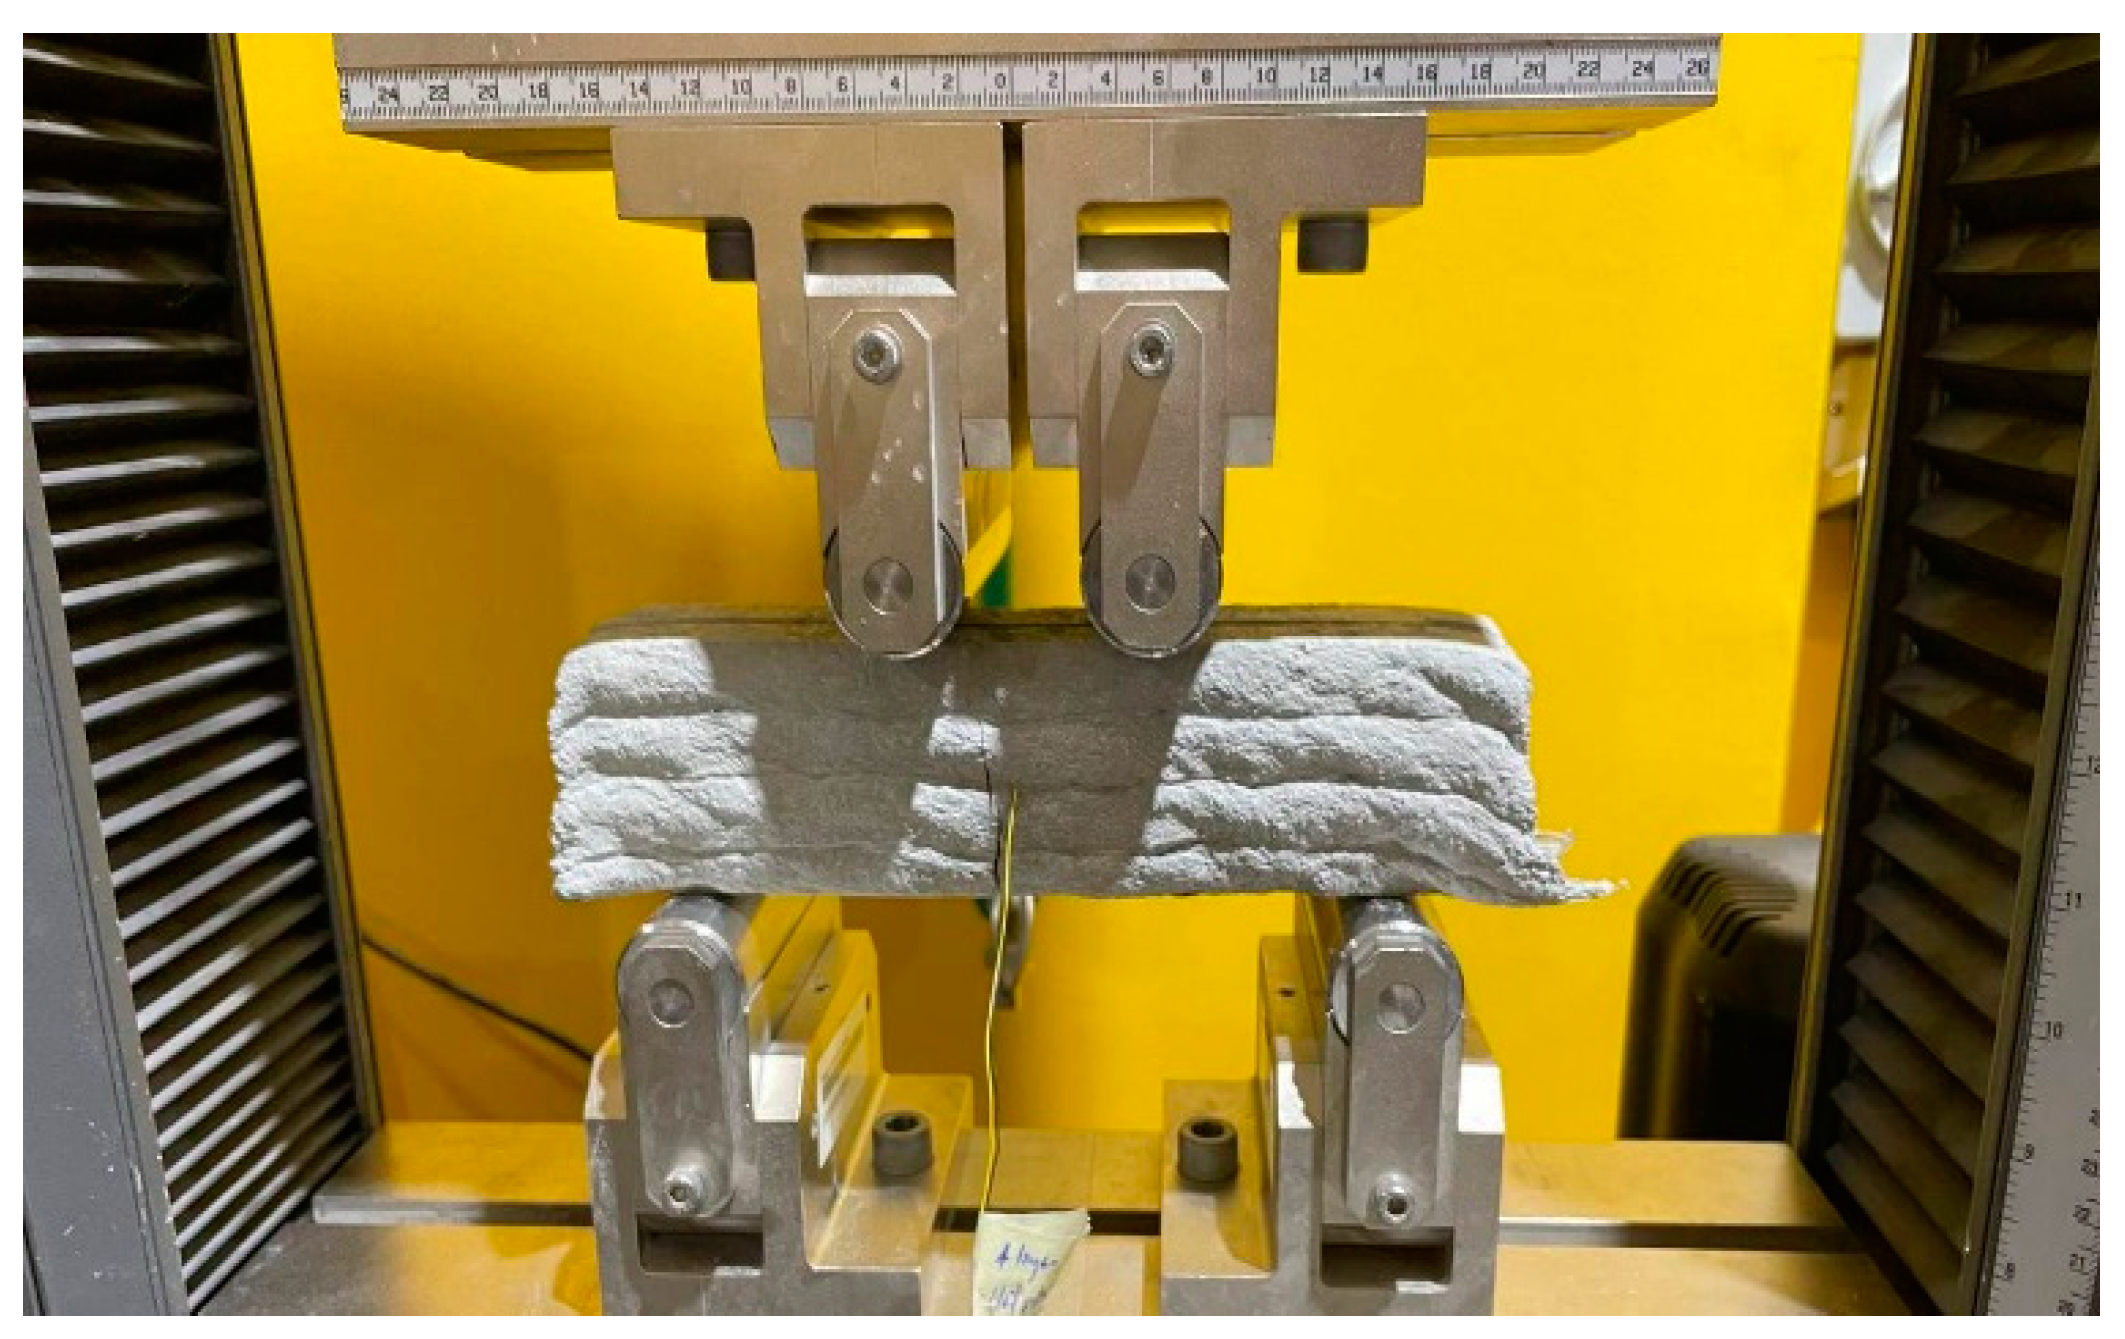
2.3. Mechanical Testing

An Instron 5969 Dual Column Testing System was used to conduct compressive and bending tests after a pre-defined number of days designed for the respective experiment. The machine is equipped with 50 kN static load cell, and it is attached with a 5 kN max static 4-point flexure fixture (see Figure 4). All samples that utilized the machine underwent the four-point bending test that adhered to ASTM C78/C78M standards [49]. The load was applied at a constant rate between 0.9 and 1.2 MPa/min until rupture occurred.

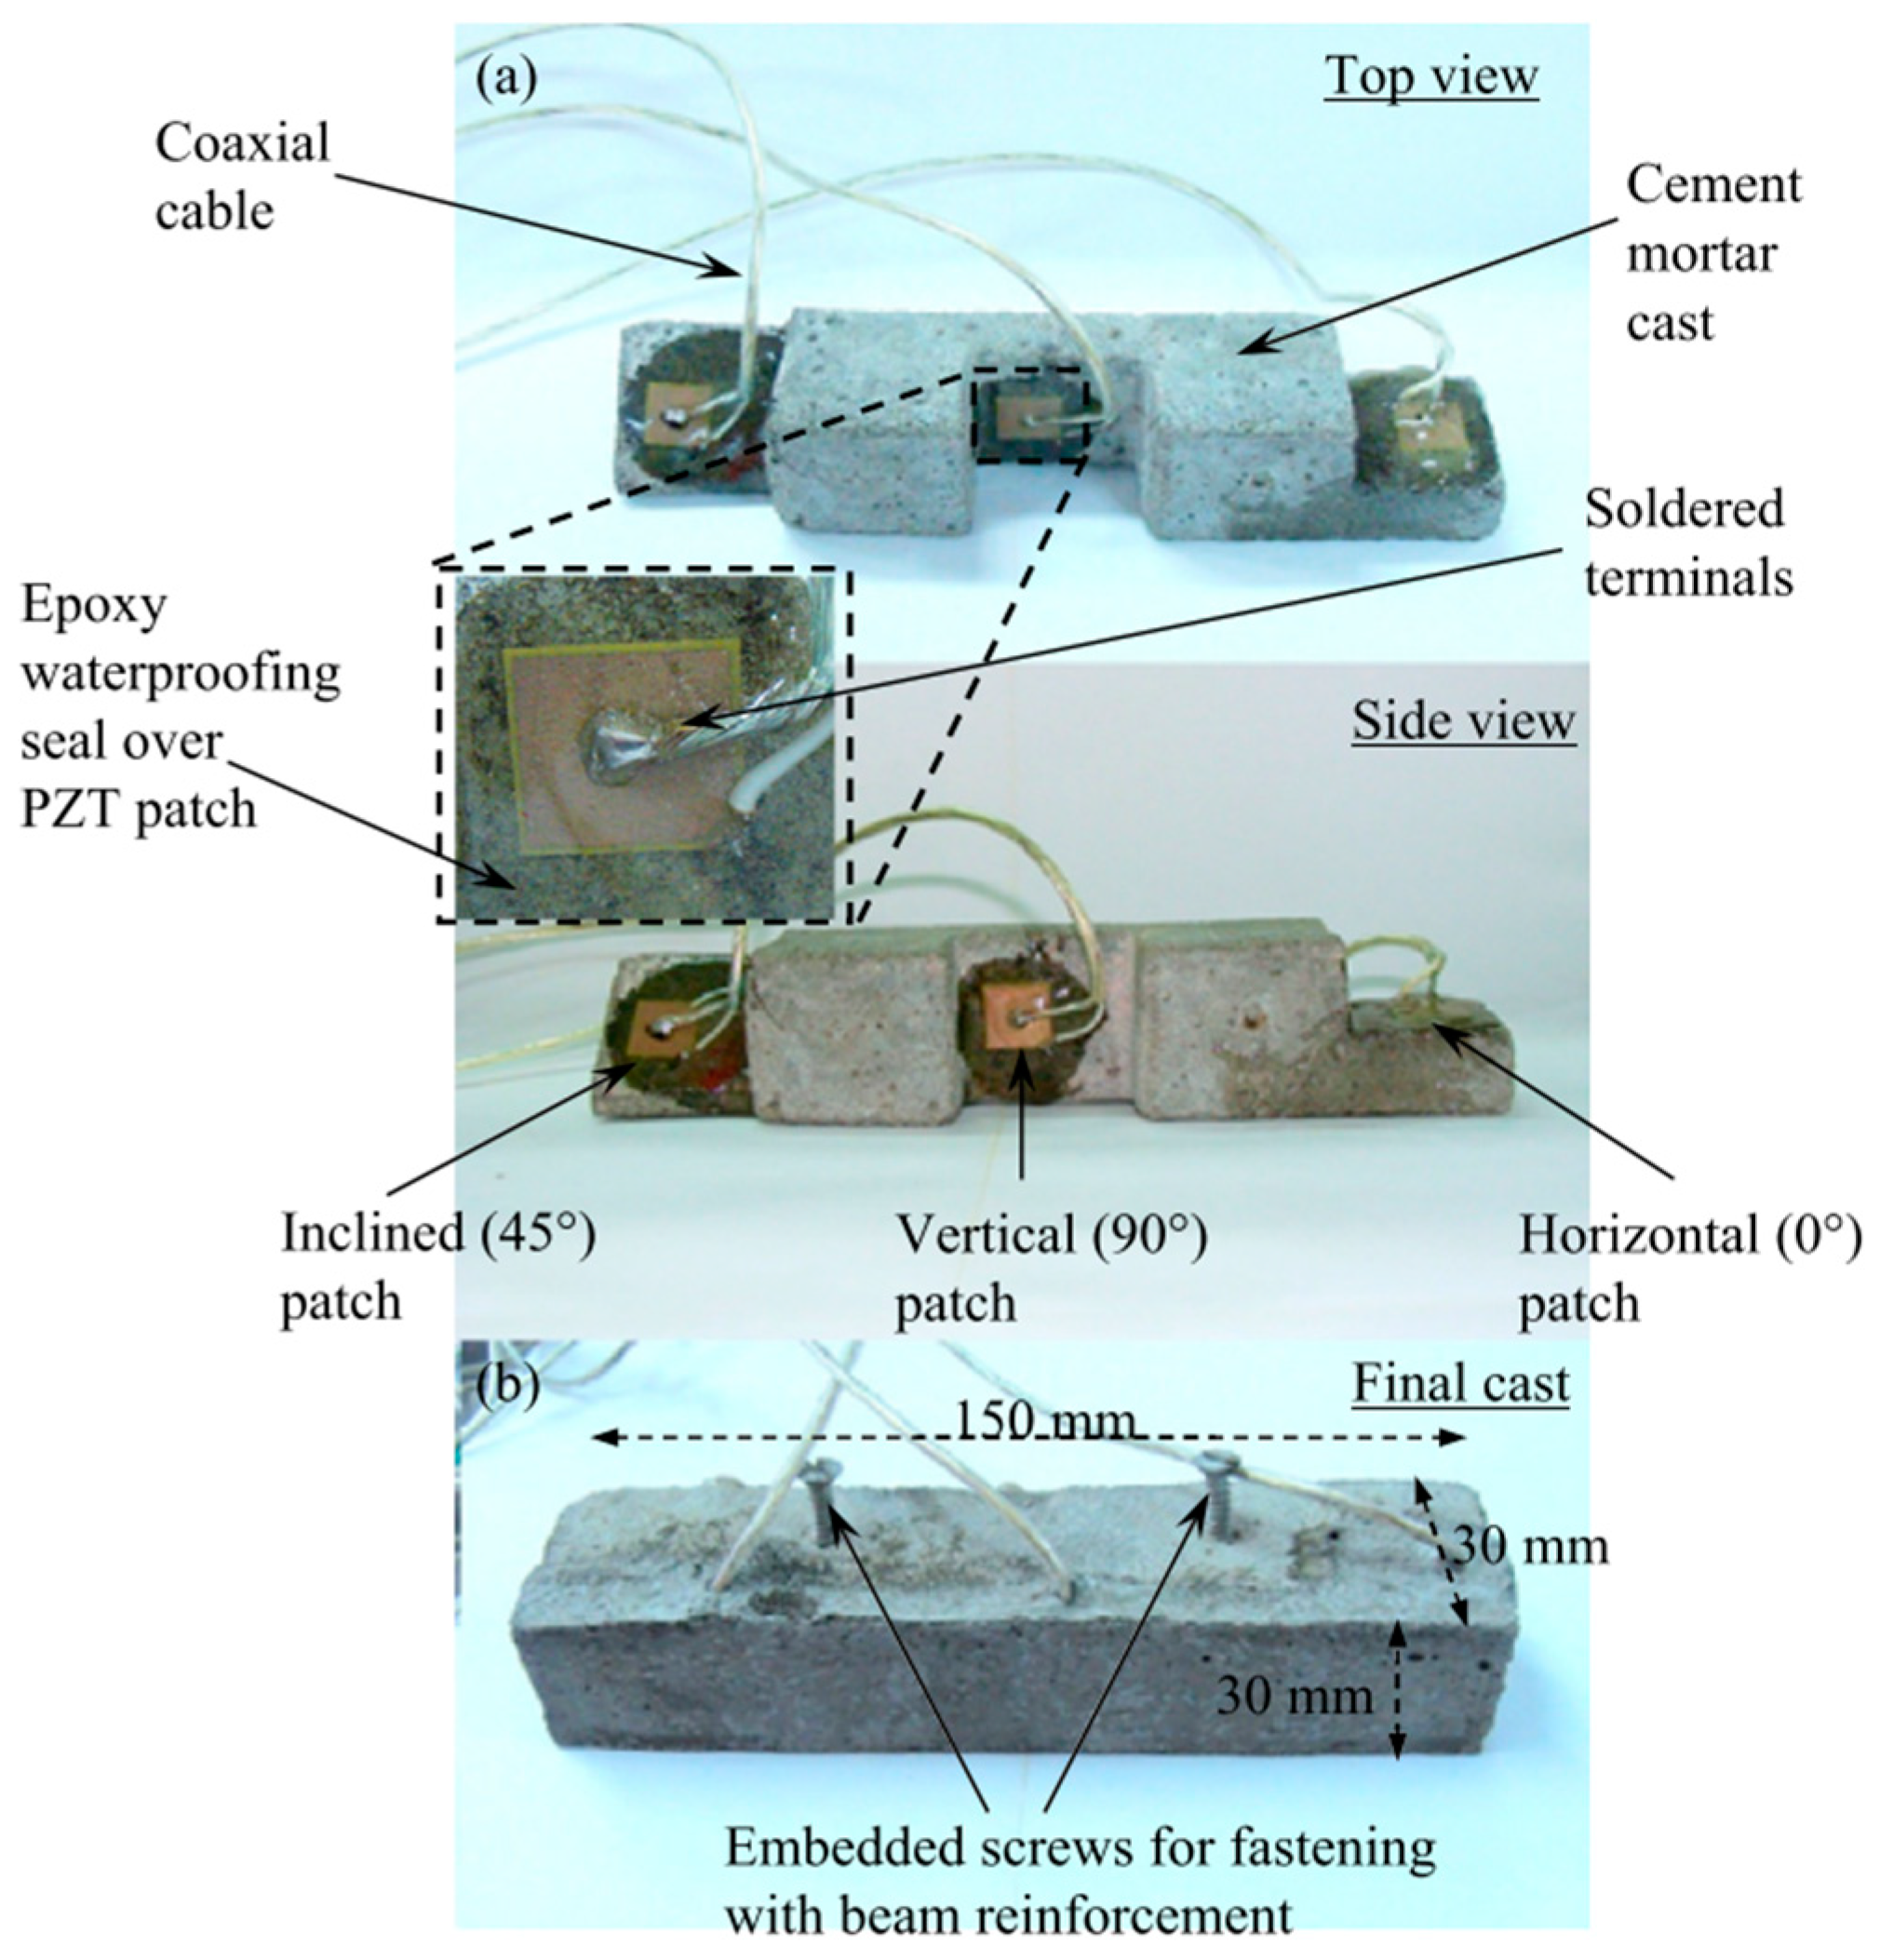
2.4. Coating and Embedment Techniques

A protective layer should be considered to prevent corrosion and damage from the alkaline and creeping properties of concrete. There are 2 typical approaches in sensor protection, via coating, or protective housing, with several coating materials that are applicable to various applications, these include epoxy, polyurethane, silicon, perylene, and Teflon [33,50,51,52]. Alternatively, protective housings can be fabricated with plastics or metallic base material.
All coated and housed PZT sensors were left to harden at room temperature for 48 h. Subsequently, the sensors were embedded into 3D printed concrete during the printing process. After insertion, the concrete samples would be subjected to 28 days of curing. Finally, the hardened samples are connected to the impedance analyser for data collection.

3. Results and Discussion

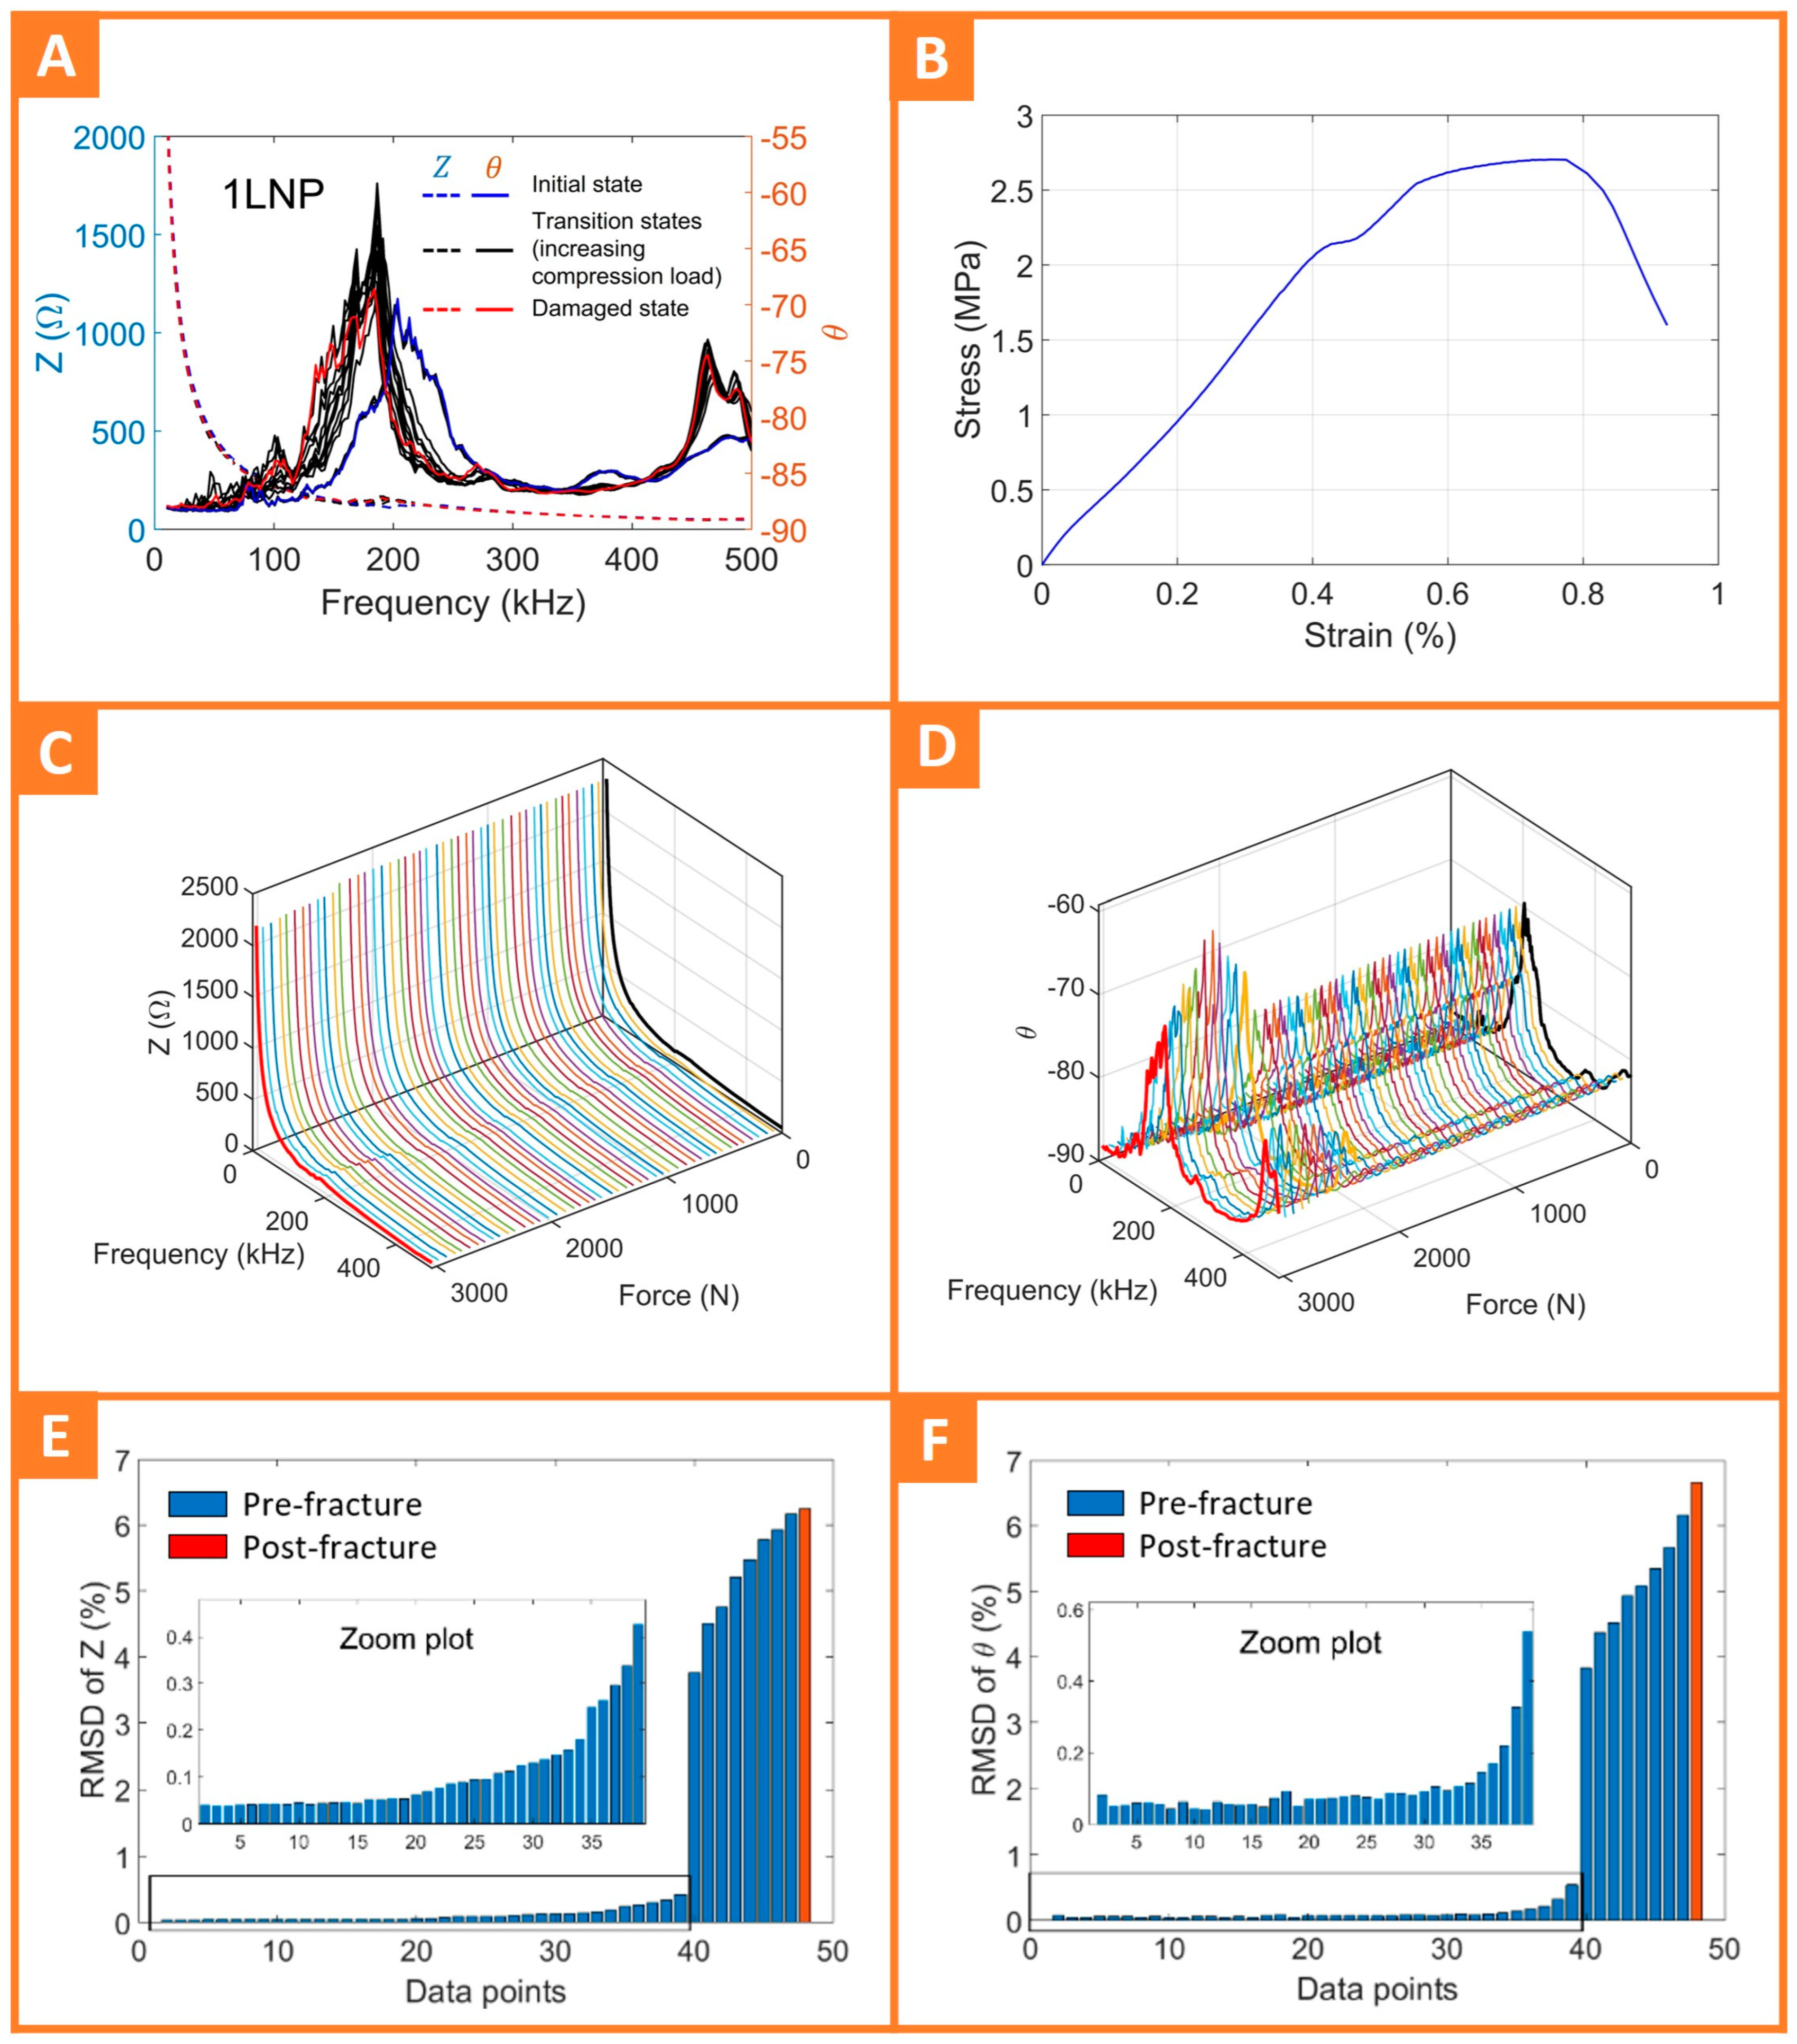
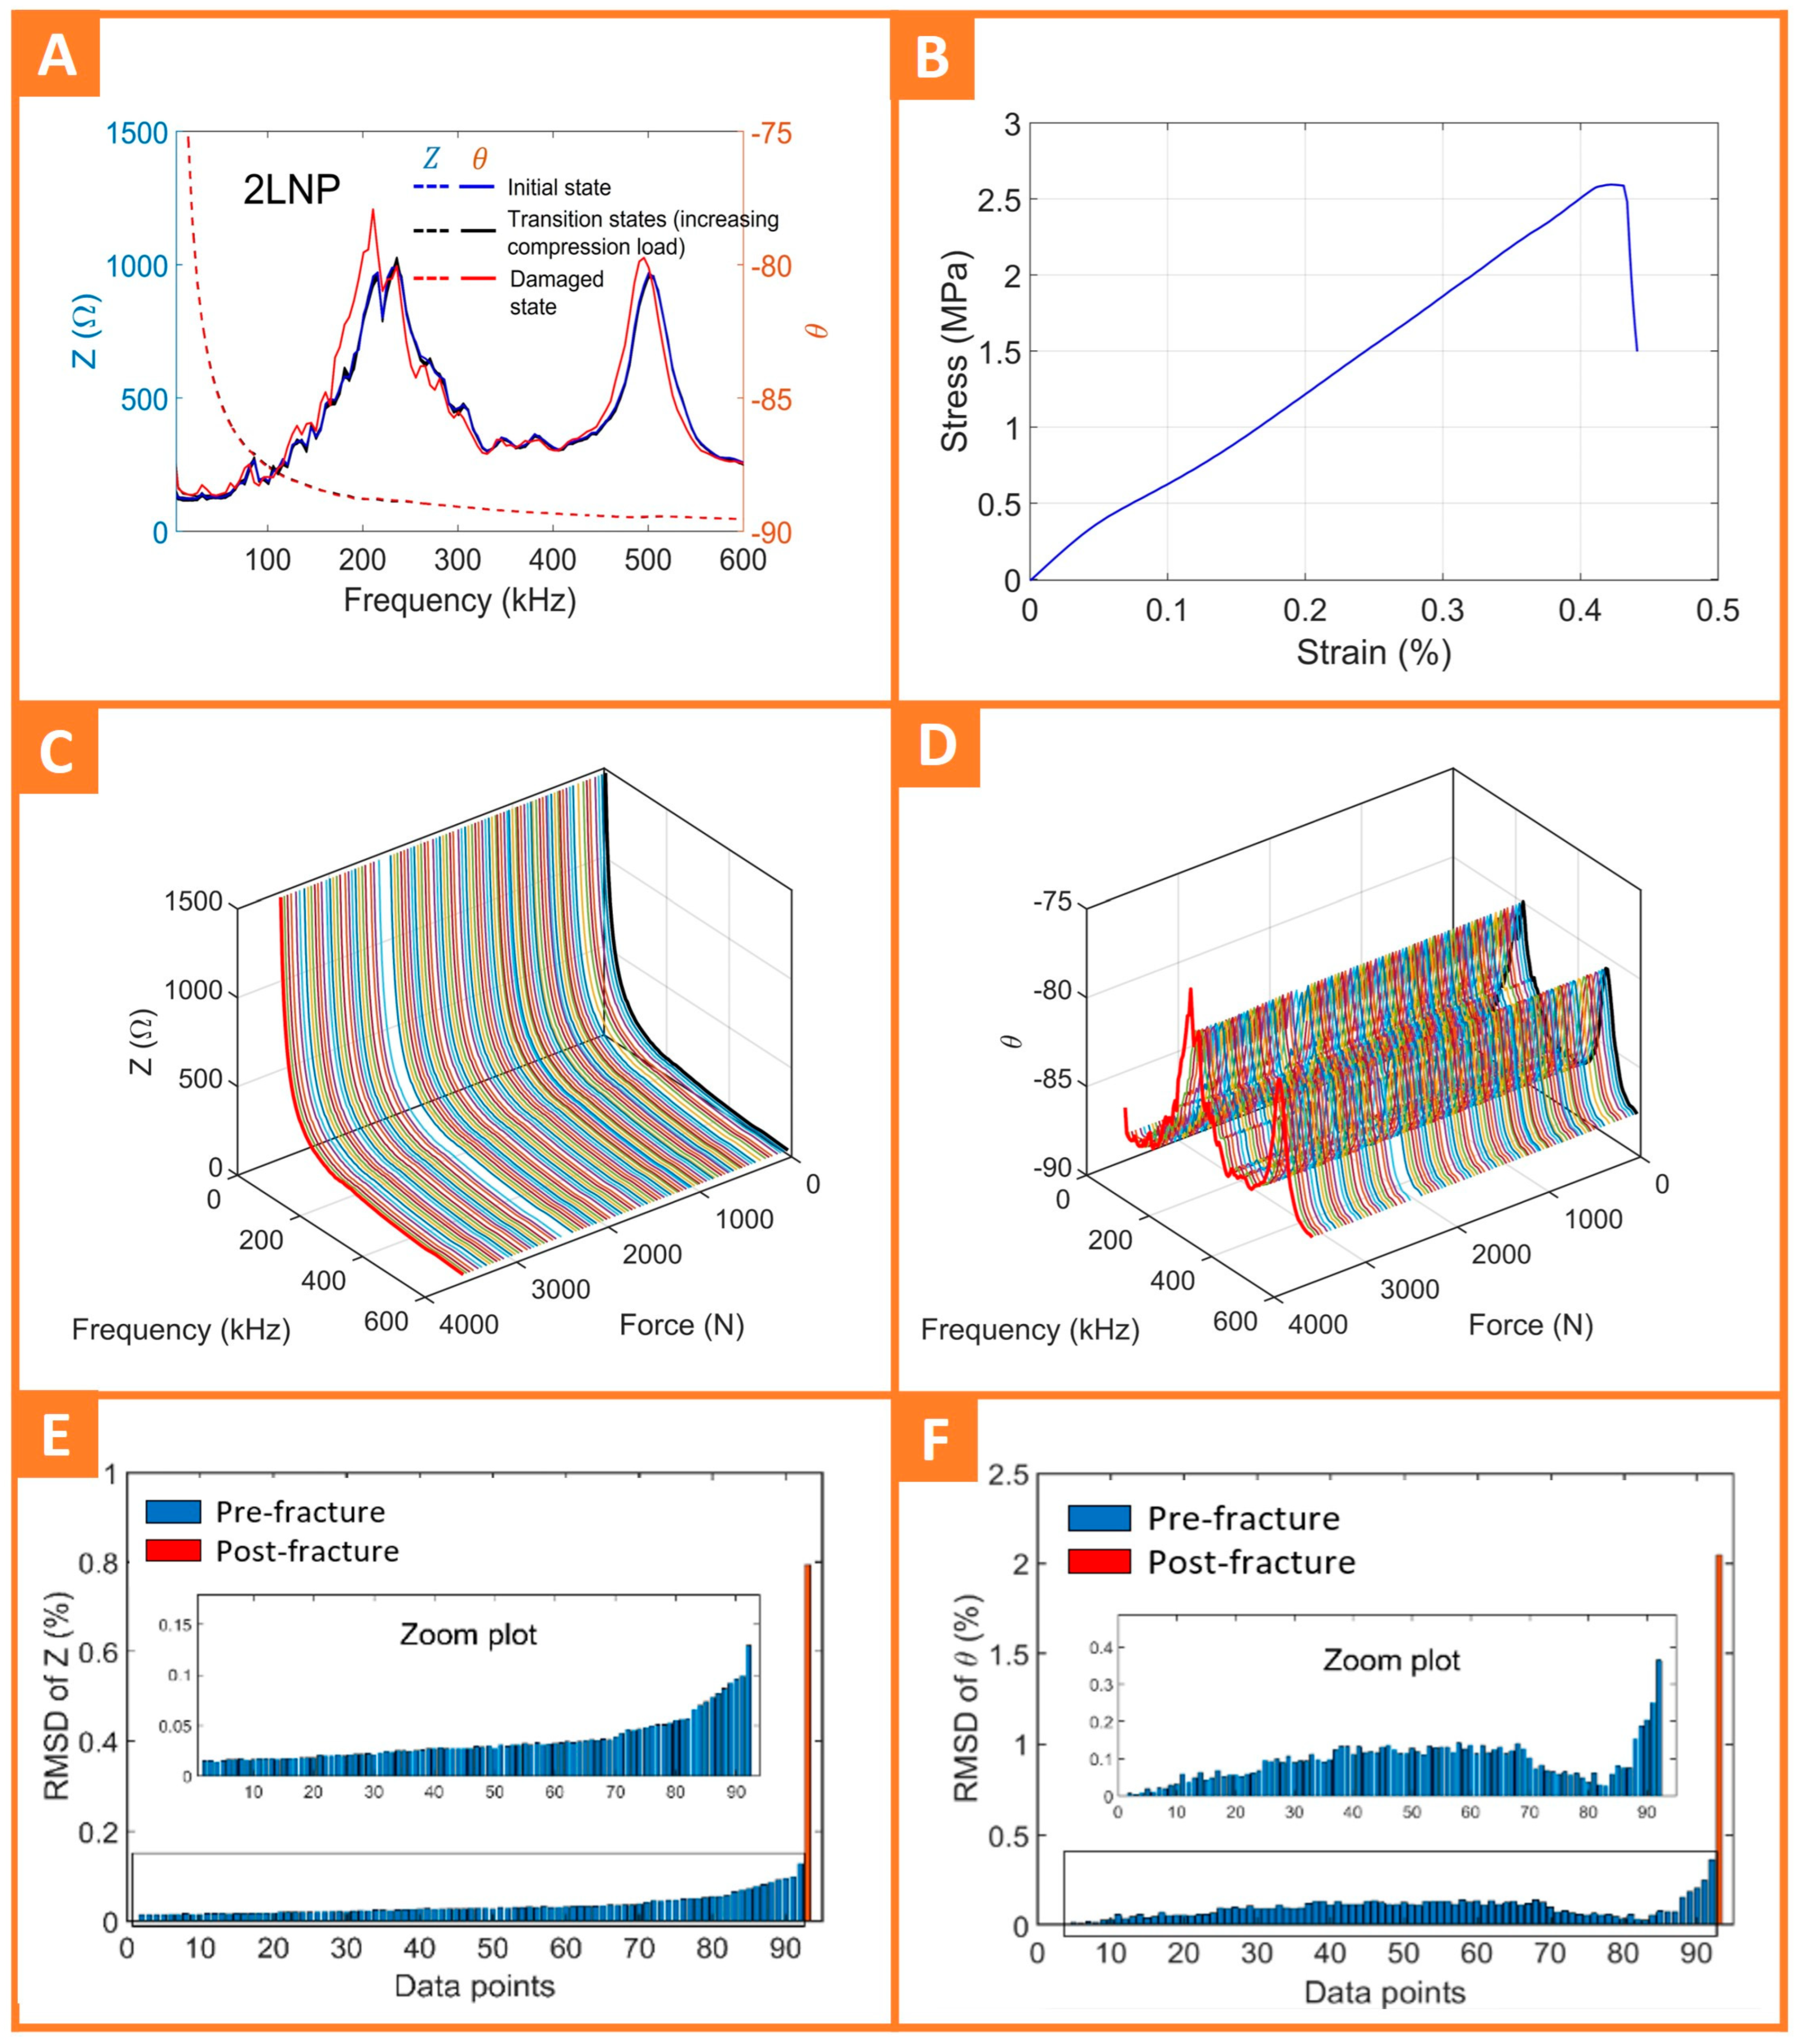
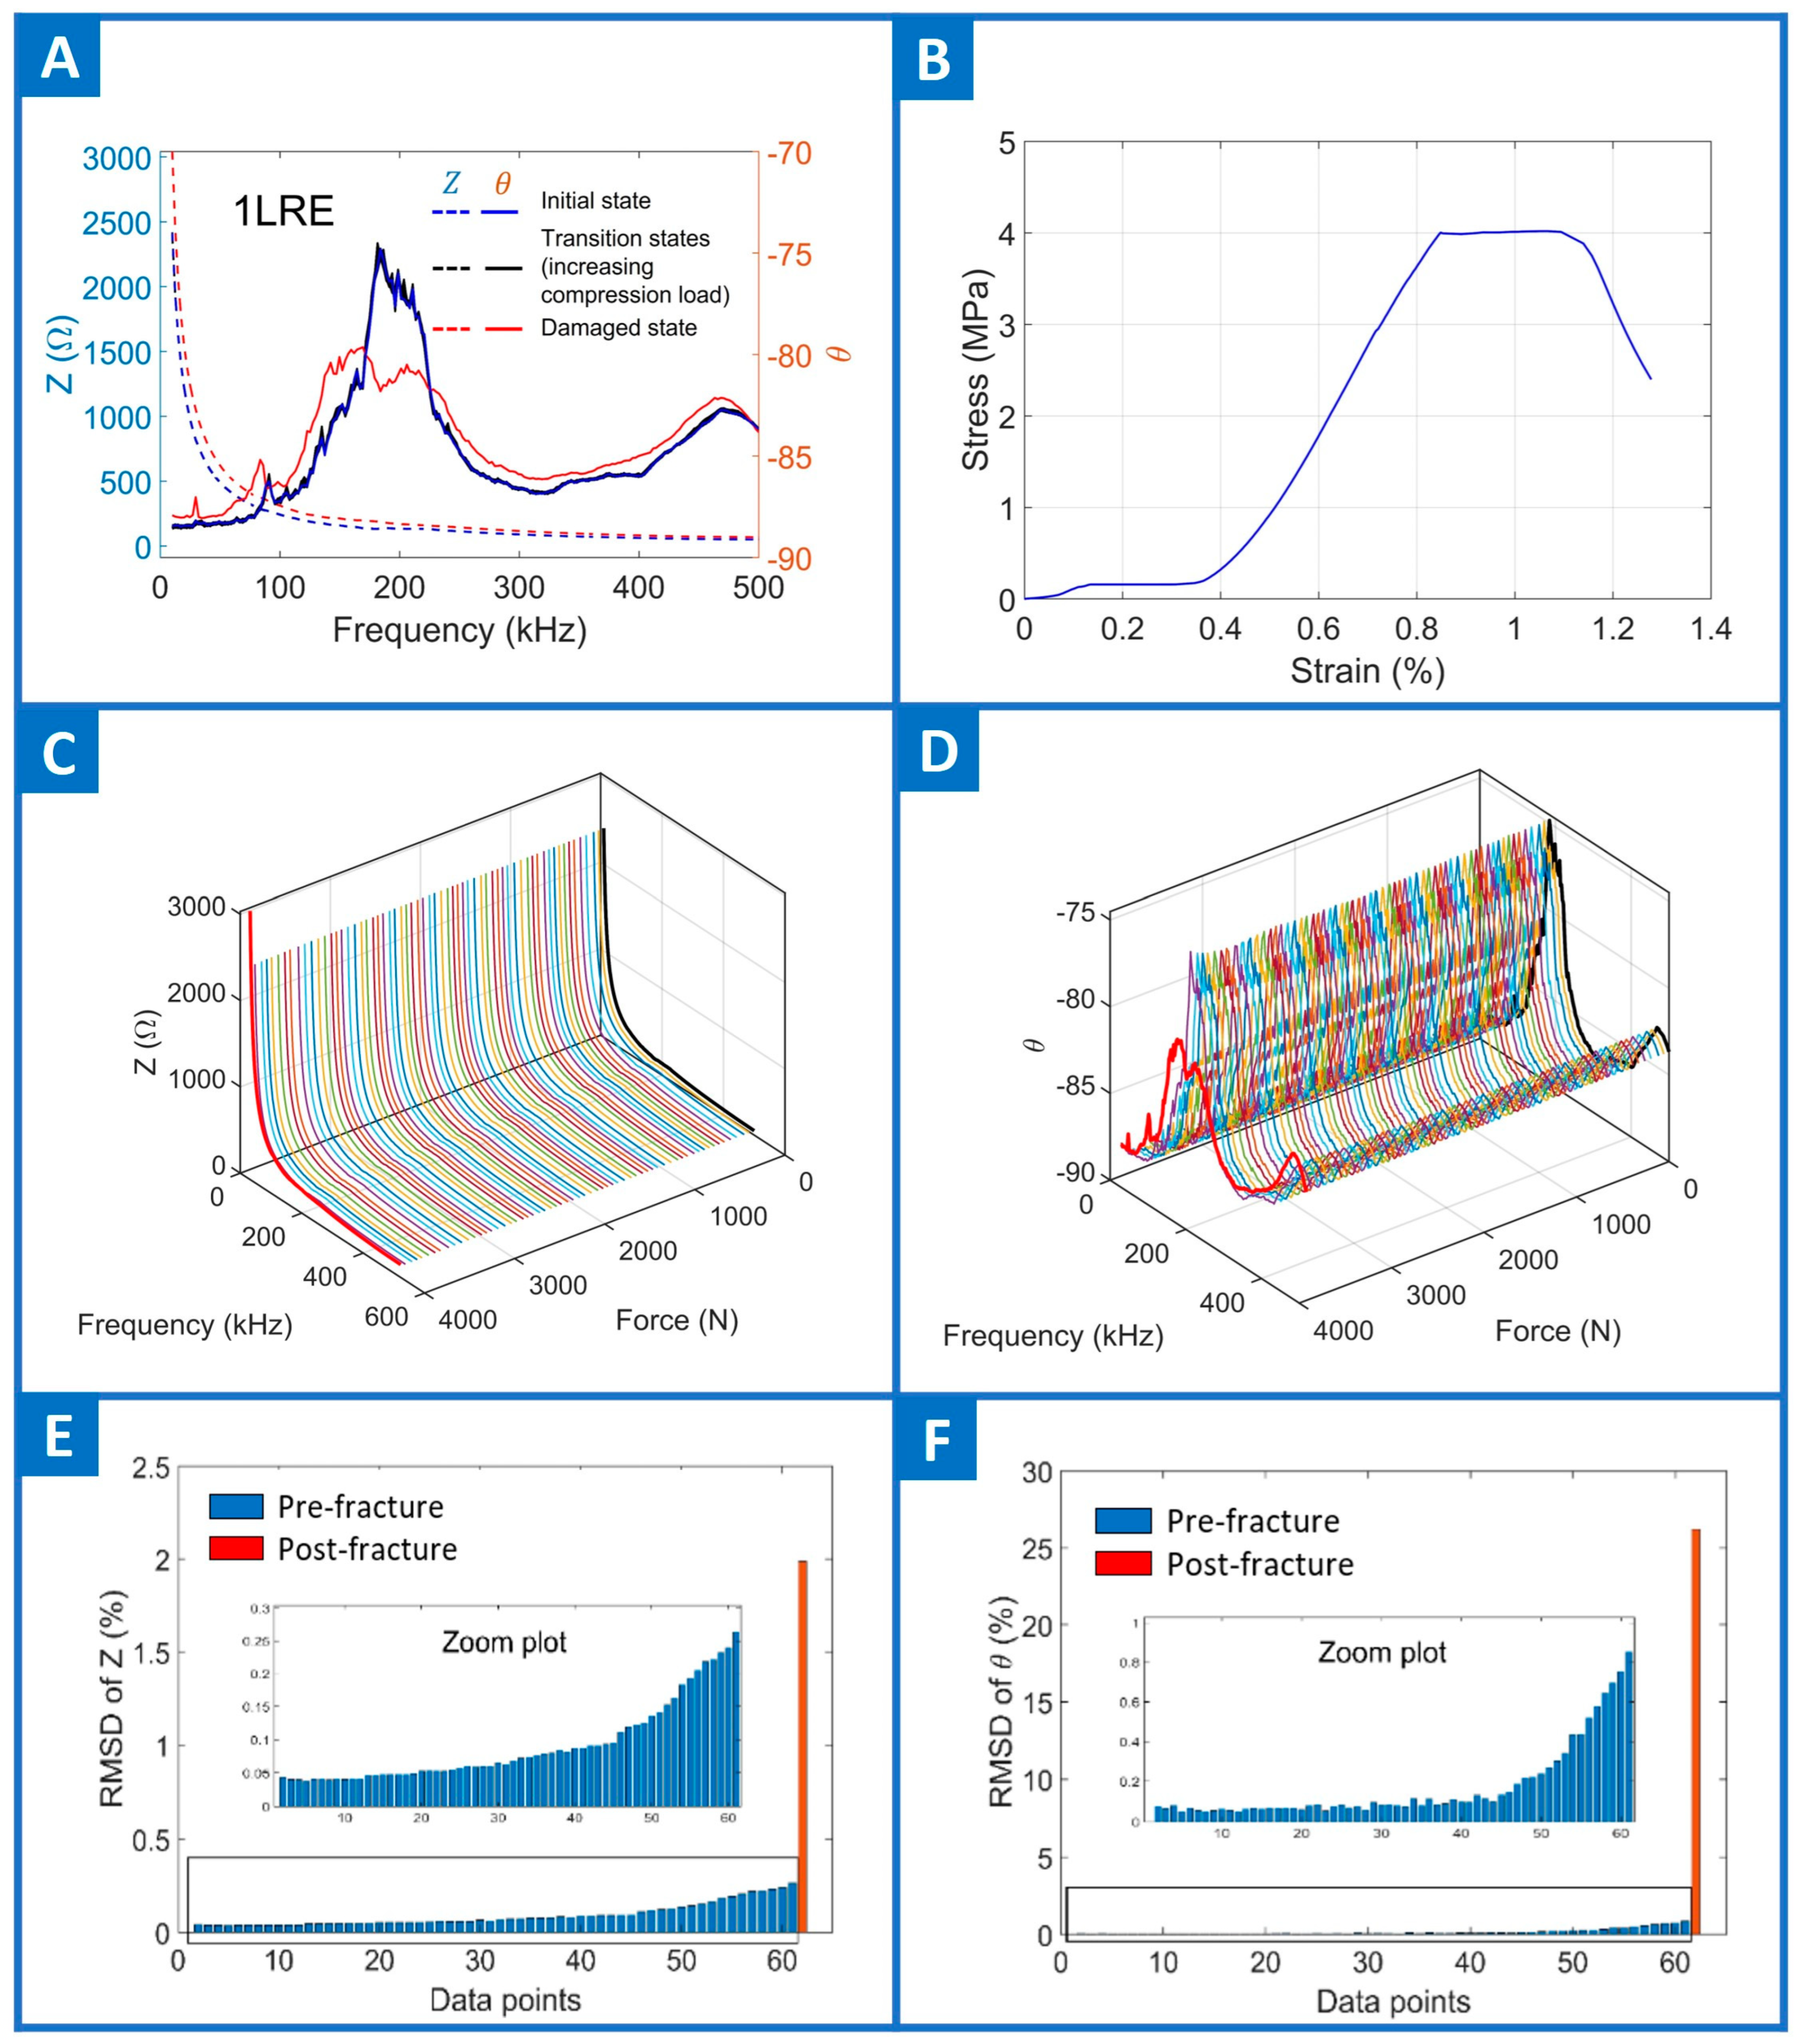
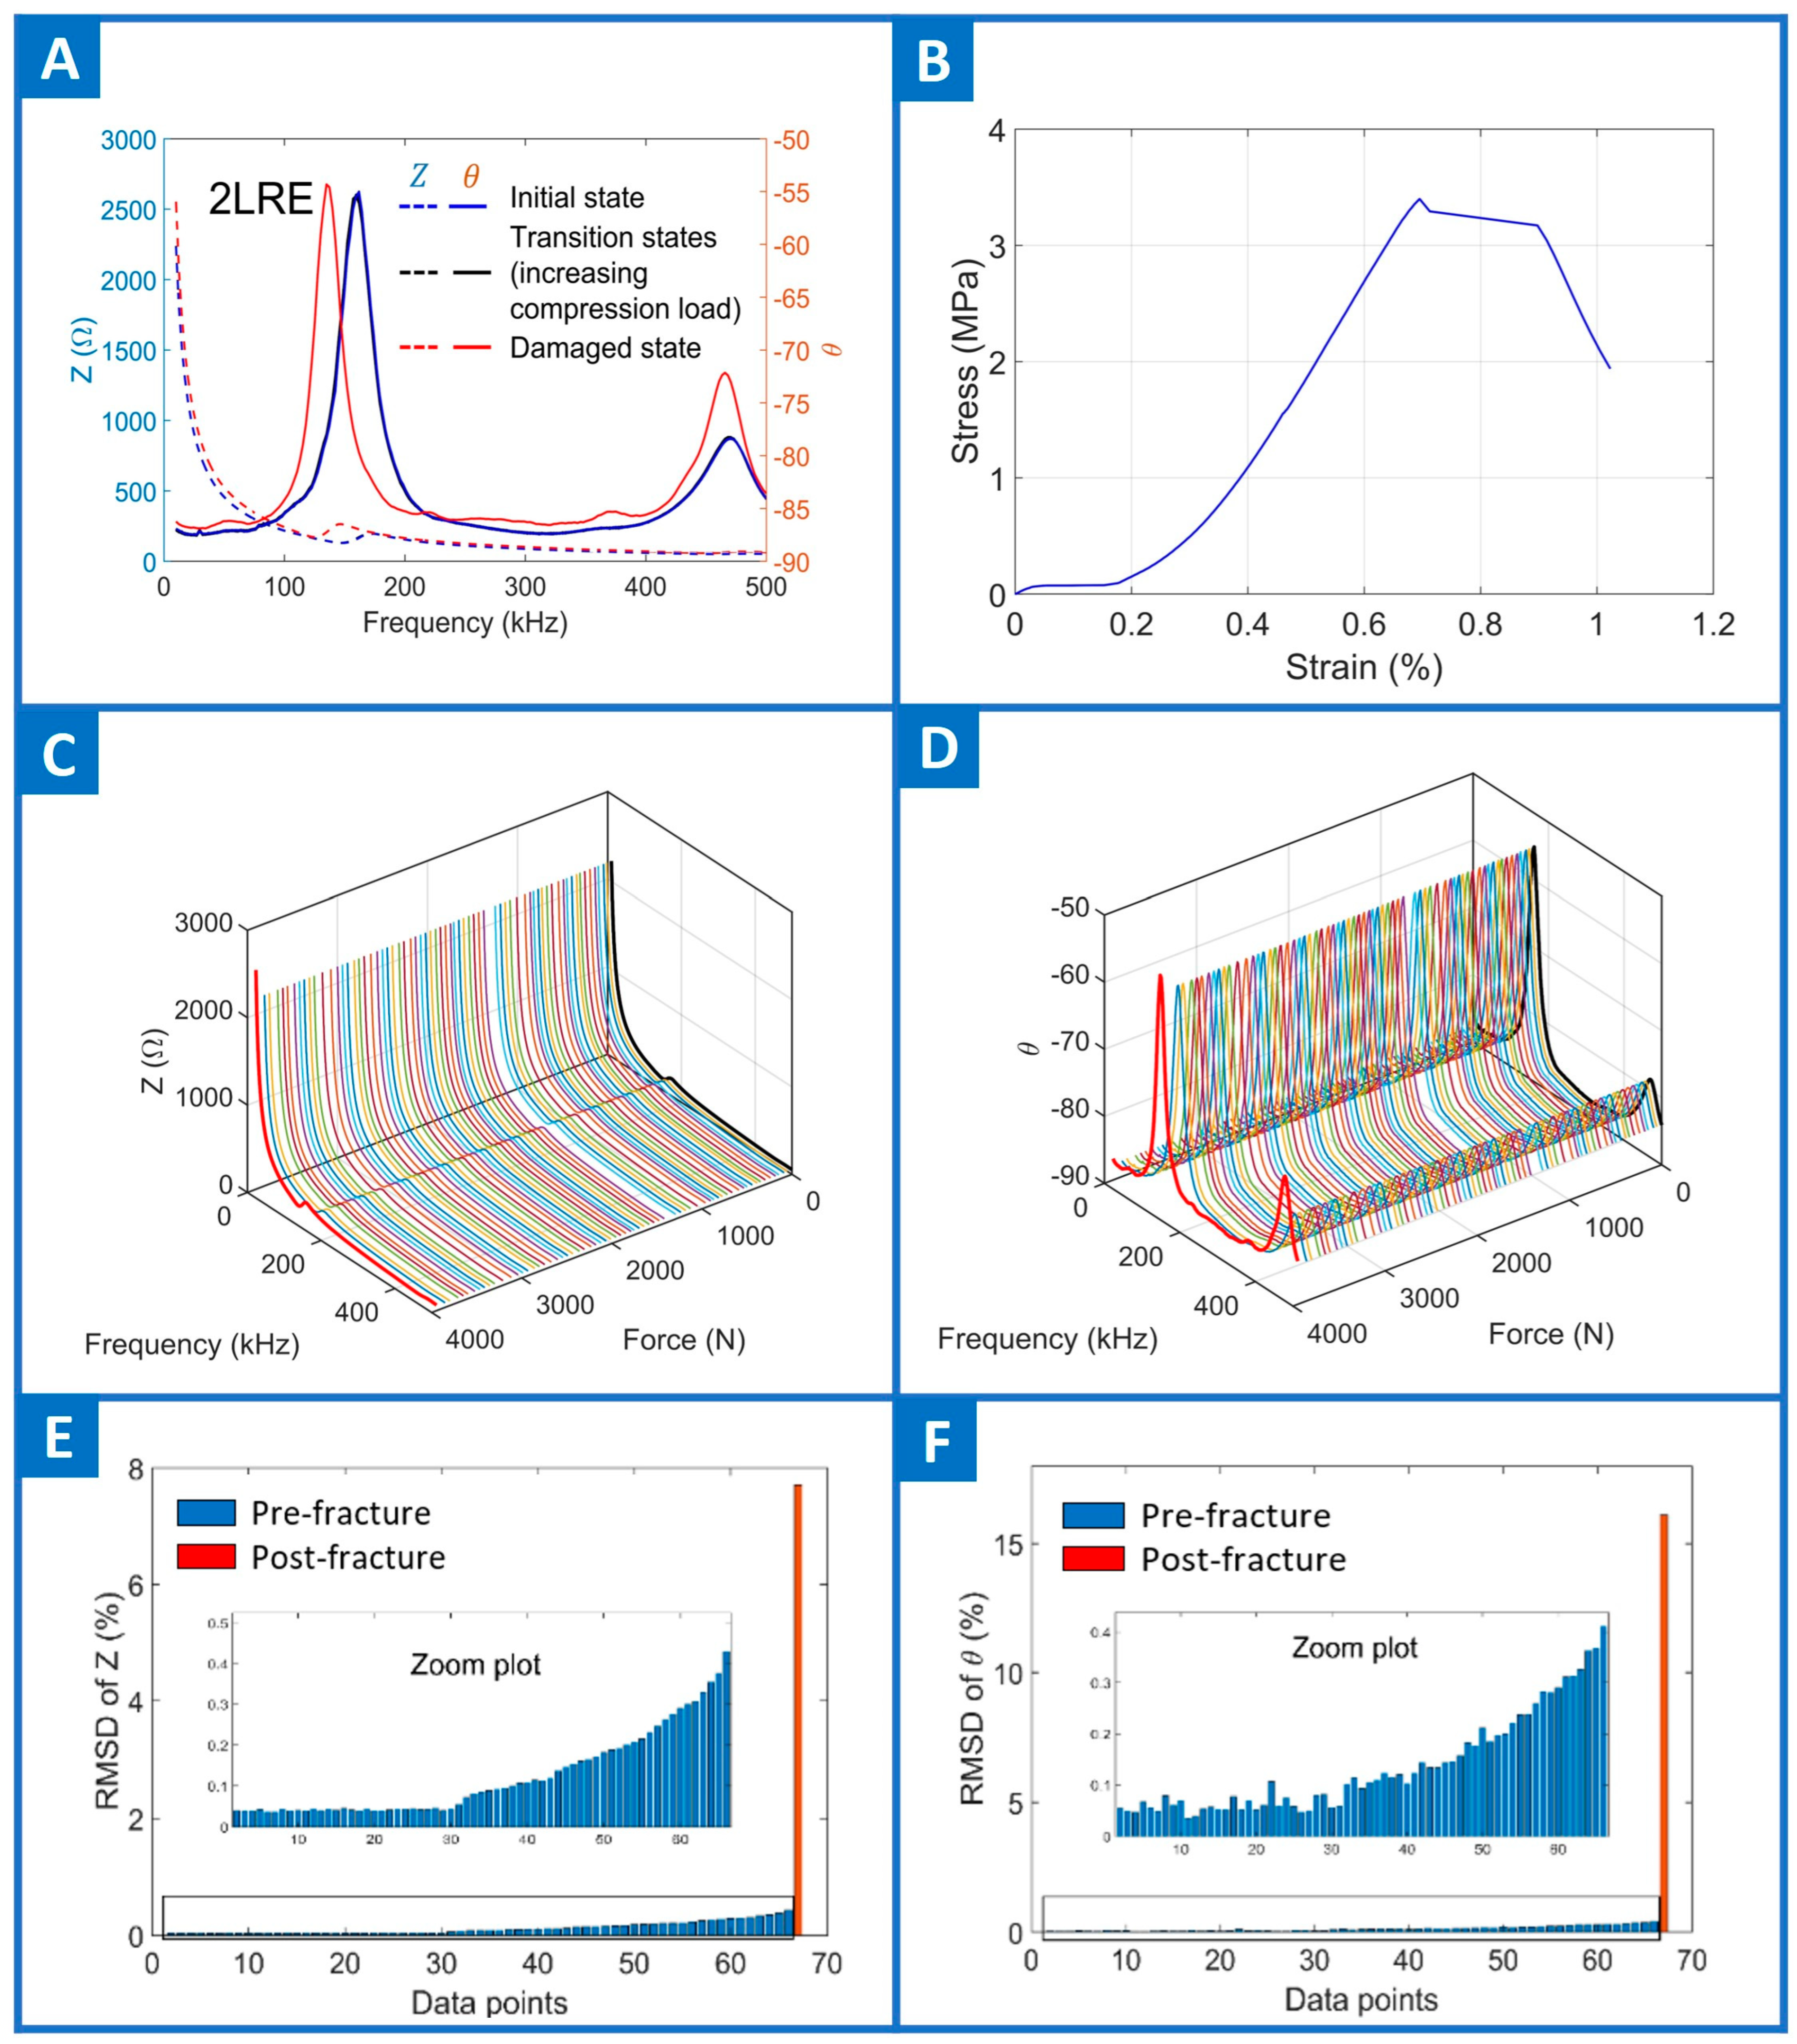
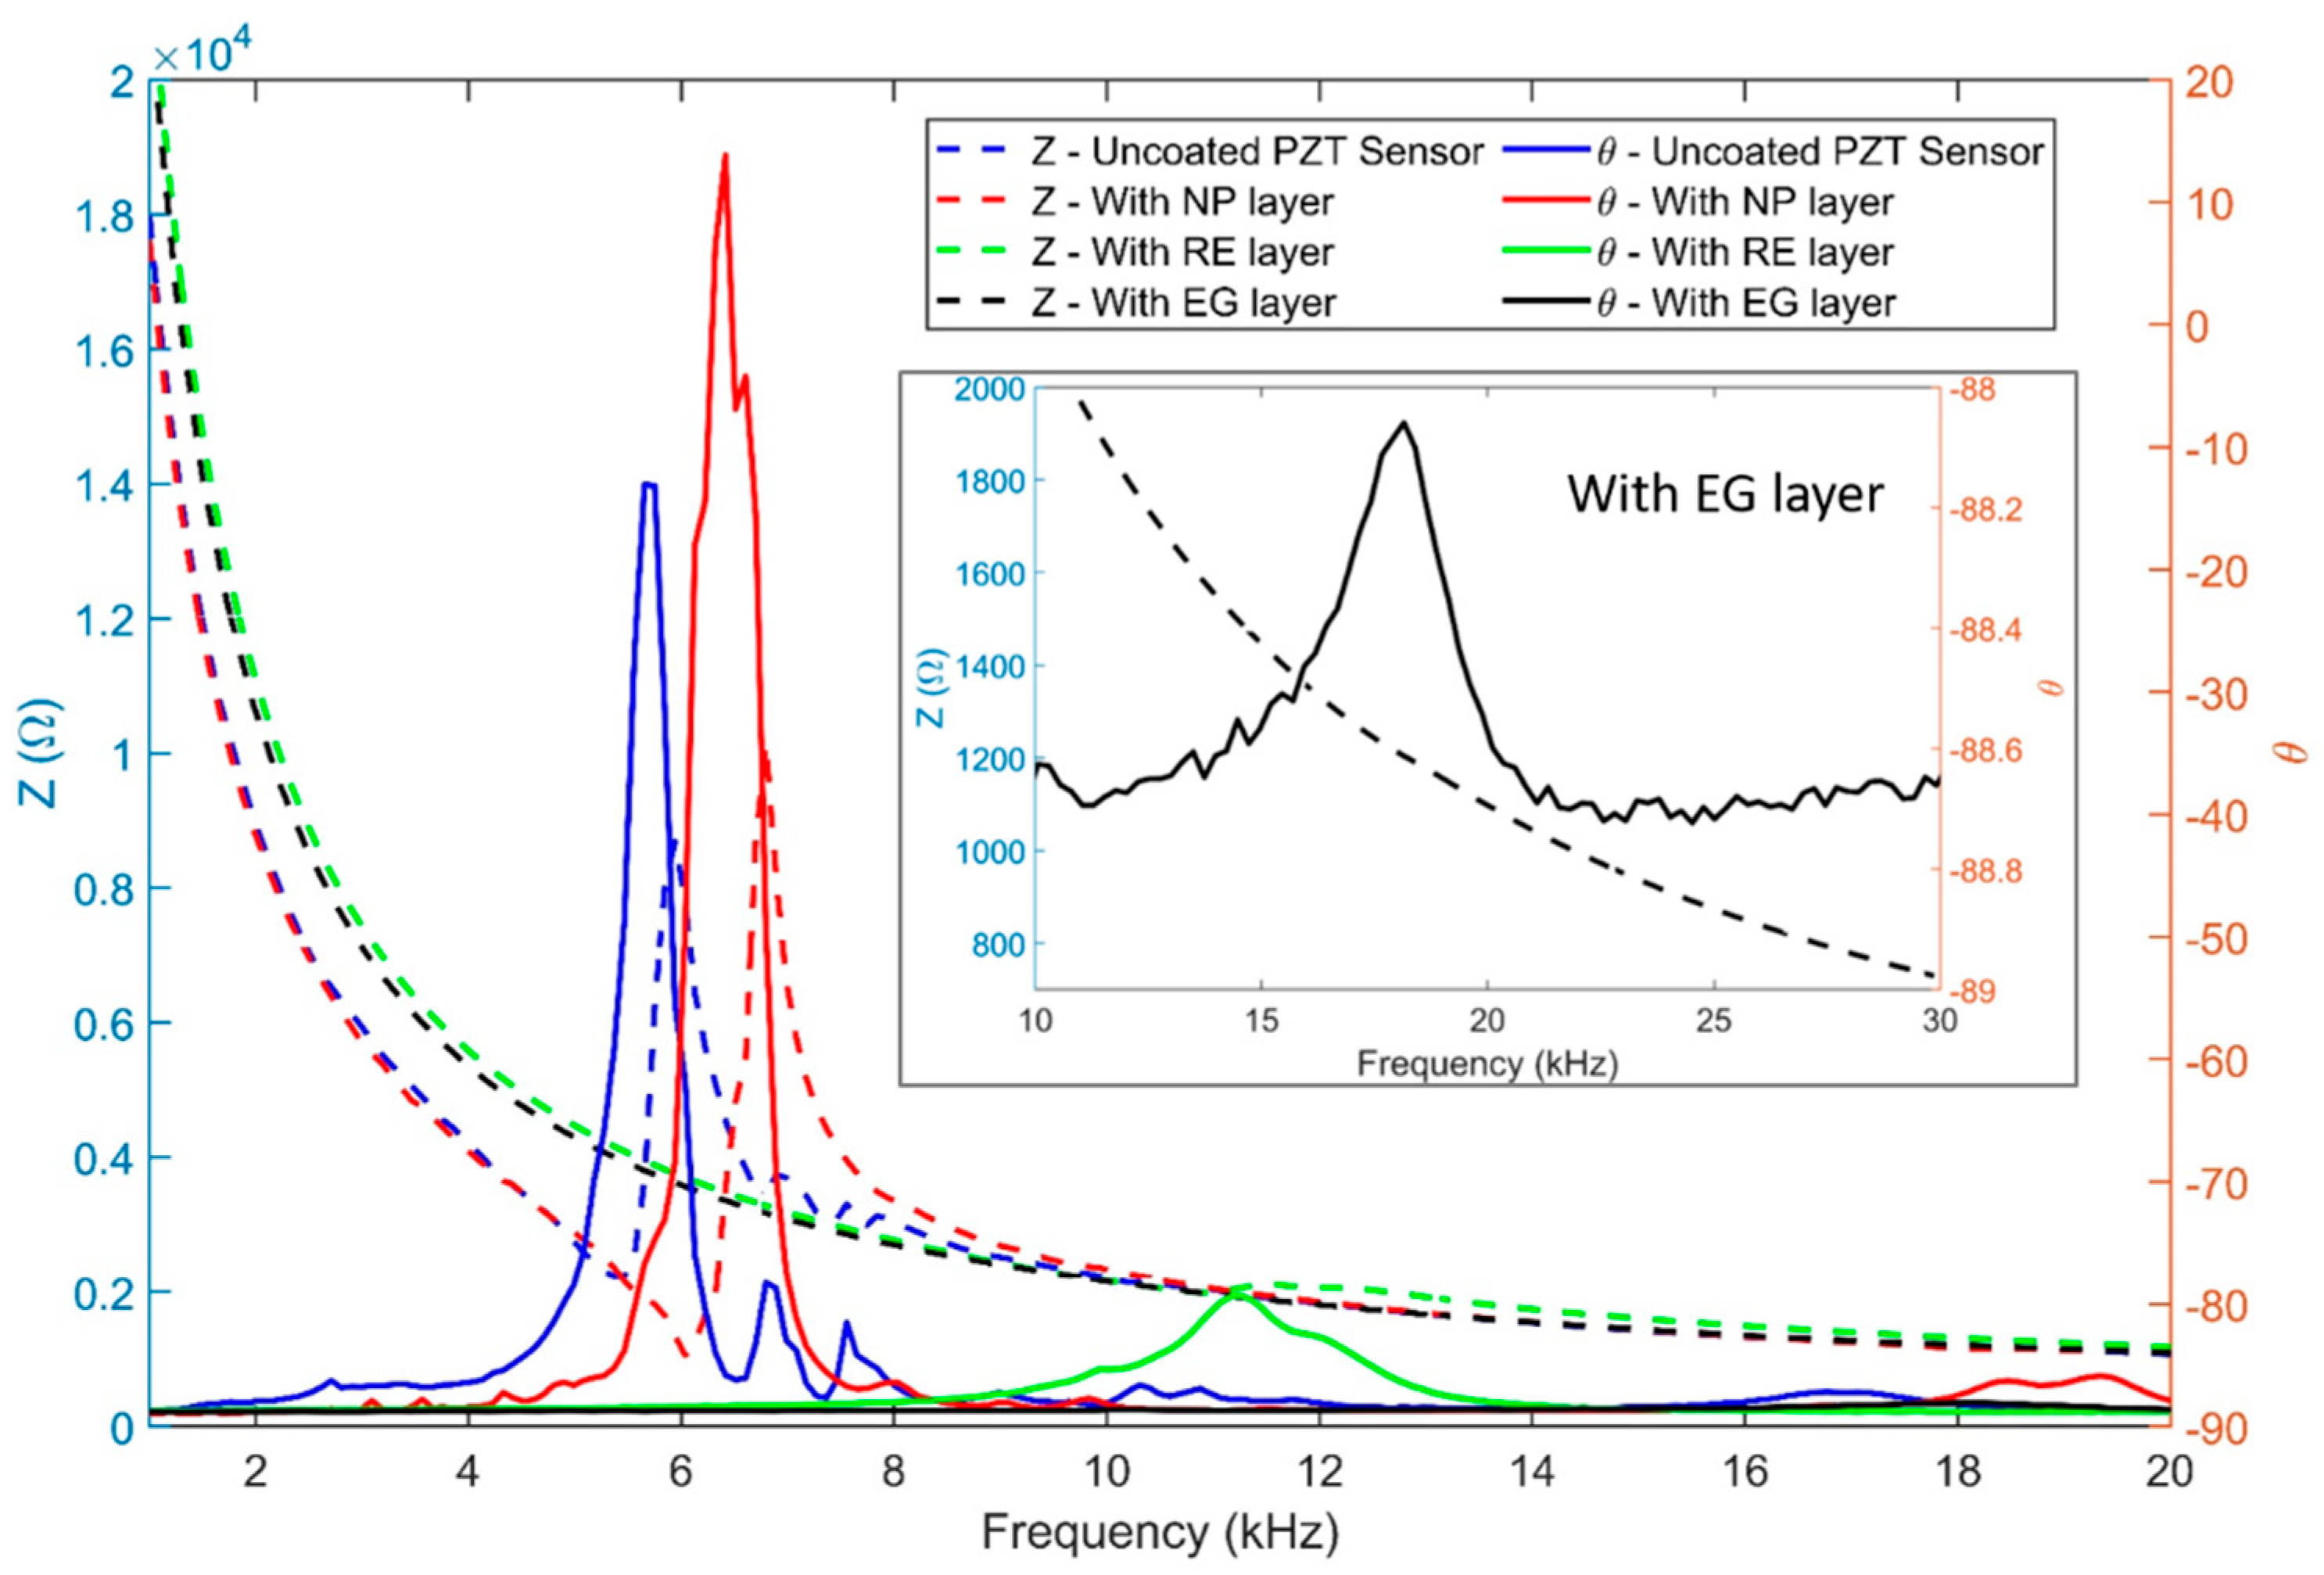
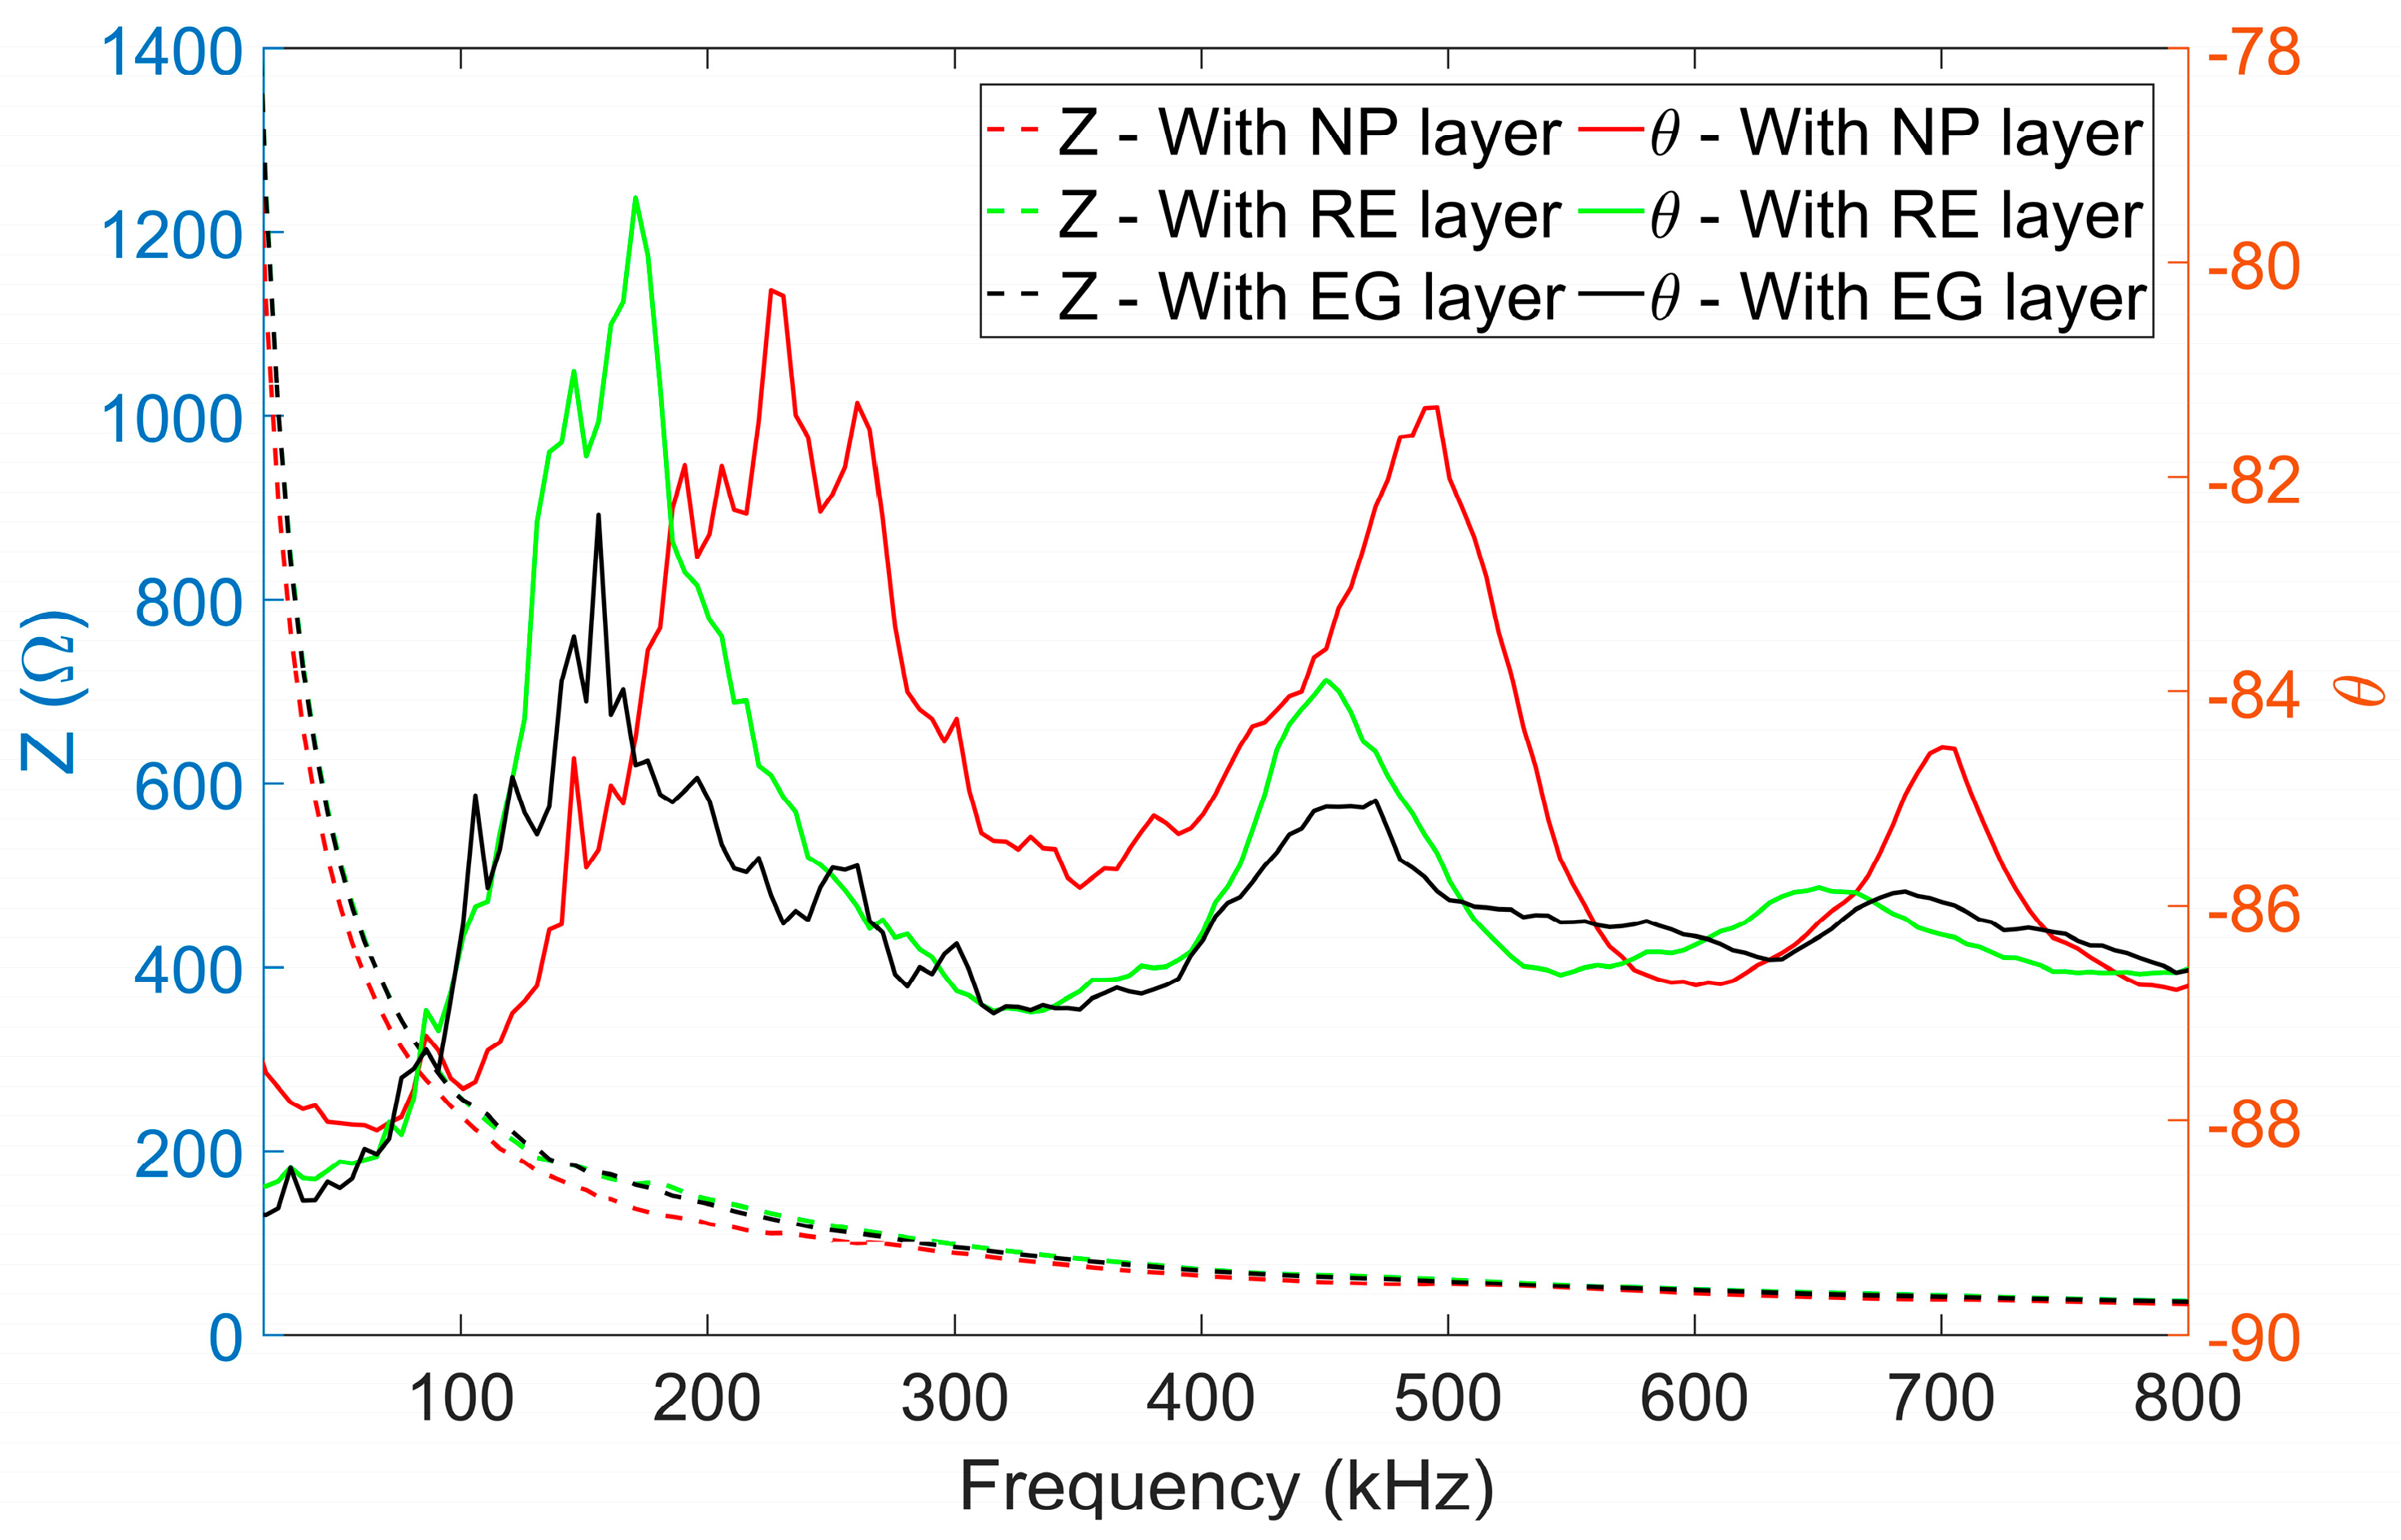
3.1. Effect of Different Coating Types

In this experimental approach, both methods (coating and housing techniques) were evaluated in this test. As a result, three coating types were identified for the Piezoelectric sensor based on the literature in related concrete studies. The materials used are:
  • Seche Vite Nail Polish (Nail Polish—NP)
    • The main ingredient in a typical nail polish is ethyl acetate. This ingredient is normally used as a solvent that evaporates over time. The resulting hardened and durable film coating left behind is known as nitrocellulose (C18H21N11O38). This agent is derived from a naturally occurring polymer known as cellulose. The material was applied to the PZT sensor via coating.
  • RS-Pro 132-605 Quick Set epoxy resin (resin epoxy—RE)
    • This is a two-part synthetic polymer that hardens upon mixing. The resin is normally glycidyl ether/ester, which is coupled with a hardening agent that is usually polyamine. The resulting resin (C21H25ClO5) forms a three-dimensional network of polymer chains that would exhibit high strength, good chemical resistance, and adhesive properties. The material was applied to the PZT sensor via coating as well.
  • EPICOTE 3175 putty (epoxy glue—EG)
    • Epoxy putty has a similar composition to epoxy resin as a synthetic polymer. The resulting polymer will also exhibit a high strength and good chemical resistance. The clay-like consistency of this material can be moulded into its desired shape before hardening. Hence, protective application though casting was conducted with this material.
Figure 5 shows the printed schematic and the complete concrete samples with embedded Piezoelectric sensors. This experiment assesses the ease of the coating application and effectiveness in impedance response. Due to the difference in material properties of coating type, i.e., density and viscosity, the thickness of the PZT sensor package (sensor with coating layer) varies between each implementation.
Electromechanical impedance signals were collected and compared from each sensor in two datasets: (1) pre-coating and 48 h post-coating, and (2) after hardening of the concrete. Figure 6 shows the changes in impedance signals for case (1), before and after coating, which showed a consistent trend, showing signal changes in impedance magnitude (Z), phase angle (θ), and frequencies (kHz) for all sensors in three coating types as compared to the impedance signal of the uncoated sensor. The abbreviations NP, RE, and EG represent Nail Polish, resin epoxy, and epoxy glue, respectively. The NP and RE coating types displayed an observable change in impedance signal after evaluation, while the EG coating appeared to be significantly less responsive compared to the other two coating materials. All three sensors appeared healthy upon coating/housing application.
Upon embedment, Figure 7 shows the results obtained for case (2), where it shows the impedance signals obtained after 28 days of curing in 3D printed concrete. Comparing the results shown in Figure 6, initial observations show that the frequency range of peak impedance increased significantly from 5–18 kHz (5.66 kHz, 6.42 kHz, 11.26 kHz, and 18.15 kHz for uncoated PZT, NP, RE, and EG, respectively) to 150–226kHz. This change in frequency range of the electrical impedance signals was found to be consistent and similar between all three sensor types with a peak phase angle at frequencies of 225.78 kHz, 170.83 kHz, and 155.85 kHz, for NP, RE, and EG, respectively. These measurements show that the embedded PZT sensors can detect the mechanical change in the concrete structure. Consequentially, the results obtained here also displayed similar outcomes with case (1) where the EG sample was less responsive to external changes as compared to the NP and RE samples.
The results obtained from the two cases in this study show that the three materials exhibited consistent results in EMI signals upon embedment to the concrete structure and that the EMI signals obtained from the EG-housed PZT sensor were shown to have the least response between the three sensors. Several reasons could be attributed to this difference, but the results indicate that performance measures could be affected by the housing or layering technique. Further evaluation will be conducted in the next experiment, where NP and RE have been considered as the two have similar coating methods while demonstrating better performance compared to EG housing to sense the mechanical change in 3D printed concrete.

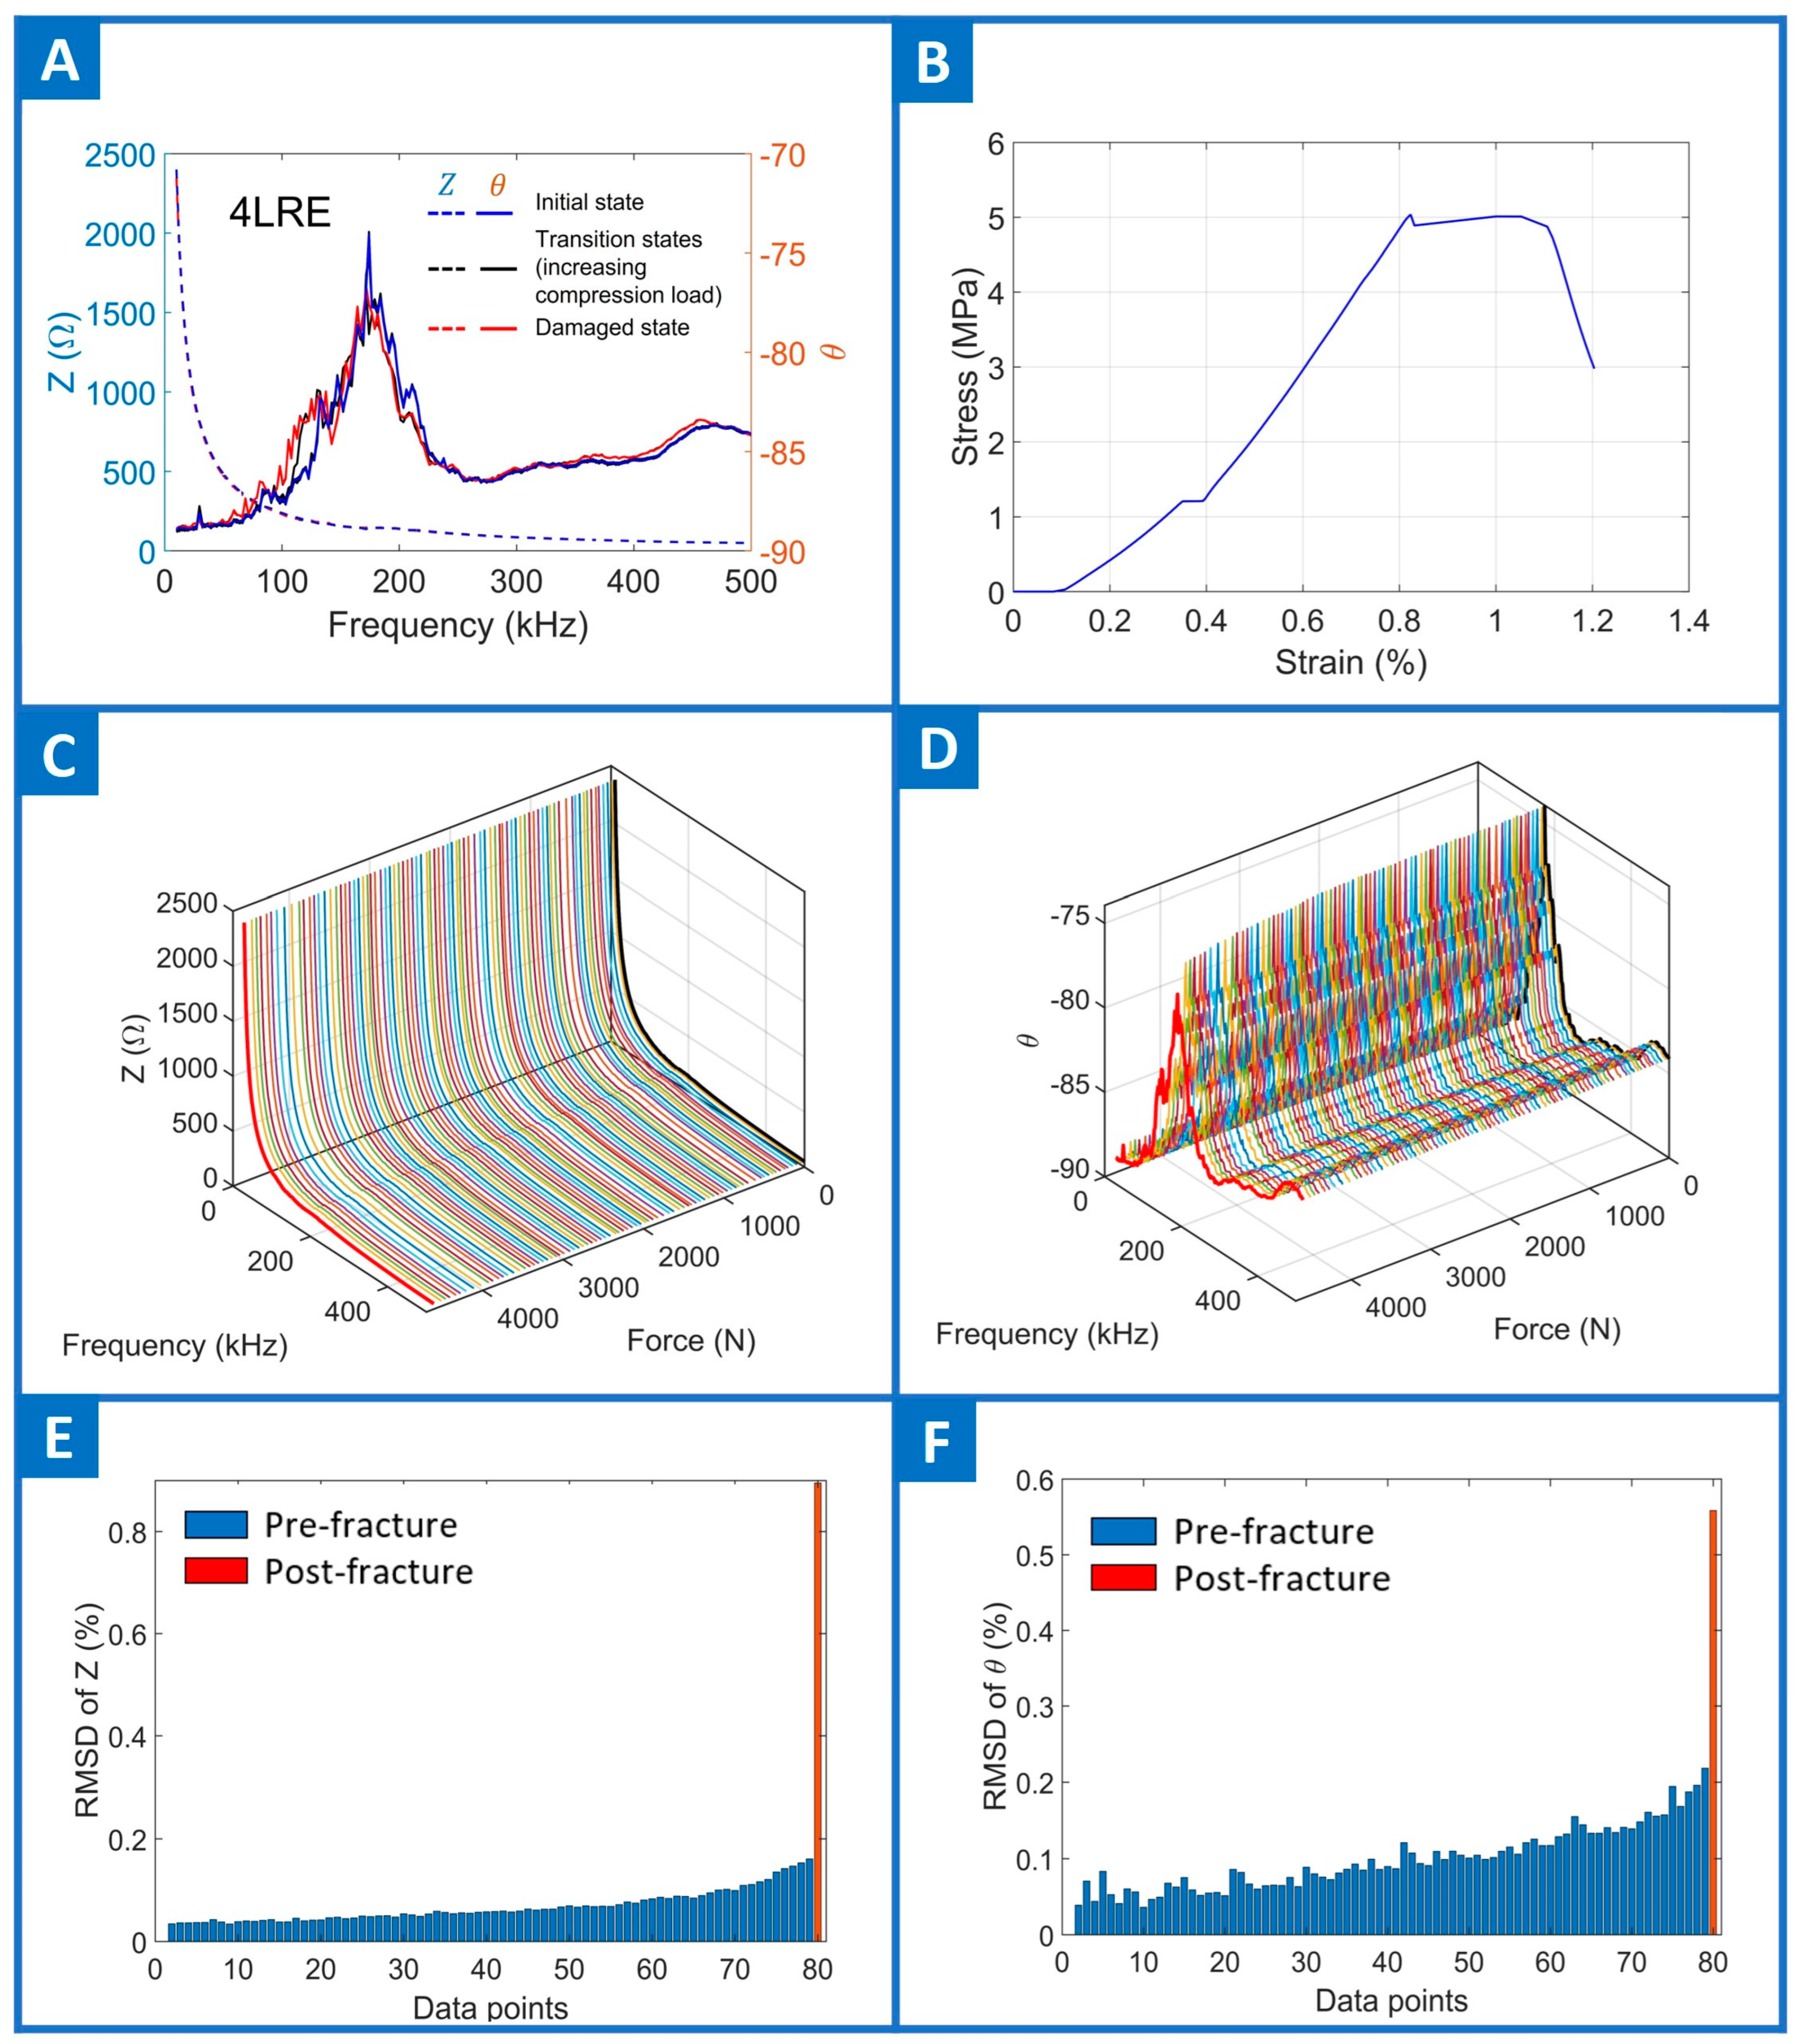
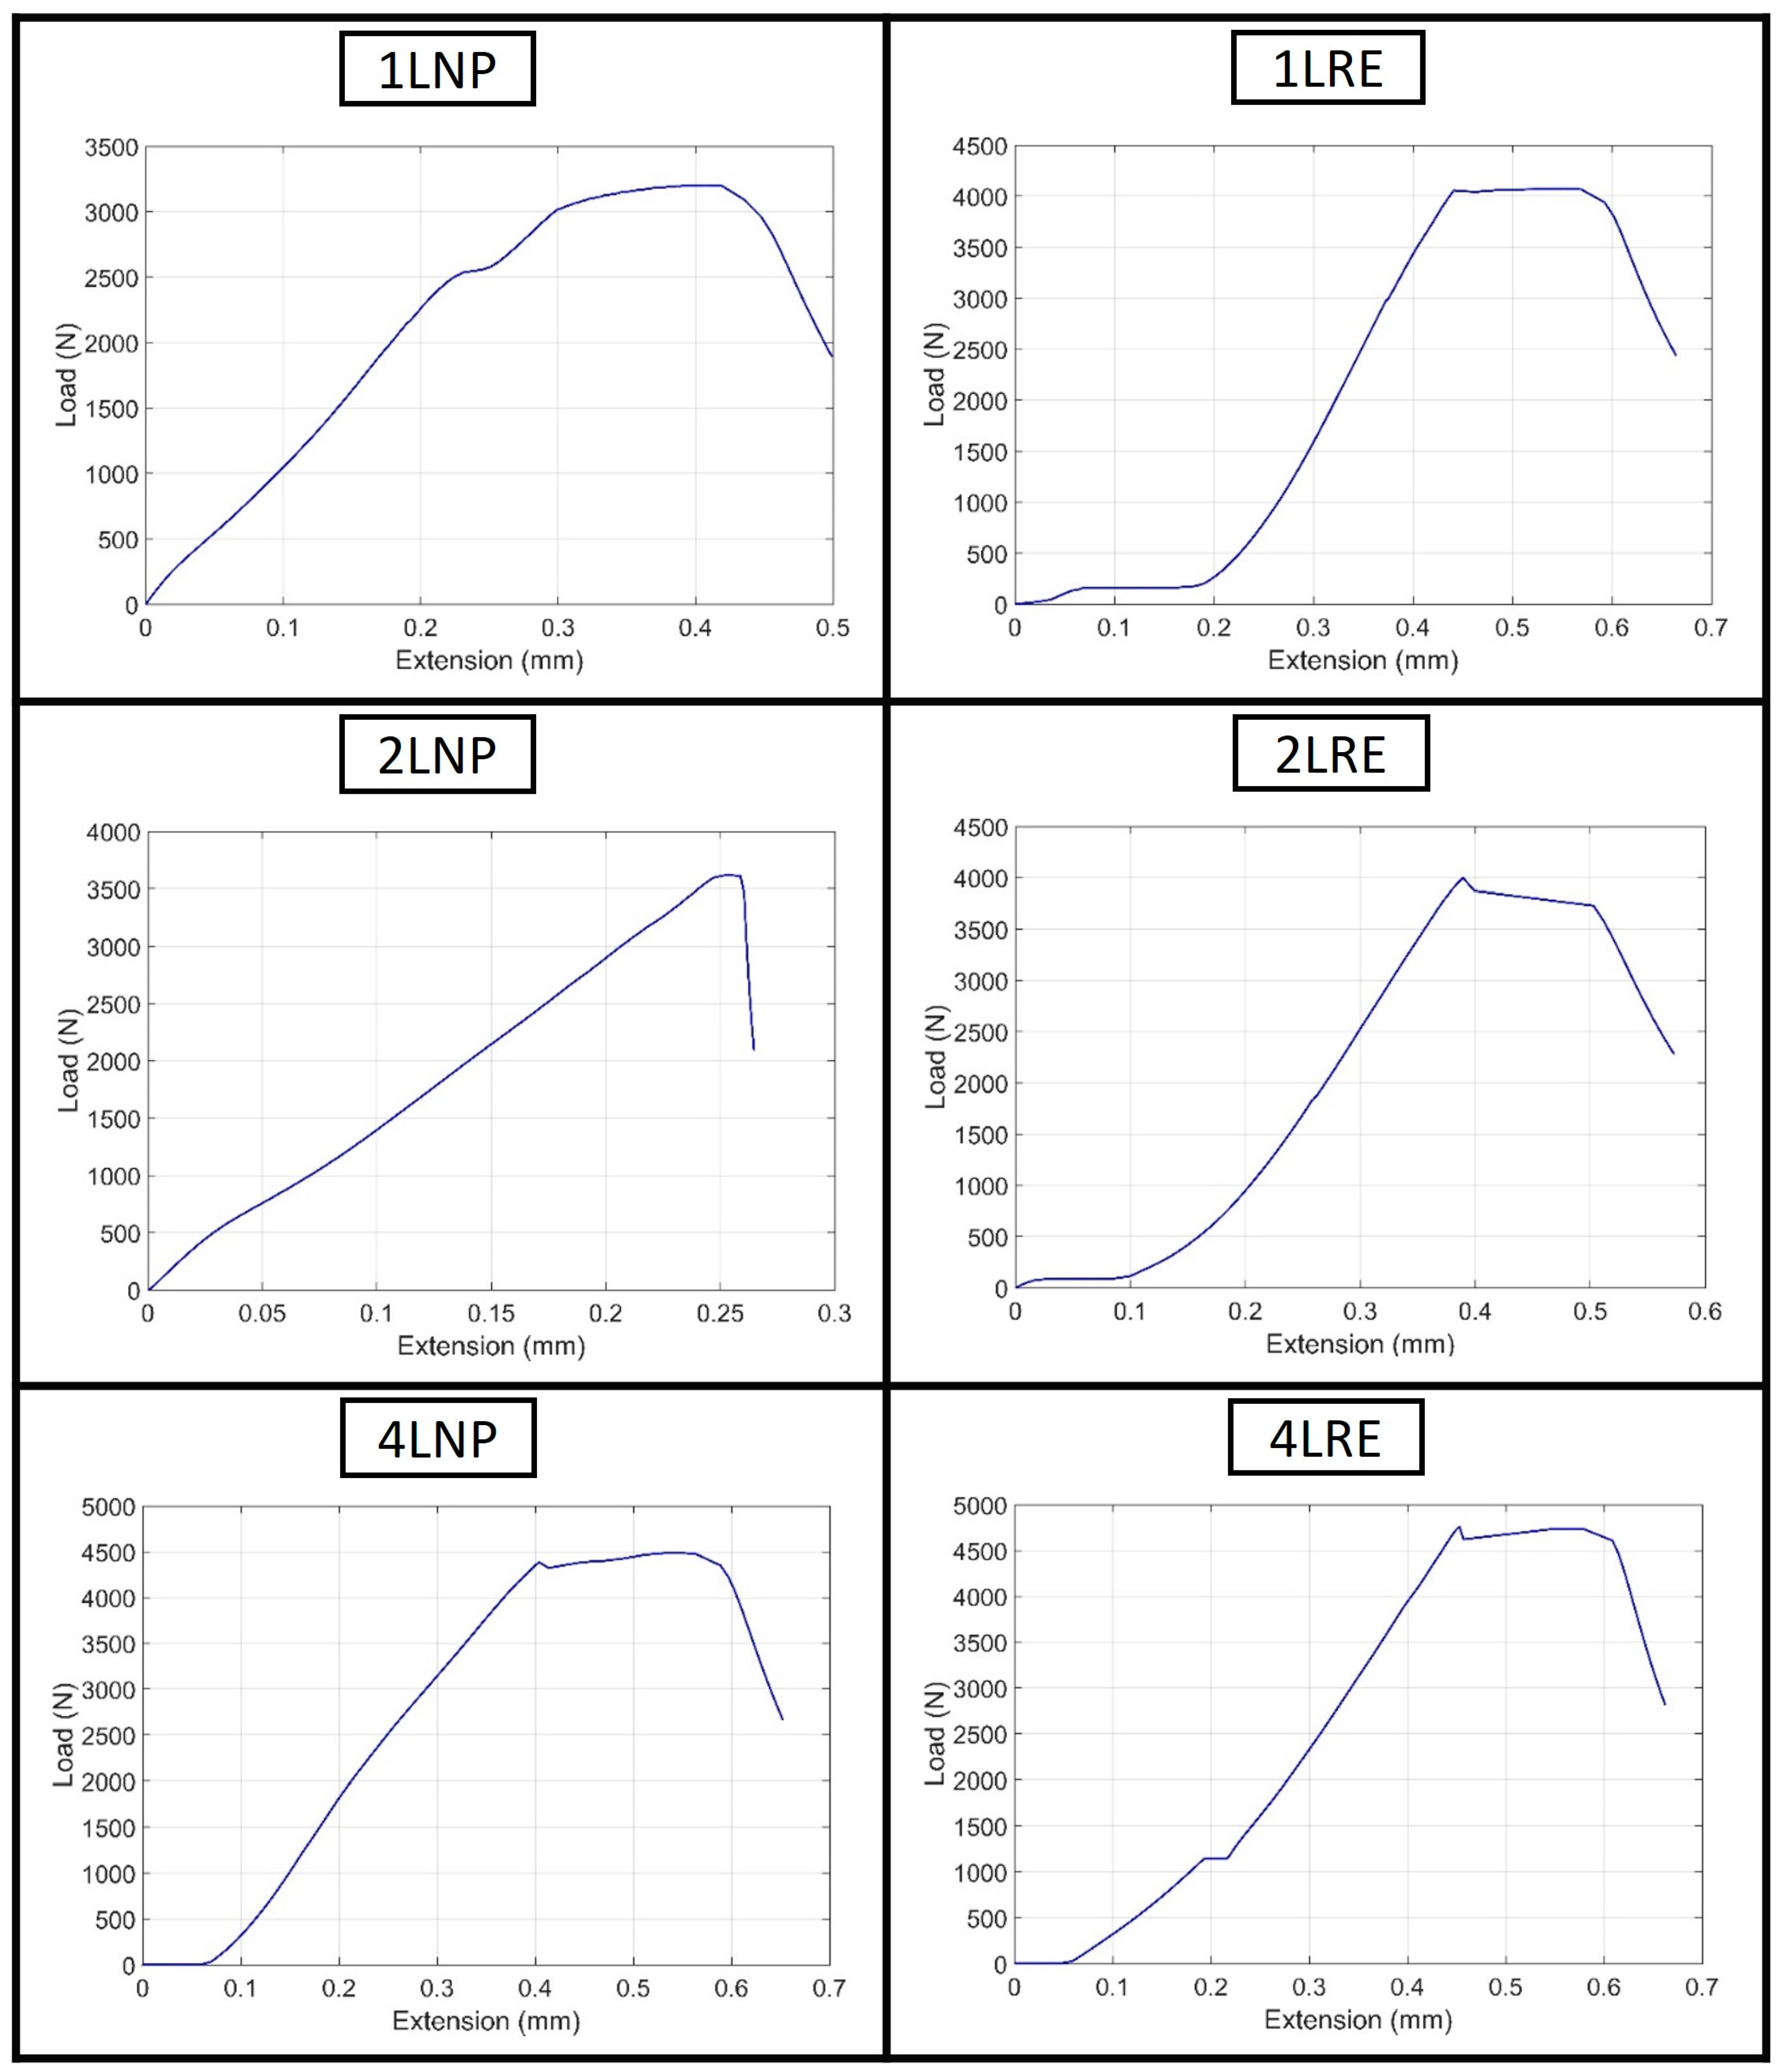
3.2. In-Situ Four-Point Bending Test

The printed samples were produced in a similar approach to the previous method. A PZT sensor was attached to the centre of each concrete sample. The aim of this experiment was to evaluate the performance variations between different coating types. Each sample was coated into one-, two-, and four-layered coating in which the resulting layer thickness was measured with a vernier calliper. Labels were assigned for each sample in this experiment (refer to Table 1); for example, one-layered Nail Polish would be named 1LNP. The concrete samples are designed in accordance with the ASTM C78/C78M Standard Test Method for Flexural Strength of Concrete, where it would be subject to a four-point bending test until failure. The EMI readings were taken in the pre-, in-, and post-process stages during the test, and the results were compared to quantify the behaviour of each coating type.
Streams of data obtained from the Impedance Analyser Agilent 4294A and the Instron 5969 were synchronized through a post-experimental process (Figure 8 and Figure 9). Compiled EMI signals containing data for all impedance magnitude (Z) and phase angle (θ) in the frequency range from 1 kHz to 1 MHz instances throughout the loading duration of the four-point bending tests were obtained (Figure 8A and Figure 9A). The load-extension graph is obtained from the Instron 5969 Universal Testing Machine (Figure 8B and Figure 9B). The EMI signal was then plotted with the load-extension graph at the same instance to contrast any signal fluctuations upon changes to the mechanical property during the four-point bending test. These are displayed in two 3D plots, namely, impedance magnitude (Z) and load against frequency range (Figure 8C and Figure 9C) and phase angle (θ) and load against frequency (Figure 8D and Figure 9D). For all graphical illustrations containing the compiled EMI signals, the initial conditions have been denoted with thick blue lines, while the failures are shown in thick red lines (Figure 8A,C,D and Figure 9A,C,D). All transient states in-between are also presented to investigate the sensitivity of the sensors with different coating layers. Lastly, the RMSD of Z and θ were computed in Figure 8E,F and Figure 9E,F. The original images can be found in Appendix A (Figure A1, Figure A2, Figure A3, Figure A4, Figure A5, Figure A6 and Figure A7).
Similar behaviour was observed between all six coating variations. Upon fracture, it is apparent that all samples recorded a shift in peak impedance magnitude and phase angle. These changes could be quantified by the RMSD graphs (E) and (F) as the RMSD values calculated for Z and θ over six samples showed a significant difference with post-fracture results as compared to all previous instances at pre-fracture. The RMSDs of the impedance magnitude post-fracture were 6.25% (1LNP), 0.79% (2LNP), 6.39% (4LNP), 1.99% (1LRE), 7.71% (2LRE), and 0.90% (4LRE) as shown in Figure (E). In Figure (F), the post-fracture RMSD phase angle was at 6.66% (1LNP), 2.04% (2LNP), 5.22% (4LNP), 26.23% (1LRE), 16.10% (2LRE), and 0.56% (4LRE). The final state (post-fracture) is proven to observe a significantly higher change of value (both Z and θ) than that of the pre-fracture states. These results reveal that the EMI technique could distinguish the difference between the pre- and post-fracture process of a 3DCP structure, where it validates that fractures can be monitored with the sensor implementation methodology.
Moreover, the RMSD values in (E) and (F) generally decrease with the increase in thickness of the coating layers. The peak load resistance values within the force-extension graph complements this trend, where a higher load resistance can be observed with larger coating thickness at approximately 3000 N (1LNP), 3500 N (2LNP), 4500 N (4LNP), 4000 N (1LRE), 4000 N (2LRE), and 4750 N (4LRE), (refer to Figure 8B and Figure 9B). For 1LNP, the electrical impedance and RMSD graphs (Figure 8D) were able to reflect the plastic regions that were exhibited in the force-extension graphs (Figure 8B). A similar observation can be observed in 1LRE to a much smaller degree. The difference in sensitivity performance is speculated to be associated with the thickness and material properties of the coating. Future work can be carried out to study and optimize the (1) sensitivity to plastic and elastic modes, and (2) the coating layer properties.
Additionally, it was also discovered that in 2LNP, a brittle behaviour was observed in the load–extension graph (Figure 8B). Further investigation revealed that the crack propagation had avoided the sensor during flexural tests (refer to Figure 10). Hence, these readings deviated from the ductile properties seen in other samples. However, this did not negatively affect the RMSD readings (refer to Figure 8C,D and Figure 9C,D), where the sensor was able to detect the fracture sustained by the host structure at ~3500 N. This infers that indirect loads and their structural stresses can be detected within an unknown range despite concerns for interruptions caused by voids present with poor interlayer bonding in C3DP. However, further studies to measure the effectiveness of locating indirect loads are needed to validate this finding for the effective range sensitivity of the embedded sensors.

4. Conclusions

Structural health monitoring provides a valuable process flow for tracking damage development, predicting performance degradation, and carrying out continuous in-situ structural safety assessments. The successful application of smart concrete technologies remains a challenge in traditional construction due to high fabrication costs and poor material life cycles. This presents an opportunity for 3DCP to develop embedded autonomous technologies that go beyond the capabilities of its construction predecessors. The layer-by-layer deposition method positions itself as a gateway to embedding sensors within the structure and easily overcomes traditional construction limitations in sensor embedment.
PZT patches can be used with an EMI technique using the electromechanical coupling between the embedded sensors and concrete structure. The change in the mechanical impedance of the host structure can be detected by via the electrical impedance of the Piezoelectric element. In this study, PZT sensors had been implanted horizontally within the layer of 3DCP structure to study the EMI technique in quantifying the mechanical behaviour of concrete subjected to varying test conditions. Different protection types and layers for PZT sensors are studied to suggest a suitable coating solution for embedded sensors in 3DCP structures. Four-point bending tests are conducted as a baseline to evaluate the effectiveness of various coating layers with an EMI technique.
The results proved that the coated sensors could detect fractures in 3DCP concrete with decreased sensitivity on thicker coating layers through the variance in materials and coating thickness in the paper. Four-point bending tests revealed that the sensor concurrently behaves as a reinforcement in the plane perpendicular to the load.
The difference in sensitivity performance is speculated to be related to the thickness and material property of the coating where future work can be carried out to optimize the robustness of this observation. Next, indirect loads and their structural stresses have been found to be detected in a range, despite concerns for interruptions caused by voids present with a poor interlayer bonding in C3DP. However, further studies to measure the effectiveness of detecting indirect loads are needed to validate this finding.
Incorporation of PZT sensors with 3DCP showed great potential to address the cost and lifecycle challenges posed in traditional construction as the insertion of PZT sensor seamlessly functions with 3DCP workflows. While the current experiment has proven that the sensor is effective in detecting failure, further developmental work can be conducted to address the sensor sensitivity to detect mechanical changes, its performance as a reinforcement, its detection range for 3DCP, and to automate the sensor installation process.

Author Contributions

Conceptualization: T.K.N.Q., T.V.K.V., Y.W.D.T. and K.H.H.L.; methodology: T.K.N.Q., T.V.K.V. and Y.W.D.T.; software: T.K.N.Q., T.V.K.V. and Y.W.D.T.; validation: T.K.N.Q., T.V.K.V. and K.H.H.L.; investigation: T.K.N.Q. and T.V.K.V.; resources: M.J.T. and T.N.W.; data curation: T.K.N.Q. and Y.W.D.T.; writing—original draft preparation: T.K.N.Q., T.V.K.V. and Y.W.D.T.; writing—review and editing: T.K.N.Q., T.V.K.V. and K.H.H.L.; visualization: T.V.K.V.; supervision: T.N.W. and K.H.H.L.; project administration: K.H.H.L.; funding acquisition: M.J.T., T.N.W. and K.H.H.L. All authors have read and agreed to the published version of the manuscript.

Funding

This work was supported by a grant from Singapore Centre for 3D Printing (SC3DP), the National Research Foundation, Prime Minister’s Office, Singapore under its Medium-Sized Centre funding scheme.

Data Availability Statement

Not applicable.

Conflicts of Interest

The authors declare no conflict of interest.

Appendix A

Figure A1. Full-sized images of 1LNP specimens from four-point bending test: (A) EMI signal; (B) stress–strain graph; (C) Z vs. frequency and force; (D) θ vs. frequency and force; (E) RMSD of Z; (F) RMSD of θ.
Electronics 12 03762 g0a1
Figure A2. Full-sized images of 2LNP specimens from four-point bending test: (A) EMI signal; (B) stress–strain graph; (C) Z vs. frequency and force; (D) θ vs. frequency and force; (E) RMSD of Z; (F) RMSD of θ.
Electronics 12 03762 g0a2
Figure A3. Full-sized images of 4LNP specimens from four-point bending test: (A) EMI signal; (B) stress–strain graph; (C) Z vs. frequency and force; (D) θ vs. frequency and force; (E) RMSD of Z; (F) RMSD of θ.
Electronics 12 03762 g0a3
Figure A4. Full-sized images of 1LRE specimens from four-point bending test: (A) EMI signal; (B) stress–strain graph; (C) Z vs. frequency and force; (D) θ vs. frequency and force; (E) RMSD of Z; (F) RMSD of θ.
Electronics 12 03762 g0a4
Figure A5. Full-sized images of 2LRE specimens from four-point bending test: (A) EMI signal; (B) stress–strain graph; (C) Z vs. frequency and force; (D) θ vs. frequency and force; (E) RMSD of Z; (F) RMSD of θ.
Electronics 12 03762 g0a5
Figure A6. Full-sized images of 4LRE specimens from four-point bending test: (A) EMI signal; (B) stress–strain graph; (C) Z vs. frequency and force; (D) θ vs. frequency and force; (E) RMSD of Z; (F) RMSD of θ.
Electronics 12 03762 g0a6
Figure A7. Load–extension graphs for all samples.
Electronics 12 03762 g0a7

References

  1. Ou, J.; Li, H. Structural health monitoring research in China: Trends and applications. In Structural Health Monitoring of Civil Infrastructure Systems; Woodhead Publishing: Sawston, UK, 2009; pp. 463–516. [Google Scholar] [CrossRef]
  2. Kocur, G.K.; Saenger, E.H.; Grosse, C.U.; Vogel, T. Time reverse modeling of acoustic emissions in a reinforced concrete beam. Ultrasonics 2016, 65, 96–104. [Google Scholar] [CrossRef] [PubMed]
  3. Bremer, K.; Wollweber, M.; Weigand, F.; Rahlves, M.; Kuhne, M.; Helbig, R.; Roth, B. Fibre Optic Sensors for the Structural Health Monitoring of Building Structures. Procedia Technol. 2016, 26, 524–529. [Google Scholar] [CrossRef]
  4. Huang, X.; Wang, P.; Zhang, S.; Zhao, X.; Zhang, Y. Structural health monitoring and material safety with multispectral technique: A review. J. Saf. Sci. Resil. 2022, 3, 48–60. [Google Scholar] [CrossRef]
  5. He, J.H.; Liu, D.P.; Chung, C.H.; Huang, H.H. Infrared Thermography Measurement for Vibration-Based Structural Health Monitoring in Low-Visibility Harsh Environments. Sensors 2020, 20, 7067. [Google Scholar] [CrossRef]
  6. Dong, Y.; Ansari, F. Non-destructive testing and evaluation (NDT/NDE) of civil structures rehabilitated using fiber reinforced polymer (FRP) composites. In Service Life Estimation and Extension of Civil Engineering Structures; Woodhead Publishing: Sawston, UK, 2011; pp. 193–222. [Google Scholar] [CrossRef]
  7. Kumar, N.S.M.R.; Barkavi, T.; Natarajan, C. Structural health monitoring: Detection of concrete flaws using ultrasonic pulse velocity. J. Build. Pathol. Rehabil. 2018, 3, 1–9. [Google Scholar] [CrossRef]
  8. Roopa, A.K.; Hunashyal, A.M.; Venkaraddiyavar, P.; Ganachari, S.V. Smart hybrid nano composite concrete embedded sensors for structural health monitoring. Mater. Today Proc. 2020, 27, 603–609. [Google Scholar] [CrossRef]
  9. Maraveas, C.; Bartzanas, T. Sensors for Structural Health Monitoring of Agricultural Structures. Sensors 2021, 21, 314. [Google Scholar] [CrossRef]
  10. Merzbacher, C.I.; Kersey, A.D.; Friebele, E.J. Fiber optic sensors in concrete structures: A review. Smart Mater. Struct. 1996, 5, 196. [Google Scholar] [CrossRef]
  11. Strangfeld, C.; Johann, S.; Bartholmai, M. Smart RFID Sensors Embedded in Building Structures for Early Damage Detection and Long-Term Monitoring. Sensors 2019, 19, 5514. [Google Scholar] [CrossRef]
  12. Kot, P.; Muradov, M.; Gkantou, M.; Kamaris, G.S.; Hashim, K.; Yeboah, D. Recent Advancements in Non-Destructive Testing Techniques for Structural Health Monitoring. Appl. Sci. 2021, 11, 2750. [Google Scholar] [CrossRef]
  13. Han, B.; Zhang, L.; Ou, J. Smart and Multifunctional Concrete toward Sustainable Infrastructures; Springer: Singapore, 2017. [Google Scholar] [CrossRef]
  14. Ubertini, F.; D’Alessandro, A. Concrete with self-sensing properties. In Eco-Efficient Repair and Rehabilitation of Concrete Infrastructures; Woodhead Publishing: Sawston, UK, 2018; pp. 501–530. [Google Scholar] [CrossRef]
  15. Kong, H.; Managing, M.; Jien, L.; Director, P. Pre-Fabricated Pre-Finished Volumetric Construction (PPVC) For Residential Projects. Available online: https://www.surbanajurong.com.cn/wp-content/uploads/2018/08/1.-PPVC-Final-_18Sep18.pdf (accessed on 26 July 2023).
  16. Ting, G.H.A.; Quah, T.K.N.; Lim, J.H.; Tay, Y.W.D.; Tan, M.J. Extrudable region parametrical study of 3D printable concrete using recycled glass concrete. J. Build. Eng. 2022, 50, 104091. [Google Scholar] [CrossRef]
  17. Geng, Z.; She, W.; Zuo, W.; Lyu, K.; Pan, H.; Zhang, Y.; Miao, C. Layer-interface properties in 3D printed concrete: Dual hierarchical structure and micromechanical characterization. Cem. Concr. Res. 2020, 138, 106220. [Google Scholar] [CrossRef]
  18. Yao, H.; Xie, Z.; Li, Z.; Huang, C.; Yuan, Q.; Zheng, X. The relationship between the rheological behavior and interlayer bonding properties of 3D printing cementitious materials with the addition of attapulgite. Constr. Build. Mater. 2022, 316, 125809. [Google Scholar] [CrossRef]
  19. Sanjayan, J.G.; Nematollahi, B.; Xia, M.; Marchment, T. Effect of surface moisture on inter-layer strength of 3D printed concrete. Constr. Build. Mater. 2018, 172, 468–475. [Google Scholar] [CrossRef]
  20. Kruger, J.; Zeranka, S.; van Zijl, G. 3D concrete printing: A lower bound analytical model for buildability performance quantification. Autom. Constr. 2019, 106, 102904. [Google Scholar] [CrossRef]
  21. Wolfs, R.J.M.; Bos, F.P.; Van Strien, E.C.F.; Salet, T.A.M. A real-time height measurement and feedback system for 3D concrete printing. In High Tech Concrete: Where Technology and Engineering Meet, Proceedings of the 2017 Fib Symposium, Maastricht, The Netherlands, 12–16 June 2017; Springer International Publishing: Berlin/Heidelberg, Germany, 2017; pp. 2474–2483. [Google Scholar] [CrossRef]
  22. Quah, T.K.N.; Tay, Y.W.D.; Lim, J.H.; Tan, M.J.; Wong, T.N.; Li, K.H.H. Concrete 3D Printing: Process Parameters for Process Control, Monitoring and Diagnosis in Automation and Construction. Mathematics 2023, 11, 1499. [Google Scholar] [CrossRef]
  23. Wolfs, R.J.M.; Bos, F.P.; Salet, T.A.M. Hardened properties of 3D printed concrete: The influence of process parameters on interlayer adhesion. Cem. Concr. Res. 2019, 119, 132–140. [Google Scholar] [CrossRef]
  24. Wang, L.; Tian, Z.; Ma, G.; Zhang, M. Interlayer bonding improvement of 3D printed concrete with polymer modified mortar: Experiments and molecular dynamics studies. Cem. Concr. Compos. 2020, 110, 103571. [Google Scholar] [CrossRef]
  25. Hosseini, E.; Zakertabrizi, M.; Korayem, A.H.; Xu, G. A novel method to enhance the interlayer bonding of 3D printing concrete: An experimental and computational investigation. Cem. Concr. Compos. 2019, 99, 112–119. [Google Scholar] [CrossRef]
  26. Marchment, T.; Sanjayan, J.; Xia, M. Method of enhancing interlayer bond strength in construction scale 3D printing with mortar by effective bond area amplification. Mater. Des. 2019, 169, 107684. [Google Scholar] [CrossRef]
  27. Suiker, A.S.J.; Wolfs, R.J.M.; Lucas, S.M.; Salet, T.A.M. Elastic buckling and plastic collapse during 3D concrete printing. Cem. Concr. Res. 2020, 135, 106016. [Google Scholar] [CrossRef]
  28. Kruger, J.; Cho, S.; Zeranka, S.; Viljoen, C.; van Zijl, G. 3D concrete printer parameter optimisation for high rate digital construction avoiding plastic collapse. Compos. B Eng. 2020, 183, 107660. [Google Scholar] [CrossRef]
  29. Martynenko, A. Computer Vision for Real-Time Control in Drying. Food Eng. Rev. 2017, 9, 91–111. [Google Scholar] [CrossRef]
  30. Kazemian, A.; Yuan, X.; Davtalab, O.; Khoshnevis, B. Computer vision for real-time extrusion quality monitoring and control in robotic construction. Autom. Constr. 2019, 101, 92–98. [Google Scholar] [CrossRef]
  31. Ma, G.; Li, Y.; Wang, L.; Zhang, J.; Li, Z. Real-time quantification of fresh and hardened mechanical property for 3D printing material by intellectualization with piezoelectric transducers. Constr. Build. Mater. 2020, 241, 117982. [Google Scholar] [CrossRef]
  32. Barjuei, E.S.; Courteille, E.; Rangeard, D.; Marie, F.; Perrot, A. Real-time vision-based control of industrial manipulators for layer-width setting in concrete 3D printing applications. Adv. Ind. Manuf. Eng. 2022, 5, 100094. [Google Scholar] [CrossRef]
  33. Zhang, C.; Yan, Q.; Panda, G.P.; Wu, W.; Song, G.; Vipulanandan, C. Real-time monitoring stiffness degradation of hardened cement paste under uniaxial compression loading through piezoceramic-based electromechanical impedance method. Constr. Build. Mater. 2020, 256, 119395. [Google Scholar] [CrossRef]
  34. Kocherla, A.; Kamakshi, T.A.; Subramaniam, K.V.L. In situ embedded PZT sensor for monitoring 3D concrete printing: Application in alkali-activated fly ash-slag geopolymers. Smart Mater. Struct. 2021, 30, 125024. [Google Scholar] [CrossRef]
  35. Vlachakis, C.; Mcalorum, J.; Perry, M. 3D printed cement-based repairs and strain sensors. Autom. Constr. 2022, 137, 104202. [Google Scholar] [CrossRef]
  36. Ren, H.; Yang, X.; Wang, Z.; Xu, X.; Wang, R.; Ge, Q.; Xiong, Y. Smart structures with embedded flexible sensors fabricated by fused deposition modeling-based multimaterial 3D printing. Int. J. Smart Nano Mater. 2022, 13, 447–464. [Google Scholar] [CrossRef]
  37. Ma, G.; Buswell, R.; da Silva, W.R.L.; Wang, L.; Xu, J.; Jones, S.Z. Technology readiness: A global snapshot of 3D concrete printing and the frontiers for development. Cem. Concr. Res. 2022, 156, 106774. [Google Scholar] [CrossRef]
  38. Ai, D.; Zhu, H.; Luo, H.; Wang, C. Mechanical impedance based embedded piezoelectric transducer for reinforced concrete structural impact damage detection: A comparative study. Constr. Build. Mater. 2018, 165, 472–483. [Google Scholar] [CrossRef]
  39. Liu, P.; Wang, W.; Chen, Y.; Feng, X.; Miao, L. Concrete damage diagnosis using electromechanical impedance technique. Constr. Build. Mater. 2017, 136, 450–455. [Google Scholar] [CrossRef]
  40. Huo, L.; Chen, D.; Liang, Y.; Li, H.; Feng, X.; Song, G. Impedance based bolt pre-load monitoring using piezoceramic smart washer. Smart Mater. Struct. 2017, 26, 057004. [Google Scholar] [CrossRef]
  41. Ai, D.; Zhu, H.; Luo, H.; Yang, J. An effective electromechanical impedance technique for steel structural health monitoring. Constr. Build. Mater. 2014, 73, 97–104. [Google Scholar] [CrossRef]
  42. Gayakwad, H.; Thiyagarajan, J.S. Structural Damage Detection through EMI and Wave Propagation Techniques Using Embedded PZT Smart Sensing Units. Sensors 2022, 22, 2296. [Google Scholar] [CrossRef]
  43. Moelich, G.M.; Kruger, P.J.; Combrinck, R. A plastic shrinkage cracking risk model for 3D printed concrete exposed to different environments. Cem. Concr. Compos. 2022, 130, 104516. [Google Scholar] [CrossRef]
  44. Qi, C.; Weiss, J.; Olek, J. Characterization of plastic shrinkage cracking in fiber reinforced concrete using image analysis and a modified Weibull function. Mater. Struct. 2003, 36, 386–395. [Google Scholar] [CrossRef]
  45. Negi, P.; Chakraborty, T.; Kaur, N.; Bhalla, S. Investigations on effectiveness of embedded PZT patches at varying orientations for monitoring concrete hydration using EMI technique. Constr. Build. Mater. 2018, 169, 489–498. [Google Scholar] [CrossRef]
  46. Cai, J.; Peng, Z.; Zhao, R.; Xu, A.; Zhou, X. The Influence of Slag/Fly Ash Ratio and Sodium Silicate Modulus on the Properties of 1-3-2 Alkali-Based Piezoelectric Composite. Materials 2022, 15, 1150. [Google Scholar] [CrossRef]
  47. Shin, S.W.; Qureshi, A.R.; Lee, J.Y.; Yun, C.B. Piezoelectric sensor based nondestructive active monitoring of strength gain in concrete. Smart Mater. Struct. 2008, 17, 055002. [Google Scholar] [CrossRef]
  48. Murata. Piezoelectric Sound Components. Available online: https://www.farnell.com/datasheets/9058.pdf (accessed on 30 July 2022).
  49. C78/C78M Standard Test Method for Flexural Strength of Concrete (Using Simple Beam with Third-Point Loading). Available online: https://www.astm.org/c0078_c0078m-18.html (accessed on 24 August 2023).
  50. Cooney, T.G.; Francis, L.F. Processing of sol-gel derived PZT coatings on non-planar substrates. J. Micromechanics Microengineering 1996, 6, 291–300. [Google Scholar] [CrossRef]
  51. Su, Y.-F.; Han, G.; Kong, Z.; Nantung, T.; Lu, N. Embeddable Piezoelectric Sensors for Strength Gain Monitoring of Cementitious Materials: The Influence of Coating Materials. Eng. Sci. 2020, 11, 66–75. [Google Scholar] [CrossRef]
  52. Xi, X.; Chung, D.D.L. Effect of nickel coating on the stress-dependent electric permittivity, piezoelectricity and piezoresistivity of carbon fiber, with relevance to stress self-sensing. Carbon 2019, 145, 401–410. [Google Scholar] [CrossRef]
Figure 1. PZT patches are embedded in the casted concrete in different orientations to study their EMI response for concrete SHM. (a) shows the internal layout of the sensors, and (b) shows the wired connection with beam reinforcement attachment (permission to re-use from [45]).
Electronics 12 03762 g001
Figure 2. Schematic of the Electromechanical impedance measurement of the embedded Piezoelectric sensor in a 3D printed concrete specimen.
Electronics 12 03762 g002
Figure 3. Diagram of the 3D printing setup.
Electronics 12 03762 g003
Figure 4. Four-point bending test setup.
Electronics 12 03762 g004
Figure 5. Printed sample is 600 mm (L) × 60 mm (B) × 60 mm (H) with four printed layers. The PZT sensors are embedded on the second layer in the concrete slab (top image), and the concrete slab with embedded sensors (bottom image). The sensor position left to right: nail polish (NP) at 0.9 mm thickness, resin epoxy (RE) at 2 mm thickness, epoxy glue (EG) at 10 mm thickness.
Electronics 12 03762 g005
Figure 6. Electrical impedance signals from the PZT sensor before and after coating.
Electronics 12 03762 g006
Figure 7. EMI signals from embedded Piezoelectric sensors in 3D printed concrete specimens for different coating types: Nail Polish (NP), epoxy resin (RE), and epoxy glue (EG).
Electronics 12 03762 g007
Figure 8. Compiled graphs for 1LNP, 2LNP, and 4LNP.
Electronics 12 03762 g008
Figure 9. Compiled graphs for 1LRE, 2LRE, and 4LRE.
Electronics 12 03762 g009
Figure 10. Crack propagation from the sensor position in all samples.
Electronics 12 03762 g010
Table 1. Summary of samples for the four-point bending test.
Test SampleTotal Thickness
(PZT and Coating Layers)
Name
Nail Polish1 Layer0.9 mm1LNP
2 Layers1.0 mm2LNP
4 Layers1.2 mm4LNP
Epoxy resin1 Layer2.5 mm1LRE
2 Layers3.4 mm2LRE
4 Layers5.7 mm4LRE
Disclaimer/Publisher’s Note: The statements, opinions and data contained in all publications are solely those of the individual author(s) and contributor(s) and not of MDPI and/or the editor(s). MDPI and/or the editor(s) disclaim responsibility for any injury to people or property resulting from any ideas, methods, instructions or products referred to in the content.

