
Exploring User Engagement in Museum Scenario with EEG—A Case Study in MAV Craftsmanship Museum in Valle d’Aosta Region, Italy

 ,
,  ,
,  ,
,  ,
,  , ,
, ,  and
and 
Abstract
:1. Introduction
2. Materials and Methods
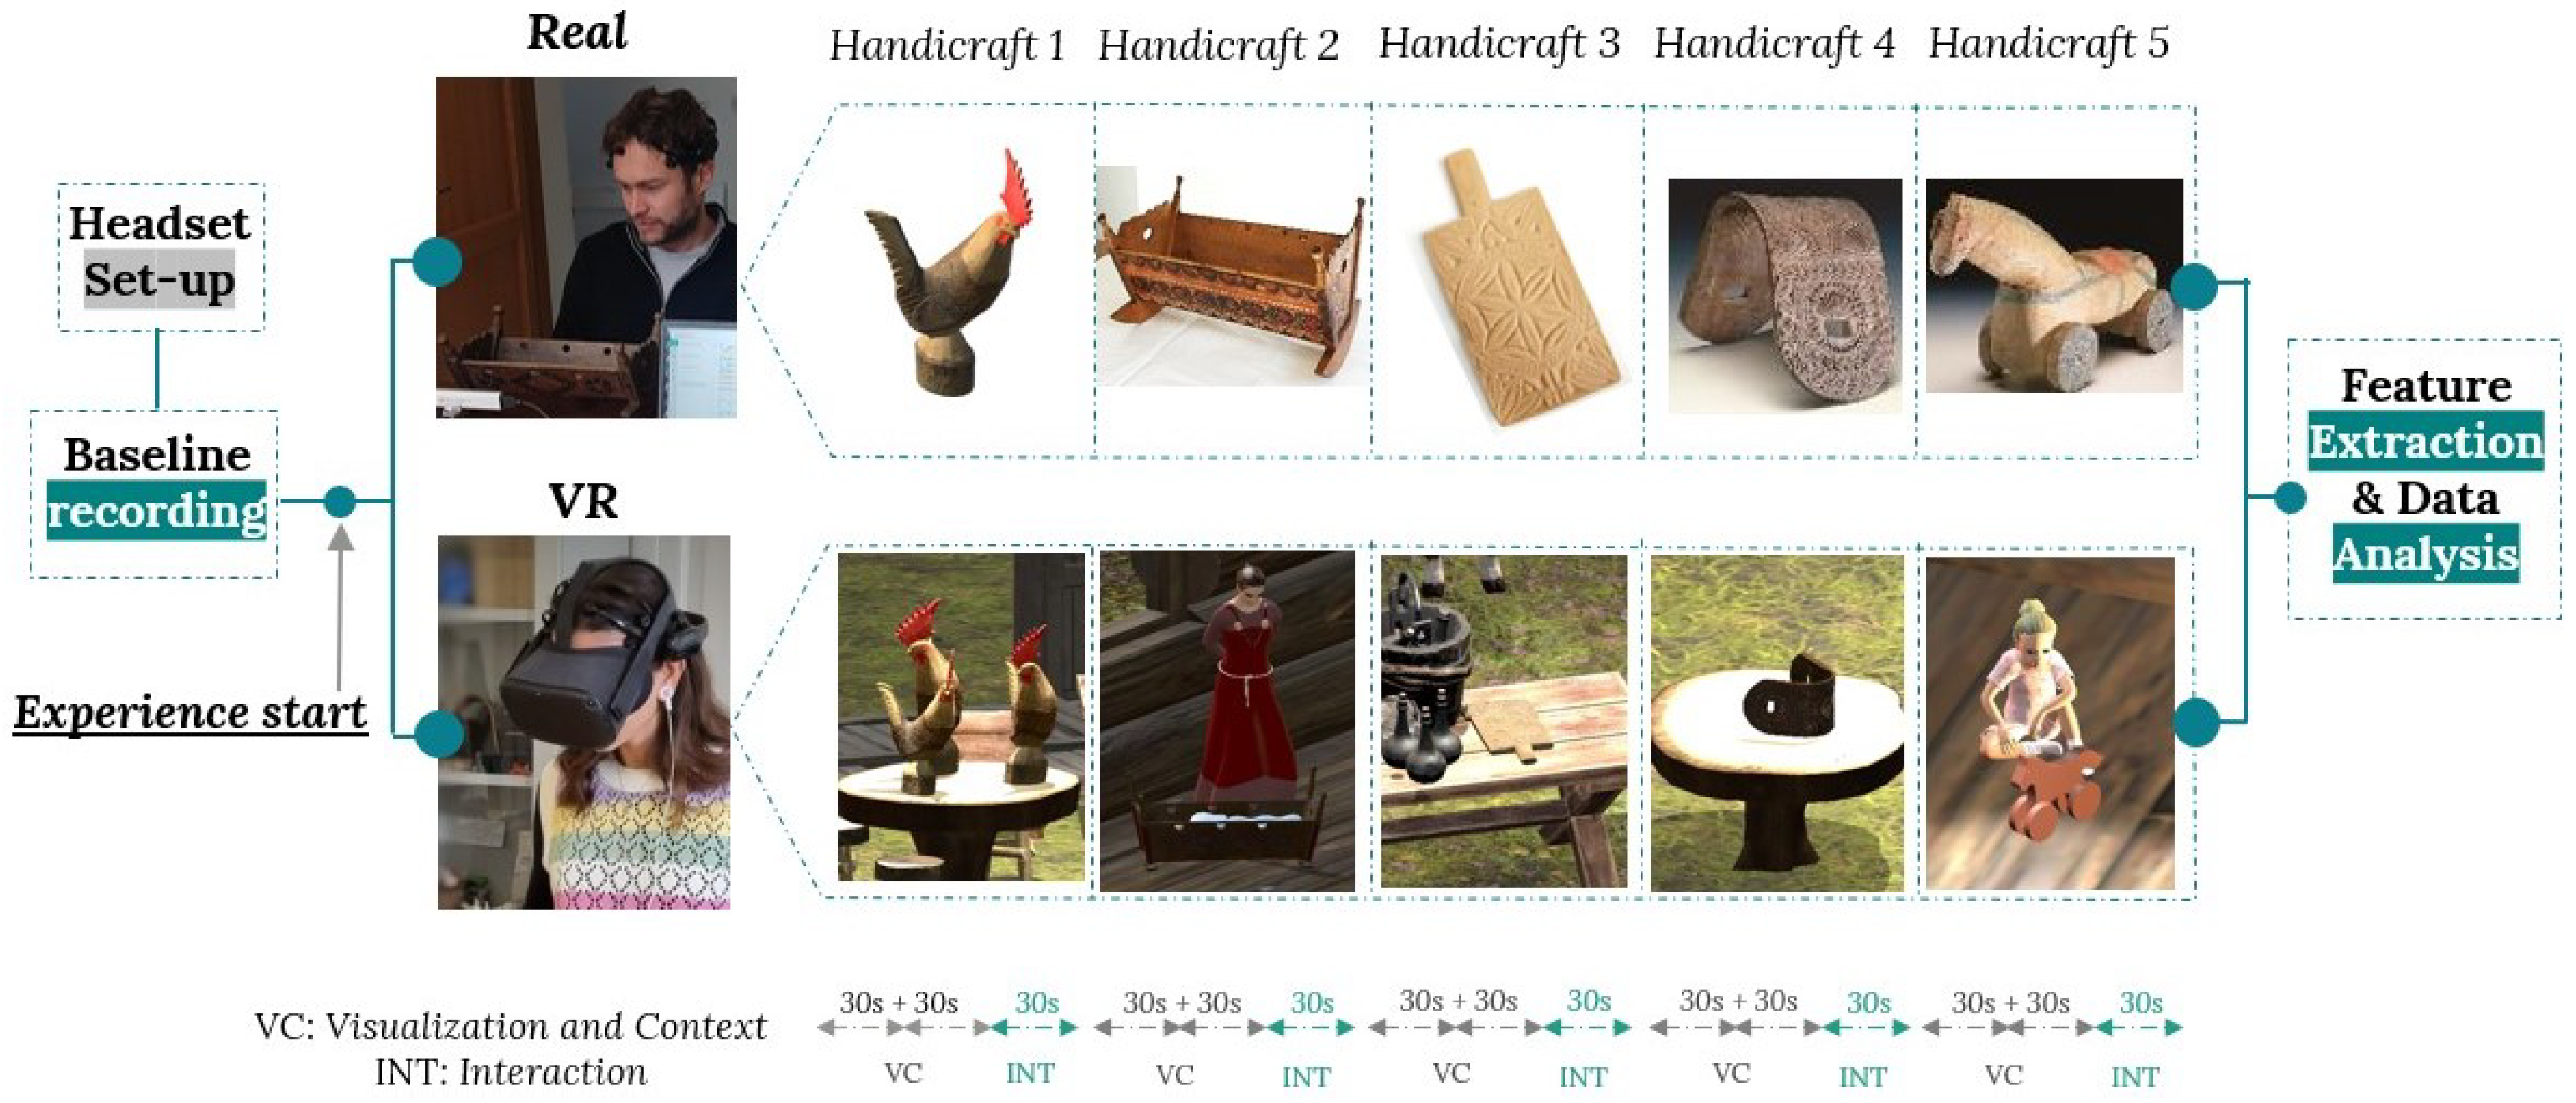
2.1. Description of the Experiment
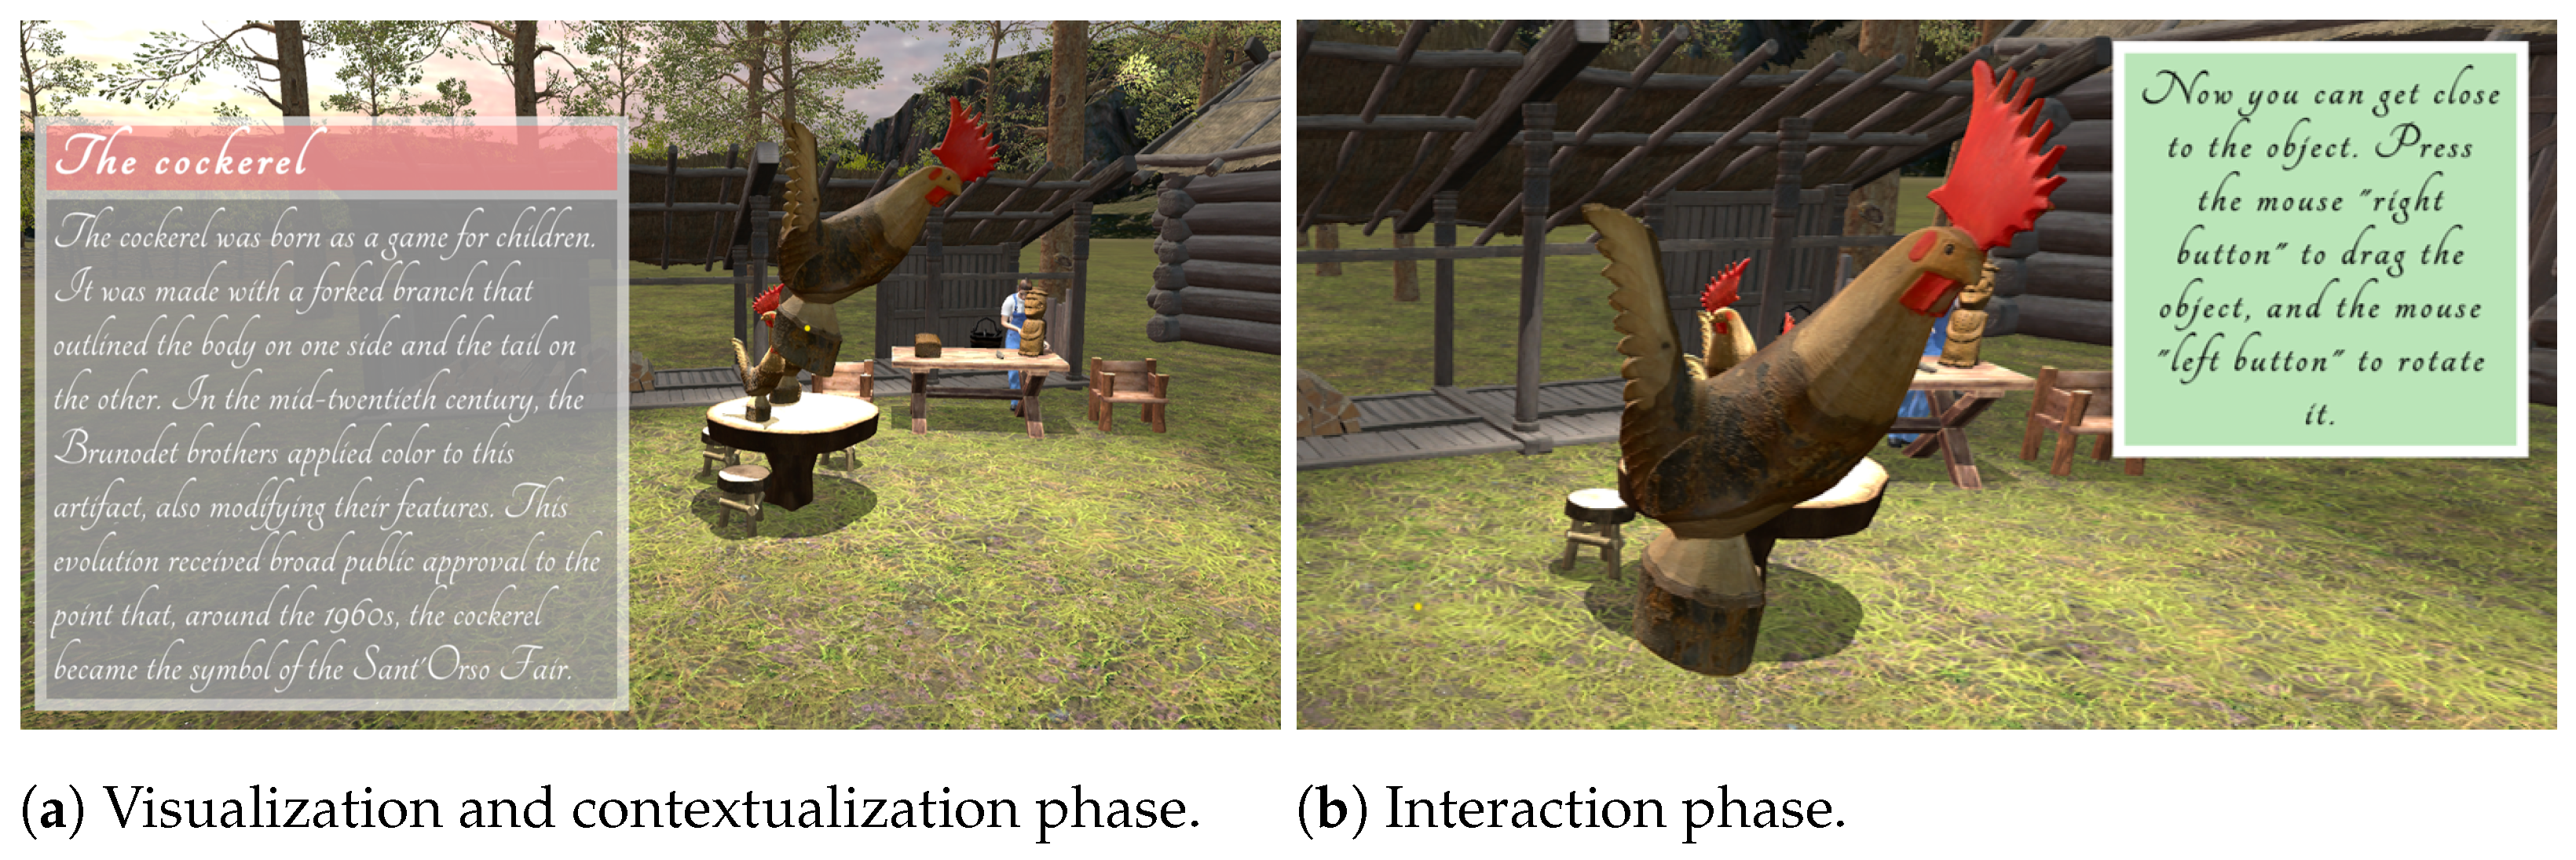
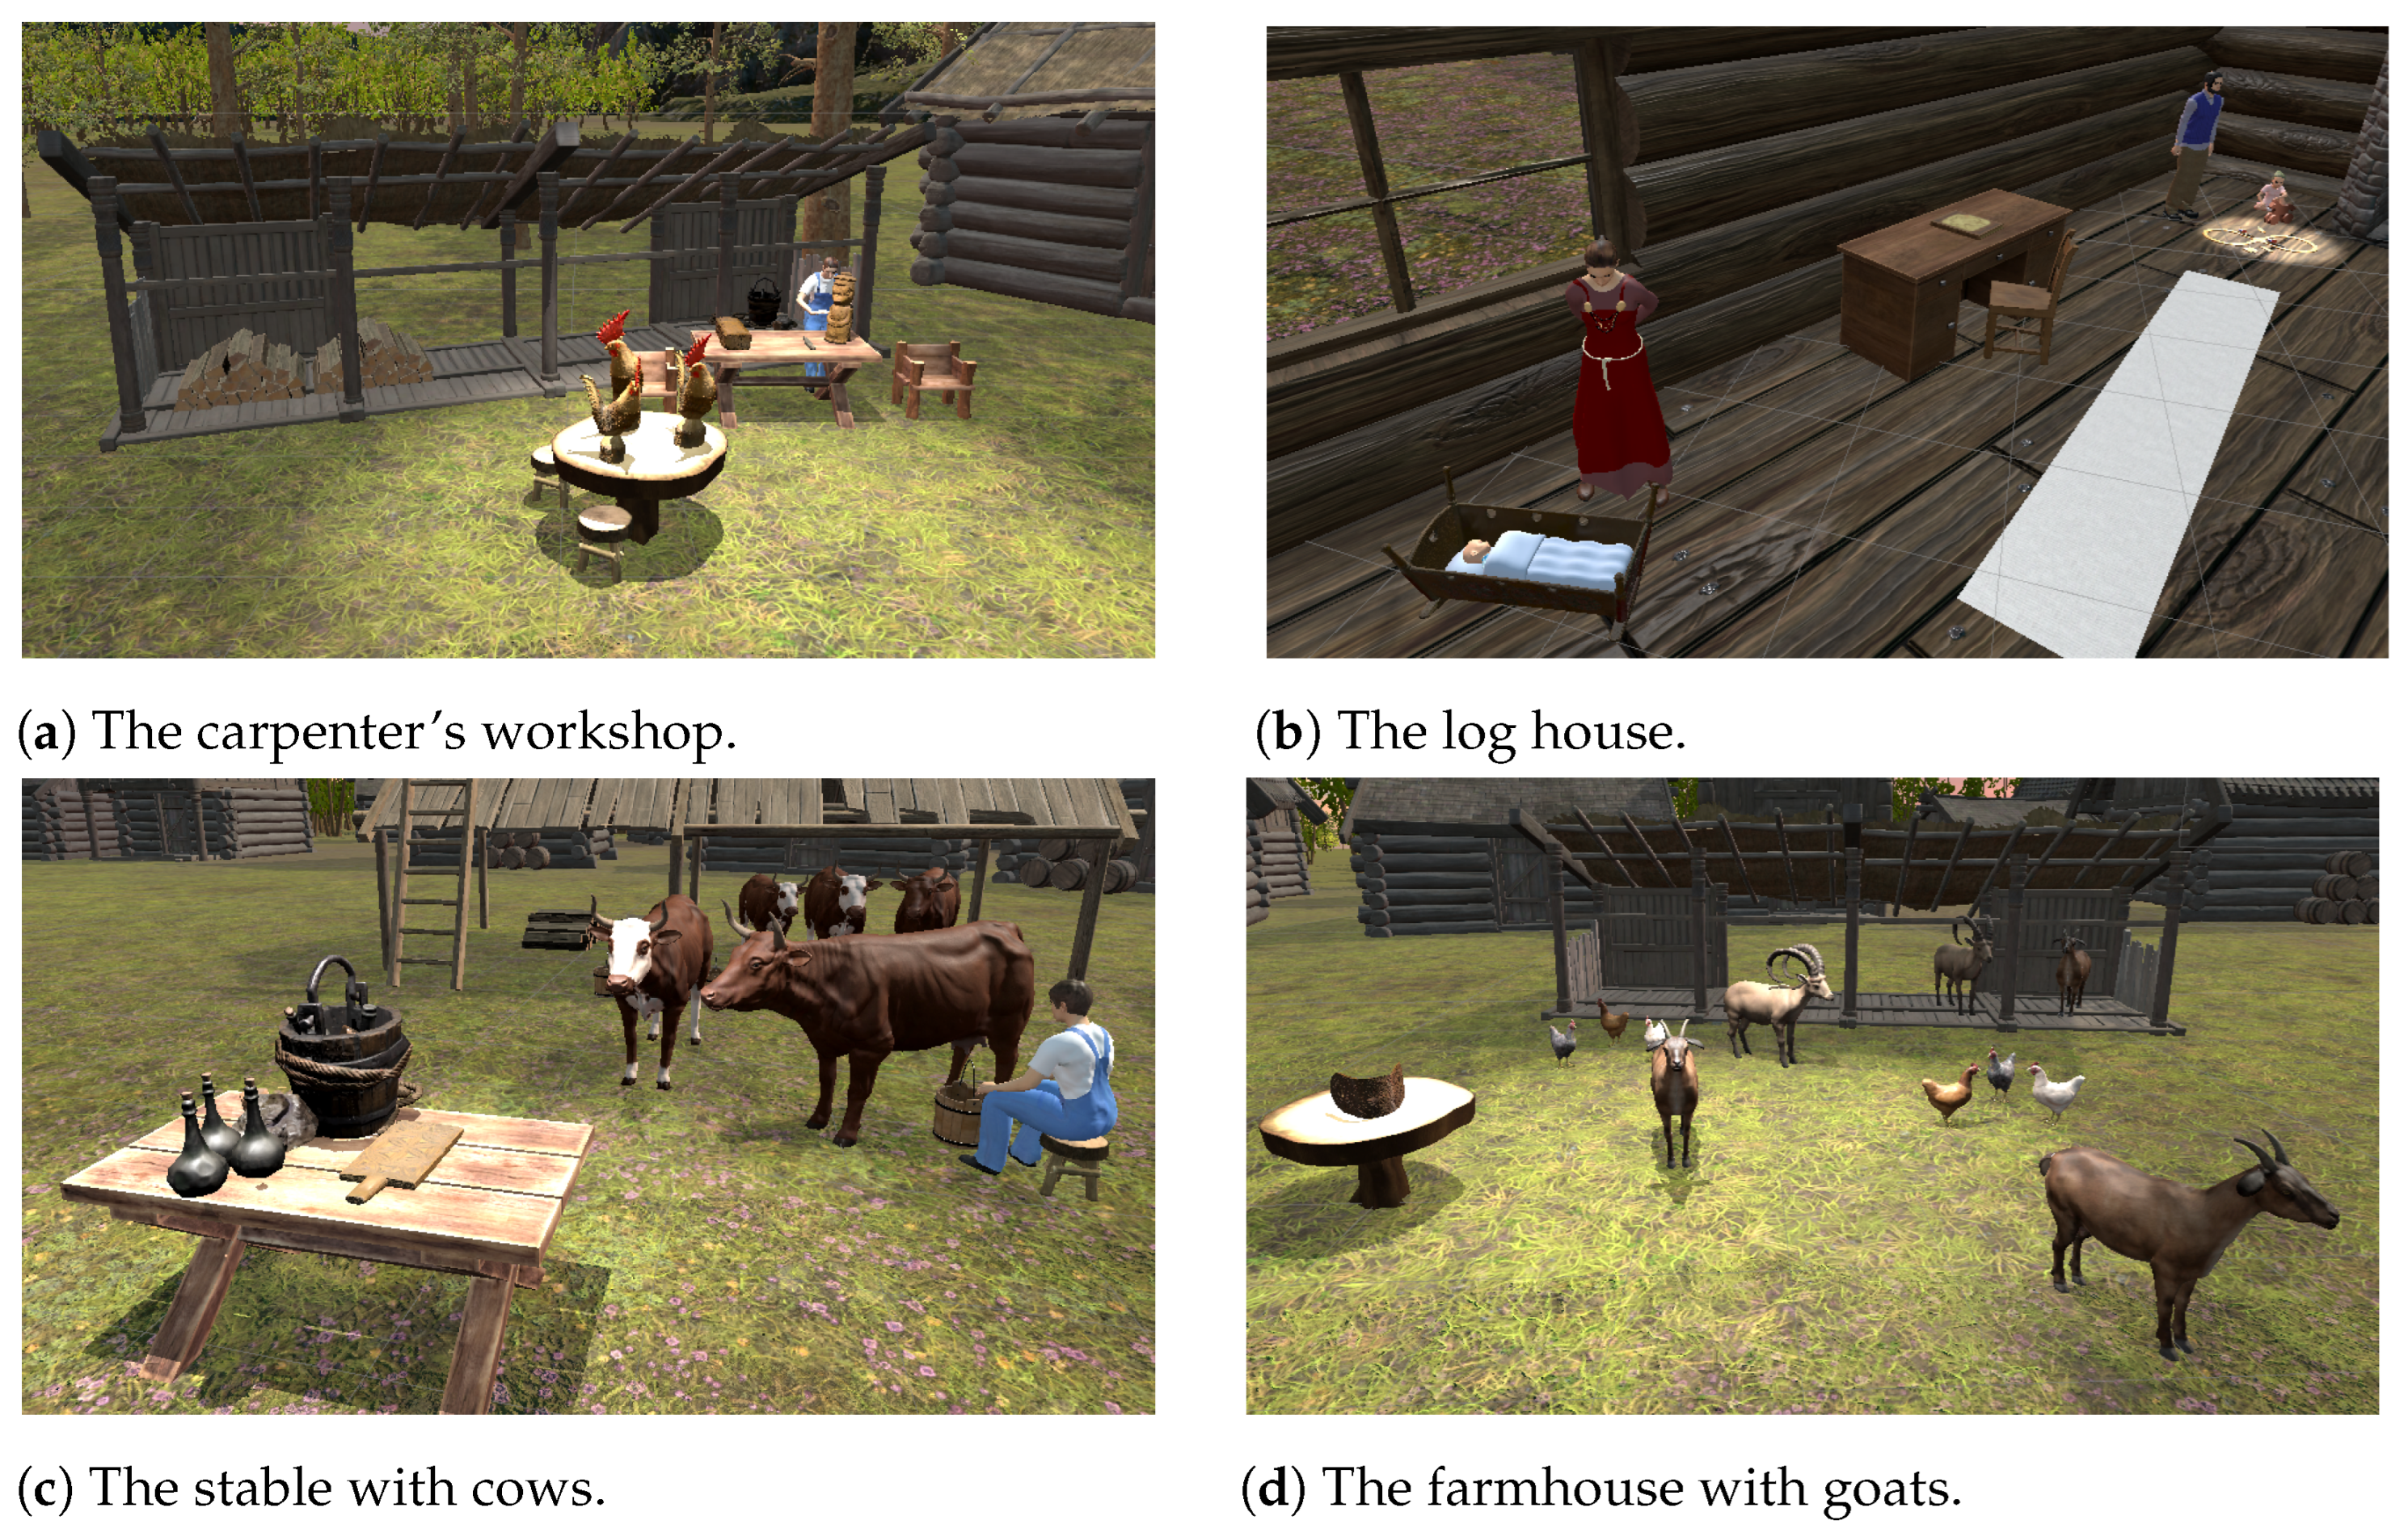
- The cockerel: born as a game for children, it was made with a forked tree branch that outlined the body on one side and the tail on the other. After applying the color to this artifact, its evolution received widespread public approval, and the cockerel became the symbol of craftsmanship in the Valle d’Aosta region;
- The crib: handed down from generation to generation, the cradle was given as a gift by the godparents to the unborn child and used on the day of baptism. It was decorated with geometric carvings such as rosettes and religious elements, offering indications about its provenance;
- The butter press: the various types of butter presses tell how a simple object can differentiate itself between the side valleys and within the municipalities of a small region, undergoing modifications in both its symbolic representation (whether natural or heraldic) and construction techniques (including elements affixed with nails rather than carved);
- The goat collar: it consists of a sheet of wood folded by immersion in boiling water to create the appropriate curvature to be worn by goats. Once folded, the foil was tied at the ends and left to dry. Following this, the skilled artisans move on to the intaglio decoration, incorporating colored elements;
- The ‘tatà’: it is a carved wooden horse with wheels. Its name derives from a childish onomatopoeic expression indicating the noise the wheels make when dragged along the ground.
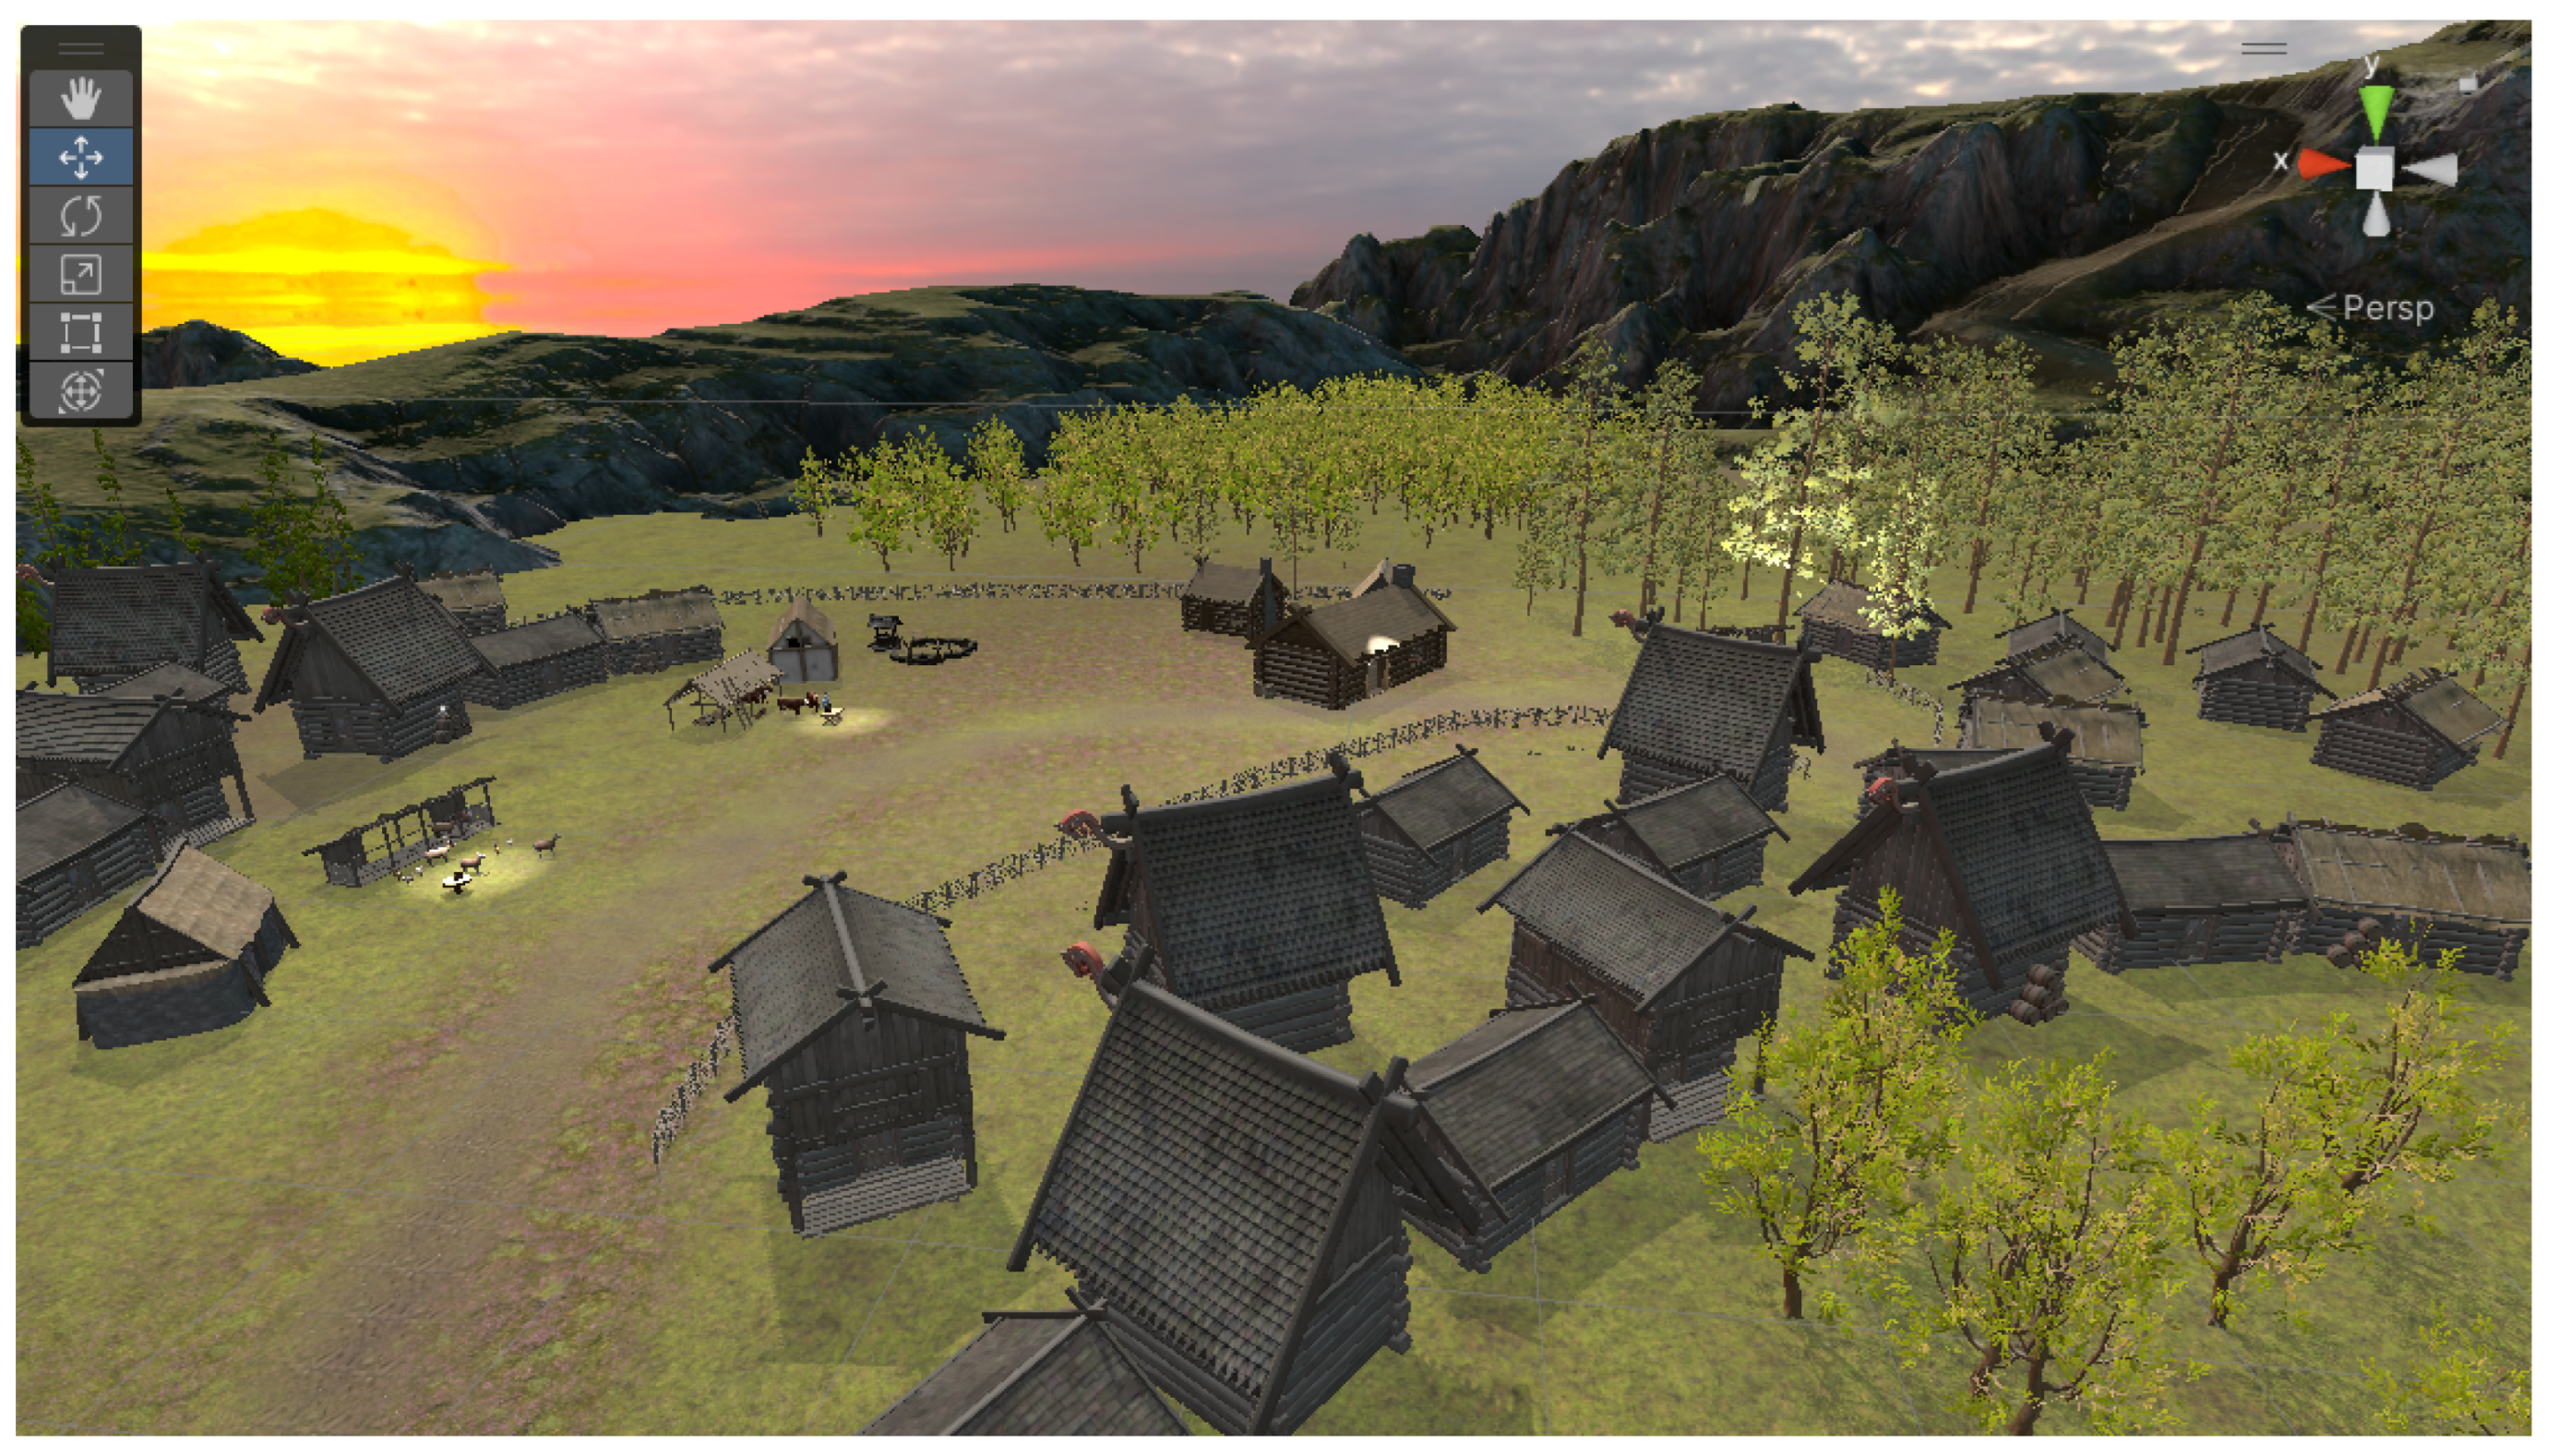
2.2. VR Environment
2.3. Participants
- EXP1 involved 33 participants (21 women and 12 men);
- EXP2 involved 62 participants (31 women and 31 men).
2.4. Questionnaire
2.5. EEG Affective Monitoring
2.6. XGBoost for Engagement Classification
3. Results
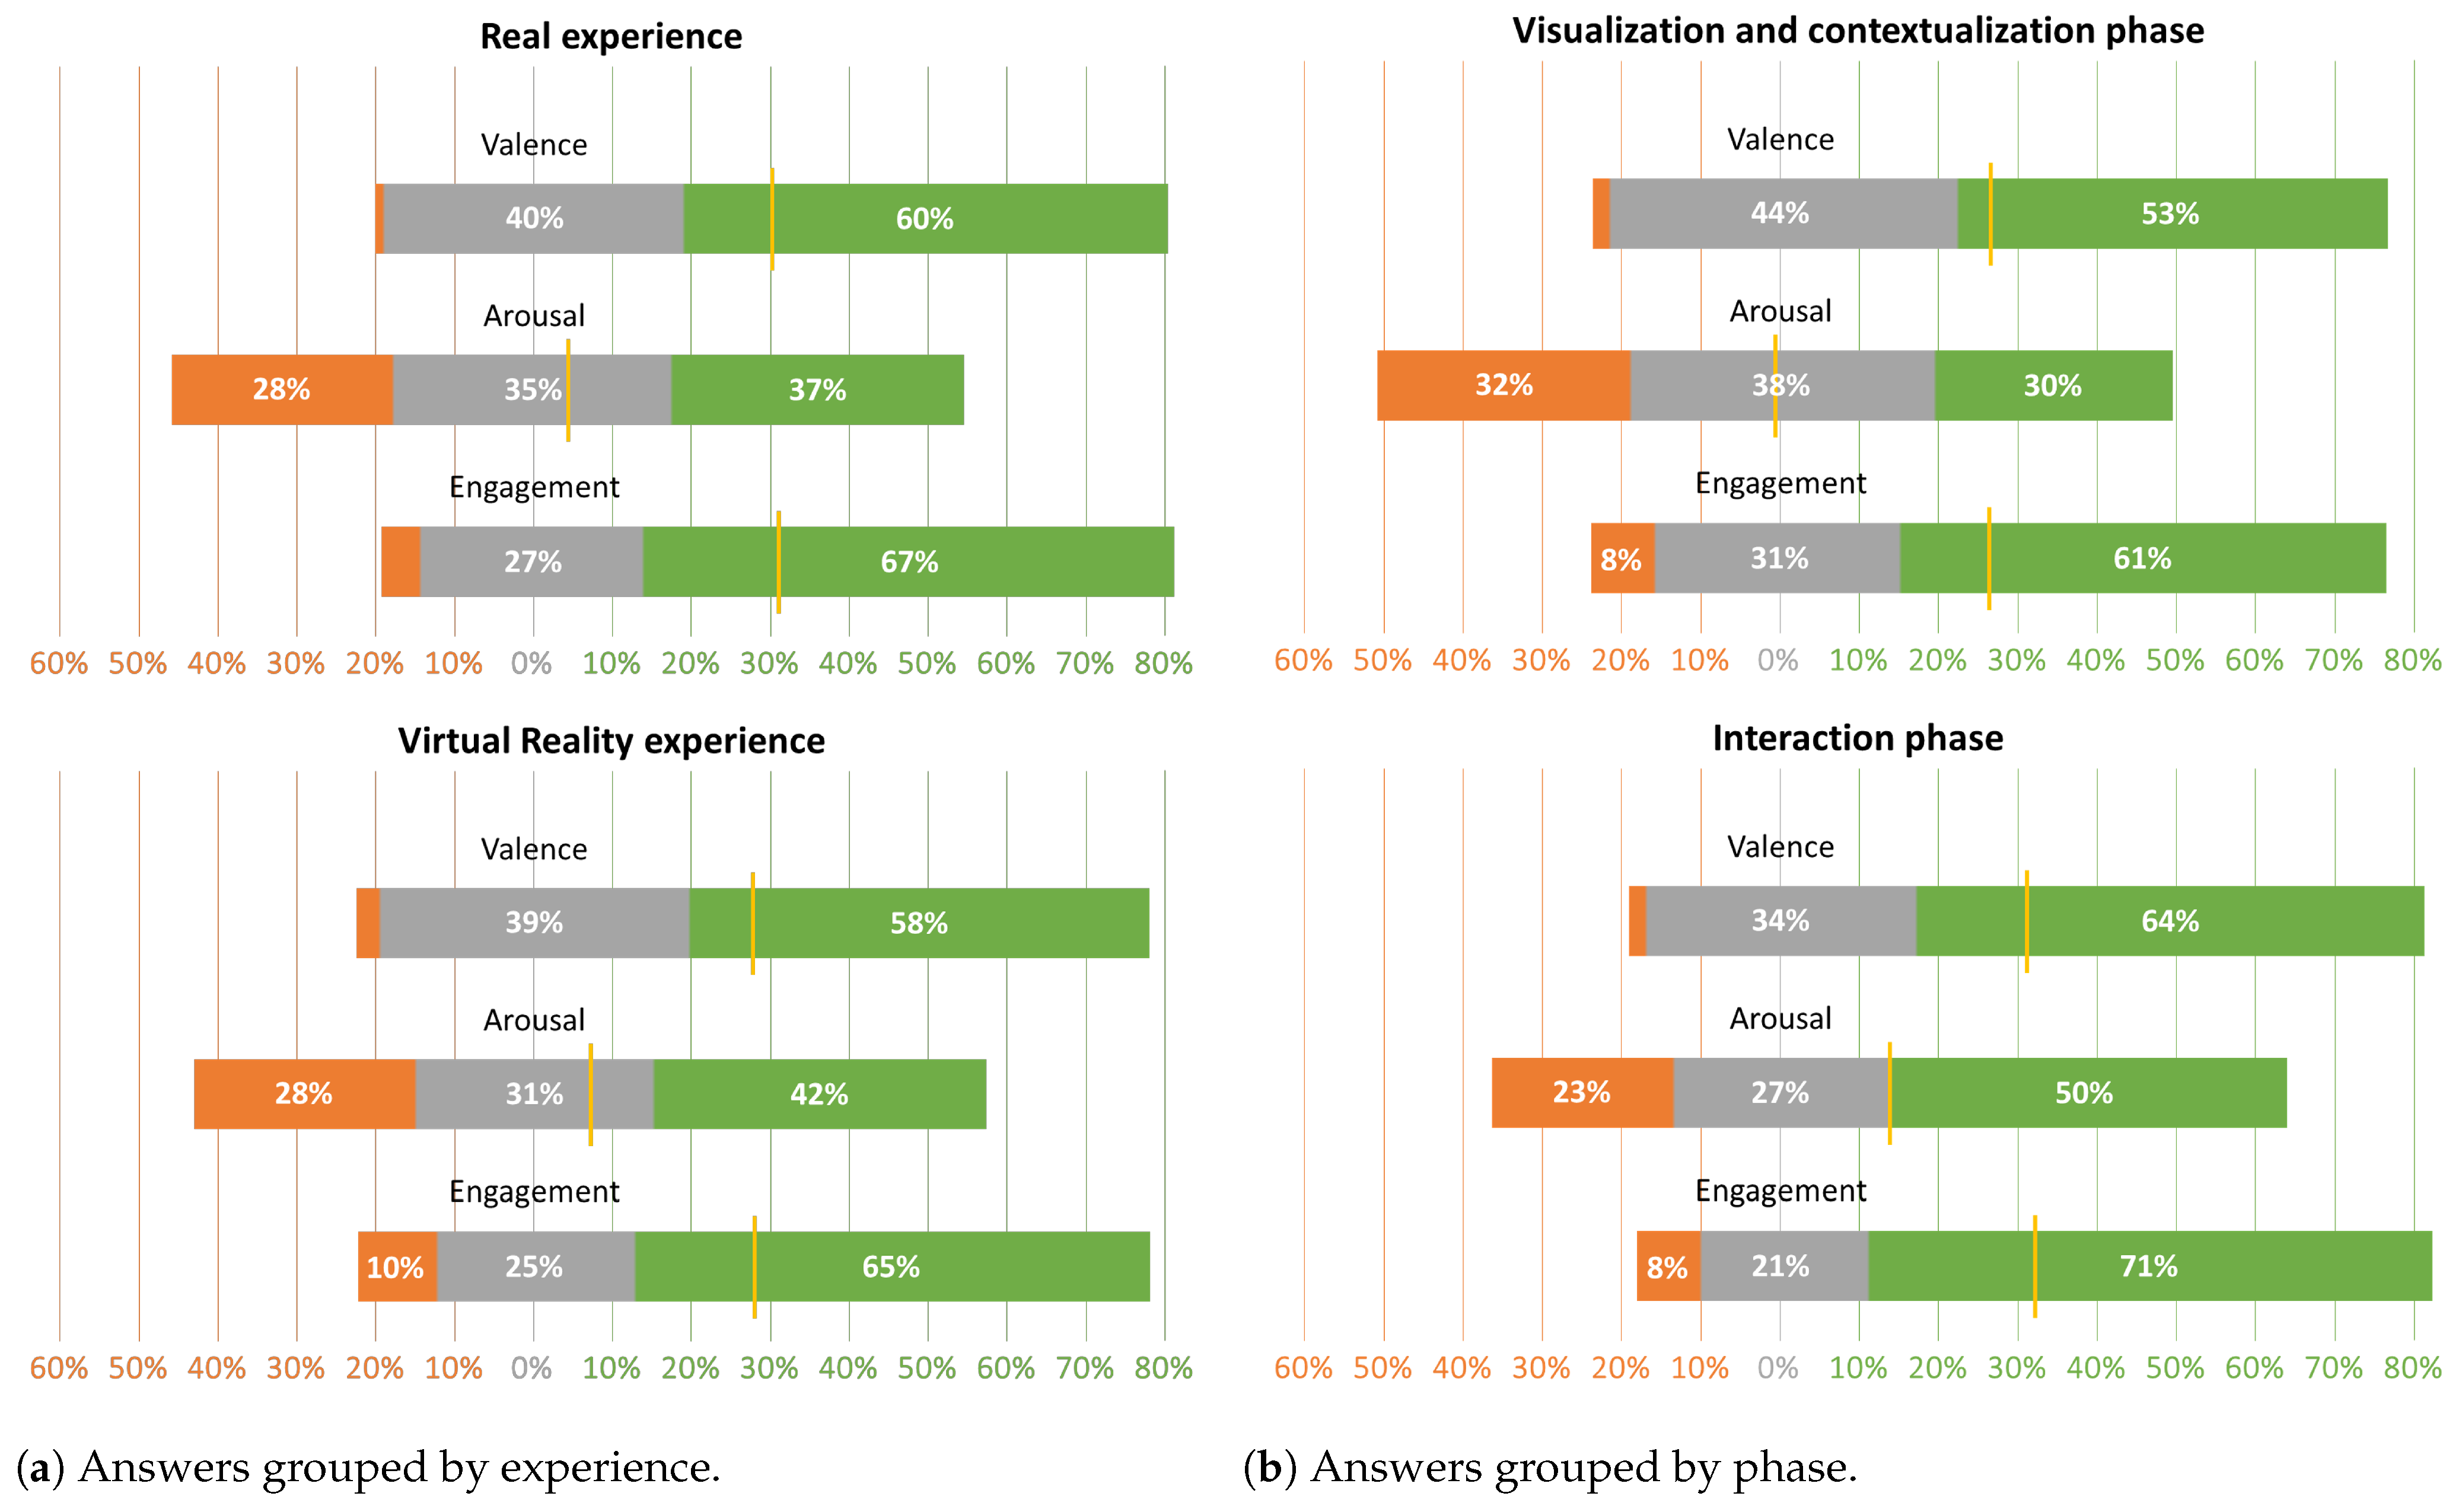
3.1. Questionnaire
- Experience, to analyze differences between the real experience and the VR experience;
- Phase, to analyze differences between the degrees of involvement with the objects.
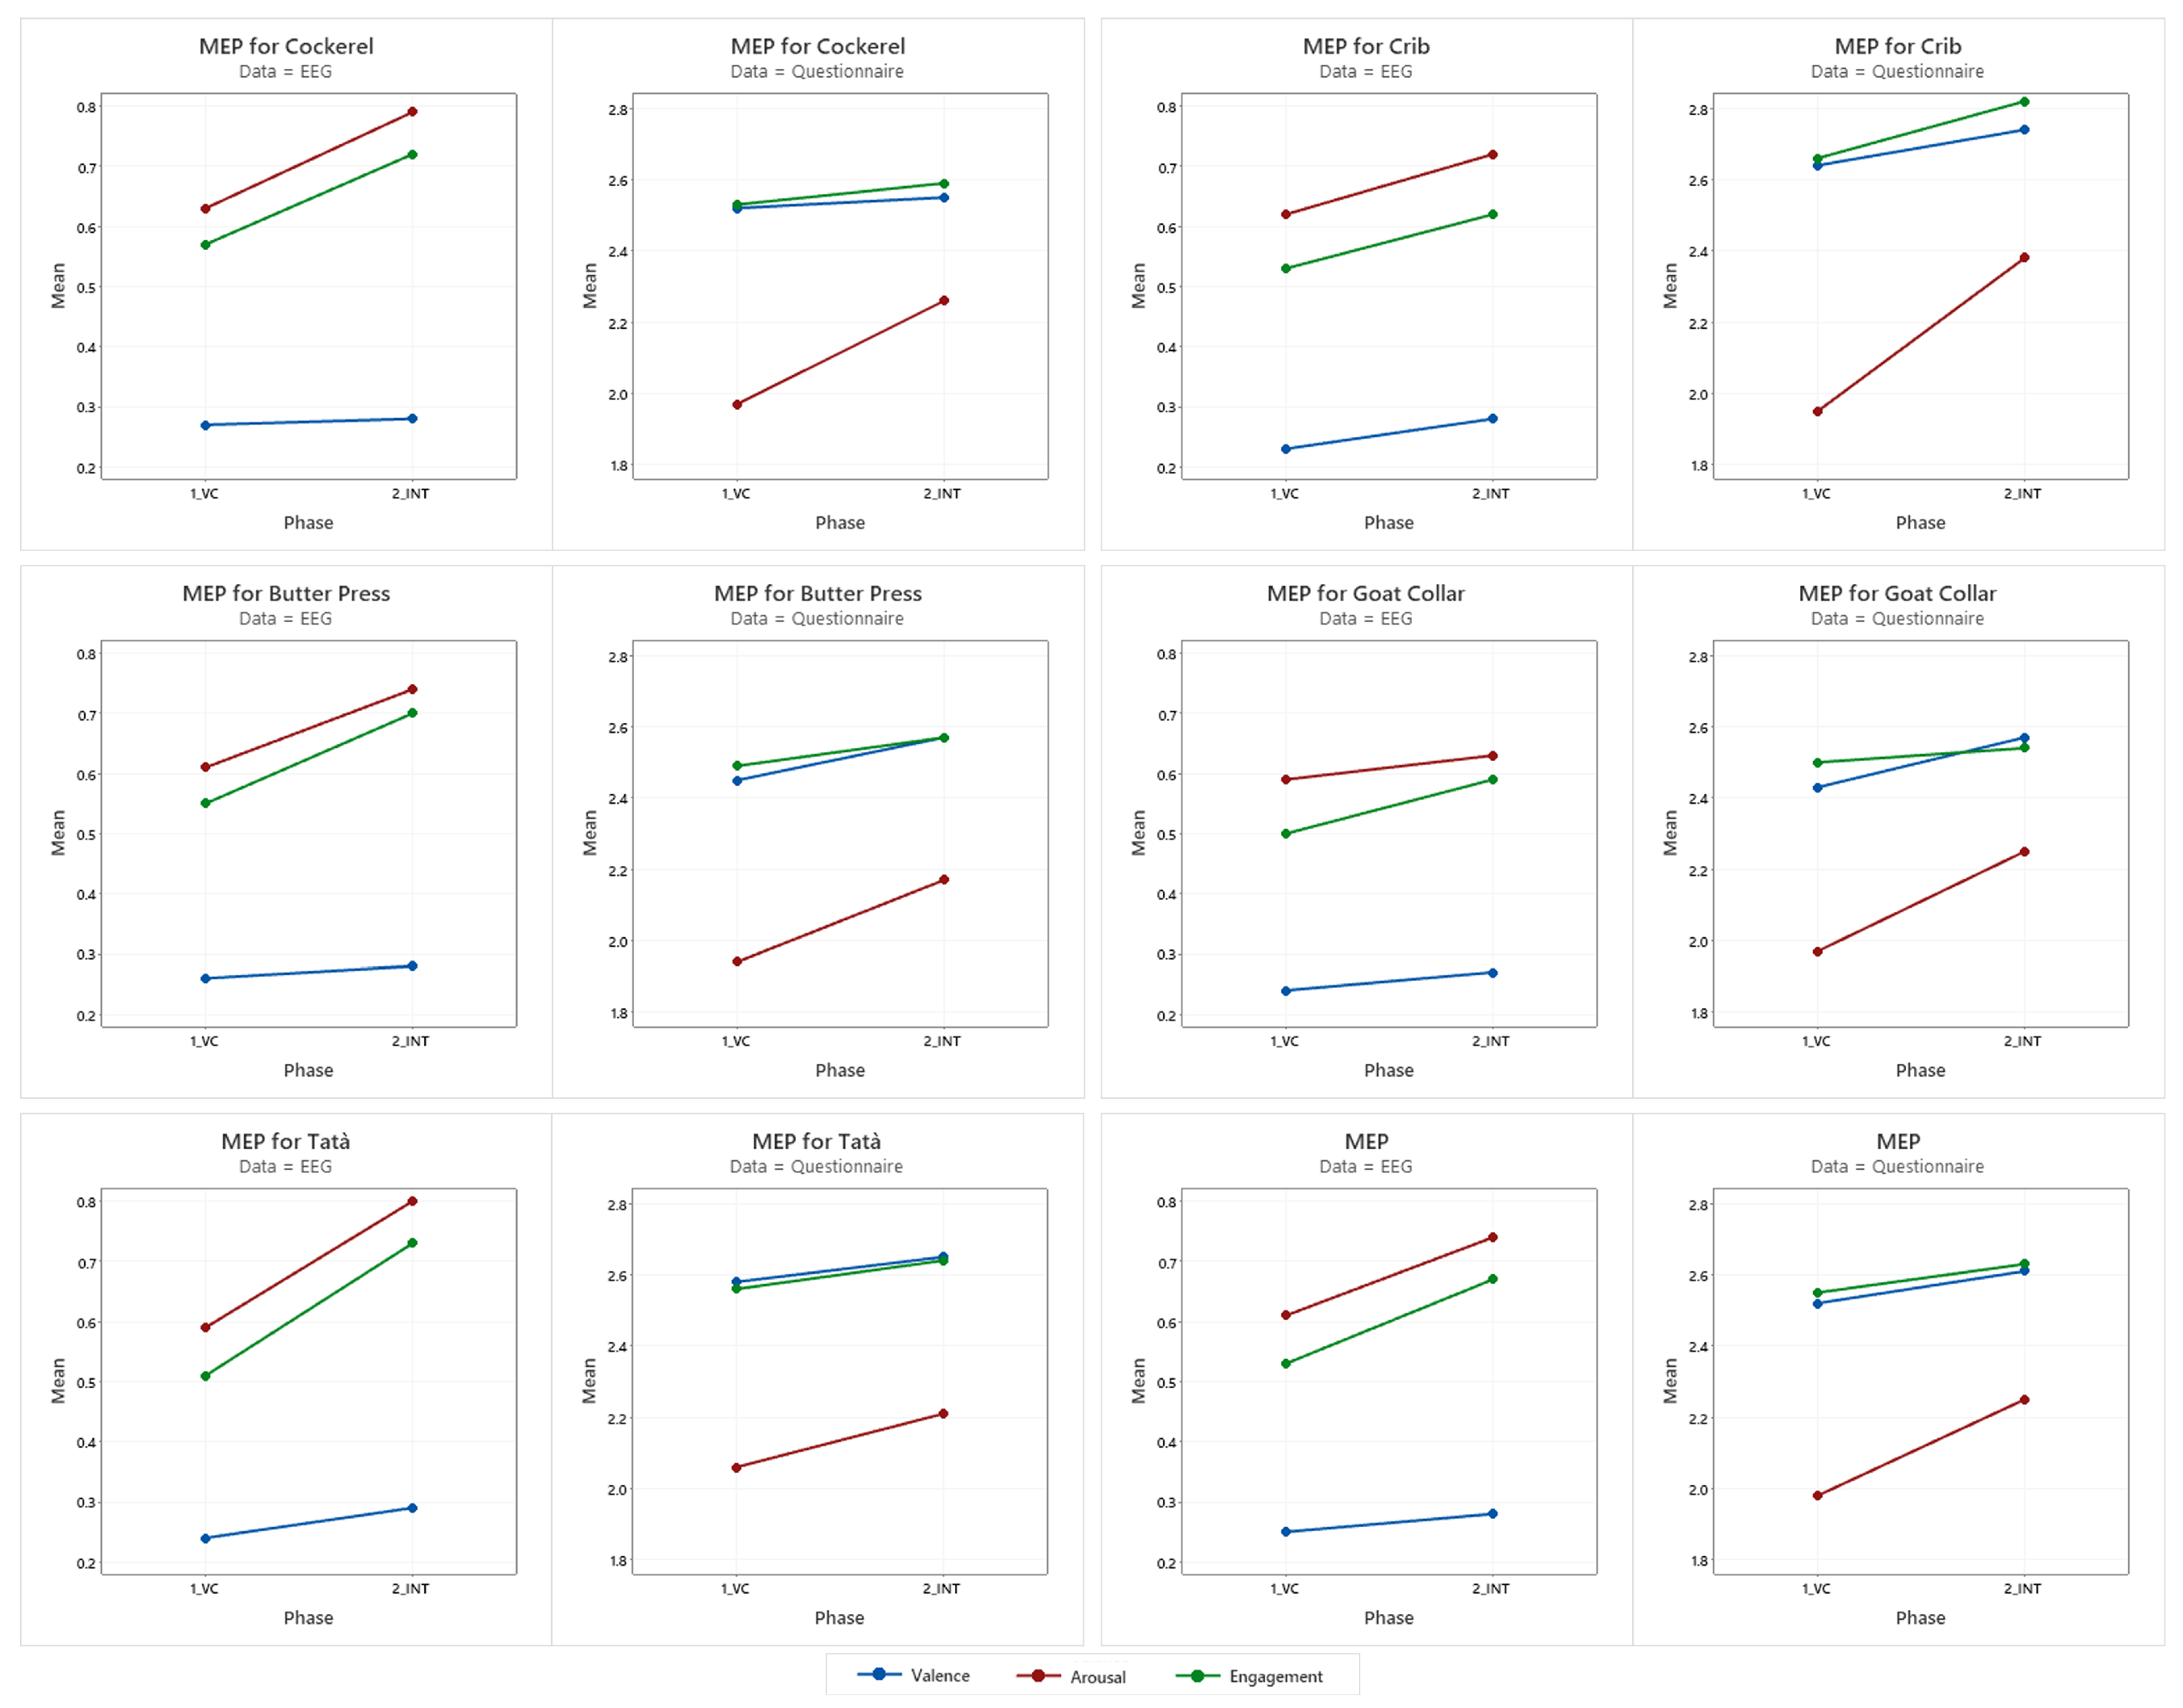
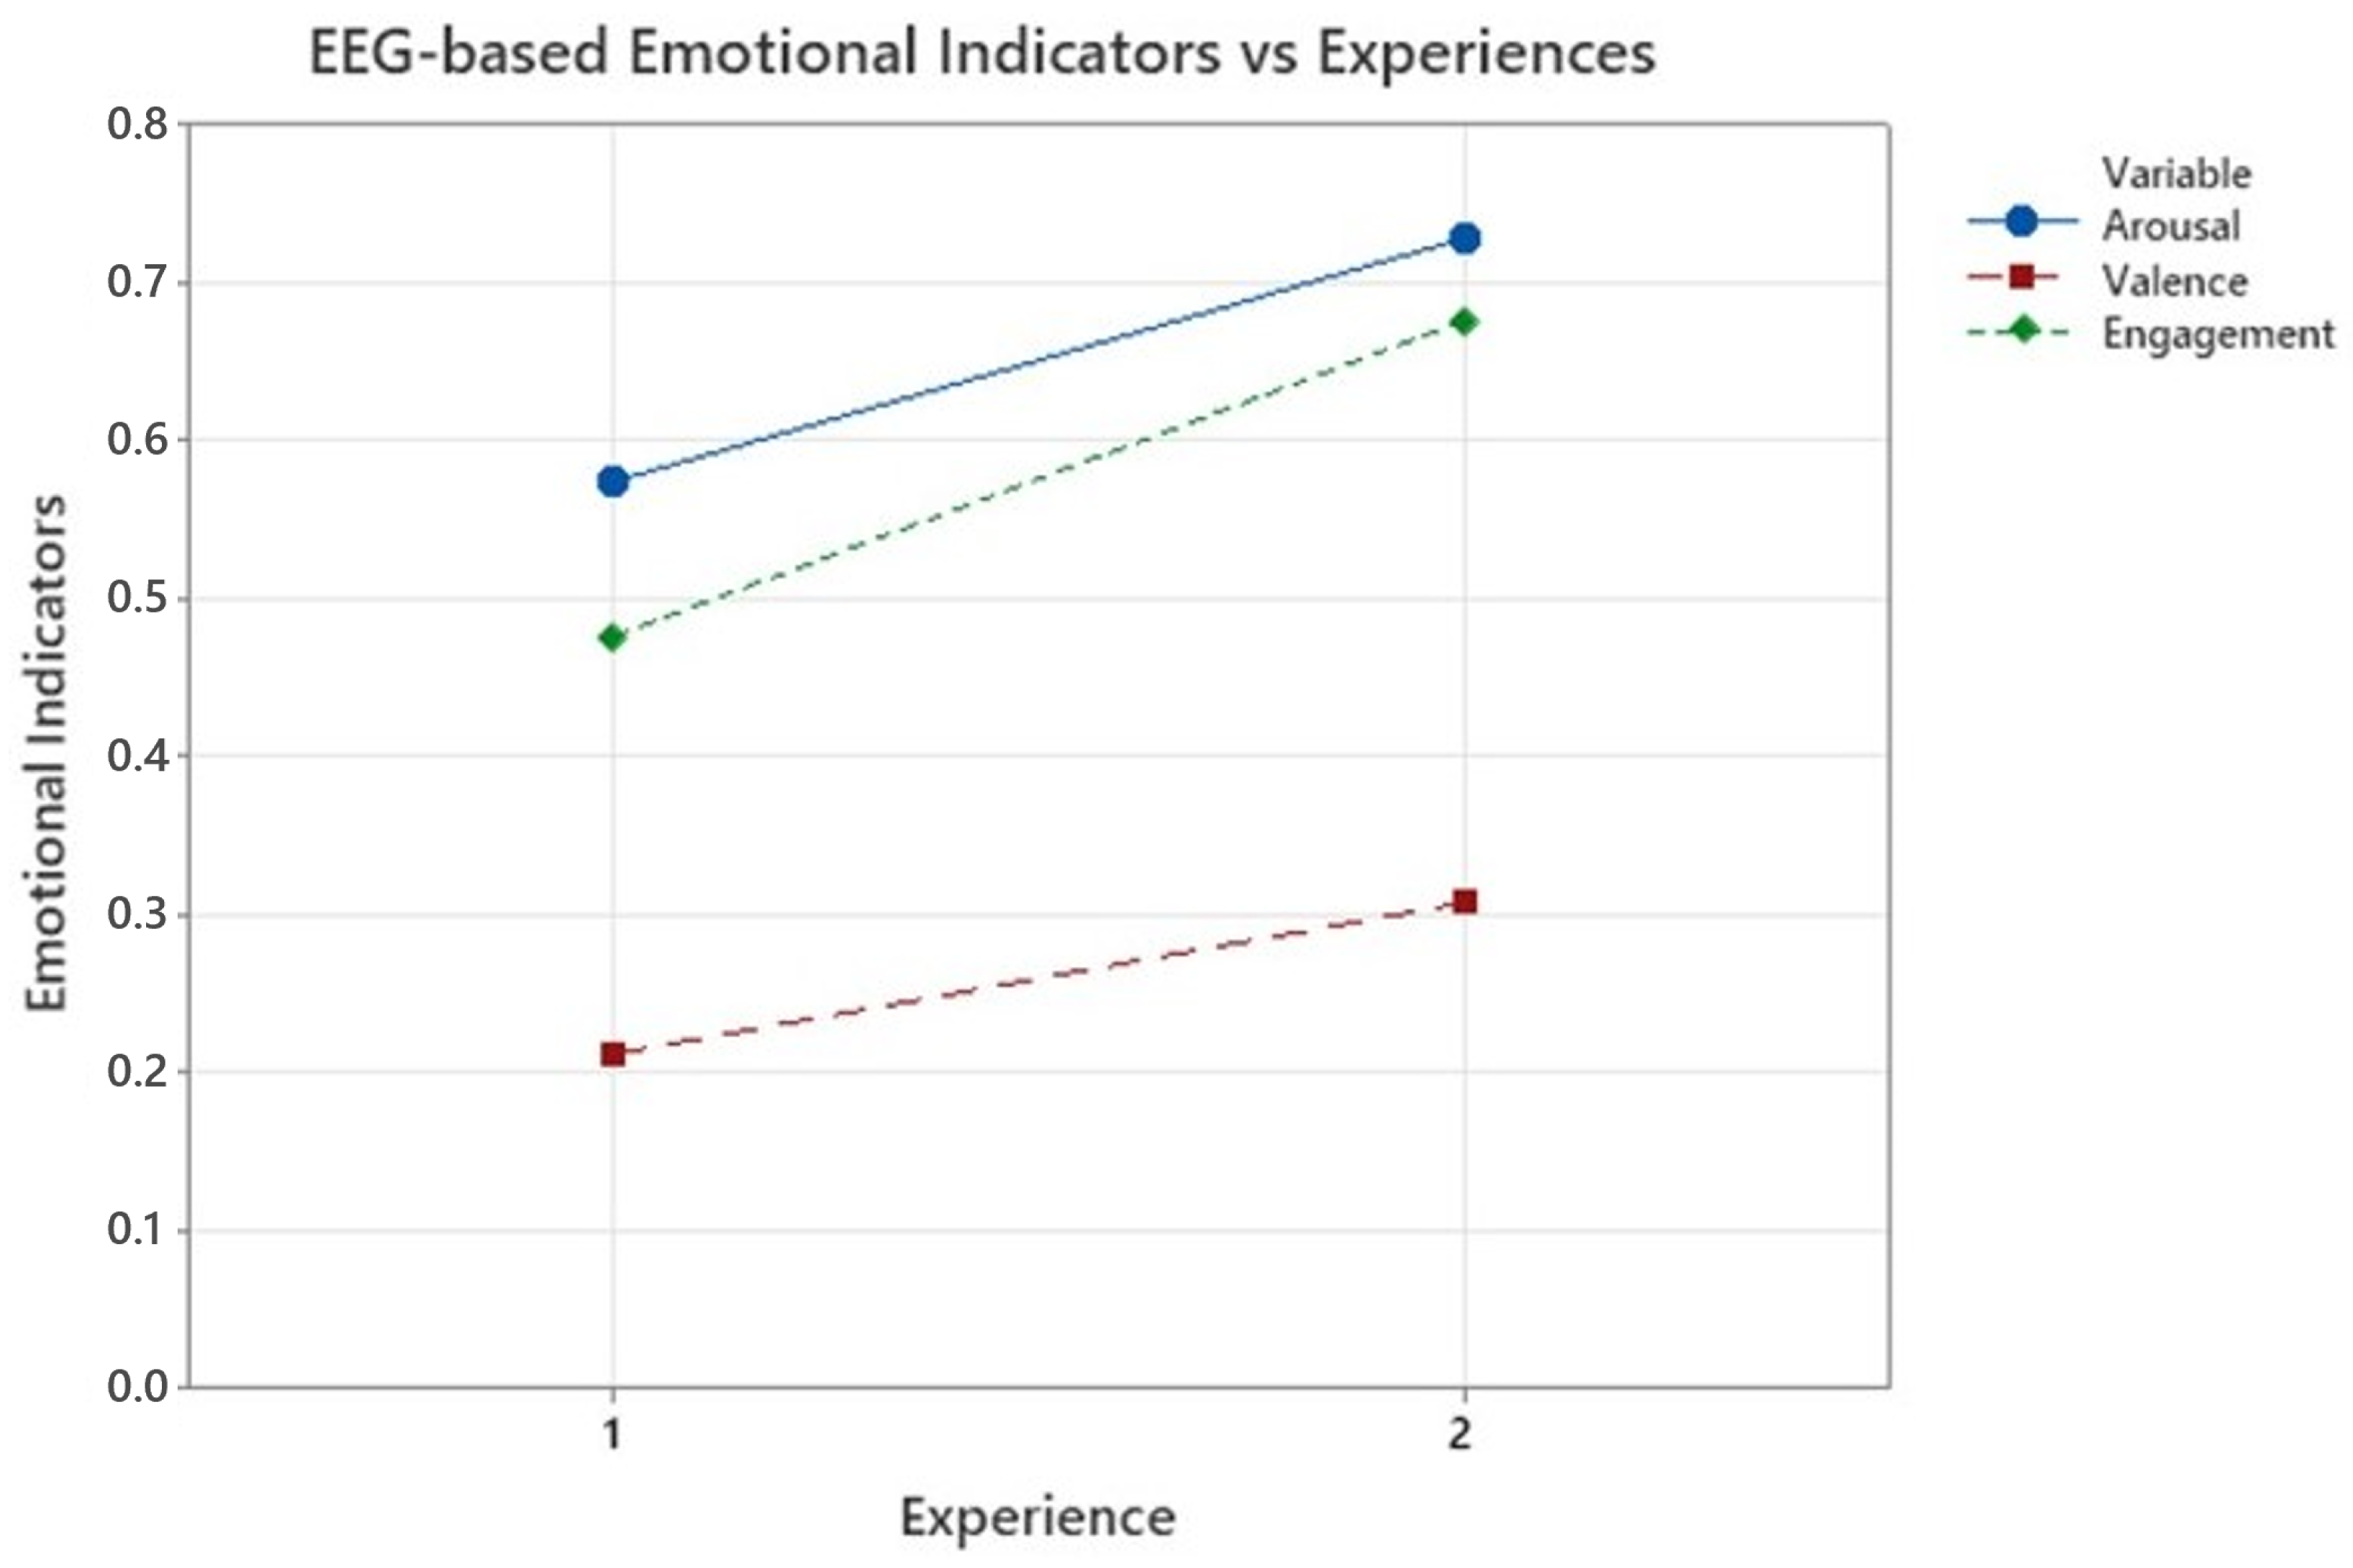
3.2. EEG Emotional Assessment
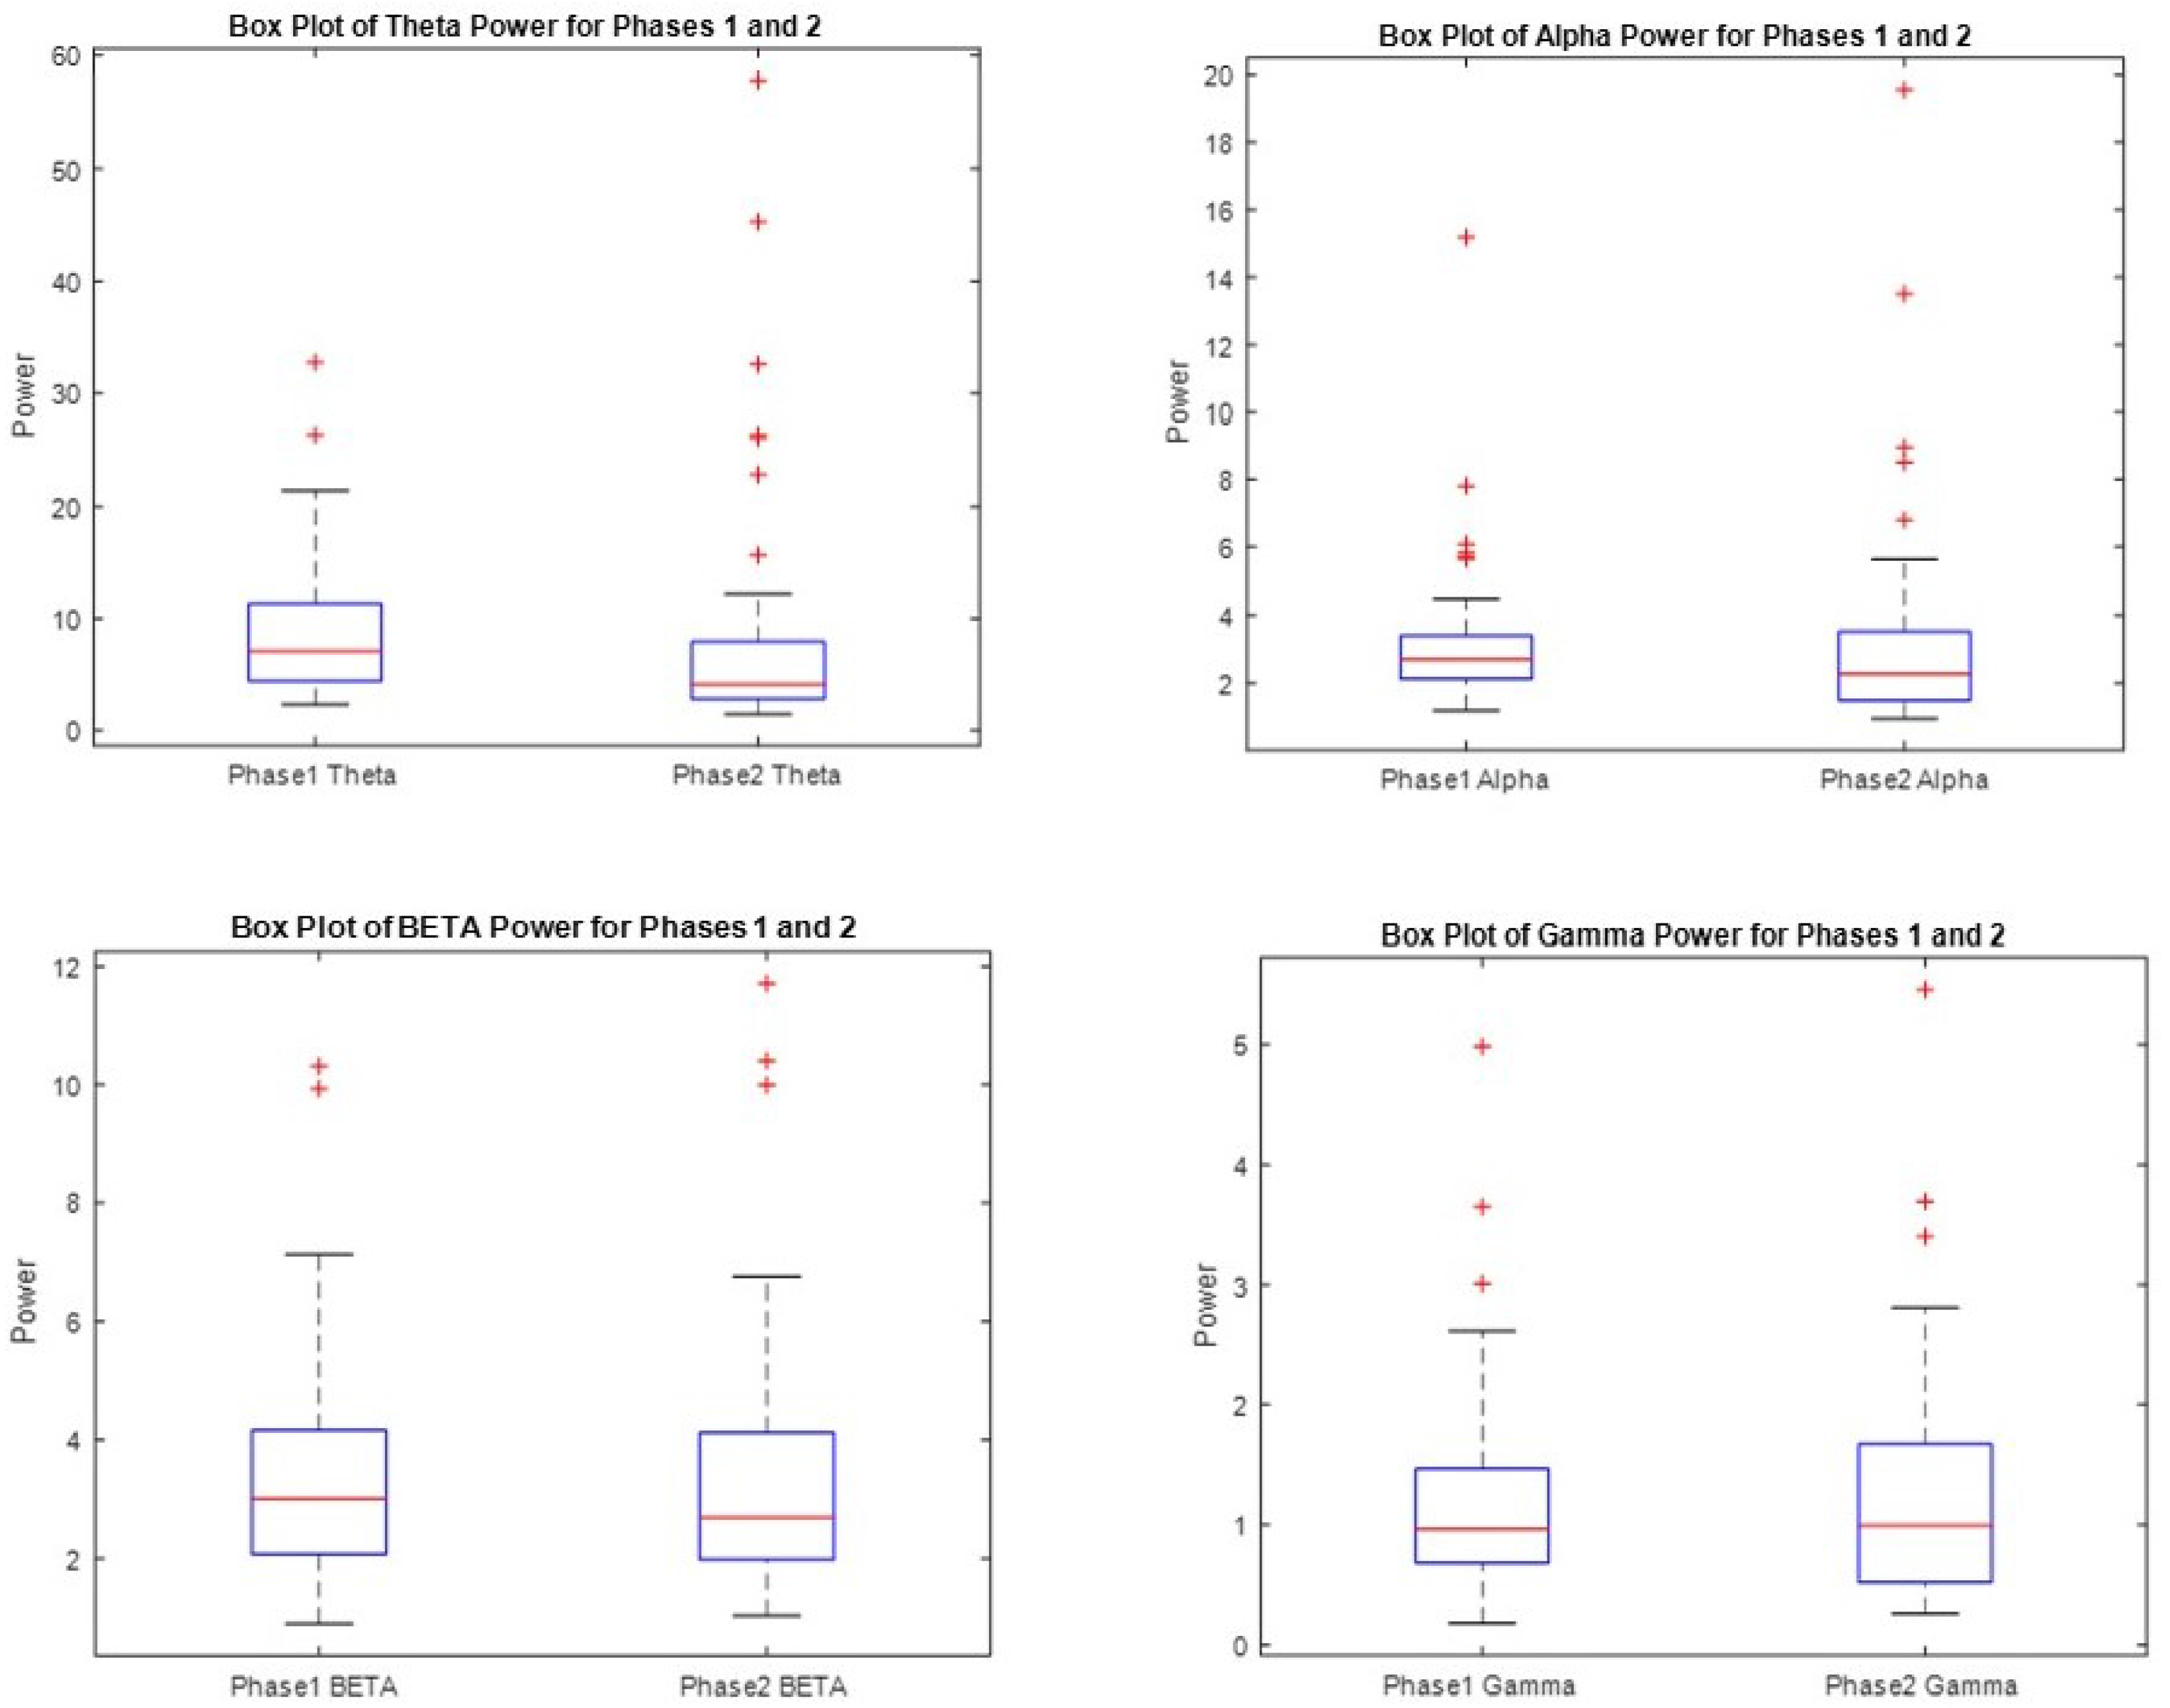
3.3. Measures of Variability of Power
3.4. XGBoost Classification
4. Discussion
5. Conclusions
Author Contributions
Funding
Institutional Review Board Statement
Informed Consent Statement
Data Availability Statement
Acknowledgments
Conflicts of Interest
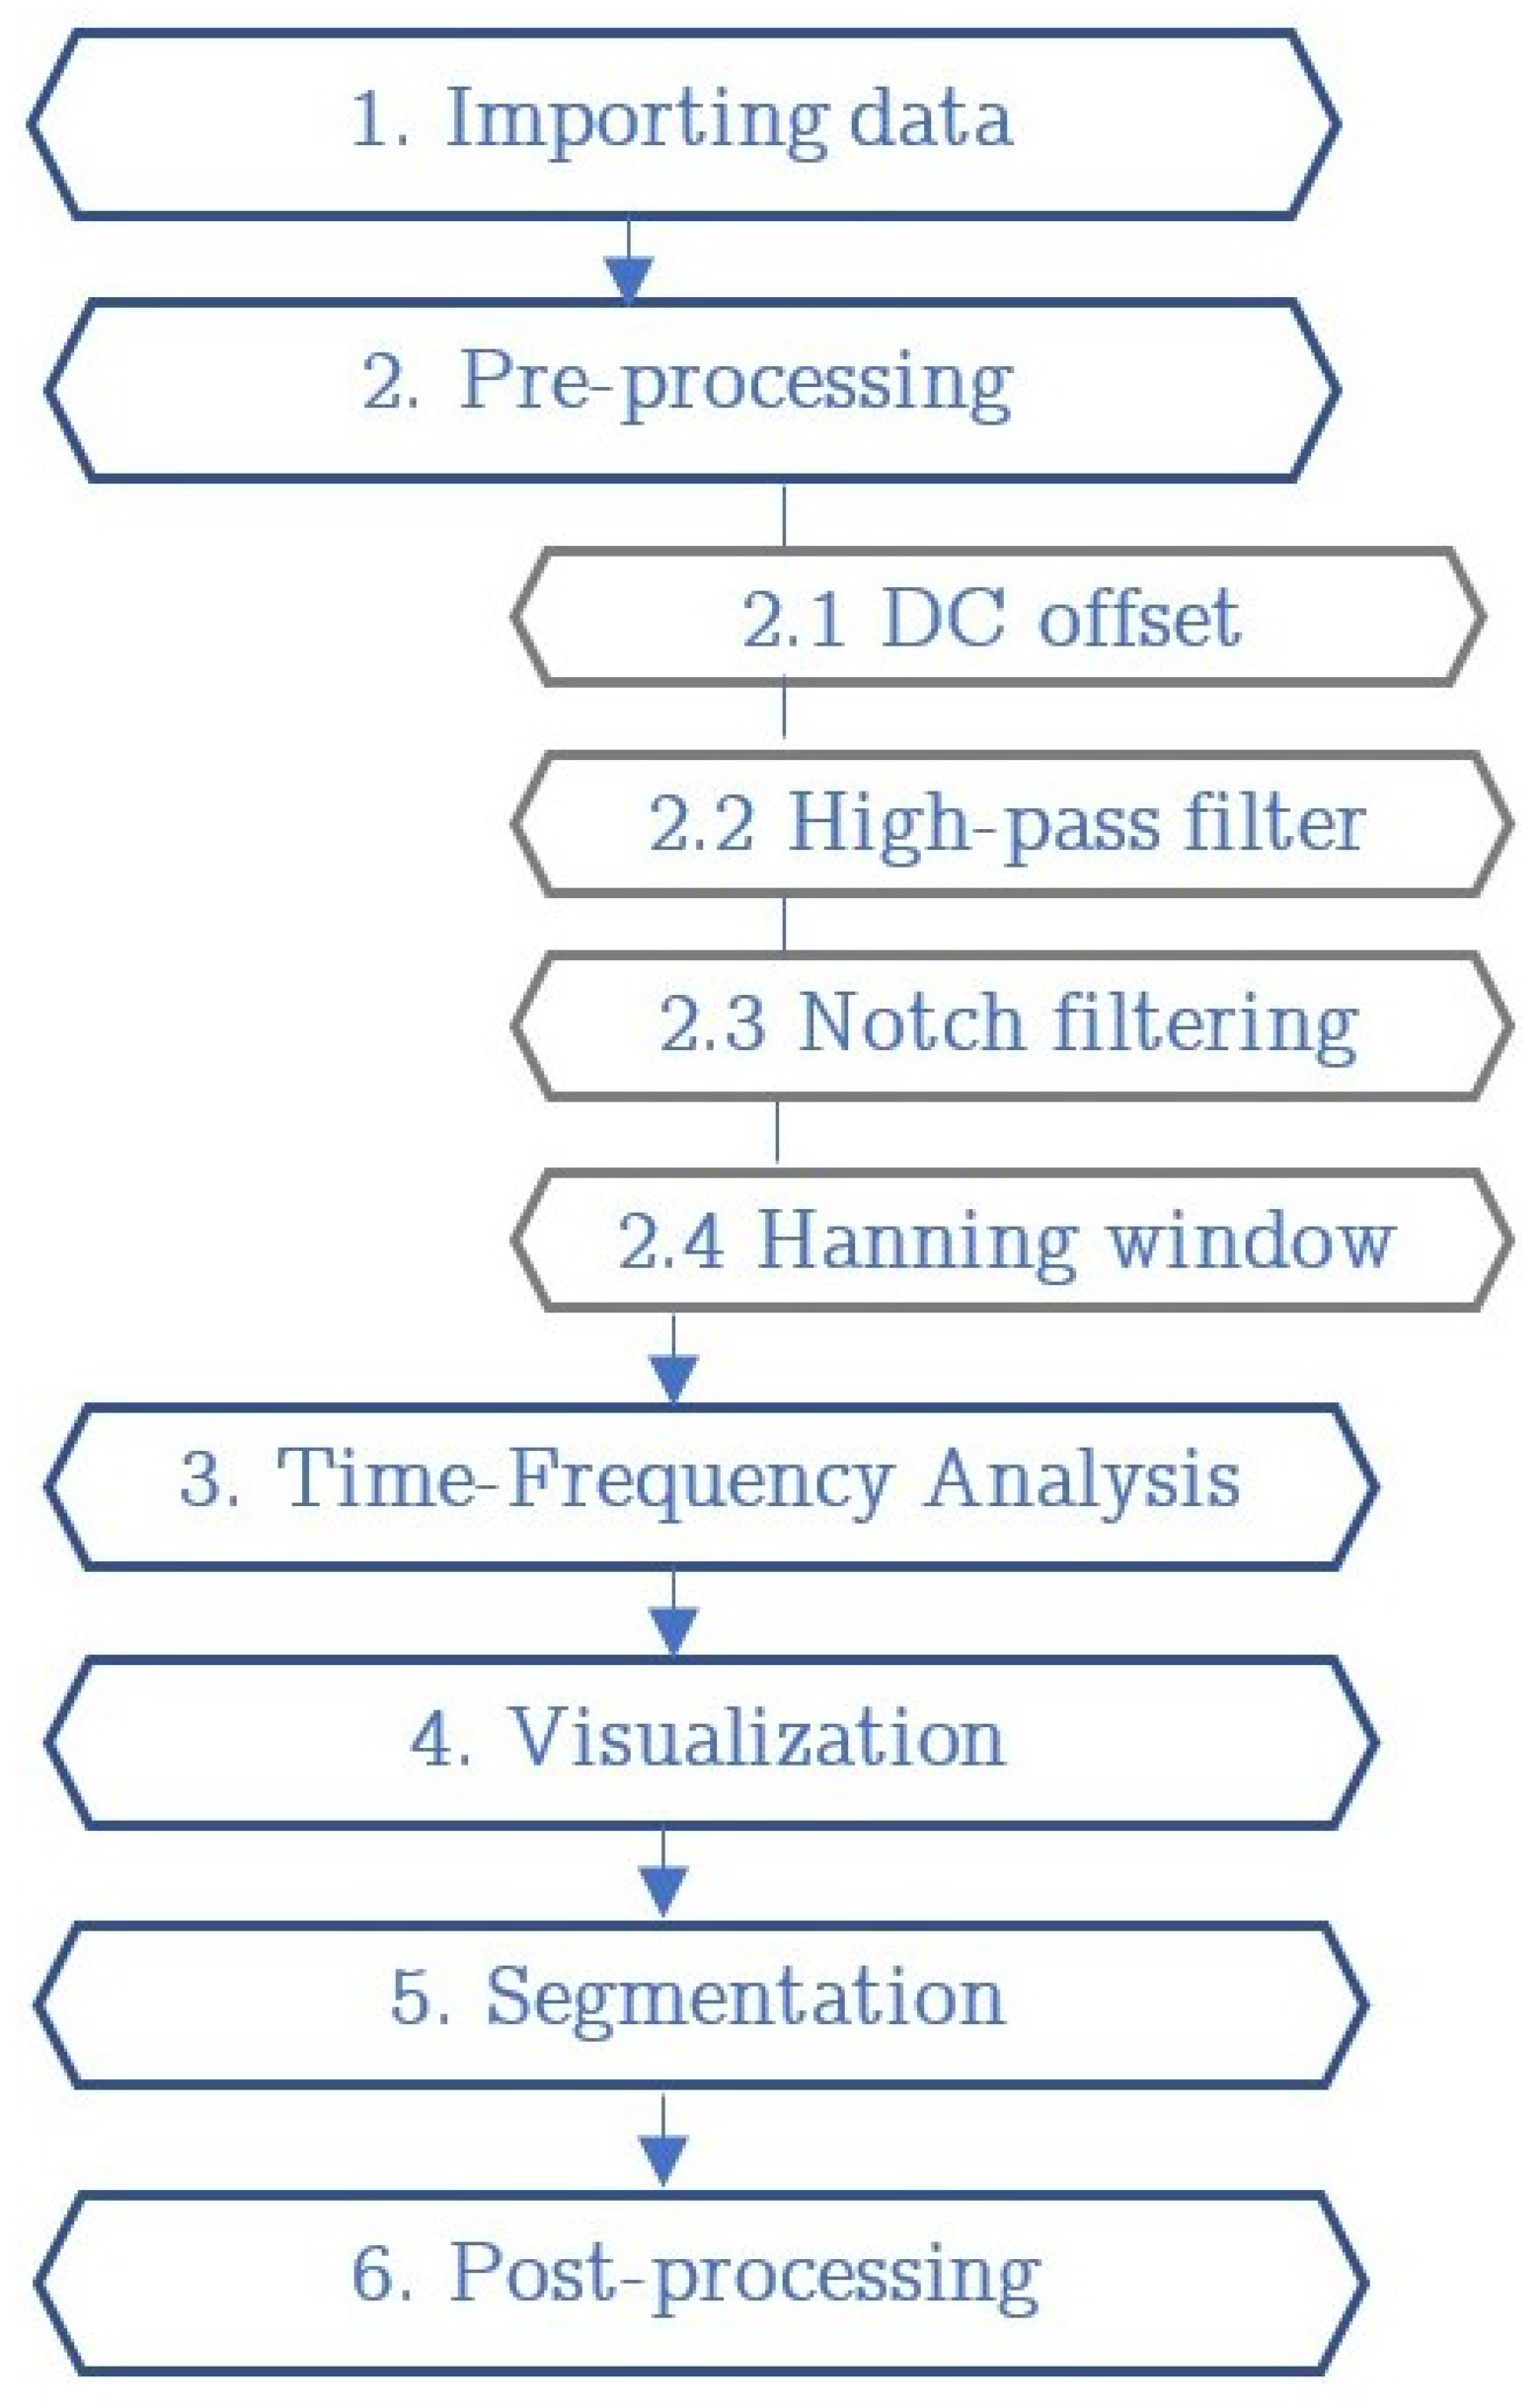
Appendix A. Detailed Preprocessing Procedures
- A participant during the real museum experience (EXP1) and the first phase with an artwork (VC). Figure A2;
- A participant during the real museum experience (EXP1) and the second phase with an artwork (INT). Figure A3;
- A participant during the Virtual Reality experience (EXP2) and the first phase with an artwork (VC). Figure A4;
- A participant during the Virtual Reality experience (EXP2) and the second phase with an artwork (INT). Figure A5;


Headset Positioning
- Before placing the headset, the participants’ scalp and hair were prepared to ensure proper contact between the electrodes and the skin. This included brushing the hair away from the electrode sites and, if necessary, cleaning the scalp with an alcohol wipe to remove any oils or residues;
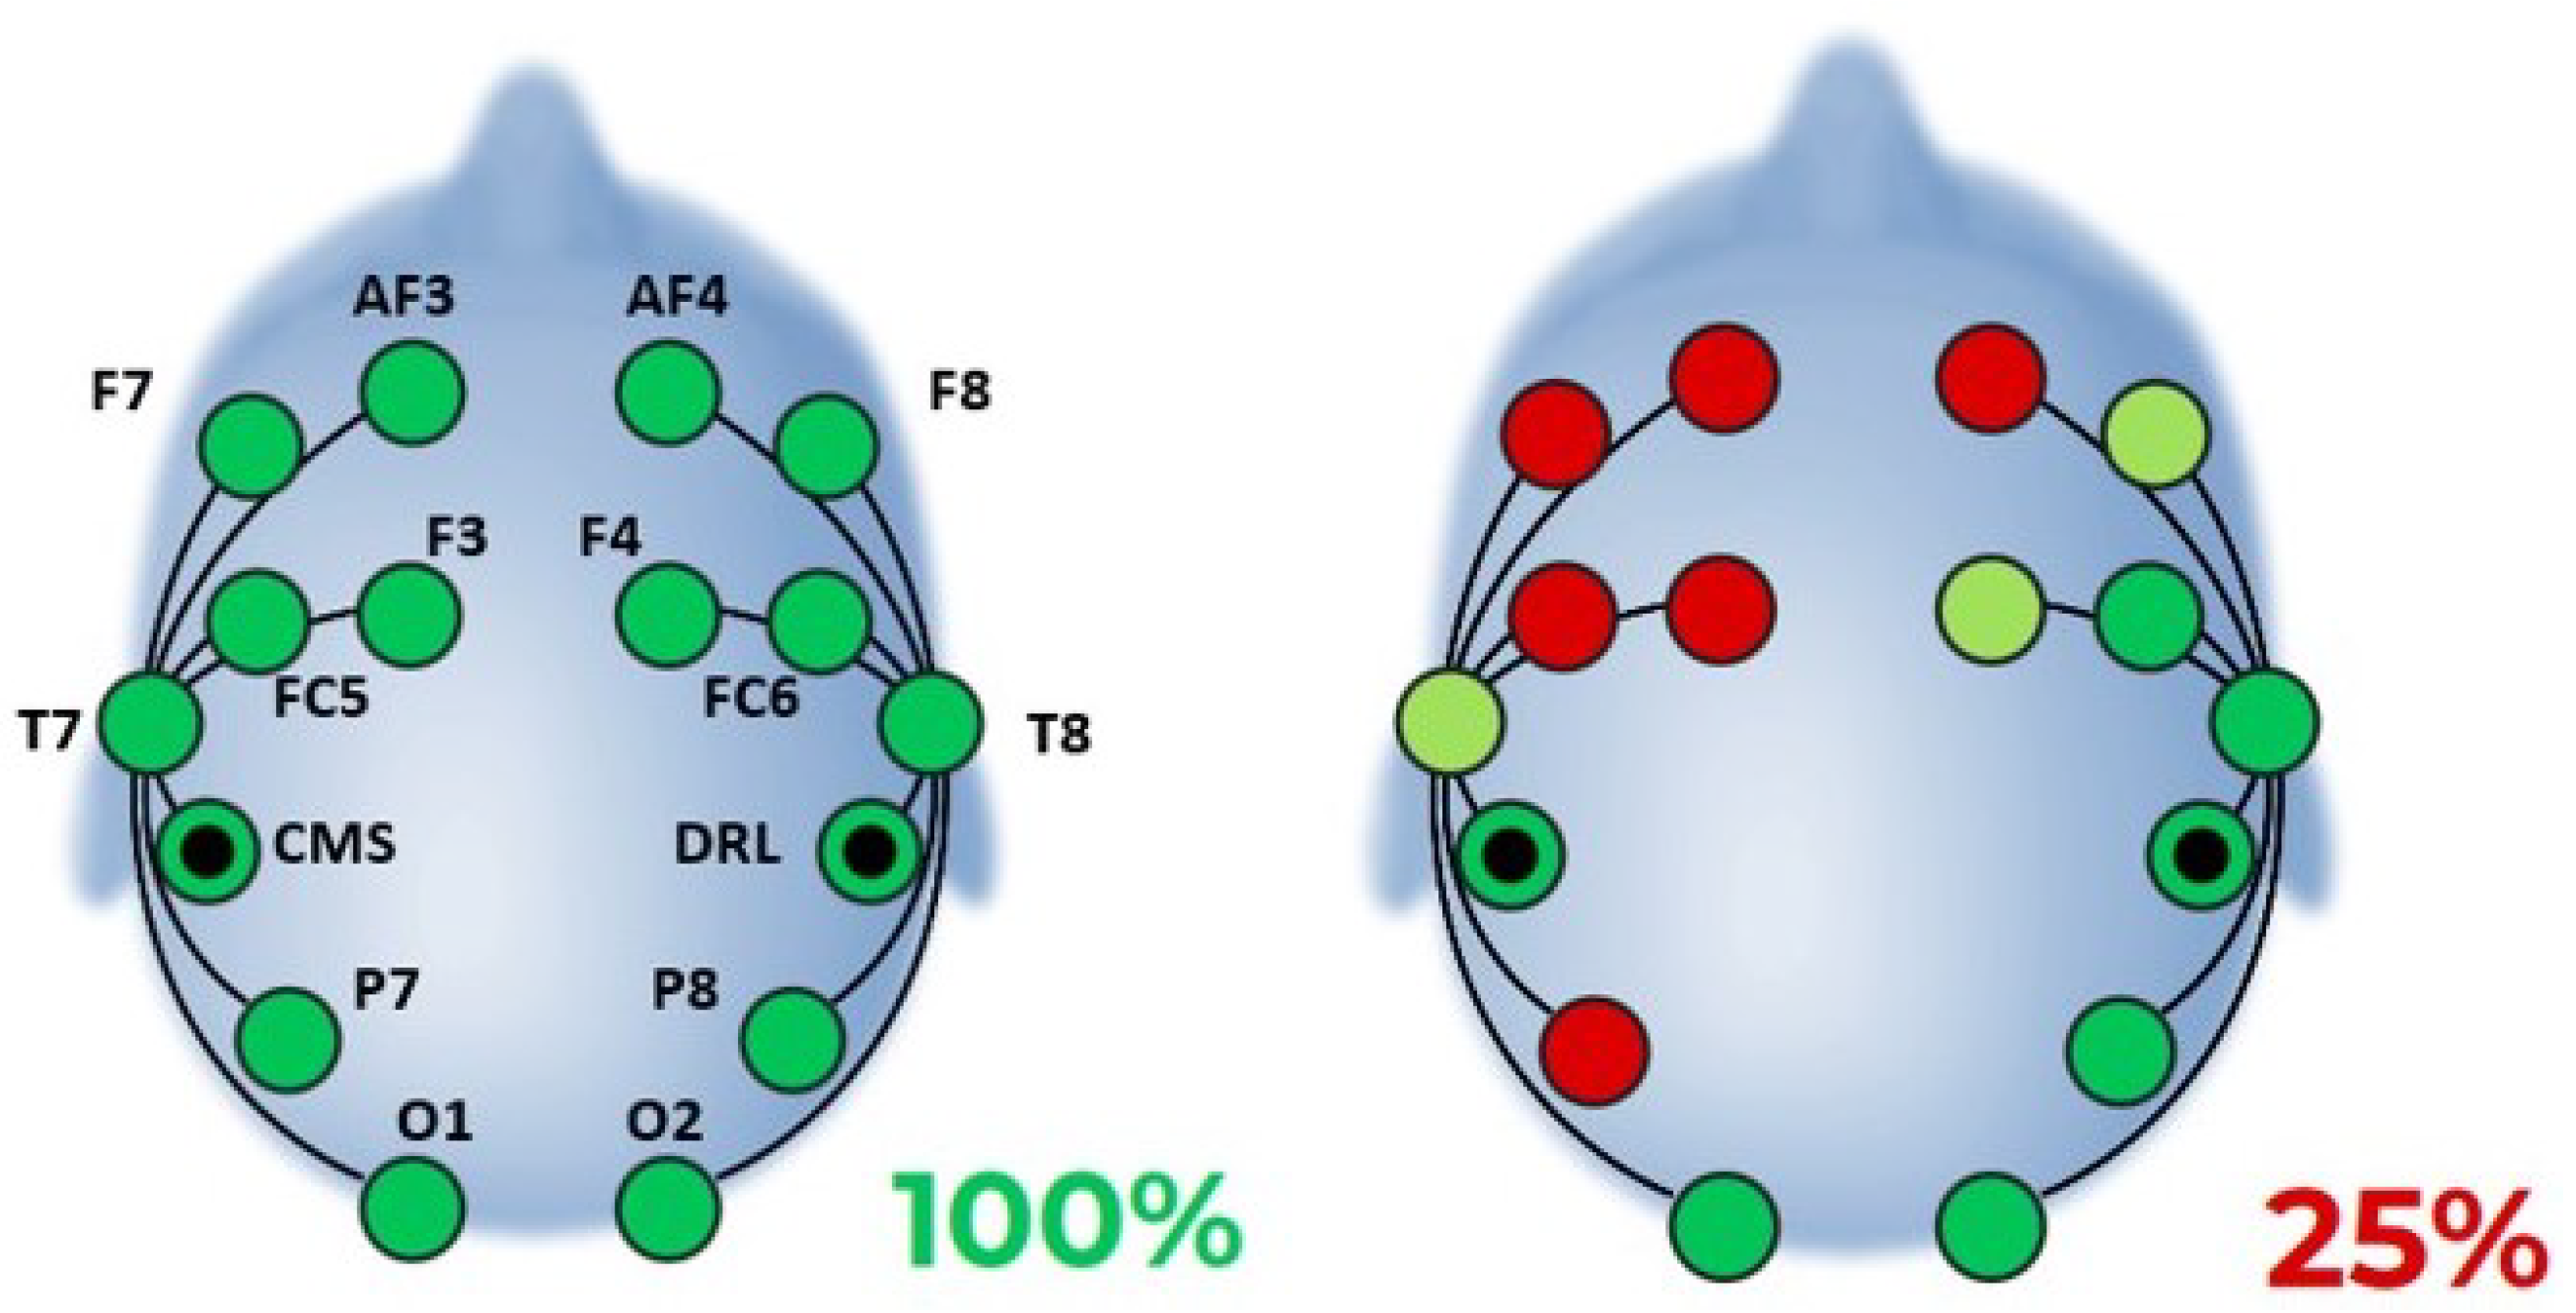
- The headset was positioned on the participant’s head according to the international 10–20 system. The headset was carefully adjusted to align with the pre-defined landmarks on the scalp;
- The EmotivPro software was used to verify the contact quality of each electrode. Below, we include more information in this regard;
- In cases where the contact quality was not optimal, additional adjustments were made, including repositioning the electrodes or further cleaning the contact site;
- With the headset properly positioned, participants were guided through the various phases of the experiment, ensuring consistent and high-quality data collection.

References
- Nonis, F.; Olivetti, E.C.; Marcolin, F.; Violante, M.G.; Vezzetti, E.; Moos, S. Questionnaires or Inner Feelings: Who Measures the Engagement Better? Appl. Sci. 2020, 10, 609. [Google Scholar] [CrossRef]
- Dozio, N.; Marcolin, F.; Scurati, G.W.; Ulrich, L.; Nonis, F.; Vezzetti, E.; Marsocci, G.; La Rosa, A.; Ferrise, F. A design methodology for affective Virtual Reality. Int. J. Hum. Comput. Stud. 2022, 162, 102791. [Google Scholar] [CrossRef]
- Vianez, A.; Marques, A.; Simões de Almeida, R. Virtual reality exposure therapy for armed forces veterans with post-traumatic stress disorder: A systematic review and focus group. Int. J. Environ. Res. Public Health 2022, 19, 464. [Google Scholar] [CrossRef] [PubMed]
- Emmelkamp, P.M.; Meyerbröker, K.; Morina, N. Virtual reality therapy in social anxiety disorder. Curr. Psychiatry Rep. 2020, 22, 32. [Google Scholar] [CrossRef] [PubMed]
- Wang, S. A Bodies-On Museum: The Transformation of Museum Embodiment through Virtual Technology. Curator Mus. J. 2023, 66, 107–128. [Google Scholar] [CrossRef]
- Lawson, G.; Salanitri, D.; Waterfield, B. Future directions for the development of virtual reality within an automotive manufacturer. Appl. Ergon. 2016, 53, 323–330. [Google Scholar] [CrossRef]
- Shao, F.; Robotham, A.J.; Hon, K. Development of a 1:1 Scale True Perception Virtual Reality System for Design Review in Automotive Industry; Auckland University of Technology Library: Auckland, New Zealand, 2012. [Google Scholar]
- Violante, M.G.; Marcolin, F.; Vezzetti, E.; Nonis, F.; Moos, S. Emotional design and virtual reality in product lifecycle management (PLM). In Sustainable Design and Manufacturing 2019: Proceedings of the 6th International Conference on Sustainable Design and Manufacturing (KES-SDM 19), Budapest, Hungary, 4–5 July 2019; Springer: Singapore, 2019; pp. 177–187. [Google Scholar]
- Vergara, D.; Rubio, M.P.; Lorenzo, M. On the design of virtual reality learning environments in engineering. Multimodal Technol. Interact. 2017, 1, 11. [Google Scholar] [CrossRef]
- Kolb, D.A. Experiential Learning: Experience as the Source of Learning and Development; FT Press: Upper Saddle River, NJ, USA, 2014. [Google Scholar]
- Bastiaansen, M.; Oosterholt, M.; Mitas, O.; Han, D.; Lub, X. An emotional roller coaster: Electrophysiological evidence of emotional engagement during a roller-coaster ride with virtual reality add-on. J. Hosp. Tour. Res. 2022, 46, 29–54. [Google Scholar] [CrossRef]
- Browning, M.H.; Mimnaugh, K.J.; Van Riper, C.J.; Laurent, H.K.; LaValle, S.M. Can simulated nature support mental health? Comparing short, single-doses of 360-degree nature videos in virtual reality with the outdoors. Front. Psychol. 2020, 10, 2667. [Google Scholar] [CrossRef]
- Maples-Keller, J.L.; Yasinski, C.; Manjin, N.; Rothbaum, B.O. Virtual reality-enhanced extinction of phobias and post-traumatic stress. Neurotherapeutics 2017, 14, 554–563. [Google Scholar] [CrossRef]
- Baños, R.M.; Botella, C.; Alcañiz, M.; Liaño, V.; Guerrero, B.; Rey, B. Immersion and emotion: Their impact on the sense of presence. Cyberpsychol. Behav. 2004, 7, 734–741. [Google Scholar] [CrossRef] [PubMed]
- Dozio, N.; Marcolin, F.; Scurati, G.W.; Nonis, F.; Ulrich, L.; Vezzetti, E.; Ferrise, F. Development of an affective database made of interactive virtual environments. Sci. Rep. 2021, 11, 24108. [Google Scholar] [CrossRef]
- Riva, G.; Mantovani, F.; Capideville, C.S.; Preziosa, A.; Morganti, F.; Villani, D.; Gaggioli, A.; Botella, C.; Alcañiz, M. Affective interactions using virtual reality: The link between presence and emotions. Cyberpsychol. Behav. 2007, 10, 45–56. [Google Scholar] [CrossRef] [PubMed]
- Diemer, J.; Alpers, G.W.; Peperkorn, H.M.; Shiban, Y.; Mühlberger, A. The impact of perception and presence on emotional reactions: A review of research in virtual reality. Front. Psychol. 2015, 6, 26. [Google Scholar] [CrossRef] [PubMed]
- Castiblanco Jimenez, I.A.; Marcolin, F.; Ulrich, L.; Moos, S.; Vezzetti, E.; Tornincasa, S. Interpreting Emotions with EEG: An Experimental Study with Chromatic Variation in VR. In Proceedings of the Advances on Mechanics, Design Engineering and Manufacturing IV, Ischia, Italy, 1–3 June 2022; Gerbino, S., Lanzotti, A., Martorelli, M., Mirálbes Buil, R., Rizzi, C., Roucoules, L., Eds.; Springer: Berlin/Heidelberg, Germany, 2023. [Google Scholar] [CrossRef]
- Cruz-Garza, J.G.; Brantley, J.A.; Nakagome, S.; Kontson, K.; Megjhani, M.; Robleto, D.; Contreras-Vidal, J.L. Deployment of Mobile EEG Technology in an Art Museum Setting: Evaluation of Signal Quality and Usability. Front. Hum. Neurosci. 2017, 11, 527. [Google Scholar] [CrossRef]
- Kontson, K.; Megjhani, M.; Brantley, J.; Cruz-Garza, J.; Nakagome, S.; Robleto, D.; White, M.; Civillico, E.; Contreras-Vidal, J. ‘Your Brain on Art’: Emergent cortical dynamics during aesthetic experiences. Front. Hum. Neurosci. 2015, 9, 626. [Google Scholar] [CrossRef]
- Abbattista, F.; Carofiglio, V.; De Carolis, B. BrainArt: A BCI-based Assessment of User’s Interests in a Museum Visit. In Proceedings of the AVI-CH 2018 Workshop on Advanced Visual Interfaces for Cultural Heritage Co-Located with 2018 International Conference on Advanced Visual Interfaces, Castiglione della Pescaia, Italy, 29 May 2018. [Google Scholar]
- Castiblanco Jimenez, I.A.; Gomez Acevedo, J.S.; Olivetti, E.C.; Marcolin, F.; Ulrich, L.; Moos, S.; Vezzetti, E. User Engagement Comparison between Advergames and Traditional Advertising Using EEG: Does the User’s Engagement Influence Purchase Intention? Electronics 2023, 12, 122. [Google Scholar] [CrossRef]
- Becker, H.; Fleureau, J.; Guillotel, P.; Wendling, F.; Merlet, I.; Albera, L. Emotion Recognition Based on High-Resolution EEG Recordings and Reconstructed Brain Sources. IEEE Trans. Affect. Comput. 2020, 11, 244–257. [Google Scholar] [CrossRef]
- Ding, X.W.; Liu, Z.T.; Li, D.Y.; He, Y.; Wu, M. Electroencephalogram Emotion Recognition Based on Dispersion Entropy Feature Extraction Using Random Oversampling Imbalanced Data Processing. IEEE Trans. Cogn. Dev. Syst. 2021, 14, 882–891. [Google Scholar] [CrossRef]
- Gunes, C.; Ozdemir, M.A.; Akan, A. Emotion recognition with multi-channel EEG signals using auditory stimulus. In Proceedings of the 2019 Medical Technologies Congress (TIPTEKNO), Izmir, Turkey, 3–5 October 2019; pp. 1–4. [Google Scholar]
- Kannadasan, K.; Veerasingam, S.; Shameedha Begum, B.; Ramasubramanian, N. An EEG-based subject-independent emotion recognition model using a differential-evolution-based feature selection algorithm. Knowl. Inf. Syst. 2023, 65, 341–377. [Google Scholar] [CrossRef]
- Zhuang, N.; Zeng, Y.; Tong, L.; Zhang, C.; Zhang, H.; Yan, B. Emotion recognition from EEG signals using multidimensional information in EMD domain. BioMed Res. Int. 2017, 2017, 8317357. [Google Scholar] [CrossRef] [PubMed]
- Mohammadi, Z.; Frounchi, J.; Amiri, M. Wavelet-based emotion recognition system using EEG signal. Neural Comput. Appl. 2017, 28, 1985–1990. [Google Scholar] [CrossRef]
- Dabas, H.; Sethi, C.; Dua, C.; Dalawat, M.; Sethia, D. Emotion classification using EEG signals. In Proceedings of the 2018 2nd International Conference on Computer Science and Artificial Intelligence, Shenzhen, China, 8–10 December 2018; pp. 380–384. [Google Scholar]
- Sulthan, N.; Mohan, N.; Khan, K.A.; Sofiya, S.; Muhammed Shanir, P.P. Emotion recognition using brain signals. In Proceedings of the 2018 International Conference on Intelligent Circuits and Systems (ICICS), Phagwara, India, 20–21 April 2018; pp. 315–319. [Google Scholar]
- Ramzan, M.; Dawn, S. Learning-based classification of valence emotion from electroencephalography. Int. J. Neurosci. 2019, 129, 1085–1093. [Google Scholar] [CrossRef]
- Huynh, V.Q.; Van Huynh, T. An investigation of ensemble methods to classify electroencephalogram signaling modes. In Proceedings of the 2020 7th NAFOSTED Conference on Information and Computer Science (NICS), Ho Ch Minh, Vietnam, 26–27 November 2020; pp. 203–208. [Google Scholar]
- Chen, Y.; Chang, R.; Guo, J. Emotion recognition of EEG signals based on the ensemble learning method: AdaBoost. Math. Probl. Eng. 2021, 2021, 8896062. [Google Scholar] [CrossRef]
- Parui, S.; Bajiya, A.K.R.; Samanta, D.; Chakravorty, N. Emotion recognition from EEG signal using XGBoost algorithm. In Proceedings of the 2019 IEEE 16th India Council International Conference (INDICON), Rajkot, India, 13–15 December 2019; pp. 1–4. [Google Scholar]
- Miller, C.H.; Sacchet, M.D.; Gotlib, I.H. Support vector machines and affective science. Emot. Rev. 2020, 12, 297–308. [Google Scholar] [CrossRef]
- Alarcao, S.M.; Fonseca, M. Emotions Recognition Using EEG Signals: A Survey. IEEE Trans. Affect. Comput. 2017, 10, 374–393. [Google Scholar] [CrossRef]
- Lameski, P.; Zdravevski, E.; Mingov, R.; Kulakov, A. SVM parameter tuning with grid search and its impact on model over-fitting. In Proceedings of the Rough Sets, Fuzzy Sets, Data Mining, and Granular Computing: 15th International Conference (RSFDGrC 2015), Tianjin, China, 20–23 November 2015; pp. 464–474. [Google Scholar]
- Li, J.; Zhang, Z.; He, H. Hierarchical convolutional neural networks for EEG-based emotion recognition. Cogn. Comput. 2018, 10, 368–380. [Google Scholar] [CrossRef]
- Edla, D.R.; Mangalorekar, K.; Dhavalikar, G.; Dodia, S. Classification of EEG data for human mental state analysis using Random Forest Classifier. Procedia Comput. Sci. 2018, 132, 1523–1532. [Google Scholar] [CrossRef]
- Kumar, J.L.M.; Rashid, M.; Musa, R.M.; Razman, M.A.M.; Sulaiman, N.; Jailani, R.; Majeed, A.P.A. The classification of EEG-based winking signals: A transfer learning and random forest pipeline. PeerJ 2021, 9, e11182. [Google Scholar] [CrossRef]
- Soleymani, M.; Member, S.; Lee, J. DEAP: A Database for Emotion Analysis Using Physiological Signals. IEEE Trans. Affect. Comput. 2012, 3, 18–31. [Google Scholar]
- Veena, S.; Sumaiya, M. Human emotion classification using eeg signals by multivariate synchrosqueezing transform. In Human Behaviour Analysis Using Intelligent Systems; Springer: Berlin/Heidelberg, Germany, 2020; pp. 179–204. [Google Scholar]
- Liu, Z.T.; Hu, S.J.; She, J.; Yang, Z.; Xu, X. Electroencephalogram Emotion Recognition Using Combined Features in Variational Mode Decomposition Domain. IEEE Trans. Cogn. Dev. Syst. 2023. [Google Scholar] [CrossRef]
- Wang, J.; Wang, M. Review of the emotional feature extraction and classification using EEG signals. Cogn. Robot. 2021, 1, 29–40. [Google Scholar] [CrossRef]
- Gao, Q.; Yang, Y.; Kang, Q.; Tian, Z.; Song, Y. EEG-based emotion recognition with feature fusion networks. Int. J. Mach. Learn. Cybern. 2022, 13, 421–429. [Google Scholar] [CrossRef]
- Demir, F.; Sobahi, N.; Siuly, S.; Sengur, A. Exploring deep learning features for automatic classification of human emotion using EEG rhythms. IEEE Sens. J. 2021, 21, 14923–14930. [Google Scholar] [CrossRef]
- Hertweck, S.; Weber, D.; Alwanni, H.; Unruh, F.; Fischbach, M.; Latoschik, M.E.; Ball, T. Brain activity in virtual reality: Assessing signal quality of high-resolution eeg while using head-mounted displays. In Proceedings of the 2019 IEEE Conference on Virtual Reality and 3D User Interfaces (VR), Osaka, Japan, 23–27 March 2019; pp. 970–971. [Google Scholar]
- Russell, J.A. A circumplex model of affect. J. Personal. Soc. Psychol. 1980, 39, 1161. [Google Scholar] [CrossRef]
- Warriner, A.B.; Kuperman, V. Affective biases in English are bi-dimensional. Cogn. Emot. 2015, 29, 1147–1167. [Google Scholar] [CrossRef]
- Adelman, J.S.; Estes, Z. Emotion and memory: A recognition advantage for positive and negative words independent of arousal. Cognition 2013, 129, 530–535. [Google Scholar] [CrossRef]
- O’Brien, H.L.; Toms, E.G. The development and evaluation of a survey to measure user engagement. J. Am. Soc. Inf. Sci. Technol. 2010, 61, 50–69. [Google Scholar] [CrossRef]
- Castiblanco Jimenez, I.A.; Gomez Acevedo, J.S.; Marcolin, F.; Vezzetti, E.; Moos, S. Towards an integrated framework to measure user engagement with interactive or physical products. Int. J. Interact. Des Manuf. 2022, 17, 45–67. [Google Scholar] [CrossRef]
- Homan, R.W.; Herman, J.; Purdy, P. Cerebral location of international 10–20 system electrode placement. Electroencephalogr. Clin. Neurophysiol. 1987, 66, 376–382. [Google Scholar] [CrossRef] [PubMed]
- Ramirez, R.; Planas, J.; Escude, N.; Mercade, J.; Farriols, C. EEG-Based Analysis of the Emotional Effect of Music Therapy on Palliative Care Cancer Patients. Front. Psychol. 2018, 9, 254. [Google Scholar] [CrossRef] [PubMed]
- Lee, Y.Y.; Hsieh, S. Classifying Different Emotional States by Means of EEG-Based Functional Connectivity Patterns. PLoS ONE 2014, 9, e95415. [Google Scholar] [CrossRef]
- Hwang, S.; Jebelli, H.; Choi, B.; Choi, M.; Lee, S. Measuring Workers’ Emotional State during Construction Tasks Using Wearable EEG. J. Constr. Eng. Manag. 2018, 144, 4018050. [Google Scholar] [CrossRef]
- Aftanas, L.; Golocheikine, S. Human anterior and frontal midline theta and lower alpha reflect emotionally positive state and internalized attention: High-resolution EEG investigation of meditation. Neurosci. Lett. 2001, 310, 57–60. [Google Scholar] [CrossRef] [PubMed]
- Jirakittayakorn, N.; Wongsawat, Y. Brain Responses to a 6-Hz Binaural Beat: Effects on General Theta Rhythm and Frontal Midline Theta Activity. Front. Neurosci. 2017, 11, 365. [Google Scholar] [CrossRef] [PubMed]
- Chrastil, E.R.; Rice, C.; Goncalves, M.; Moore, K.N.; Wynn, S.C.; Stern, C.E.; Nyhus, E. Theta oscillations support active exploration in human spatial navigation. NeuroImage 2022, 262, 119581. [Google Scholar] [CrossRef]
- Balasubramanian, G.; Kanagasabai, A.; Mohan, J.; Seshadri, N.G. Music induced emotion using wavelet packet decomposition—An EEG study. Biomed. Signal Process. Control. 2018, 42, 115–128. [Google Scholar] [CrossRef]
- Ramirez, R.; Vamvakousis, Z. Detecting Emotion from EEG Signals Using the Emotive Epoc Device. In Proceedings of the Brain Informatics, Macau, China, 4–7 December 2012; Zanzotto, F.M., Tsumoto, S., Taatgen, N., Yao, Y., Eds.; Springer: Berlin/Heidelberg, Germany, 2012; pp. 175–184. [Google Scholar]
- Li, M.; Lu, B.L. Emotion classification based on gamma-band EEG. In Proceedings of the 2009 Annual International Conference of the IEEE Engineering in Medicine and Biology Society, Minneapolis, MN, USA, 3–6 September 2009; pp. 1223–1226. [Google Scholar] [CrossRef]
- He, Y.; Nagels, A.; Schlesewsky, M.; Straube, B. The Role of Gamma Oscillations During Integration of Metaphoric Gestures and Abstract Speech. Front. Psychol. 2018, 9, 1348. [Google Scholar] [CrossRef]
- Ladino Nocua, A.C.; Cruz Gonzalez, J.P.; Castiblanco Jimenez, I.A.; Gomez Acevedo, J.S.; Marcolin, F.; Vezzetti, E. Assessment of Cognitive Student Engagement Using Heart Rate Data in Distance Learning during COVID-19. Educ. Sci. 2021, 11, 540. [Google Scholar] [CrossRef]
- Freeman, F.G.; Mikulka, P.J.; Prinzel, L.J.; Scerbo, M.W. Evaluation of an adaptive automation system using three EEG indices with a visual tracking task. Biol. Psychol. 1999, 50, 61–76. [Google Scholar] [CrossRef]
- Freeman, F.; Mikulka, P.; Scerbo, M.; Prinzel, L.; Clouatre, K. Evaluation of a Psychophysiologically Controlled Adaptive Automation System, Using Performance on a Tracking Task. Appl. Psychophysiol. Biofeedback 2000, 25, 103–115. [Google Scholar] [CrossRef]
- Molteni, E.; Bianchi, A.M.; Butti, M.; Reni, G.; Zucca, C. Analysis of the dynamical behaviour of the EEG rhythms during a test of sustained attention. In Proceedings of the 2007 29th Annual International Conference of the IEEE Engineering in Medicine and Biology Society, Lyon, France, 22–26 August 2007; pp. 1298–1301. [Google Scholar]
- Coelli, S.; Sclocco, R.; Barbieri, R.; Reni, G.; Zucca, C.; Bianchi, A.M. EEG-based index for engagement level monitoring during sustained attention. In Proceedings of the 2015 37th Annual International Conference of the IEEE Engineering in Medicine and Biology Society (EMBC), Milan, Italy, 25–29 August 2015; pp. 1512–1515. [Google Scholar] [CrossRef]
- Eoh, H.J.; Chung, M.K.; Kim, S.H. Electroencephalographic study of drowsiness in simulated driving with sleep deprivation. Int. J. Ind. Ergon. 2005, 35, 307–320. [Google Scholar] [CrossRef]
- McMahan, T.; Parberry, I.; Parsons, T.D. Evaluating Player Task Engagement and Arousal Using Electroencephalography. Procedia Manuf. 2015, 3, 2303–2310. [Google Scholar] [CrossRef]
- Bekkedal, M.Y.; Rossi, J.; Panksepp, J. Human brain EEG indices of emotions: Delineating responses to affective vocalizations by measuring frontal theta event-related synchronization. Neurosci. Biobehav. Rev. 2011, 35, 1959–1970. [Google Scholar] [CrossRef]
- Plass-Oude Bos, D. EEG-based Emotion Recognition. Influ. Vis. Audit. Stimuli 2006, 56, 1–17. [Google Scholar]
- Giraldo, S.I.; Ramirez, R. Brain-Activity-Driven Real-Time Music Emotive Control. In Proceedings of the Fifth International Brain-Computer Interface Meeting, Pacific Grove, CA, USA, 3–7 June 2013; Graz University of Technology Publishing House: Graz, Austria, 2013. [Google Scholar] [CrossRef]
- Chaouachi, M.; Frasson, C. Exploring the Relationship between Learner EEG Mental Engagement and Affect. In Proceedings of the Intelligent Tutoring Systems, Pittsburgh, PA, USA, 14–18 June 2010; Aleven, V., Kay, J., Mostow, J., Eds.; Springer: Berlin/Heidelberg, Germany, 2010; pp. 291–293. [Google Scholar]
- Huang, W.; Roscoe, R.D.; Johnson-Glenberg, M.C.; Craig, S.D. Motivation, engagement, and performance across multiple virtual reality sessions and levels of immersion. J. Comput. Assist. Learn. 2021, 37, 745–758. [Google Scholar] [CrossRef]
- Brinck, I.; Reddy, V. Dialogue in the making: Emotional engagement with materials. Phenomenol. Cogn. Sci. 2020, 19, 23–45. [Google Scholar] [CrossRef]
- Ley, C.; Martin, R.K.; Pareek, A.; Groll, A.; Seil, R.; Tischer, T. Machine learning and conventional statistics: Making sense of the differences. Knee Surg. Sport. Traumatol. Arthrosc. 2022, 30, 753–757. [Google Scholar] [CrossRef]
- Zhou, Z.H.; Zhou, Z.H. Ensemble Learning; Springer: Berlin/Heidelberg, Germany, 2021. [Google Scholar]
- Chen, T.; Guestrin, C. Xgboost: A scalable tree boosting system. In Proceedings of the 22nd Acm Sigkdd International Conference on Knowledge Discovery and Data Mining, San Francisco, CA, USA, 13–17 August 2016; pp. 785–794. [Google Scholar]
- Graham, J.; Olchowski, A.; Gilreath, T. Review: A gentle introduction to imputation of missing values. Prev. Sci. 2007, 8, 206–213. [Google Scholar] [CrossRef]
- Lundqvist, M.; Herman, P.; Lansner, A. Theta and Gamma Power Increases and Alpha/Beta Power Decreases with Memory Load in an Attractor Network Model. J. Cogn. Neurosci. 2011, 23, 3008–3020. [Google Scholar] [CrossRef]
- Strijbosch, W.; Vessel, E.A.; Welke, D.; Mitas, O.; Gelissen, J.; Bastiaansen, M. On the Neuronal Dynamics of Aesthetic Experience: Evidence from Electroencephalographic Oscillatory Dynamics. J. Cogn. Neurosci. 2022, 34, 461–479. [Google Scholar] [CrossRef] [PubMed]
- Prochnow, A.; Eggert, E.; Münchau, A.; Mückschel, M.; Beste, C. Alpha and Theta Bands Dynamics Serve Distinct Functions during Perception—Action Integration in Response Inhibition. J. Cogn. Neurosci. 2022, 34, 1053–1069. [Google Scholar] [CrossRef] [PubMed]
- Sauseng, P.; Griesmayr, B.; Freunberger, R.; Klimesch, W. Control mechanisms in working memory: A possible function of EEG theta oscillations. Neurosci. Biobehav. Rev. 2010, 34, 1015–1022. [Google Scholar] [CrossRef]
- Li, G.; Anguera, J.A.; Javed, S.V.; Khan, M.A.; Wang, G.; Gazzaley, A. Enhanced Attention Using Head-mounted Virtual Reality. J. Cogn. Neurosci. 2020, 32, 1438–1454. [Google Scholar] [CrossRef]
- Juliano, J.M.; Spicer, R.P.; Vourvopoulos, A.; Lefebvre, S.; Jann, K.; Ard, T.; Santarnecchi, E.; Krum, D.M.; Liew, S.L. Embodiment Is Related to Better Performance on a Brain—Computer Interface in Immersive Virtual Reality: A Pilot Study. Sensors 2020, 20, 1204. [Google Scholar] [CrossRef]
- Berka, C.; Levendowski, D.; Lumicao, M.; Yau, A.; Davis, G.; Zivkovic, V.; Olmstead, R.; Tremoulet, P.; Craven, P. EEG correlates of task engagement and mental workload in vigilance, learning, and memory tasks. Aviat. Space Environ. Med. 2007, 78, B231–B244. [Google Scholar] [PubMed]
- Chaouachi, M.; Frasson, C. Mental Workload, Engagement and Emotions: An Exploratory Study for Intelligent Tutoring Systems. In Proceedings of the Intelligent Tutoring Systems, Chania, Greece, 14–18 June 2012; Cerri, S.A., Clancey, W.J., Papadourakis, G., Panourgia, K., Eds.; Springer: Berlin/Heidelberg, Germany, 2012; pp. 65–71. [Google Scholar]
- Abdelrahman, Y.; Hassib, M.; Marquez, M.G.; Funk, M.; Schmidt, A. Implicit Engagement Detection for Interactive Museums Using Brain-Computer Interfaces. In Proceedings of the 17th International Conference on Human-Computer Interaction with Mobile Devices and Services Adjunct, Copenhagen, Denmark, 24–27 August 2015; MobileHCI’15. Association for Computing Machinery: New York, NY, USA, 2015; pp. 838–845. [Google Scholar] [CrossRef]
- Safaryan, K.; Mehta, M. Enhanced hippocampal theta rhythmicity and emergence of eta oscillation in virtual reality. Nat. Neurosci. 2021, 24, 1065–1070. [Google Scholar] [CrossRef] [PubMed]
- EMOTIV. Contact Quality (CQ) vs. EEG Quality (EQ). EmotivPro v3.0. 2023. Available online: https://emotiv.gitbook.io/emotivpro-v3/emotivpro-menu/contact-quality-map/contact-quality-cq-vs.-eeg-quality-eq (accessed on 21 August 2023).


| Questioned Indicator | Question | Answers | ||
|---|---|---|---|---|
| Valence | How do you rate the emotion evoked by the handicraft? | negative | neutral | positive |
| Arousal | How did the handicraft make you feel? | calm | neutral | excited |
| Engagement | How do you rate your level of engagement? | not engaged | neutral | engaged |
| Mean_Phase1 | StdDev_Phase1 | Variance_Phase1 | CV_Phase1 | Median_Phase1 | |
|---|---|---|---|---|---|
| Theta | 8.38 | 7.60 | 57.79 | 90.73 | 5.50 |
| Alpha | 2.5 | 1.61 | 2.60 | 64.09 | 1.93 |
| Beta | 2.39 | 1.13 | 1.28 | 47.50 | 2.02 |
| Gamma | 0.68 | 0.38 | 0.14 | 55.69 | 0.62 |
| Mean_Phase2 | StdDev_Phase2 | Variance_Phase2 | CV_Phase2 | Median_Phase2 | |
|---|---|---|---|---|---|
| Theta | 12.71 | 13.69 | 187.51 | 107.74 | 7.33 |
| Alpha | 4.41 | 4.68 | 21.88 | 106.16 | 2.57 |
| Beta | 4.71 | 3.47 | 12.05 | 73.73 | 3.87 |
| Gamma | 2.26 | 2.92 | 8.52 | 129.02 | 1.49 |
| Mean_Phase1 | StdDev_Phase1 | Variance_Phase1 | CV_Phase1 | Median_Phase1 | |
|---|---|---|---|---|---|
| Theta | 9.09 | 6.80 | 46.29 | 74.87 | 7.08 |
| Alpha | 3.25 | 2.29 | 5.24 | 70.48 | 2.68 |
| Beta | 3.38 | 2.02 | 4.07 | 59.66 | 3.01 |
| Gamma | 1.23 | 0.95 | 0.91 | 77.86 | 0.97 |
| Mean_Phase2 | StdDev_Phase2 | Variance_Phase2 | CV_Phase2 | Median_Phase2 | |
|---|---|---|---|---|---|
| Theta | 8.90 | 11.77 | 138.44 | 132.13 | 4.13 |
| Alpha | 3.32 | 3.48 | 12.10 | 104.86 | 2.25 |
| Beta | 3.50 | 2.52 | 6.37 | 72.05 | 2.69 |
| Gamma | 1.29 | 1.06 | 1.13 | 82.52 | 0.99 |
Disclaimer/Publisher’s Note: The statements, opinions and data contained in all publications are solely those of the individual author(s) and contributor(s) and not of MDPI and/or the editor(s). MDPI and/or the editor(s) disclaim responsibility for any injury to people or property resulting from any ideas, methods, instructions or products referred to in the content. |
© 2023 by the authors. Licensee MDPI, Basel, Switzerland. This article is an open access article distributed under the terms and conditions of the Creative Commons Attribution (CC BY) license (https://creativecommons.org/licenses/by/4.0/).
Share and Cite
Castiblanco Jimenez, I.A.; Nonis, F.; Olivetti, E.C.; Ulrich, L.; Moos, S.; Monaci, M.G.; Marcolin, F.; Vezzetti, E. Exploring User Engagement in Museum Scenario with EEG—A Case Study in MAV Craftsmanship Museum in Valle d’Aosta Region, Italy. Electronics 2023, 12, 3810. https://doi.org/10.3390/electronics12183810
Castiblanco Jimenez IA, Nonis F, Olivetti EC, Ulrich L, Moos S, Monaci MG, Marcolin F, Vezzetti E. Exploring User Engagement in Museum Scenario with EEG—A Case Study in MAV Craftsmanship Museum in Valle d’Aosta Region, Italy. Electronics. 2023; 12(18):3810. https://doi.org/10.3390/electronics12183810
Chicago/Turabian StyleCastiblanco Jimenez, Ivonne Angelica, Francesca Nonis, Elena Carlotta Olivetti, Luca Ulrich, Sandro Moos, Maria Grazia Monaci, Federica Marcolin, and Enrico Vezzetti. 2023. "Exploring User Engagement in Museum Scenario with EEG—A Case Study in MAV Craftsmanship Museum in Valle d’Aosta Region, Italy" Electronics 12, no. 18: 3810. https://doi.org/10.3390/electronics12183810
APA StyleCastiblanco Jimenez, I. A., Nonis, F., Olivetti, E. C., Ulrich, L., Moos, S., Monaci, M. G., Marcolin, F., & Vezzetti, E. (2023). Exploring User Engagement in Museum Scenario with EEG—A Case Study in MAV Craftsmanship Museum in Valle d’Aosta Region, Italy. Electronics, 12(18), 3810. https://doi.org/10.3390/electronics12183810