Abstract
In recent years, extreme weather has occurred frequently, and the risk of heavy rainfall and flooding faced by the people has risen. It is therefore an urgent requirement to carry out applied research on heavy rainfall and flooding risk assessment. We took Henan Province, where a major flood disaster occurred in 2021, as an example to analyze the impact factors of urban flooding and conduct a risk assessment. Indicators were first selected from population, housing, and the economy, and correlation analysis was used to optimize the indicator system. Then, a deep clustering network model based on a stacked denoising autoencoder (SDAE) was constructed, the feature information implied in the disaster indicators was abstracted into potential features through the coding and decoding of the network, and a small number of potential features were used to express the complex relationship between the disaster indicators. The results of the study show that the high-risk areas of flood damage in Henan Province in 2021 account for 2.3%, the medium-risk areas account for 9.4%, and the low-risk areas account for 80.3%. These evaluation results are in line with the actual situation in Henan Province, and the division of the grade in some areas is more reasonable compared with the entropy weighting method, which is a commonly used method of disaster assessment. The new model does not need to calculate weights to cope with changes in indicators and disaster conditions. The research results can provide scientific reference for urban flood risk management, disaster prevention and mitigation, and regional planning.
1. Introduction
China is located on the East Asian continent. Because it is affected by the continental monsoon climate and its special geographical location, flood disasters have become one of the important natural disasters affecting China [1]. As the frequency and intensity of extreme weather events have increased, floods have also become more frequent [2]. All kinds of sewage and garbage are carried in floods, which seriously threatens the ecological environment and social development [3]. In addition, the rapid urbanization process has led to the rapid accumulation of population and wealth in the floodplains of major river basins in China and along the banks of the rivers, and the risks and losses caused by flood disasters are showing an increasing trend [4]. According to the information published in the «China Flood and Drought Disaster Prevention Bulletin 2021» [5] published on the official website of the Ministry of Water Resources, floods of different degrees have occurred in 30 provinces across the country. A total of 59.0101 million people have been affected by floods, 590 people have died or are missing, and the direct economic loss is CNY 245.892 billion, accounting for 0.22% of GDP that year. Flood disasters have emerged as a significant concern for human society [6].
A lot of research and exploration work has been carried out in the direction of flood disaster loss assessment at home and abroad, and remarkable results have been achieved. In terms of index selection, Zhao et al. [7] selected rainfall, water level, and water volume for evaluation; Saha et al. [8] used land data to determine the risk of flood disasters in the study area; Mo et al. [9] constructed a risk assessment index system based on remote sensing, meteorological, geographic, and social data. The evaluation methods have gone through a process of change from the historical disaster situation method to the index system method. Li et al. [10] conducted flood risk analysis using a regression method grounded in historical disaster statistical data. Vahid et al. [11] and Li et al. [12] employed the Analytic Hierarchy Process (AHP) to assign weights to the gathered disaster indicators and create a flood risk map for Bandar Abbas in southern Iran. Li et al. [13] used the entropy weight method to evaluate the flood vulnerability of 31 provinces across the country, making the comprehensive evaluation and zoning of flood disaster vulnerability more reasonable. Cheng et al. [14] obtained the weight indicators of flood factors in various villages in Nanchang by combining the AHP and the entropy weight method and drew a distribution map of flood disaster risk assessment in Nanchang.
In recent years, deep learning has achieved rapid development in the field of flood comprehensive loss assessment [15]. In response to the complexity and ambiguity of comprehensive flood loss assessment, researchers both domestically and internationally have employed methods such as neural networks to conduct integrated evaluations of flood disaster losses, achieving notable research outcomes. Huang et al. [16] used a BP neural network to evaluate the flood loss in the Taihu Lake Basin. Chen et al. [17] used the random forest algorithm and neural network to construct and apply a flood disaster loss risk assessment model. Gao et al. [18] showed that the flood disaster loss assessment based on the BP neural network has the characteristics of self-learning and associative memory.
However, there are certain shortcomings in the above results. For example, the selection of comprehensive loss assessment indicators is not comprehensive enough to reflect the comprehensive nature of the comprehensive loss assessment of flood disasters. At the same time, there is also the selection of some low-relevant indicators, which leads to a certain limitation of the assessment results obtained. In the case of a large number of disaster indicators, the workload of manually screening and comparing the social impact indicators of flood disasters is large. Therefore, in the face of the severe flood disaster situation, we urgently need to carry out research on a fast and accurate comprehensive flood damage assessment method. A new method is urgently needed to realize the comprehensive selection of indicators in the case of a large number of disaster indicators, and at the same time reduce the workload of manual screening, downsizing the data, and improving work efficiency.
In this paper, we propose a new method for flood disaster rating assessment: the stacked denoising autoencoder clustering (SDAE-Clustering) model, which integrates a denoising autoencoder and clustering after the SDAE dimensionality reduction of the potential features to represent the original indicator data and the potential characteristics of the potential clustering in order to obtain the flood disaster rating of each region. It is used to solve the situation of facing a large amount of indicator data, and at the same time reduce the influence of correlation between indicators on the evaluation results.
The main contributions of the proposed SDAE-Clustering model are as follows:
- The proposed model innovates in the selection of evaluation indices, selects assessment indices for the disaster situation and geographic location of Henan Province in 2021, and uses index correlation to de-correlate the low-correlation indices so as to construct a new index system for assessing the comprehensive loss of flood disasters.
- The SDAE-Clustering model reduces the number of indicator data dimensions and utilizes potential features to represent the original data, which improves the clustering speed, reduces the amount of computation, and improves the computational efficiency. The model solves the problem that traditional methods such as entropy weighting need to reassess the weights when facing new disaster environments, and is able to learn from high-dimensional data while capturing nonlinear relationships in the data.
Section 2.1 introduces the study area and data sets, Section 2.2 introduces the comprehensive assessment of flood disaster loss using the traditional entropy method. Section 2.3 gives a brief introduction to autoencoders, denoising autoencoders, and stacked denoising autoencoders. Section 3.1 describes the selection of indicators for the comprehensive evaluation of flood disaster losses. In Section 3.2, the correlation analysis of the indicators is carried out, and the low-correlation indicators are eliminated to complete the construction of the indicator system. In Section 3.3, the general framework of the SDAE-Clustering model is given, and the SDAE and the clustering are presented.
2. Related Work
2.1. Study Area
Henan Province is located in central China and is rich in natural resources. Its temperate monsoon climate has four distinct seasons, with rainfall concentrated in the summer months, often exposing it to the risk of flooding and drought. The population is mainly located in the plains and the economy is diversified, with agriculture, industry, and services as the main pillars. Zhengzhou, the provincial capital, and its surrounding cities are densely populated and central to economic development. On 20 July 2021, a widespread extreme rainfall event in Henan Province caused severe damage to the province, with 1048.5 khm2 of crops affected, 18,000 homes collapsed, 46,400 severely damaged, and 135,400 generally damaged; 302 people died, and 50 people were reported missing, of which, in Zhengzhou City, 292 people were killed, and 47 people were missing [19]. This unprecedented heavy rainfall event occurred under the climatic conditions of the western Pacific subtropical high-pressure system abnormally shifting northward, strong summer winds, and the convergence of two typhoons during the same period, which transported a significant amount of moisture from the sea. When this moist air mass overlapped with the convective systems over the skies of Henan and coincided with the topographical uplift provided by the Funiu Mountains and Taihang Mountains, it resulted in an exceptionally rare and intense heavy rainfall event. This event had a devastating impact on the entire province of Henan. The heavy rainfall intensified as it moved from west to east over Zhengzhou City, and combined with the convergence of river flooding. Furthermore, Zhengzhou’s topography, with higher elevations in the southwest and lower elevations in the northeast, transitions from hilly terrain to plains, exacerbating the flood and causing severe flooding both from external sources and local waterlogging [20]. Therefore, the selection of Henan Province as the study area has certain practical significance.
Dataset
The sample data were obtained from the information published in the «China Flood and Drought Disaster Defense Bulletin 2021» [5] and the original data on flood damage losses in a total of 127 urban counties in Henan Province in 2021 provided by the National Department of Emergency Response and Disaster Reduction (NDERR).
The amount of rainfall (mm) was expressed as A1, while the number of collapsed and severely damaged houses (10,000) and rate of collapsed and severely damaged houses per 10,000 people (%) were expressed as A2 and A3, respectively. Deaths and disappearances due to disasters (10,000), the rate of deaths and disappearances per 10,000 people (%), and the transfer rate per 10,000 persons (%) were expressed as A4, A5, and A6, respectively. Area affected by crops (km2) was expressed as A7. Losses in industry, mining, and commerce (ten thousand CNY), public services (ten thousand CNY), and roads (km) are represented by A8, A9, and A10, respectively. The 127 areas are numbered from Y001 to Y127. Some of the data are shown in Table 1.

Table 1.
Part of Experimental Dataset.
2.2. Comprehensive Loss Assessment of Flood Disaster Based on the Entropy Weight Method
The Entropy Weight (EW) method determines the weight of indicators [21] according to the amount of information transmitted by each indicator. This method can reflect the importance and difference among indicator data, and the evaluation results are objective [22]. The entropy weight method is mainly divided into three steps in the comprehensive loss assessment of a flood disaster. Firstly, the comprehensive loss assessment index of the flood disaster is determined. Secondly, the comprehensive loss index of the flood disaster is calculated using the entropy weight method. Thirdly, the comprehensive loss level of the flood disaster is calculated. The specific process is as follows:
- (1)
- Determine flood disaster loss assessment indicators.Selection of indicators for flood damage assessment based on the geographical location of the study area and other factors.
- (2)
- Calculate the comprehensive loss index of flood disaster.The entropy weight method has four steps to calculate the comprehensive loss index of flood disaster [23], namely, establishing the evaluation index matrix, calculating the information entropy, calculating the weight of the comprehensive loss index of flood disaster, and calculating the comprehensive loss index of flood disaster.
- (3)
- Calculate the comprehensive loss level of flood disaster.The optimal segmentation method is a commonly used comprehensive loss level classification method, which has been widely used in natural science fields such as hydrology, meteorology, and earthquakes [24]. The optimal segmentation method maximizes the difference between segments and minimizes the difference within segments [25]. Since the total sum of squared deviations composed of the sum of squared deviations between segments and the sum of squared deviations within segments is a fixed value, the segmentation method that minimizes the sum of squared deviations within each segment is regarded as the optimal segmentation [26].
The flow chart of calculating the comprehensive loss level of flood disaster using the entropy weight method is shown in Figure 1.
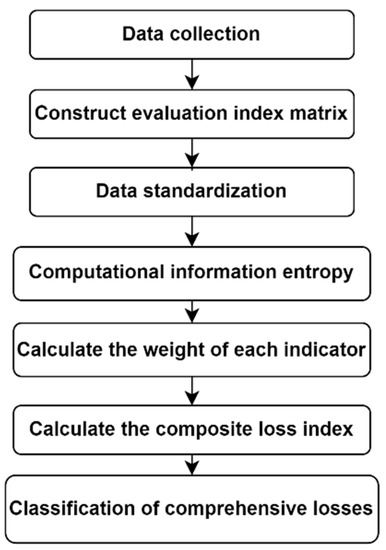
Figure 1.
Flowchart for calculating disaster level via EW.
2.3. Autoencoder
Autoencoders represent a well-established unsupervised learning technique, with the earliest conception being introduced by Rumelhart et al. [27] in their seminal Nature paper. The autoencoder’s encoding process involves transforming high-dimensional inputs into low-dimensional hidden layers, while the decoding process entails converting the low-dimensional hidden layers back into high-dimensional output layers. The loss function is defined by comparing input and output disparities, aiming to enhance the alignment between network inputs and outputs. Within the autoencoder framework, unsupervised learning enables the extraction of features from hidden layers and the acquisition of parameter adjustments. A schematic depiction of the autoencoder’s architecture is illustrated in Figure 2.
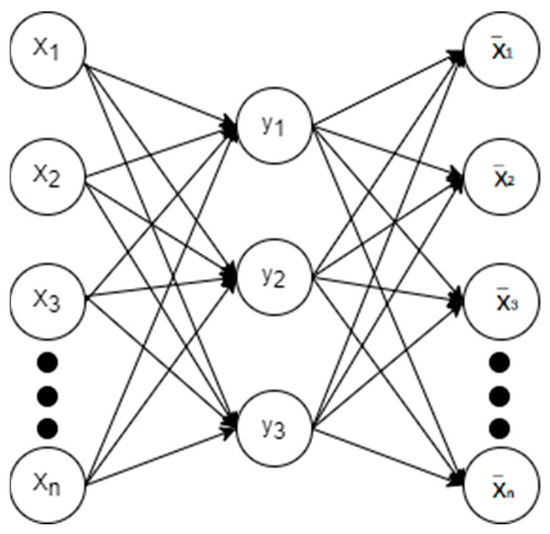
Figure 2.
Self-coding network architecture.
2.3.1. Denoising Autoencoder
The denoising autoencoder (DAE) [28], a derivative of the autoencoder, was designed to alleviate the impact of noise inherent in training data. By introducing noise to the data samples and subsequently training the autoencoder to reconstruct the data to closely resemble the original samples, DAE aims to diminish the disruptive effects of noise on feature extraction [29]. This process ultimately enhances data quality and reliability. The structure of the DAE is shown in Figure 3.
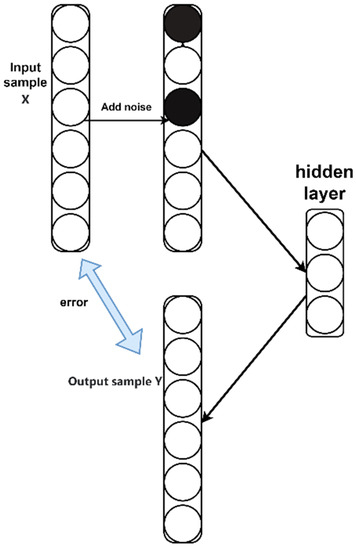
Figure 3.
Denoising Autoencoder Structure.
To add random distribution noise to the training sample , Equation (1) is as follows:
This is done by first corrupting the initial input into by means of a stochastic mapping [30]. In the formula, is the sample after adding noise; is random noise with a binomial distribution, indicates a mapping.
2.3.2. Stacked Denoising Autoencoder
A stacked denoising autoencoder (SDAE) comprises multiple denoising autoencoders stacked layer by layer, where each denoising encoder’s output serves as the input for the subsequent encoder layer. This layered arrangement creates a model structure consisting of interconnected DAE layers, facilitating improved feature expression. Vincent et al. [30] introduced the SDAE network model, which not only prevents the autoencoder from solely learning the identity mapping between input and reconstructed output but also captures more effective representations from noisy data. In comparison to a regular autoencoder network, SDAE’s learned features exhibit greater robustness. The architecture of the SDAE network is depicted in Figure 4.
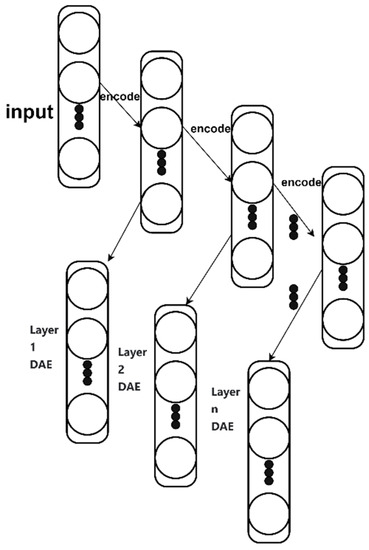
Figure 4.
Stacked denoising autoencoder structure.
3. Methodology
Flood disaster is the result of a combination of disaster-causing factors, disaster-inducing environment, disaster-bearing body, etc. [31]. The process of flooding disaster is the formation of disaster by the action of disaster-causing factors on the disaster-bearing body in a specific disaster-conceiving environment. The relationship between flood hazard and impact factors is complex, multivariate, and non-linear, and is closely related to the geology, geomorphology, land cover, and other factors in the study area. For a specific study area, collecting impact factors that are as comprehensive as possible and optimizing their selection is the prerequisite and guarantees accurate flood assessment [32].
3.1. Selection of Comprehensive Loss Assessment Index for Flood Disaster
Before constructing the SDAE-Clustering model for comprehensive loss assessment of flood disasters in Henan Province, it is necessary to determine the index system for comprehensive loss assessment of flood disasters in Henan Province. Establishing a comprehensive loss assessment index system for flood disasters needs to follow the principles of science, objectivity, rationality, and comprehensiveness [33]. This task is challenging because flood disasters are affected by a variety of factors, such as rainfall conditions, topography, degree of urbanization, and disaster prevention facilities. Therefore, the analysis and judgment need to follow certain principles to solve this challenge. To be able to reflect the actual situation of flood risk in Henan Province, the following directions are taken into account in constructing a new and suitable assessment system for Henan Province to select indicators.
(1) Disaster-causing factors are the driving factors that cause disasters. Usually, the greater the intensity and the higher the frequency of the disaster-causing factors, the greater the damage caused and the higher the disaster risk. Rainfall is the main disaster-causing factor for flooding, and the larger the cumulative value of rainfall in a short period, the higher the possibility of flooding. Therefore, rainfall (mm) is an important indicator for assessing and predicting floods.
(2) The disaster-bearing body refers to the social subject affected by the disaster, which is the direct object of the flood disaster. The disaster loss is not only related to the intensity of the disaster-causing factor but also to the disaster-bearing object [34]. The disaster-bearing objects include human beings, property, and natural resources. The more concentrated the population and property, the greater the loss caused by flooding and the higher the vulnerability. The safety of human life is of utmost importance, and understanding the impact of disasters on the population is a priority. Housing is a basic need for people, and damage can lead to a decline in the quality of life for residents, requiring special attention. Economic damage is related to employment, industry, and social stability, and is crucial to post-disaster reconstruction programs. Therefore, population, housing, and economy are the core elements in the comprehensive damage assessment of floods [35].
- (a)
- Population losses.
Floods can cause a large number of people to be injured or go missing, and may even lead to death. The number of people who die, the number of people who go missing, the number of people who are injured or sick, the number of people who are relocated in an emergency (people who are moved from a dangerous area to a safe area and who need to be provided with a temporary livelihood), the number of people who need emergency livelihood assistance, and the number of people who have difficulty in drinking water, etc., are all indicators that characterize the extent of the damage caused by natural disasters. Without taking into account the “population in need of emergency livelihood assistance” and the “population in need of drinking water”, the selected indicators “Deaths and disappearances due to disasters (10,000)”, “The rate of deaths and disappearances per 10,000 people (%)”, and “Transfer rate per 10,000 persons (%)”, provide important information on the impact of natural disasters on the population in terms of life safety, physical health, and the living environment, among other things. These data can be used to assess and respond to the urgency and severity of natural disasters.
- (b)
- Housing losses.
Floods may cause damage to the physical structure of houses, and the impact and inundation of floodwaters may damage or disintegrate the building materials. In the aftermath of a flood, some homes may be uninhabitable due to severe damage, and occupants may need to find temporary housing. We will pay special attention to two key indicators related to housing losses: “Proportion of collapsed and severely damaged houses per 10,000 population (%)” and “Number of collapsed + severely damaged house rooms (rooms)”. This is because these two indicators provide us with visual information on the actual extent of damage to houses caused by flooding. “Rate of collapsed and severely damaged houses per 10,000 population (%)” tells us, as a percentage, how many houses per 10,000 people have collapsed or been severely damaged, which helps to assess the threat posed by the disaster to the safety of the population’s livelihoods. The “Number of collapsed + severely damaged house rooms” provides more specific data on how many houses were directly damaged in the floods, which can be used to estimate the resource requirements for repair and reconstruction.
- (c)
- Crop damage.
Floods can cause different degrees of damage to crops, and crop damage due to floods can be characterized by inundation, damage, soil erosion, crop failure, etc. Choosing the area of crop damage (km2) as an indicator is a common way of assessing the impact of floods on agriculture. This indicator is commonly used to measure the direct losses suffered by crops during disasters and can provide important information about food production and the rural economy [36].
- (d)
- Economic losses.
In analyzing the economic losses of floods, we focused on three areas: “Industrial, mining and commercial losses (ten thousand CNY)”, “Public service losses (ten thousand CNY)” and “Road losses (km)”. This is because these areas usually assume important economic functions after a disaster, and their damage will directly affect the functioning of the local economy and the quality of life of residents. Damage to the industrial, mining, and commercial sectors can lead to production disruptions and employment problems; damage to public services can threaten the satisfaction of basic livelihood needs; and damage to roads can have a significant impact on transportation and logistics. We therefore focus on damages in these areas to better understand the impact of flooding on the local and overall economy and thus provide targeted information for post-disaster recovery and resource allocation [37].
3.2. Analysis of Flood Loss Evaluation Index
Following the selection of disaster indicators, a correlation analysis method is employed to assess the interrelation among these indicators [38]. This involves scrutinizing the correlation coefficients between the indicators and the disaster loss index. Through this analysis, the extent of correlation between the chosen indicators and the disaster loss index is determined, enabling the construction of a comprehensive flood loss assessment index tailored to Henan Province.
In this study, the correlation coefficient was used to study the degree of linear correlation between the flood comprehensive loss index and disaster index, which is represented by the letter . Equation (2) is as follows:
where is the covariance of X and Y, is the variance of X, and is the variance of Y.
The relationship between the correlation coefficient and indicators is shown in Table 2. A correlation coefficient of indicates a significant relationship between indicators, indicates that the indicators are highly correlated, means that the index is moderately correlated, means that the index is low correlation, and means that the correlation of the indicator is extremely weak.
Table 2.
The relationship between correlation coefficients and index.
The disaster index presented in Table 3 is determined through the application of the entropy weight method within the conventional evaluation framework. Serving as an objective weighting approach, the entropy weight method effectively captures the significance and disparities among the indicator data, thereby ensuring objective evaluation outcomes. In this context, the correlation between the indicators and the disaster index serves as a pivotal criterion for indicator selection. By examining the correlation between the indicators and their influence on the disaster index, the evaluation indicators are judiciously chosen.
Table 3.
Correlation coefficient among indicators.
Table 3 reveals that the disaster index exhibits correlations with nine factors: rainfall, houses that have collapsed or suffered severe damage, the rate of such houses, fatalities and missing individuals due to disasters, the rate of fatalities and missing individuals, relocation rate, loss in industry, mining, and commerce, loss in public services, and road damage. All the correlation coefficients of these indicators surpass 0.5, indicating at least a moderate level of correlation. The highest correlation coefficient is attributed to the volume of rainfall (0.80), followed by house collapse and severe damage (0.76), road loss (0.70), fatality and missing person rate (0.68), fatalities and missing individuals due to disasters, as well as public service losses (0.67), losses in industry, mining, and commerce (0.65), the rate of severely damaged or collapsed houses (0.56), and the relocation rate (0.54). The indicator about crop-affected area exhibits a correlation coefficient of 0.4, which signifies a weaker and lower correlation with the disaster index. Based on the aforementioned data, it is evident that the chosen crop disaster area index does not adequately align with the comprehensive assessment requirements of flood disasters, leading to the decision to exclude A7.
Through the above analysis, it can be seen that, in the case of Henan floods, the comprehensive loss of floods is highly correlated with nine disaster indicators, including rainfall, road loss, house collapse and serious damage, industrial, mining and trade loss, and death and disappearance rate. Therefore, the above nine indicators are selected.
The selection of comprehensive loss assessment indicators for flood disasters is shown in Figure 5.
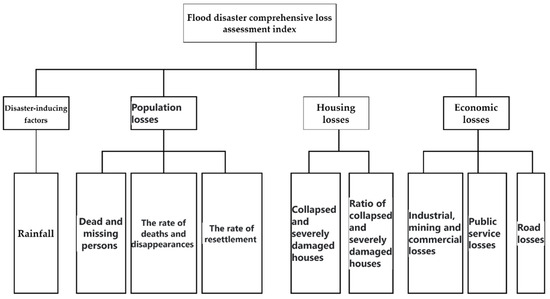
Figure 5.
Flood disaster comprehensive loss assessment index.
3.3. Overall SDAE-Clustering Model
3.3.1. SDAE Part
Figure 6 illustrates the overall framework of the SDAE-Clustering model. We inputted the n-dimensional vector data , added the noisy data to the original data via random mapping transformation , and then obtained the partially corrupted data . represents the data set.
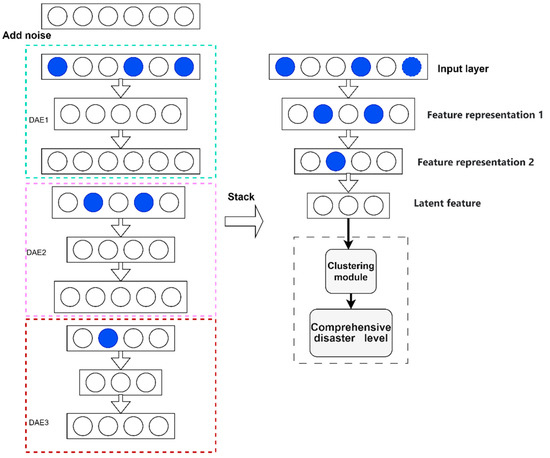
Figure 6.
The framework of the SDAE-Clustering model.
The n-dimensional vector is mapped into the m-dimensional hidden layer vector through the encoding function f, which is generally ordered as m < n to achieve a low-dimensional representation of the input data.
denotes the hidden feature information generated during the encoding process.
The specific stacking process for SDAE is as follows:
The first DAE occurs as follows:
Here, is the coding function and is the data after adding the noise, is the activation function from the input layer to the implicit layer sigmoid, represents the weight matrix from the input layer to the hidden layer in SDAE, represents the bias from the input layer to the hidden layer in the SDAE.
The decoder maps the implicit representation back to the reconstructed data , hoping that the reconstructed data is as close to the original as possible, as shown in Equation (4):
Here, is the decoding function, is the sigmoid of the activation function from the implicit layer to the output layer, is the reconstructed data. represents the weight matrix from the implied layer to the output layer in SDAE, and represents the bias from the implied layer to the output layer in SDAE.
Mapping each piece of input data to and reconstructing , and then successively optimizing the model parameters to obtain the smallest reconstruction error, SDAE uses the least square difference function when reconstructing the data to evaluate the error between the input data and the output data during the training process, as shown in Equation (5):
m is the number of samples used for training, represents the reconstructed samples, and represents the input samples.
SDAE updates the weights and biases of the encoding and decoding parts in each iteration to achieve better data reconstruction, and the corresponding weights and biases are updated by the gradient descent algorithm [39] to keep the error between the original data and the reconstructed data as small as possible.
The updating of weights and bias is done using the gradient descent algorithm, which is as follows in SDAE:
Here, denotes the learning rate, denotes the bias towards , and denotes the bias towards the weight .
After the first DAE is trained, the weights and biases of the output layer are removed, and only the weights and biases of the input and implicit layers are retained, with the implicit layer serving as the input to the next layer of the network. The training process of the second and third DAEs is the same as the previous one. When all the implicit layers are trained, the whole network is fine-tuned inversely, and the weights and biases of the whole network are adjusted by using the gradient descent method. The potential features can be extracted from the noisy data, which can effectively solve the overfitting problem of the network in the training process.
When the reconstruction error obtained from iterative computation is small, the SDAE model can reconstruct the original data from the “noisy” data, which can effectively solve the overfitting problem of the network in the training process. The low-dimensional data obtained after encoding are used as potential features. The feature information implied in the disaster indicators as potential features is abstracted to use a small number of potential features to achieve the expression of the complex relationship between the comprehensive disaster indicators, thus achieving the purpose of dimensionality reduction.
3.3.2. Clustering Part
The stacked SDAE network only has the feature extraction function, but cannot classify, so the potential features are clustered using k-means++ [40] to achieve a classification function. The process of k-means++ is shown below:
Step 1: Randomly select cluster centers in .
Step 2: Calculate the shortest distance from sample point to .
Step 3: Calculate the probability that each x is selected as the clustering center [41], as shown in Equation (7).
Here, represents the sample point; is the shortest distance from the sampling point x to the cluster center c; is the sample set.
Step 4: Loop to select the next clustering center .
Step 5: Repeat steps 2–4 until clusters are selected centers .
Step 6: Calculate the distance between each data in and the cluster center, and divide it into the corresponding cluster [42].
Step 7: Update the clustering center as shown in Equation (8).
Here, is the i-th cluster center. is the number of clustering centers.
Step 8: Repeat steps 6–7 until the center of clustering no longer changes.
Through the encoding and decoding reconstruction process of SDAE, the use of latent features can accurately express all indicators. At the same time, the use of latent features increases the clustering speed, reduces the amount of calculation, and improves the calculation efficiency.
3.3.3. Classification Part
After clustering the potential feature samples, the affected locations with different severity levels are grouped into different classes, and exactly which class is determined based on the input data for each class. Statistics such as mean, median, variance, etc. of the most representative data are calculated for each category and the classes are sorted according to their size. Figure 7 is the flowchart of the whole SDAE-Clustering model.
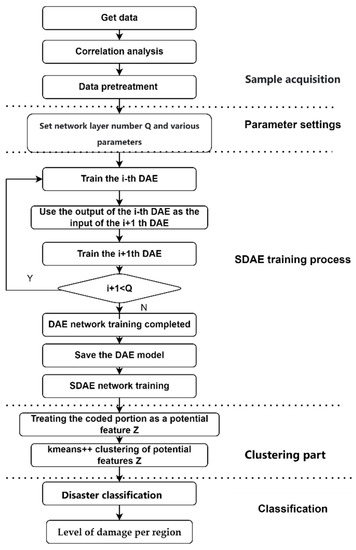
Figure 7.
Overall flowchart of SDAE-Clustering model.
4. Experimental Results
4.1. Result of Entropy Weight Method
Using the entropy weighting method in Section 2.2, the weights of the selected nine indicators were first calculated (as in Table 4), and then the comprehensive loss index of flood disasters in Henan Province was calculated via weighting; the higher the loss index, the more serious the disaster suffered. Then, the optimal segmentation method was utilized to segment the comprehensive loss index of flood disaster calculated via the entropy weighting method. The comprehensive loss indices of flood disaster of the two segmented nodes calculated are 0.35 and 0.20. Finally, the damage level of each region was obtained (as Table 5). Grade 1 is less severely affected, grade 2 is the second most affected, and grade 3 is the most severely affected.
Table 4.
Entropy weighting method to calculate the weight of each indicator.
Table 5.
Flood disaster comprehensive loss index and grade (entropy weight method).
4.2. Result of SDAE-Clustering Model
4.2.1. Comparison of Network Structures
In the process of SDAE network training, network parameters of a reasonable set of results are very important. The reasonable settings of the parameters such as the number of nodes in the input layer, the number of hidden layers, the number of neurons in the hidden layer, and the sparse coefficient can greatly improve the network performance. The network parameters of SDAE are shown in Table 6.
Table 6.
SDAE network parameters.
The training performance of the SDAE network is intimately tied to the number of network layers and the count of neurons within each hidden layer. Each DAE network is tasked with learning higher-order feature representations from the data. By interconnecting multiple DAE networks in a layered manner, the abstract features inherent in the data can be progressively extracted. The quantity of hidden layer neurons in each stratum governs the dimensionality and intricacy of the acquired features. The number of layers and nodes within the network significantly influences the extraction of the ultimate feature vector. An insufficient number of layers and nodes may fail to capture the intricate characteristics of the data, whereas an excessive amount might lead to overfitting. Hence, judiciously selecting a suitable number of layers and nodes is crucial to enhance accuracy.
The accuracy of this study is the result of comparison with the entropy weight method. To find the best network parameters, a comparison of the accuracy under different network structures was performed. The performance of each network structure on the feature extraction task was evaluated by trying different combinations of the number of network layers and the number of hidden layer neuron nodes. By comparing the accuracy, the best network parameters were determined to obtain the optimal feature representation and classification performance. Table 7 shows that, when the network structure of 8-4-2 is selected, the comprehensive loss evaluation accuracy of the SDAE-Clustering model is the highest, which is 96.06%.
Table 7.
Accuracy of SDAE network under different network structures.
4.2.2. Effect of Network Noise Figure on Results
The denoising autoencoder network incorporates specific parameters to regulate the random concealment of a portion of the input data and then determines the nodes responsible for reconstructing the input data [43]. In the experiment, at a noise rate of 0.6, 60% of the input data is randomly obscured, with 40% of the nodes engaged in data reconstruction. Typically, the proportion of hidden input segments is kept below 0.5. As shown in Figure 8, the network performance is optimized when the noise rate is set to 0.2.
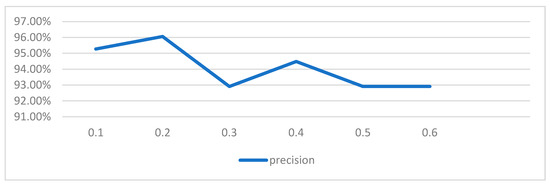
Figure 8.
Effect of different network noise coefficients on the results.
4.2.3. Effect Analysis of Comprehensive Loss Assessment Results of Flood and Waterlogging Disasters in Henan Province
Employ the K-means++ method to cluster the derived latent features, classifying them into three distinct categories. The clustering results of the comprehensive loss levels of flood disasters in Henan Province are shown in Figure 9.
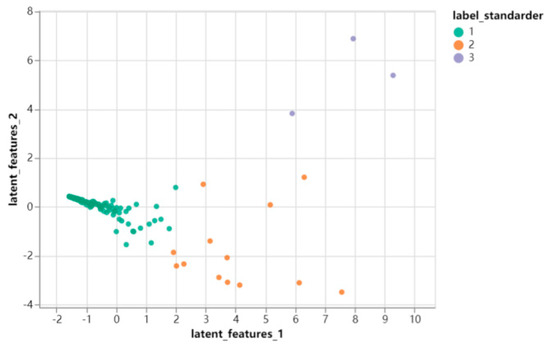
Figure 9.
Clustering results of comprehensive loss levels of flood disasters in Henan Province.
After clustering the samples of potential features, the affected locations with different severity were divided into different classes. We compared the raw data, calculated the average of the rainfall indicator in the raw data of each class, and ranked them in order from the largest to the smallest as 3, 2, and 1. The most severely affected category was set as rank 3, and the least affected area with the smallest average was set as rank 1 (as in Table 8). In this way, Henan Province was divided into high-risk, medium-risk, and low-risk areas, corresponding to rank 3, rank 2, and rank 1, respectively, and the ArcGIS 10.8 software was utilized to draw a map of the comprehensive degree of regional flood damage in Henan Province in 2021, as shown in Figure 10.
Table 8.
Flood disaster comprehensive loss Classification (SDAE-Clustering model).
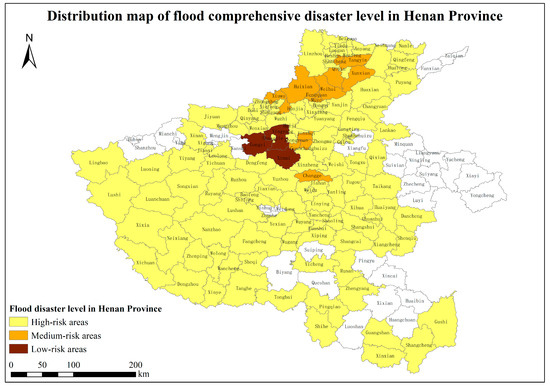
Figure 10.
Distribution map of comprehensive loss level of flood disasters in Henan Province.
In Figure 10, shades of color are used to indicate the extent to which different areas were affected. The higher the rating, the more flood damage suffered and the darker the color. In the figure, Xingyang, Gongyi, and Xinmi cities in Henan Province were the most severely affected, belonging to the high-risk zone totaling 2.3%, requiring emergency relief and post-disaster reconstruction work. Erqi District, Guancheng Huiyuan District, Jingshui District, and 12 other counties were more seriously affected, as medium-risk zones totaling 9.4%. Other districts were less affected, accounting for 80.3% of the low-risk zone.
4.3. Comparison between Entropy Weight Method and SDAE-Clustering Model
After using the two methods to derive the disaster level of each region, the analysis and comparison of the regions with different results are different in a total of five places, namely Y015, Y025, Y058, Y064, and Y086. Table 9 shows the disaster level calculated by the two methods in these five regions. Table 10 shows the raw data for the indicator for the relevant region.
Table 9.
Flood disaster comprehensive loss Classification.
Table 10.
Indicator raw data for relevant regions.
Y036 used the entropy weight method and SDAE-Clustering model to classify grade 2 areas. Although Y064 and y086 experienced A8 (Losses in industry, mining and commerce) A9 (public services) and A10 (roads) caused by the higher economic losses, they saw fewer collapsed houses, as can be seen from the table, and there were no casualties; the safety of human life is the most important factor. The classification of y064 and y086 using the SDAE-Clustering model is more reasonable. Relative to the entropy weight method, the SDAE-Clustering model of flood disaster comprehensive loss evaluation results are 96% the same as those of the entropy weight method, also shows that the results of the SDAE-Clustering model calculated in this paper and the entropy weight method have a high degree of consistency in the results of the calculations.
4.4. Analyzing the Disaster in Zhengzhou City, Henan Province
On 20 July 2021, Zhengzhou City in Henan Province was hit by an extreme rainstorm disaster. The continuous heavy rainfall triggered serious consequences such as urban flooding, river flooding, and transportation paralysis, resulting in a large number of casualties and property losses. The regional disaster levels delineated by the SDAE-Clustering model are analyzed below.
Figure 11 shows a comparison of data for each indicator in 12 districts and counties in Zhengzhou, Henan Province. Among them, the index A8 of Guancheng district is the largest, the index A9 of Gongyi City is the largest, and the indices A4 (missing persons) and A5 (mortality rate) of Xingyang City are the largest. These three areas are the most severely affected, and the grade classification is in line with the actual loss situation.
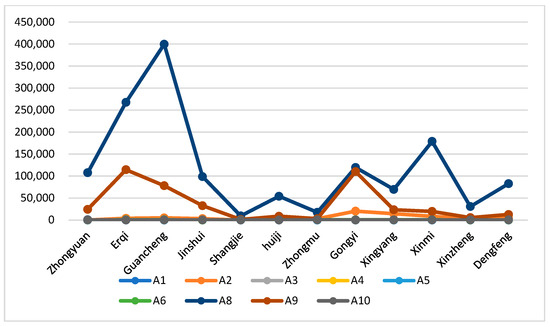
Figure 11.
Comparison of Flood Damage in Affected Districts and Counties.
Figure 12 shows the percentage of various disaster levels in Zhengzhou, among which two high-risk areas account for 16.67%, three medium-risk areas account for 25.0%, and seven low-risk areas account for 58.33%. The extremely serious disaster requires timely rescue and post-disaster reconstruction.
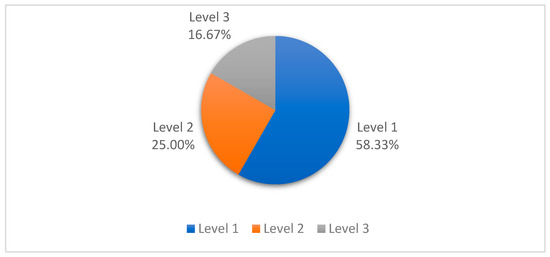
Figure 12.
Proportion of comprehensive loss level in affected districts and counties.
5. Conclusions
Aiming at the problem that the commonly used assessment methods cannot effectively portray the complex relationship between the disaster-causing factors of floods, this paper applies SDAE and clustering to the field of comprehensive loss assessment of floods, constructs a comprehensive loss assessment model of floods based on SDAE, solves the problem of indicator diversity, and through the coding and decoding of the indicators of the disaster situation, abstracts the feature information implied in the indicators of the disaster situation as potential features. By encoding and decoding the disaster indicators, abstracting the feature information implicit in the disaster indicators into potential features, and using a small number of potential features to express the complex relationship between the indicators, the 127 flood-affected areas in Henan Province were finally categorized into high, medium, and low, with a total of three grades. The model constructed in this paper was verified using common assessment methods. The model was consistent with the entropy weight method in terms of the overall regional classification, and the model was more reasonable than the entropy weight method in terms of the classification of some regions. Considering that the entropy weight method is one of the most commonly used disaster assessment methods, it can show that the comprehensive loss assessment model of flood disasters based on SDAE constructed in this paper is effective and can be applied in practical use. The model can even be applied to different disasters, because the entropy weight method can increase and replace the indicators in the face of the new disaster environment, and can re-determine the weights while using the model proposed in this paper, which can comfortably cope with the increase and decrease in indicators, the replacement of indicators, and so on. It provides a new way to study disaster prevention and reduction.
However, there are still some shortcomings, due to the difficulty of collecting data for some indicators, which may lead to the deviation of the final flood comprehensive loss level from the actual situation, and the range of the actual indicators selected should be expanded to make the results more accurate in the case of sufficient data. In the next step of the study, the focus is on the clustering module to improve the classification ability of the model.
Author Contributions
Y.C.: designed the experiments and wrote the first draft of the manuscript. Y.W.: data analysis. Z.W. and L.Z.: comments and editing of the experiments. W.L.: contributed to the concept and project management of the experiment. All authors have read and agreed to the published version of the manuscript.
Funding
This work was supported in part by the Anhui Provincial Natural Science Foundation under Grant (2108085J19) and in part by the National Nature Science Foundation of China under Grant (41871302) and the grant of Scientific Research and Talent Development Foundation of the Hefei University (No. 21-22RC15), the Program for Scientific Research Innovation Team in Colleges and Universities of Anhui Province (No. 2022AH010095). The Key Research Plan of Anhui 2022k07020011 and 202104d07020006, the open fund of Information Materials and Intelligent Sensing Laboratory of Anhui Province IMIS202205, as well as the AI General Computing Platform of Hefei University.
Institutional Review Board Statement
Not applicable.
Informed Consent Statement
Not applicable.
Data Availability Statement
Not applicable.
Conflicts of Interest
The authors declare that the research was conducted in the absence of any commercial or financial relationships that could be construed as a potential conflict of interest.
References
- Chen, H.; Sun, J. Changes in climate extreme events in China associated with warming. Int. J. Climatol. 2015, 35, 2735–2751. [Google Scholar] [CrossRef]
- Zhang, Q.; Li, J.; Singh, V.P.; Xiao, M. Spatio-temporal relations between temperature and precipitation regimes: Implications for temperature-induced changes in the hydrological cycle. Glob. Planet. Chang. 2013, 111, 57–76. [Google Scholar] [CrossRef]
- Ren, B.; Lu, H. Study on the control of pollutant migration and transformation in regional water environment after flood disaster. J. Catastrophol. 2021, 36, 28–31. [Google Scholar]
- Hu, S.; Chen, B.; Shi, P. Spatial and temporal patterns of heavy rainfall and flooding in China and the factors affecting them. J. Geogr. 2021, 76, 1148–1162. [Google Scholar]
- Summary of China’s flood and drought disaster defense bulletin 2021. China Flood Drought Control 2022, 32, 38–45.
- Guo, G.; Zhou, H. Prediction model of flood disaster field investigation based on MSN method. J. Catastrol. 2018, 33, 19–22. [Google Scholar]
- Zhao, X.; Zhang, F.; Li, C. Risk analysis of farmland drainage ditch level-filling and flood disaster in North China Low plain. Trans. CSAE 2016, 32, 145–151. [Google Scholar]
- Saha, A.K.; Agrawal, S. Mapping and assessment of flood risk in Prayagraj district, India: A study on GIS and remote sensing. Nanotechnol. Environ. Eng. 2020, 5, 11. [Google Scholar] [CrossRef]
- Mo, J.; Lu, J.; Li, Y.; Kuang, S. GIS-based risk assessment of agricultural heavy rainfall and flooding in Guangxi. Disaster Sci. 2012, 27, 38–43. [Google Scholar]
- Li, B. Weibull model for flood disaster evaluation. J. Nat. Disasters 2005, 06, 32–36. [Google Scholar]
- Hadipour, V.; Vafaie, F.; Deilami, K. Coastal Flooding Risk Assessment Using a GIS Based Spatial MultiCriteria Decision Analysis Approach. Water 2020, 12, 2379. [Google Scholar] [CrossRef]
- Li, L.; Kuang, Z.; Mo, J.; Meng, C. Risk level assessment of autumn drought in Guangxi based on AHP and GIS. Trans. CSAE 2013, 29, 193–201, 293. [Google Scholar]
- Li, L.; Gao, R.; Wang, Y. Flood vulnerability evaluation based on entropy weight agglomeration cross-evaluation model. J. Water Resour. Archit. Eng. 2018, 16, 237–240. [Google Scholar]
- Cheng, P.; Huang, Y. Flood risk assessment of Nanchang City based on AHP-entropy weight method. Yangtze River 2021, 52, 18–25. [Google Scholar]
- Huang, X.; Zhao, H.; Huang, Y.; Lin, K.; He, L. Application of Genetic-neural network ensemble forecasting method in tropical cyclone precipitation forecasting in Guangxi. J. Nat. Hazards 2017, 26, 184–196. [Google Scholar]
- Huang, T.; Wang, X. Application of BP neural network in rapid assessment of flood loss. J. Hohai Univ. Nat. Sci. Ed. 2003, 31, 457–460. [Google Scholar]
- Chen, J.; Li, Q.; Wang, H.; Deng, M. A Machine Learning Ensemble Approach based on Random Forest and Radial Basis Function Neural Network For Risk Evaluation of Regional Flood Disaster: A case study of the Yangtze River Delta, China. Int. J. Environ. Res. Public Health 2020, 17, 49. [Google Scholar] [CrossRef]
- Gao, K.; Yang, Z.; Gao, X.; Shao, W. Review of urban flood loss assessment methods. Water Resour. Hydropower Technol. 2021, 52, 57–68. [Google Scholar]
- Liu, C.; Lv, J.; Zhai, X.; Li, J.; Liu, R.; Sun, C.; Zhao, Z. Henan “7, 21” rainstorm flood risk simulation and comparison analysis. Water Conserv. Hydropower Lett. 2021, 9, 8–14. [Google Scholar]
- Investigation report of “July 20” heavy rainstorm disaster in Zhengzhou, Henan Province. China Saf. Work. 2022, 17, 52–53.
- Chen, P. Effects of Normalization on the Entropy-based TOPSIS Method. Expert Syst. Appl. 2019, 136, 33–41. [Google Scholar] [CrossRef]
- Shi, M. Research on Regional Logistics Evaluation Based on Entropy Weight Method-BP Neural Network; Hefei University of Technology: Hefei, China, 2020. [Google Scholar]
- Liu, Y.; Wang, S.; Wang, X.; Jiang, D.; Ravindranath, N.H.; Rahman, A.; Htwe, N.M. Flood risk assessment in Bengal-India-Myanmar region based on AHP-entropy weight method. Geol. Res. 2020, 39, 1892–1906. [Google Scholar]
- Xia, Q.; Li, Y.; Guo, J.; Wang, L. Application of improved Fisher optimal partitioning method based on entropy weight method in reservoir flood season staging. J. People’s Pearl River 2019, 40, 42–47. [Google Scholar]
- Huang, B.; Zhou, Y.; Jin, J.; Zhou, P.; Shen, J.; Ning, S. Classification of annual precipitation stages based on the optimal segmentation method—A case study of precipitation at Hefei station. People’s Pearl River 2020, 41, 21–26. [Google Scholar]
- Yu, H.; Liu, X.; Wu, X.; Wang, Y.; Wang, J.; Peng, S. Influence of index weighting algorithm on Fisher’s optimal segmentation in reservoir flood season staging. China Rural. Water Conserv. Hydropower 2021, 1, 105–110. [Google Scholar]
- Rumelhart, D.E.; Hinton, G.E.; Williams, R.J. Learning representations by back progating errors. Nature 1988, 323, 399–421. [Google Scholar]
- Vincent, P.; Larochelle, H.; Bengio, Y.; Manzagol, P.A. Extracting and composing robust features with denoising autoencoders. In Proceedings of the 25th International Conference on Machine Learning, Helsinki, Finland, 5–9 July 2008; pp. 1096–1103. [Google Scholar]
- Yu, W.; An, J.; Lu, W.; Gan, C.; Liu, Q. Gas identification of noise reduction based on stack type automatic encoder. J. Comput. Eng. Des. 2017, 38, 814–818. [Google Scholar]
- Vincent, P.; Larochelle, H.; Lajoie, I.; Bengio, Y.; Manzagol, P.A.; Bottou, L. Stacked denoising autoencoders: Learning useful representations in a deep network with a local denoising criterion. J. Mach. Learn. Res. 2010, 11, 3371–3408. [Google Scholar]
- Pei, H.; Chen, J.; Li, W.; Sun, Y.; Chen, W. Spatio-temporal distribution and risk assessment of rainstorm flood in Gansu Province. J. Nat. Disasters 2017, 26, 167–175. [Google Scholar]
- Lv, X.; Zhang, C.; Huang, J.; Tian, Y.; Wang, X. Analysis and assessment of factors affecting the sensitivity to heavy rainfall and flooding—A case study of Anyi County, Jiangxi. Disaster Sci. 2021, 36, 223–229. [Google Scholar]
- Peng, Z.; Zhang, A.; Wang, S.; Bai, Y. Design principles and construction process of comprehensive evaluation index system. Sci. Res. Manag. 2017, 38, 9–215. [Google Scholar]
- Huang, L.; Liu, C. The characteristics and causes of recent floods in hubei province analysis. J. Cent. China Norm. Univ. (Nat. Sci. Ed.) 2006, 1, 115–118+123. [Google Scholar]
- Shi, P. Theory and practice of the three disasters research. J. Nat. Disasters 2002, 3, 1–9. [Google Scholar]
- Zhao, T.; Zhang, L.; Hu, F. The storm flood disasters on crop losses quantitative evaluation research. Hubei Agric. Sci. 2021, 61, 36–41. [Google Scholar]
- Miao, H.; Wang, N.; Wang, Y.; Lin, B. Urban toughness evaluation based on process analysis of disaster recovery system. J. Nat. Disasters 2021, 30, 10–27. [Google Scholar]
- Tan, J.F. Correlation analysis in evaluation index system. Stat. Decis. Mak. 2005, 22, 147–148. [Google Scholar]
- Arablouei, R.; Werner, S.; Dogancay, K. Analysis of the gradient-descent total leastsquares adaptive filtering algorithm. IEEE Trans. Signal Process. 2014, 62, 1256–1264. [Google Scholar] [CrossRef]
- Li, J.; Xu, S.; Wan, C.; Lu, Y.; Wang, S. Based on adaptive k—Means++ algorithm of power load characteristic analysis. J. South. Power Grid Technol. 2019, 13, 13–19. [Google Scholar]
- Luo, J.; Qiu, G.; Zhang, Y.; Feng, S.; Han, L. Research on Binocular Vision Matching Algorithm Based on Adaptive Double Threshold in SURF. Chin. J. Sci. Instrum. 2020, 41, 240–247. [Google Scholar]
- Lin, X.; Tang, W. Research on Multiple classifier Selection Classification Based on K-means ++. J. Chongqing Norm. Univ. (Nat. Sci. Ed.) 2018, 35, 88–96. [Google Scholar]
- Han, H.; Cheng, D.; Xu, H. Fault diagnosis of feed pump bearing based on stacked noise reduction self-coding. Electromech. Eng. Technol. 2021, 50, 254–258. [Google Scholar]


Disclaimer/Publisher’s Note: The statements, opinions and data contained in all publications are solely those of the individual author(s) and contributor(s) and not of MDPI and/or the editor(s). MDPI and/or the editor(s) disclaim responsibility for any injury to people or property resulting from any ideas, methods, instructions or products referred to in the content. |
© 2023 by the authors. Licensee MDPI, Basel, Switzerland. This article is an open access article distributed under the terms and conditions of the Creative Commons Attribution (CC BY) license (https://creativecommons.org/licenses/by/4.0/).