Article

Development of Temperature Sensor Based on AlN/ScAlN SAW Resonators

1
The Institute of Technological Science, Wuhan University, Wuhan 430072, China
2
The Hubei Yangtze Memory Laboratories, Wuhan 430205, China
3
School of Micoelectronics, Wuhan University, Wuhan 430072, China
4
School of Physics and Technology, Wuhan University, Wuhan 430072, China
5
Hongyi Honor College, Wuhan University, Wuhan 430072, China
*
Authors to whom correspondence should be addressed.
Electronics 2023, 12(18), 3863; https://doi.org/10.3390/electronics12183863
Submission received: 28 July 2023 / Revised: 8 September 2023 / Accepted: 10 September 2023 / Published: 12 September 2023
(This article belongs to the Special Issue MEMS/NEMS Sensors: Advances, Trends and Challenges)

Abstract

:
Temperature monitoring in extreme environments presents new challenges for MEMS sensors. Since aluminum nitride (AlN)/scandium aluminum nitride (ScAlN)-based surface acoustic wave (SAW) devices have a high Q-value, good temperature drift characteristics, and the ability to be compatible with CMOS, they have become some of the preferred devices for wireless passive temperature measurement. This paper presents the development of AlN/ScAlN SAW-based temperature sensors. Three methods were used to characterize the temperature characteristics of a thin-film SAW resonator, including direct measurement by GSG probe station, and indirect measurement by oscillation circuit and antenna. The temperature characteristics of the three methods in the range of 30–100 °C were studied. The experimental results show that the sensitivities obtained with the three schemes were −28.9 ppm/K, −33.6 ppm/K, and −29.3 ppm/K. The temperature sensor using the direct measurement method had the best linearity, with a value of 0.0019%, and highest accuracy at ±0.70 °C. Although there were differences in performance, the characteristics of the three SAW temperature sensors make them suitable for sensing in various complex environments.

1. Introduction

With the rapid development of the internet of things (IoT) technology, higher requirements are being put forward for sensing technology [1]. As a kind of acoustic wave device based on piezoelectric materials, surface acoustic wave sensors have become major research objects due to their quick response, high sensitivity, and ability of wireless measurement [2,3,4,5,6,7,8,9,10,11,12,13,14,15,16].
In sensing applications, temperature sensors have become an essential tool in many fields, such as chemical, machinery, etc. [2,3,4,5,6] As temperature sensors, SAW resonators can be used not only for wired measurements [7,8,9,10], but also wireless measurements in extreme environments [2,3,5,11,12,14,15,16]. The wired sensor has a stable signal output and strong anti-interference ability, but a wired connection makes it impossible to apply to situations involving fast movement or with high sealing performance requirements. The advantage of wireless passive sensors is that they can be used in various high-speed movements and closed environments, but the sensing signal is easily disturbed by interference, so the back-end signal processing circuit is relatively complicated.
With the widespread application of SAW sensors in various fields, piezoelectric materials have also been extensively studied, such as AlN, ScAlN, lithium niobate (LiNbO3), zinc oxide (ZnO), and langasite (LGS), for high-temperature temperature sensors. LiNbO3 has a large piezoelectric coefficient and high sensitivity to temperature [17,18]. However, the process of making LiNbO3 thin film is complicated and the quality is difficult to guarantee. Compared with LiNbO3, ZnO has the advantage that it can be sputter-deposited at room temperature [19], but its piezoelectric coefficient is low. The melting point of LGS is 1470 °C, and it can maintain a stable phase from room temperature to the melting point. Therefore, LGS can still enable stable piezoelectric performance at high temperatures [13]. However, the acoustic propagation loss of LGS increases with the increase in temperature. Compared with other piezoelectrics, AlN-based SAW resonators not only have better performance, but also provide for CMOS compatibility. It is well known that doping Sc elements in AlN is one of most effective methods to improve the piezoelectricity of the material. However, pure ScAlN films have drawbacks including poor crystallinity and crystal orientation, resulting in a decline in film quality. In our previous work, we showed using the same thickness of AlN and ScAlN can improve crystallinity and crystal orientation of ScAlN films, and compared to pure ScAlN, it has lower dielectric loss [20]. A study of AlN/ScAlN composite thin film showed it exhibited higher quality, few defects, low loss, and was a potential application for acoustic devices [21,22]. AlN/ScAlN-based devices have a higher Q-factor, which is a benefit for designing environmental sensors with high sensitivity.
In this work, the temperature sensing characteristics of AlN/ScAlN composite thin film SAW are investigated using three different measurement methods. As shown in Figure 1a, the direct measurement method measures the frequency response of SAW devices at different temperatures through a network analyzer. This method can accurately and intuitively measure the law of sensor resonance frequency changing with temperature. As shown in Figure 1b, the wired measurement method uses an oscillating circuit to connect a resonator, and obtains a frequency change curve by reading the oscillating signal. As shown in Figure 1c, the wireless measurement method is able to connect the resonator to the antenna, and collect the response of the resonator to the excitation signal at different temperatures.

2. Device Design and Fabrication

2.1. Design and Fabrication of SAW Resonator

First, a resonant SAW resonator with an interdigital transducer (IDT) and reflectors was designed, as is shown in Figure 2a. The finite element method (FEM) method was used to obtain the frequency response by COMSOL multiphysics. The simulated impedance curve of the SAW resonator is shown in Figure 2b. In the model, the number of IDTs was 50. In order to reflect sound waves more effectively, the number of reflection grids must usually be very high [23,24]. In this work, the number of reflection grids was set to 368. Figure 2b is a comparison of Q values of 1 μm-thick pure AlN, 1 μm-thick pure ScAlN, and 0.5 μm-AlN/0.5 μm-ScAlN composite thin-film SAW resonators using COMSOL simulation with the same losses. From the results, it can be seen that the Q of the SAW resonator of the composite film was higher both in series resonance frequency (fs) and parallel resonance frequency (fp). Therefore, AlN/ScAlN piezoelectric film with a high Q value was selected. As Figure 2c shows, the simulated fs and fp values of the AlN/ScAlN composite thin film SAW resonator were 446.45 MHz and 446.66 MHz, respectively. It can be seen that there were spurious modes appearing at frequencies less than fs, but in this work the sensor worked near fs, so these spurious modes did not affect the operation of the sensor. Figure 2c also shows the surface displacement of the device at fs of the resonator, and the vibration mode was the Rayleigh mode. Figure 2d is the simulated frequency variation of the AlN/ScAlN thin-film SAW resonator at three temperatures of 30 °C, 40 °C, and 50 °C. As the temperature increased, the fs and fp values of the resonator showed a decreasing trend.
The fabrication process of the designed AlN/ScAlN-based SAW resonator is shown in Figure 3a. First, an 8-inch high-resistivity silicon wafer was used. In order to better deposit the piezoelectric layer, a 100 nm-thick AlN seed layer and a 200 nm-thick Mo bottom electrode were deposited (Figure 3(a1)). Then, 500 nm-thick AlN films were deposited using a 12-inch 99.999% Al target, and 500 nm ScAlN films were sequentially deposited using a 12-inch 99.95% Sc0.2/Al0.8 alloyed target by magnetron sputtering (SPTS sigma), forming a composite piezoelectric film with a total thickness of 1 μm (Figure 3(a1)). Control of deposition parameters of AlN and ScAlN are shown in Table 1. Then, 200 nm-thick Mo was deposited as the top electrode (Figure 3(a2)), and it was patterned to form IDT and reflectors (Figure 3(a3)). Finally, a 100 nm-thick AlN film was deposited as a passivation layer to protect the Mo electrode from oxidation (Figure 3(a4)). The top and bottom electrodes were respectively exposed by etching (Figure 3(a5)). The 1 μm-thick aluminum electrode plate was formed by a lift-off process and connected to the upper and lower Mo electrodes (Figure 3(a6)).
Figure 3b and shows the micrograph of the SAW. The spacing of IDT and reflective grids was 5 µm and the spacing of IDT and reflectors was 11.25 µm. Figure 3c shows the interface micrograph of the SAW; the actual processed device ScAlN thickness was 485 nm and AlN thickness was 472 nm.
Figure 3. (a) Fabrication process of AlN/ScAlN thin-film SAW resonator, (b) micrograph of the SAW resonator, and (c) cross-section image of the SAW resonator.
Electronics 12 03863 g003

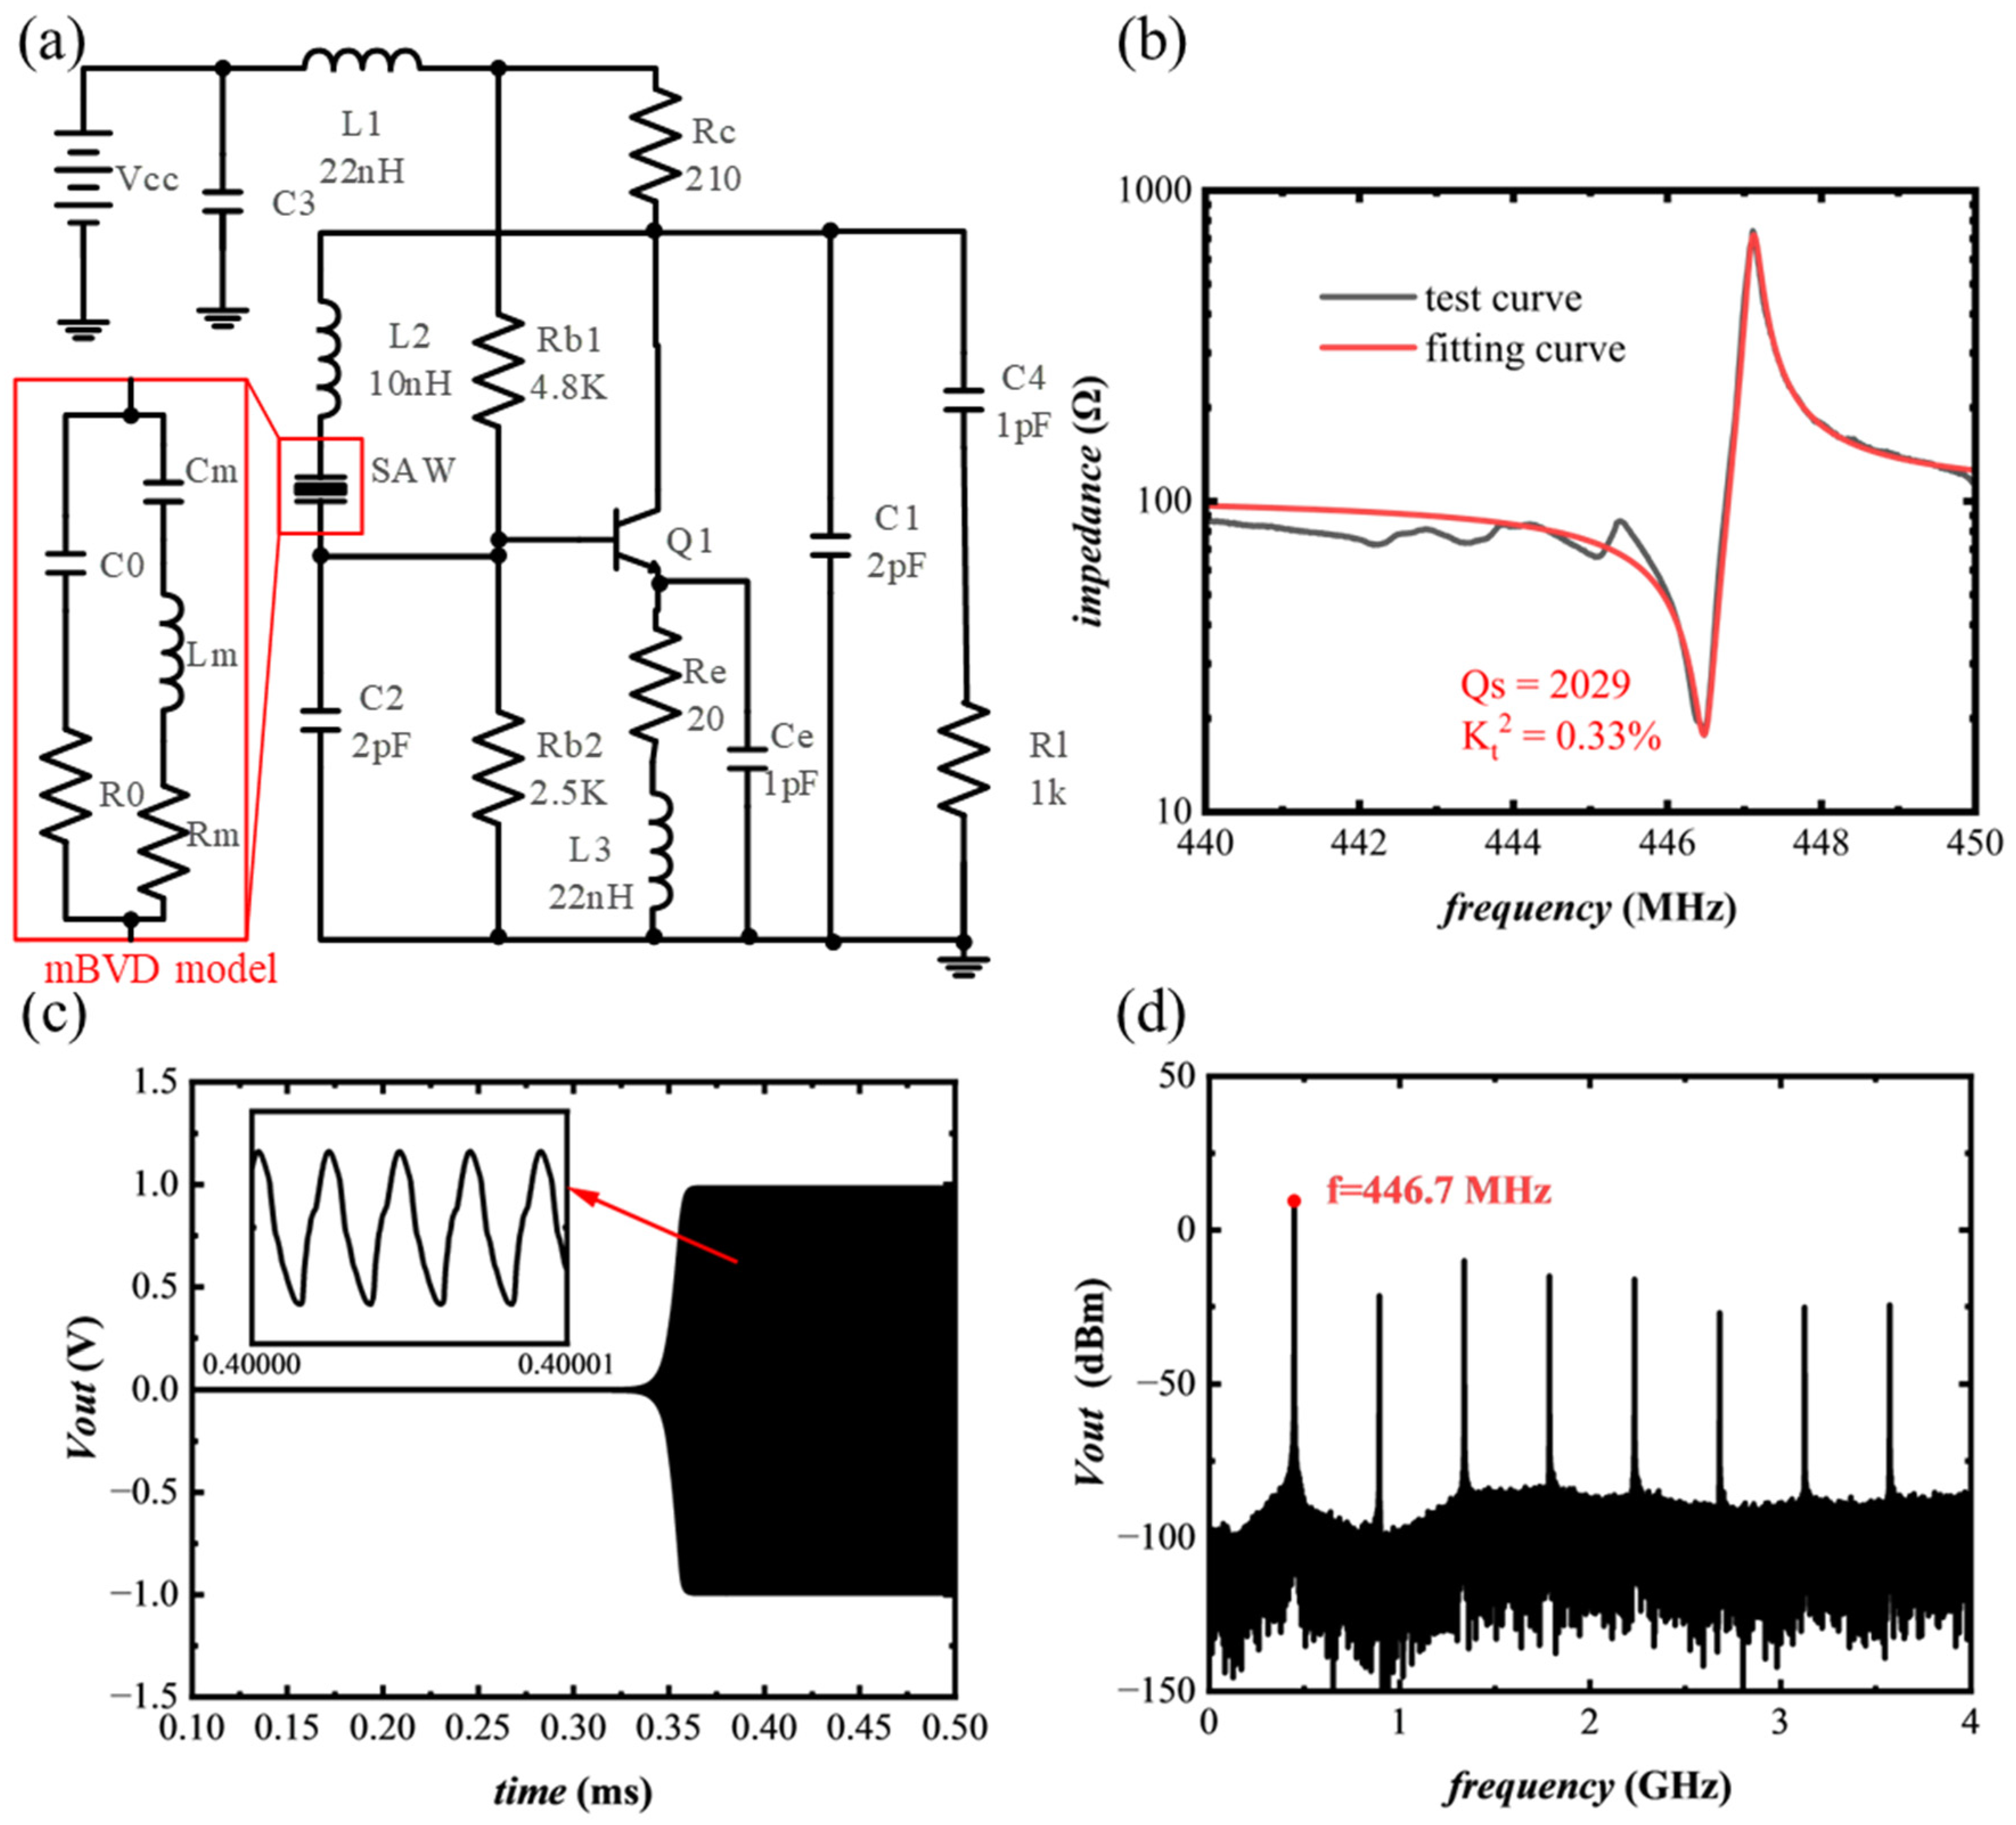
2.2. Design of SAW Oscillator

Usually, an oscillation circuit is composed of an amplifier circuit and a positive feedback loop circuit, and the positive feedback acts as a frequency selection circuit at the same time. The start-up of the oscillation circuit must satisfy the Barkhausen criterion [25]. The oscillation of the oscillator must satisfy the criteria that the loop gain is greater than 1 and the total phase shift of the loop is 0 or an integer multiple of 2π.
According to the above principles, the oscillator circuit shown in Figure 4a was designed. In circuit analysis, the modified Butterworth–Van Dykem (mBVD) model of the SAW resonator was extracted. The model consisted of a static capacitor C0, electrode resistance Rs, dielectric loss R0, motional resistor Rm, motional inductor Lm, and a motional capacitor Cm [26]. Three motional parameters can be defined as:
C m = C 0 ( ( f s f p ) 2 1 ) ,
L m = 1 ( 2 π f s ) 2 C m ,
R m = 1 ω s C m Q s ,
where fs is the series resonance frequency, fp is the parallel resonance frequency, and Q s is the quality factor in fs. The mBVD parameters of the resonator were obtained by fitting and calculating Equations (1)–(3) through the Matlab program. Figure 4b shows the test curve and the mBVD fitting curve, and the detailed fitting parameters are listed in Table 2. The 3 dB method quality factor (Qs-3dB) of resonator used in fs reached 2029. The coupling coefficient Kt2 of the SAW resonator was 0.33%.
The analysis of time-domain response and harmonics of the designed oscillating circulate were carried out by ADS software. It can be seen from the transient waveform of Vout output in Figure 4c that the circuit formed a stable oscillation. The harmonic analysis results are shown in Figure 4d. The frequency spectrum shows multiple high-order frequency signals of the oscillating circuit, among which the frequency of the first-order oscillating signal was 446.7 MHz, located between fs and fp of the SAW resonator. The strength of the high-order signals was much lower than that of the first-order signals; it is not necessary to discuss the high-order frequency terms in this work.
Figure 4. (a) Oscillator circuit diagram, (b) test curve and mBVD model fitting result graph, (c) time domain simulation diagram of oscillator, and (d) frequency domain simulation diagram of oscillator.
Electronics 12 03863 g004

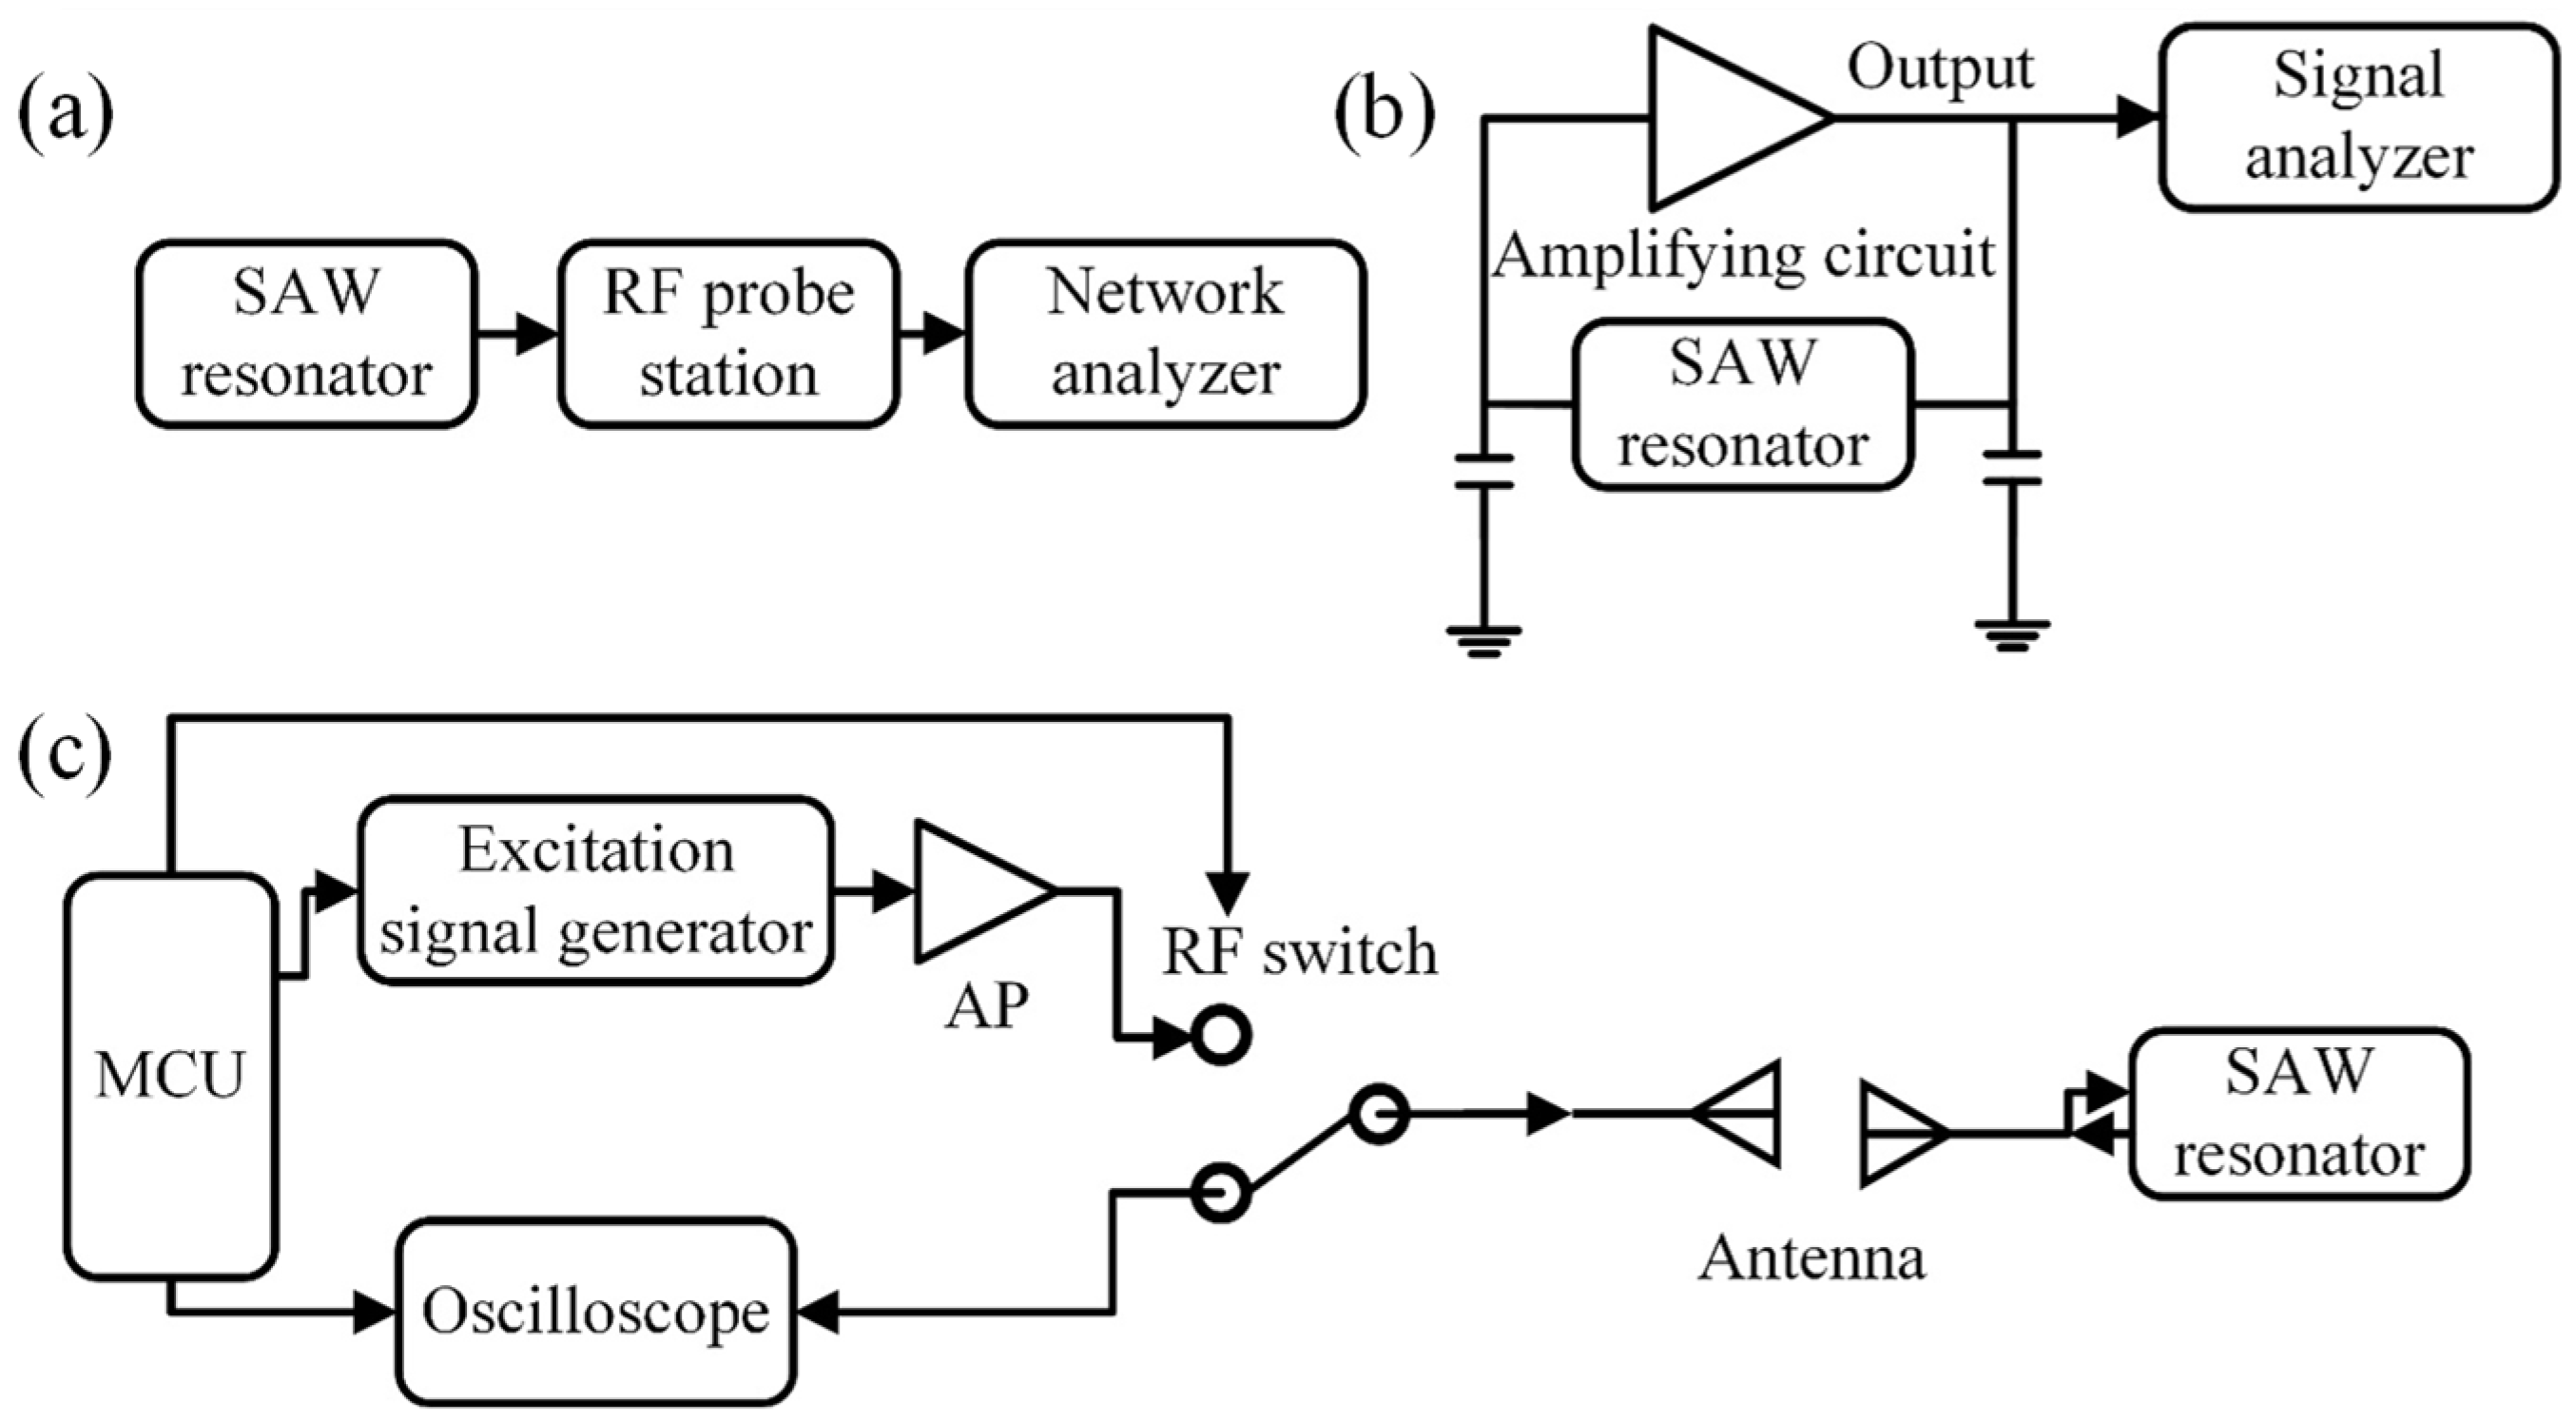
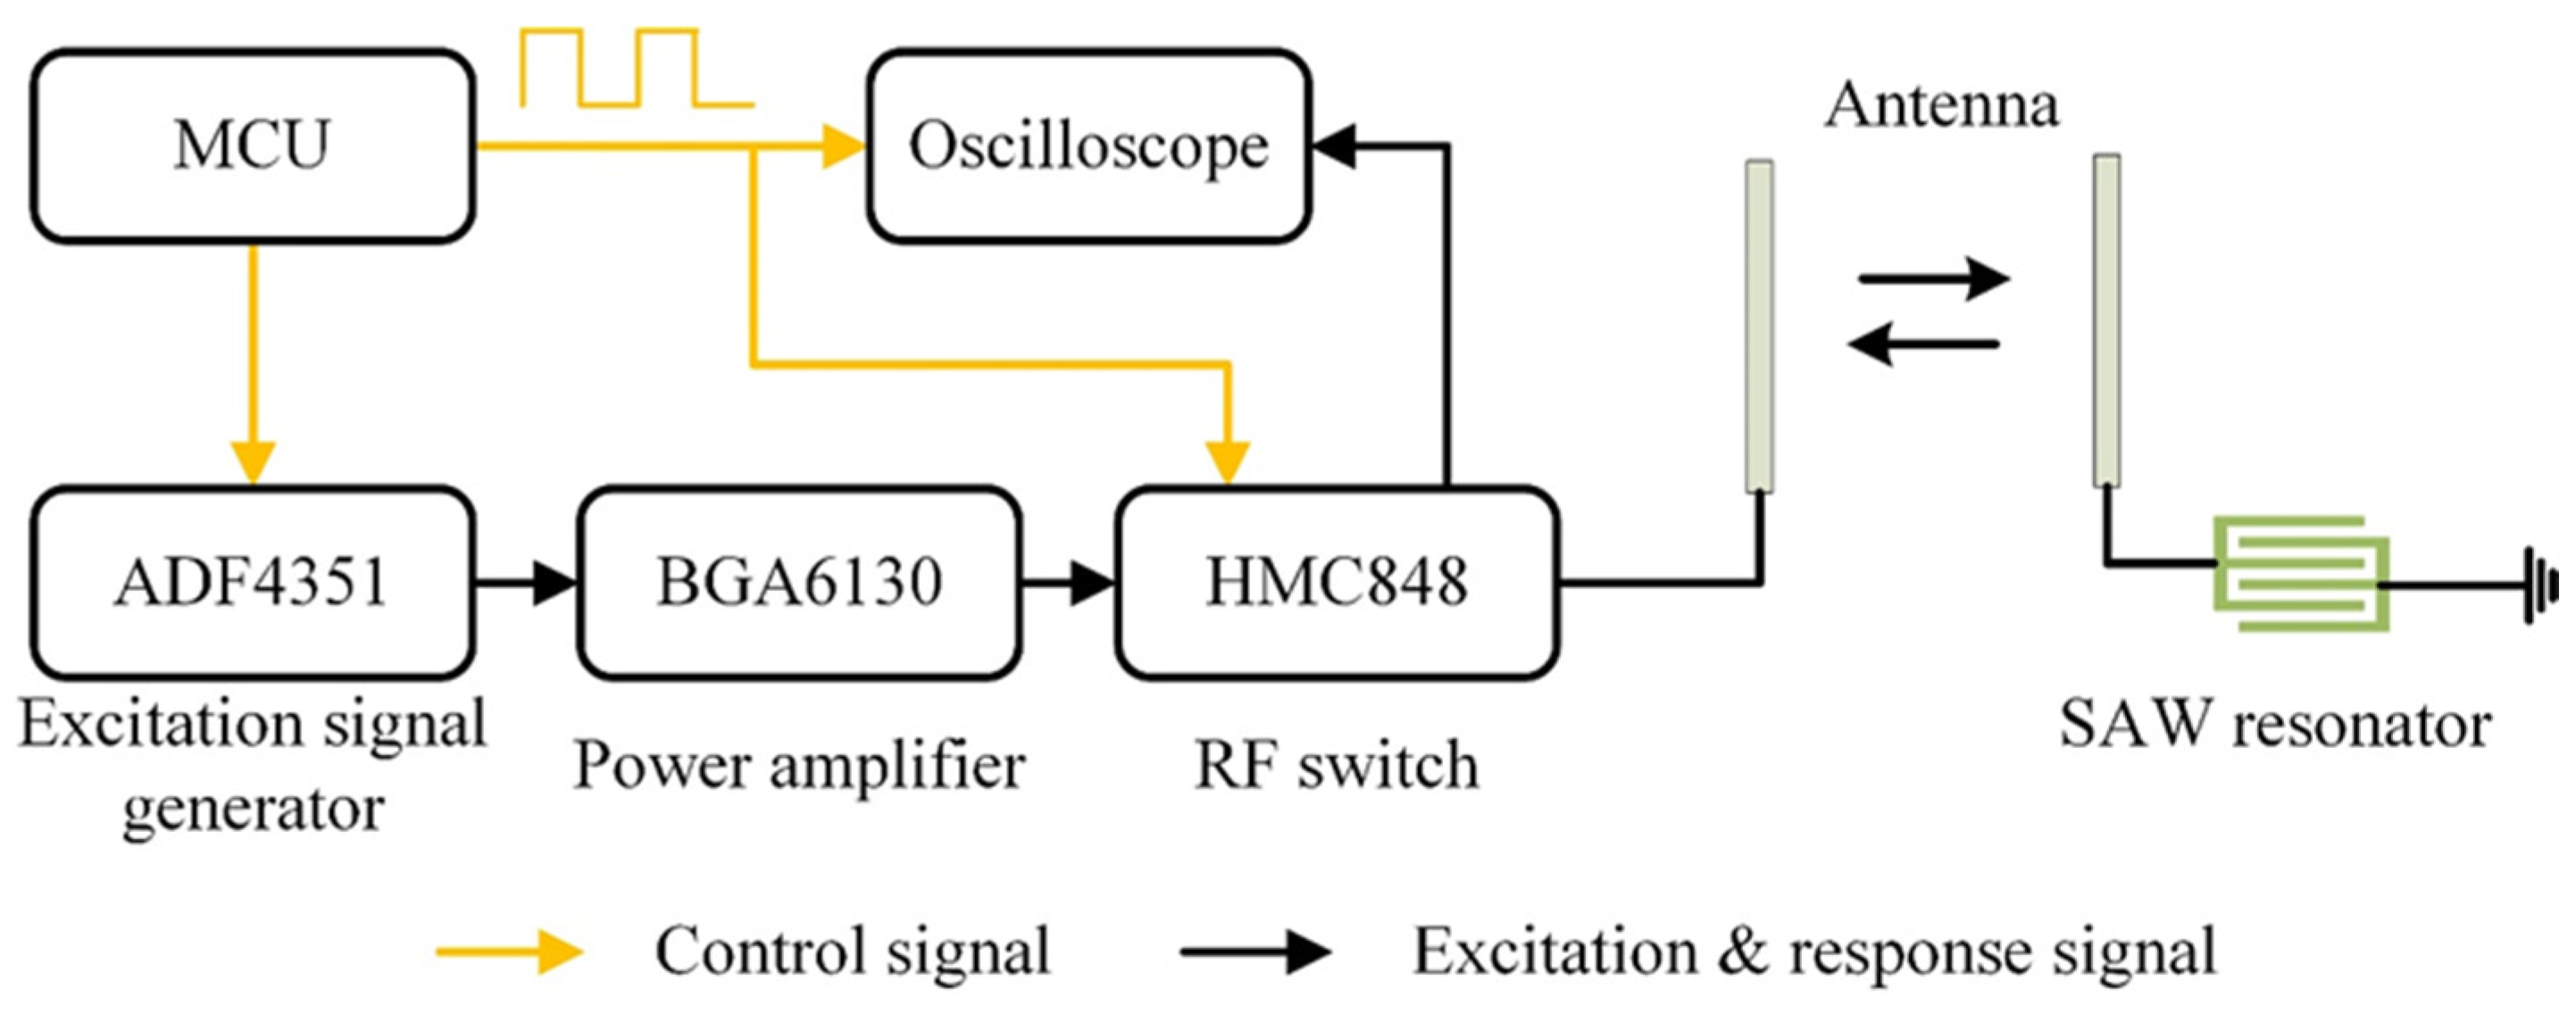
2.3. Design of Wireless Sensor System

The first step in designing a SAW wireless sensor system is to determine the range of the excitation signal and the response signal. Therefore, it is necessary to obtain the response of the SAW to a specific excitation signal. When the SAW resonator is subjected to a sinusoidal pulse excitation signal x ( t ) = e j ω c t u ( t ) , the response y ( t ) of the SAW sensor after the excitation is stopped as follows [27]:
y ( t ) = e j ω 0 t 0 e j ( ω c ω 0 ) τ h e n v ( t τ ) d τ t > 0 h e n v ( t ) = n = 1 , 3 , 5 l N R n T 2 l ( i = 0 m 1 1 W ( t t 0 , ( m 1 ) τ 0 ) + i = 0 m 2 1 W ( t t 0 , ( m 1 ) τ 0 ) ) ,
where ω 0 is the series resonant angular frequency of a resonator defined by ω 0 = π / τ 0 = π ( v / s ) = 2 π f s ; s is the gap of the uniformly spaced interdigital electrodes and v is the surface wave speed on piezoelectric substrate; R and T are, respectively, the reflection and transmission coefficients of reflective gratings and R 2 + T 2 = 1 ; m 1 and m 2 are, respectively, the numbers of positive electrodes and negative electrodes; W ( t , τ ) = u ( t ) u ( t τ ) is the rectangular pulse function and u ( t ) is the step function.
According to Equation (4), the resonant frequency of the resonator is equal to the frequency of the response signal, and the maximum amplitude is obtained when the excitation signal frequency is equal to the SAW resonator frequency. Therefore, the resonator frequency of the SAW sensor can be obtained by measuring the frequency of the response signal, and the excitation signal frequency should be equal to or close to the series resonator frequency of the SAW resonator.
Generally, a wireless SAW sensor system includes a radio request unit and one or more wireless SAW sensor units [28]. For this paper, the designed radio request unit consisted of a excitation signal generator, a power amplifier, a radio frequency switch, and a microcontroller chip (MCU). During circuit design, the operating frequency range of the entire system should be able to contain the operating frequency of the SAW resonator. Since a radio frequency switch is used to control reception and transmission, there should be a sufficiently high isolation between the reception and transmission of the radio frequency switch. In order to simplify the circuit power supply structure, all chips used in the circuit must be powered by a unified voltage. Based on the above conditions, the system circuit design in this paper is shown in Figure 5.
According to Equation (4), the resonant frequency of the resonator is equal to the frequency of the response signal. Therefore, the resonator frequency of the SAW sensor can be obtained by measuring the frequency of the response signal.
The radio request process consists of two phases. One is the excitation radio transmission phase, and the other is the response radio reception phase. In the excitation radio transmission phase, the MCU controls the radio frequency switch to be in the transmission position and the signal generator generates an excitation signal of 446.5 MHz, which is sent to the resonator by the antenna through the power amplifier. The SAW resonator will resonate when excited by this signal, producing a response signal whose frequency changes with temperature. In the response radio reception phase, the MCU controls the RF switch to be in the receiving position, and the antenna receives the sensor’s response radio and feeds the response signal into the oscilloscope. In particular, since the duration of the response radio signal is very short, the control signal of the radio frequency switch is also input to the oscilloscope, and the response radio is captured by tracking the falling edge of its signal.

3. Experiment and Result

3.1. Direct Measurement Method by Network Analyzer

Figure 6a,b shows the direct measurement system. The SAW sensor was connected to the network analyzer via an RF probe (Figure 6b) and an RF cable. The temperature was controlled by a vacuum probe station (Figure 6a), and the response of the SAW resonator at different temperatures was measured by a network analyzer (Kesight N5222B). Figure 6c is the S parameter of the SAW sensor measured using a network analyzer at room temperature (27 °C), and the impedance curve of the SAW sensor is shown in Figure 6d. As shown in Figure 6d, the series resonant frequency of the resonator was 446.5 MHz, and the parallel resonant frequency was 447.1 MHz.
Researchers usually use the temperature coefficient of frequency (TCF) to express the temperature stability or sensitivity of the sensor, which is defined as:
T C F = d f d T 1 f .
In order to measure the sensitivity (TCF) of the SAW sensor, the temperature during the test is controlled by the temperature control system of the vacuum probe station. As shown in Figure 6b, the SAW temperature sensor was put on the heating platform of the probe station, and the signal was output via RF probes. A temperature test was conducted from 30 to 100 °C (dynamic range = 70 °C) with steps of 10 °C, using the impedance curve record for different temperature points by network analyzer. As the temperature gradually rose, the fs of the SAW sensor gradually decreased, and the cooling process was the opposite. Linearity is an index that characterizes the degree of agreement between the sensor output-input calibration curve and the selected fitting straight line. The linearity of the sensor can be represented by Equation (6), where Δ f max is the maximum difference between the output signal frequency and the fitting curve, and f F S is the maximum output frequency of the full scale of the sensor.
e L = ± Δ f max f F S × 100 % .
In order to reflect the linearity of the sensor, a function between frequency and temperature in the temperature range is created. The function of fs changing with temperature is shown in Equation (7).
f s = 0.0129 T + 446.7755 .
Through the experimental results and Equations (6) and (7), it can be seen that the linearity of the direct measurement method was 0.0019%, while from the measurement results, it can be seen via Equation (5) that the sensitivity of the device was −28.9 ppm/°C. Figure 7b shows the measurement accuracy of the direct measurement method, and in the range of 30–100 °C, errors through the oscillation circuit were within ±0.70 °C. Figure 7c shows the minimum resolution of the sensor; the sensor responded when the temperature changed by 0.1 °C.

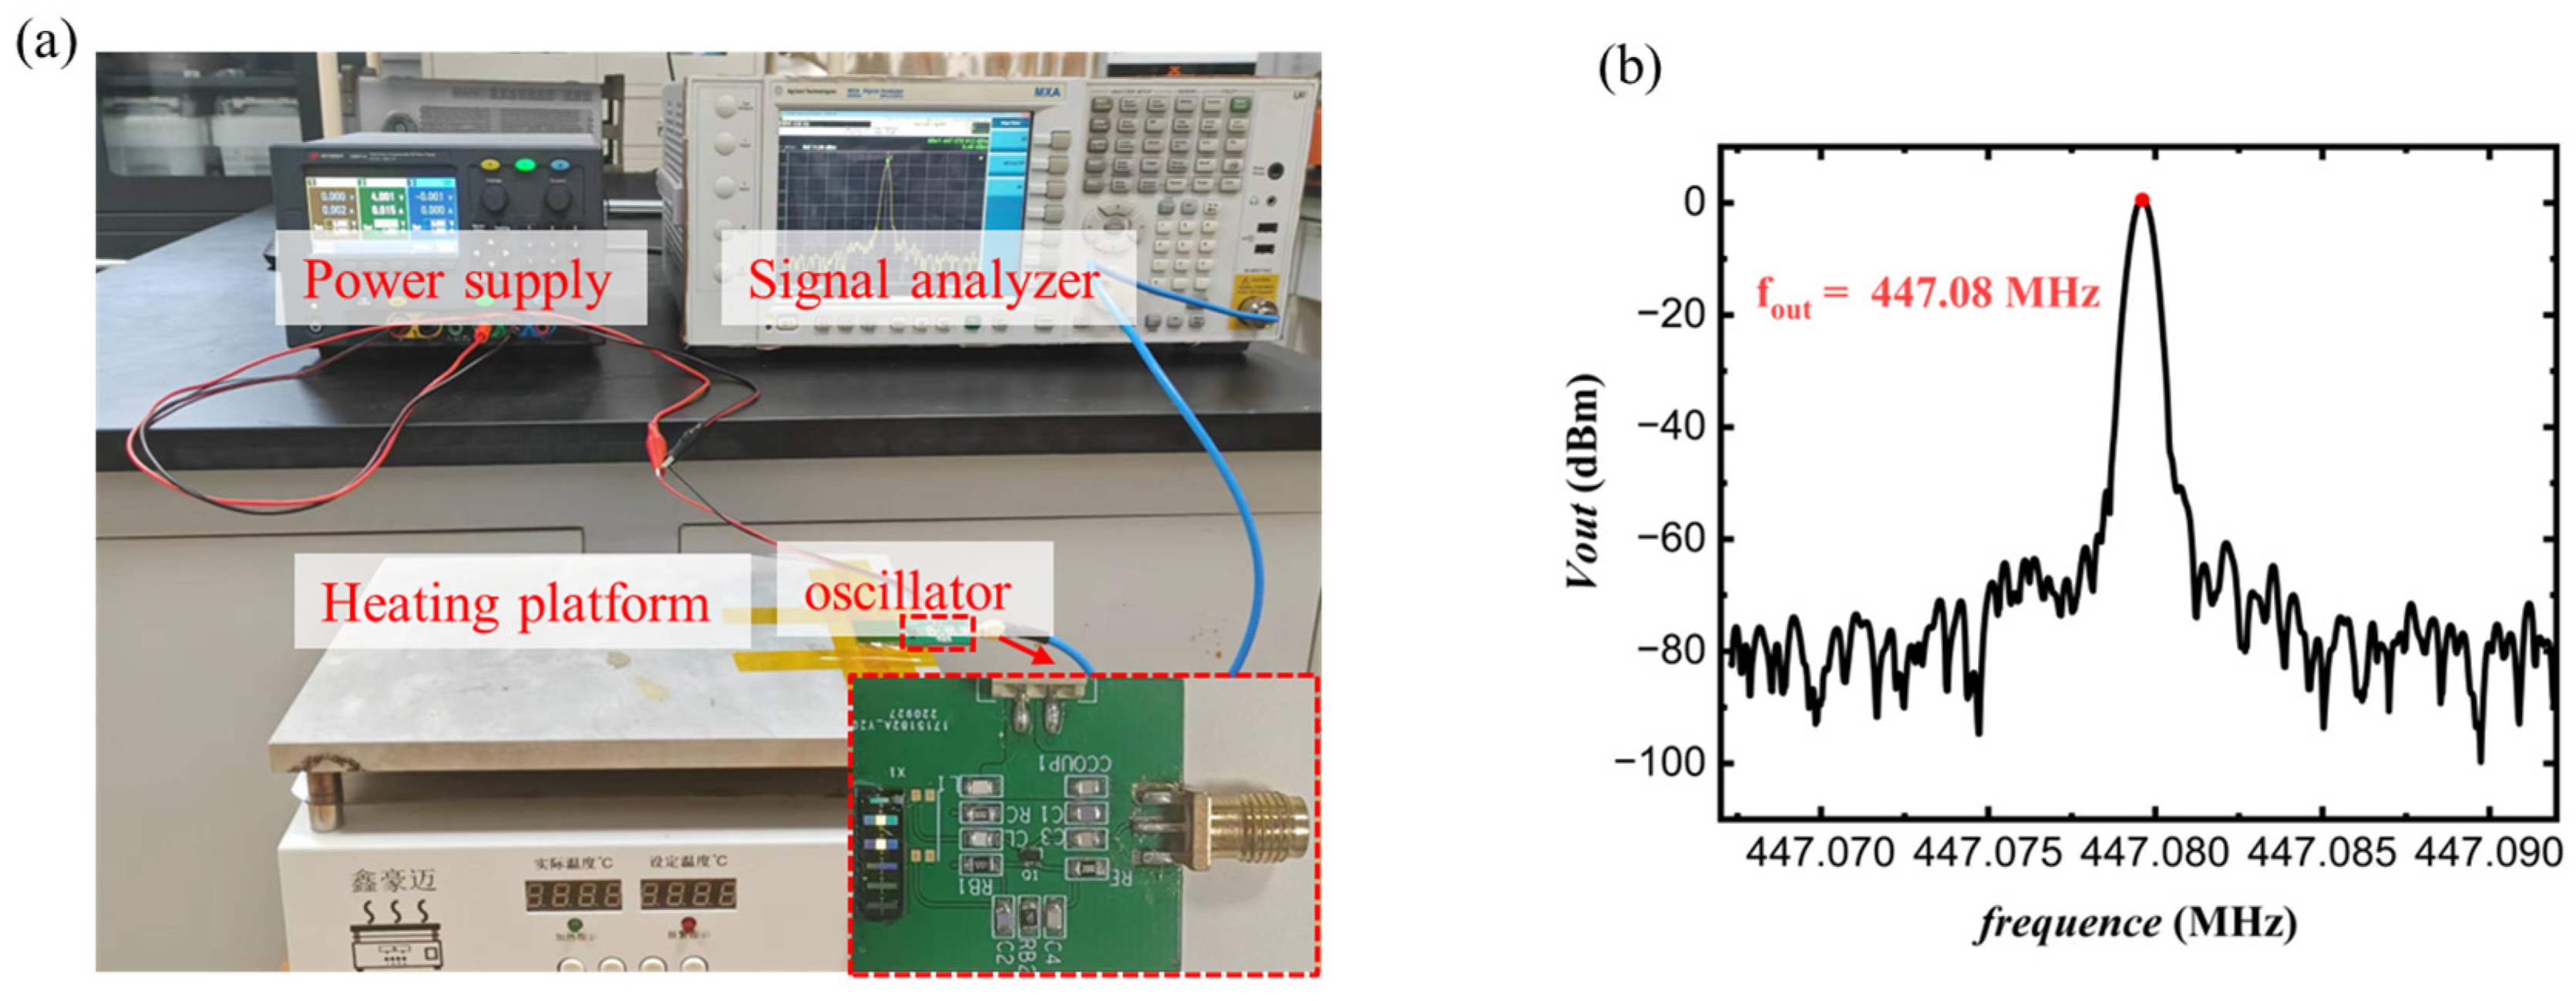
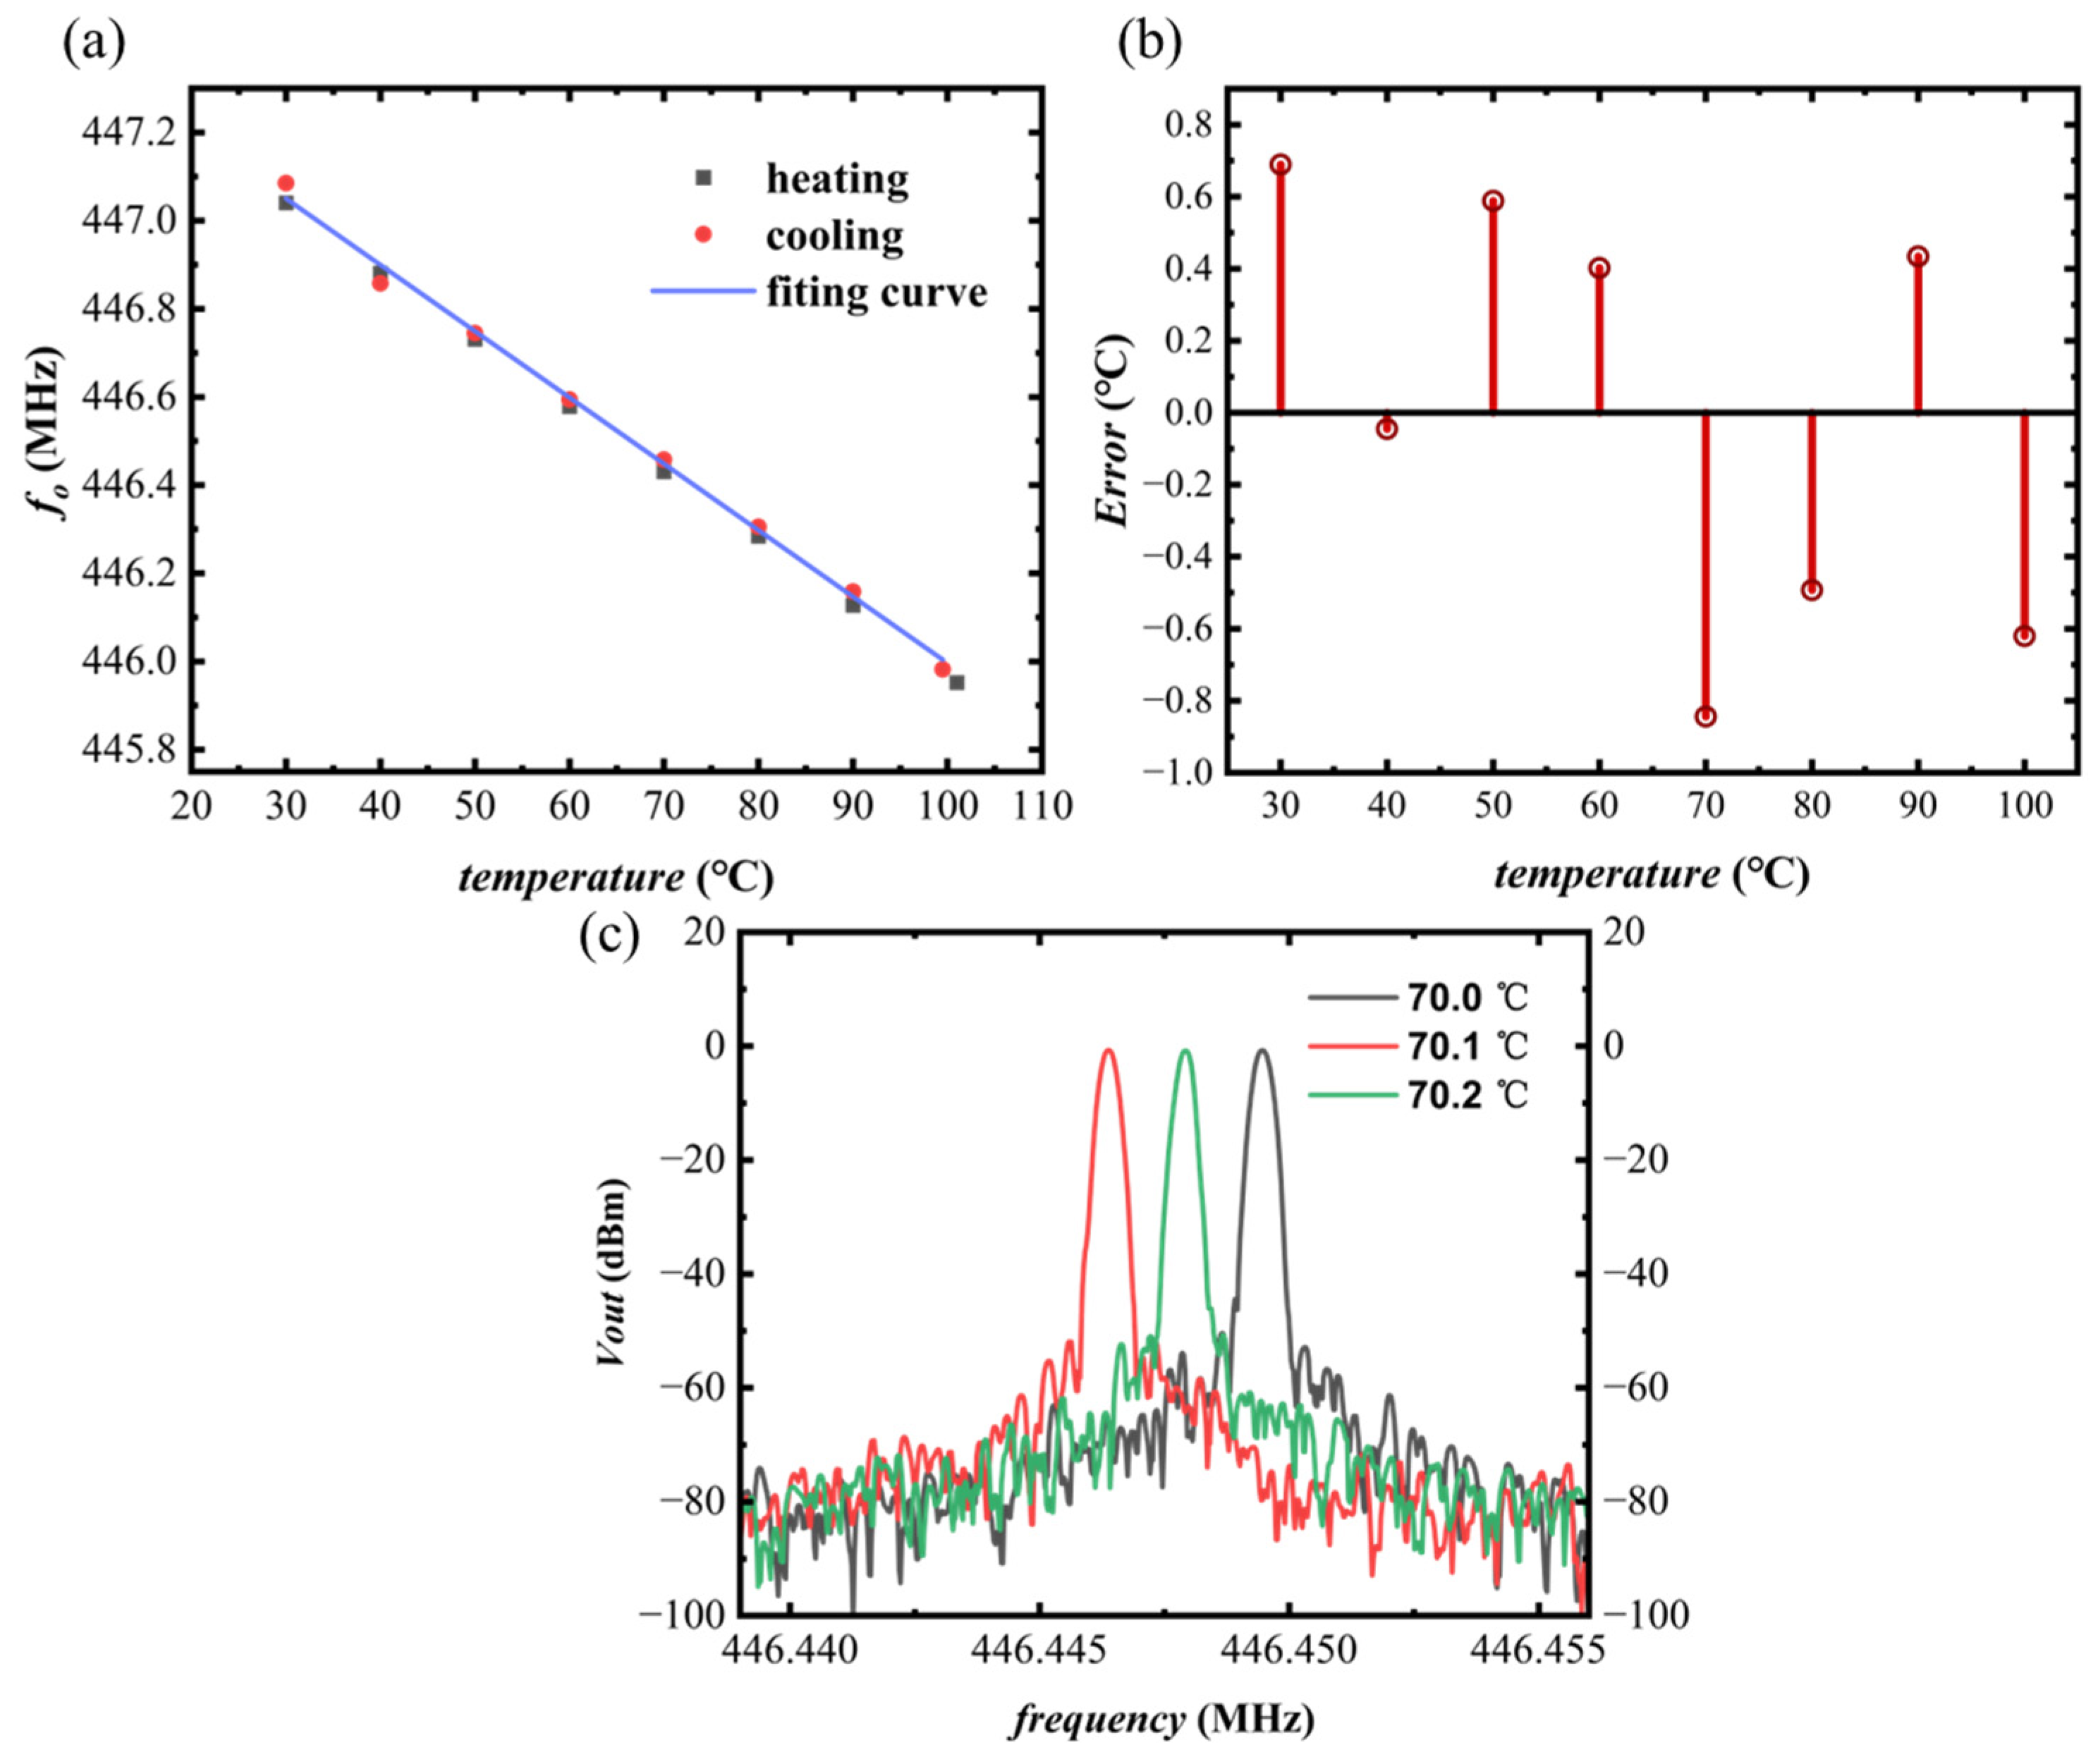
3.2. Measurement by Oscillator Circuit

The actual oscillating circuit test system is shown in Figure 8a, and an enlarged view of the fabricated circuit board is also shown in the figure. The AlN/ScAlN thin-film SAW resonator was connected with the circuit board through the gold wire. The oscillator was attached to the heating platform of the heating plate, and the temperature change was controlled by the heating plate. The oscillator was connected to a signal analyzer, and the spectrum at different temperatures was recorded by signal analyzer. The temperature was measured with a high-precision thermocouple. The output spectrum of the oscillation circuit at room temperature measured by Kesight N9200A signal analyzer is shown in Figure 8b and the output frequency was 447.08 MHz.
In the range of 30–100 °C, the curve of the output frequency versus temperature measured by the oscillator is shown in Figure 9a. As with the direct measurement method, in the range of 30–100 °C the output frequency of the oscillator varied with temperature as shown in Equation (8). Combined with Equation (6), the linearity of the system can be obtained as 0.0028%. From the measurement results shown in Figure 9a, the sensitivity of oscillator circuit measurement was −33.6 ppm/°C. Figure 9b shows the measurement accuracy of the system, and in the range of 30–100 °C, errors through the oscillation circuit were within ±1.6 °C. Figure 9c shows the minimum resolution of the sensor, and the sensor responded when the temperature changed by 0.1 °C.
f o = 0.0151 T + 447.502 .

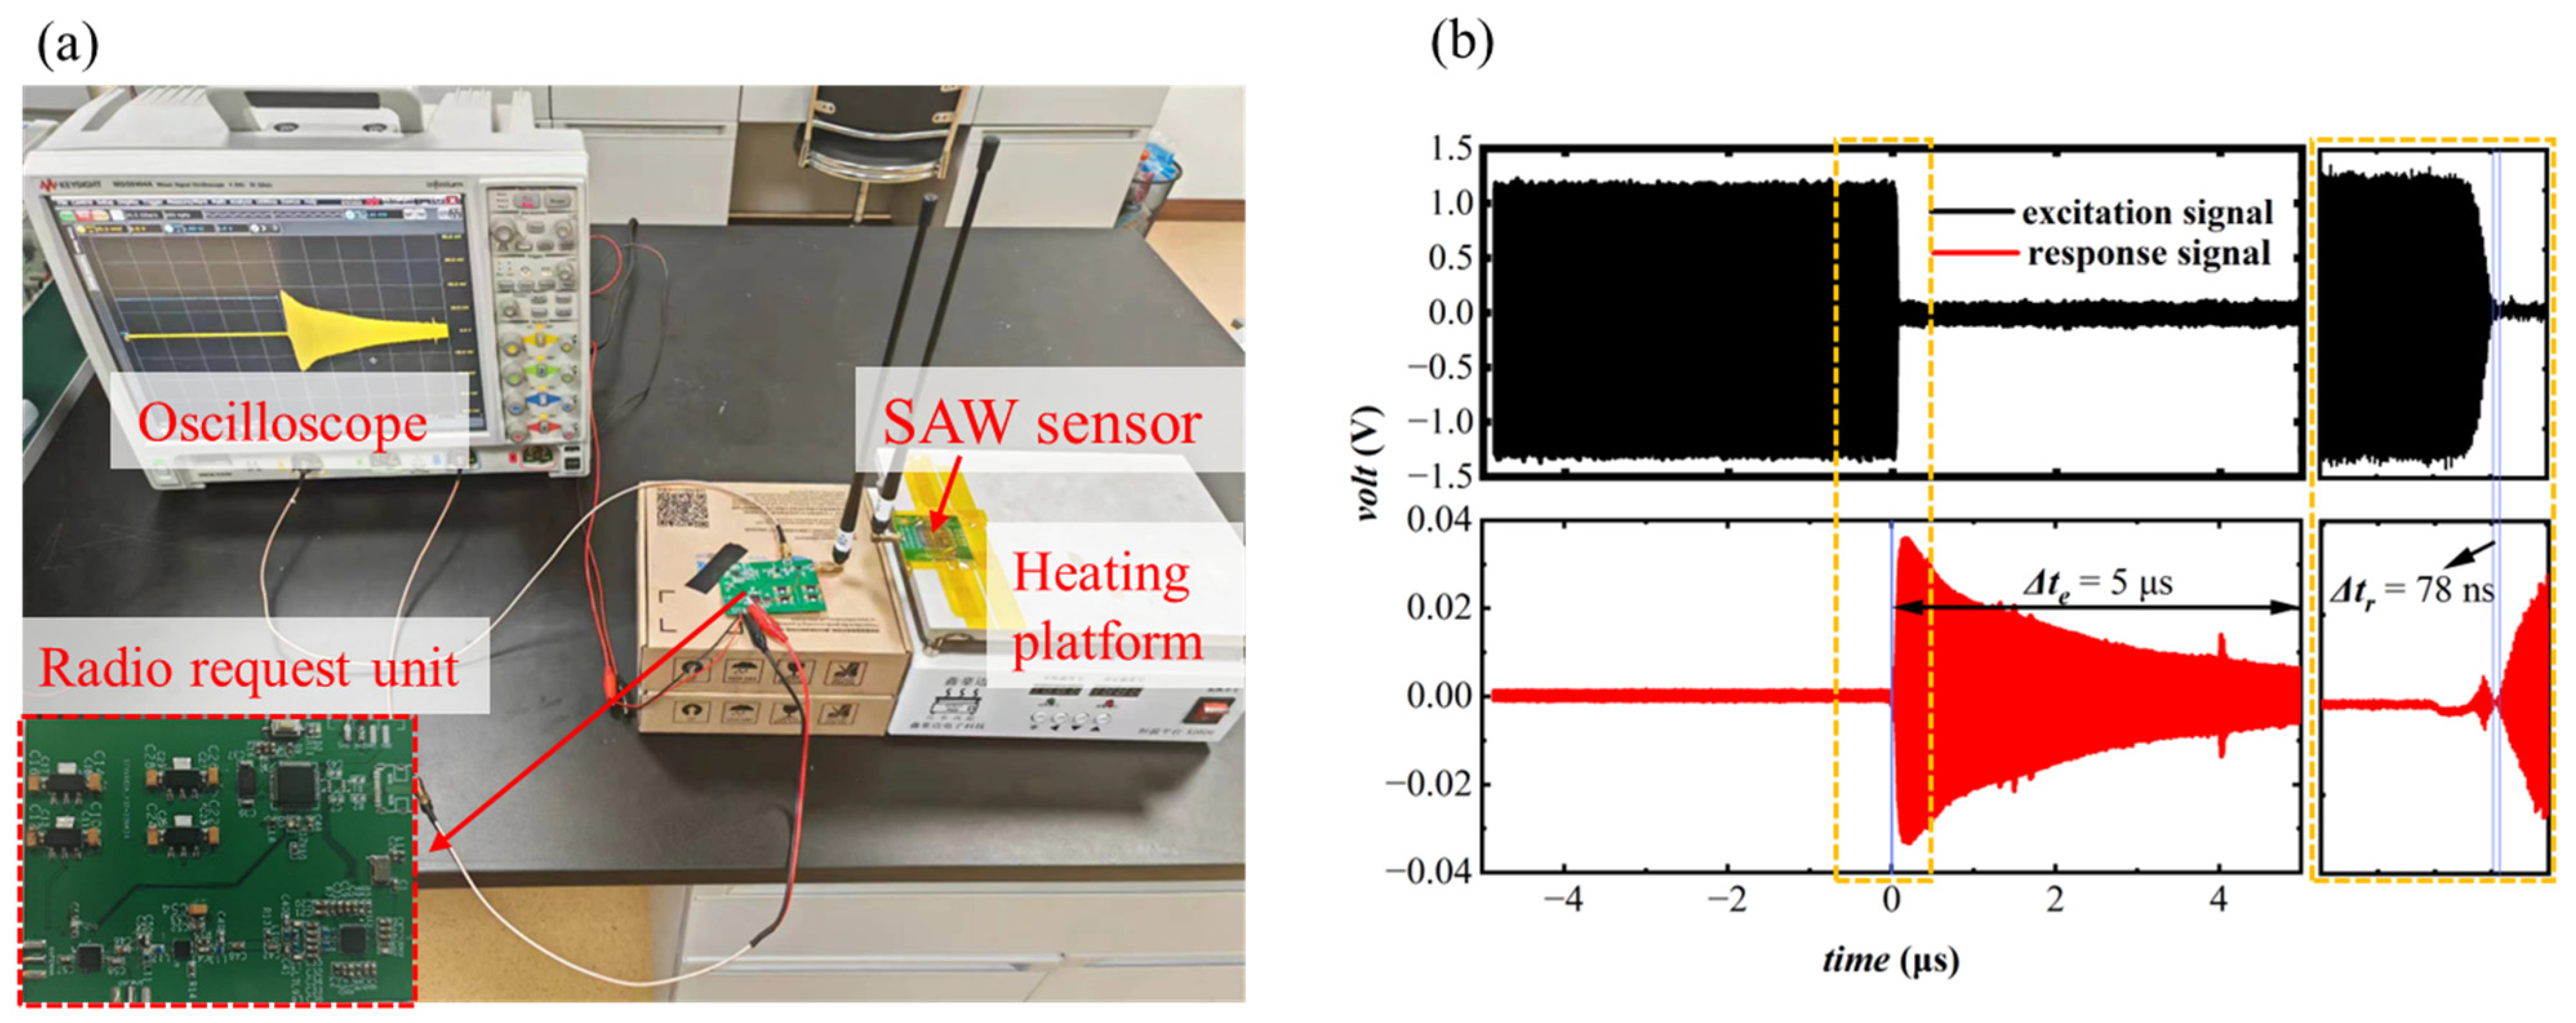
3.3. Measurement by Wireless Test System

As shown in Figure 10a, the wireless SAW sensor temperature test was also performed on a heating plate. The results shown in Figure 10b were obtained through two measurements. First, without connecting the antenna, a sample excitation signal was sent through an oscilloscope at the antenna interface, using the falling edge of the control signal of the RF switch as the trigger condition. Then, the response signal was sampled through an oscilloscope at the response signal output interface, and the falling edge of the control signal of the radio frequency switch was also used as the trigger condition. In this way, the sampled excitation signal and response signal had the same time base. In the results shown in Figure 10b, before 0 μs, mainly an excitation signal was generated by the signal generator; the 0 μs signal generator stopped, and the SAW resonator generated a response signal. The time from the stop of the exciting radio signal to the direct response of the wireless sensor was about 78 ns and valid signal duration was 5 μs.
The frequency change curves of heating and cooling obtained by the wireless measurement method are shown in Figure 11a. The heating curve and the cooling curve were respectively fitted to obtain the fitting curve and Equation (9). The relationship between temperature and frequency measured by the wireless test system is shown in Equation (9). From the results, we can see the sensitivity of the sensor was −29.3 ppm/°C. Combined with Equation (6), the linearity of the system can be obtained as 0.0090%.
f w h = 0.0131 T + 446.661 .
Figure 11b shows the measurement accuracy of the wireless test system, and within the range of 30–100 °C the error was within ± 2 °C. Because the RF switch could not completely isolate the signals of the two switching ports, in Figure 11b, in addition to the response signal, there are several signals whose frequency does not change with temperature. These signals were excitation signals that leaked through the RF switch to the output. Figure 11c shows the minimum resolution of the sensor, and the sensor responded when the temperature changed by 2.0 °C.
In this work, the signal generator was not turned off when the RF switch was in the receiving state, which canceled the signal generator-initiated off-start time. It improved system response. Therefore, there was a weak excitation signal leaked through the RF switch to the response signal output. The response in the response signal is shown in Figure 3, and there were some signals with a higher frequency than the response signal.
In contrast to the other two methods, the transmission distance was also an important parameter of the wireless test system. Under the test conditions of Figure 11a, changing the distance between the sensor antenna and the wireless transceiver system antenna obtained the results shown in Figure 11d. As shown in Figure 11d, the maximum transmission distance to ensure that the system received valid signals was 200 mm.
Figure 11. (a) Scatter diagrams and fitting curves of the relationship between frequency and temperature measured by wireless test system, (b) measured temperature accuracy of wireless test system, (c) the test curve of the sensor resolution, showing the output signal frequencies at the three temperatures of 61 °C, 63 °C, and 65 °C were 445.766 MHz, 445.719 MHz, and 445.671 MHz, respectively, and (d) the relationship between the maximum peak-to-peak value of the response signal and the distance of the antenna transmission distance.
Electronics 12 03863 g011

4. Discussion and Conclusions

This paper investigated three different testing methods based on SAW temperature sensors. The experimental results showed that the sensitivities obtained with the three schemes were −28.9 ppm/K, −33.6 ppm/K, and −29.3 ppm/K. The measurement dynamic ranges of the three methods were all 70 °C. Since there was no additional external circuit in the direct measurement method, the linearity of the SAW sensor was best when the frequency shift of the SAW sensor was measured directly with a network analyzer, and the linearity of directly measuring the SAW sensor was within 0.0019%. The other two methods showed larger errors in heating and cooling results. The results showed the oscillator also had good temperature sensing performance, and the sensitivity was even slightly higher than that of direct measurement. Among the three methods, direct measurement results gave the best accuracy, with an accuracy of ±0.70 °C. Judging from the results, there is no doubt that direct measurement of SAW sensors is the most accurate method. However, direct measurement requires the use of network analyzers and probe stations, which are difficult to use outside the laboratory. An oscillator combined with a frequency mixing and detection circuit can provide a more portable means of temperature sensing. However, due to the inability of electronic components to work at extreme temperatures, it cannot be used in temperatures that are too high or too low. Wireless sensing is the most difficult of the three methods because SAW resonators have limited energy storage and therefore respond to very weak radio signals. Their response signals are doped with many disturbances. So, the signal processing circuit of the wireless sensor system is very complicated. Although the signal processing circuit is complex, sensor units composed of an impedance matching structure and antenna have a simple structure. Therefore, this wireless passive measurement method allows wireless sensors to be applied to various closed conditions and high-speed moving parts.

Author Contributions

Conceptualization, Y.L.; Methodology, M.W.; Validation, M.W.; Investigation, Y.Q., X.G., Y.W., W.L., Y.C., S.G. and C.S.; Writing—original draft, M.W.; Writing—review & editing, Y.L. and Y.Q.; Project administration, Y.L. All authors have read and agreed to the published version of the manuscript.

Funding

This research was supported by the Key R&D program of Hubei Province under Grant No. 2022BAA049, the National Natural Science Foundation of China (Grant No. 62201405), and the Fundamental Research Funds for the Central Universities (Grant No. 2042023gf0002), and the China Postdoctoral Science Foundation (Grant No. 2022M712460).

Data Availability Statement

Data and code are available from the corresponding authors upon reasonable request.

Acknowledgments

The numerical calculations in this paper have been done on the supercomputing system in the Supercomputing Center of Wuhan University.

Conflicts of Interest

The authors declare no conflict of interest.

References

  1. Gulati, K.; Boddu, R.S.K.; Kapila, D.; Bangare, S.L.; Chandnani, N.; Saravanan, G. A review paper on wireless sensor network techniques in Internet of Things (IoT). Mater. Today Proc. 2022, 51, 161–165. [Google Scholar] [CrossRef]
  2. Wang, M.W.; Yao, Z.; Guo, W.Q.; Li, Q.H.; Li, Q.J. Design of the Chemical Reaction Tank Temperature Acquisition System Based on Wireless Sensor Networks. Adv. Mater. Res. 2014, 945–949, 1982–1986. [Google Scholar] [CrossRef]
  3. Tang, Z.; Wu, W.; Gao, J. A wireless passive SAW delay line temperature and pressure sensor for monitoring water distribution system. In 2018 IEEE SENSORS; IEEE: Piscataway, NJ, USA, 2018; pp. 1–4. [Google Scholar] [CrossRef]
  4. Fachberger, R.; Erlacher, A. Monitoring of the temperature inside a lining of a metallurgical vessel using a SAW temperature sensor. Procedia Chem. 2009, 1, 1239–1242. [Google Scholar] [CrossRef]
  5. Binder, A.; Fachberger, R. Wireless SAW temperature sensor system for high-speed high-voltage motors. IEEE Sens. J. 2010, 11, 966–970. [Google Scholar] [CrossRef]
  6. Thiele, J.A.; Da Cunha, M.P. High temperature LGS SAW gas sensor. Sens. Actuators B Chem. 2006, 113, 816–822. [Google Scholar] [CrossRef]
  7. Neumeister, J.; Thum, R.; Lüder, E. A SAW delay-line oscillator as a high-resolution temperature sensor. Sens. Actuators A Phys. 1990, 22, 670–672. [Google Scholar] [CrossRef]
  8. Penza, M.; Cassano, G. Relative humidity sensing by PVA-coated dual resonator SAW oscillator. Sens. Actuators B Chem. 2000, 68, 300–306. [Google Scholar] [CrossRef]
  9. Ai, Y.; Lv, H.; Huang, Y.; He, J.; Wang, Y.; Wu, J.; Zhang, Y. AlN/Sapphire-based SAW resonators with Q over 10,000 for temperature sensors. IEEE Sens. J. 2023, 23, 8261–8267. [Google Scholar] [CrossRef]
  10. Viens, M.; Cheeke, J.D.N. Highly sensitive temperature sensor using SAW resonator oscillator. Sens. Actuators A Phys. 1990, 24, 209–211. [Google Scholar] [CrossRef]
  11. Schimetta, G.; Dollinger, F.; Scholl, G.; Weigel, R. Wireless pressure and temperature measurement using a SAW hybrid sensor. In Proceedings of the 2000 IEEE Ultrasonics Symposium. Proceedings. An International Symposium (Cat. No. 00CH37121), San Juan, PR, USA, 22–25 October 2000; Volume 1, pp. 445–448. [Google Scholar] [CrossRef]
  12. Sorokin, A.; Shepeta, A.; Wattimena, M. Wireless SAW passive tag temperature measurement in the collision case. J. Phys. Conf. Ser. 2018, 1008, 012015. [Google Scholar] [CrossRef]
  13. Zhou, X.; Tan, Q.; Liang, X.; Lin, B.; Guo, T.; Gan, Y. Novel multilayer SAW temperature sensor for ultra-high temperature environments. Micromachines 2021, 12, 643. [Google Scholar] [CrossRef]
  14. Kang, A.; Zhang, C.; Ji, X.; Han, T.; Li, R.; Li, X. SAW-RFID enabled temperature sensor. Sens. Actuators A Phys. 2013, 201, 105–113. [Google Scholar] [CrossRef]
  15. Lin, B.; Liu, Y.; Cai, Y.; Zhou, J.; Zou, Y.; Zhang, Y.; Liu, W.; Sun, C. A high Q value ScAlN/AlN-based SAW resonator for load sensing. IEEE Trans. Electron Devices 2021, 68, 5192–5197. [Google Scholar] [CrossRef]
  16. Singh, H.; Parmar, Y.; Raj, V.B.; Pandya, H.M.; Kumar, J.; Mishra, M.; Nimal, A.T.; Sharma, M.U. Sensitivity enhancement studies of SAW vapor sensor by oscillator tuning using varactor diode. IEEE Sens. J. 2017, 17, 1391–1398. [Google Scholar] [CrossRef]
  17. Zhao, C.; Geng, W.; Qiao, X.; Xue, F.; He, J.; Xue, G.; Liu, Y.; Wei, H.; Bi, K.; Li, Y.; et al. Anti-irradiation SAW temperature sensor based on 128° YX LiNbO3 single crystal. Sens. Actuators A Phys. 2022, 333, 113230. [Google Scholar] [CrossRef]
  18. Zhang, Y.; Tan, Q.; Zhang, L.; Zhang, W.; Xiong, J. A novel SAW temperature-humidity-pressure (THP) sensor based on LiNbO3 for environment monitoring. J. Phys. D Appl. Phys. 2020, 53, 375401. [Google Scholar] [CrossRef]
  19. Hasan, S.A.; Gibson, D.; Song, S.; Wu, Q.; Ng, W.P.; McHale, G.; Dean, J.; Fu, Y.Q. ZnO thin film based flexible temperature sensor. In 2017 IEEE SENSORS; IEEE: Piscataway, NJ, USA, 2017; pp. 1–3. [Google Scholar] [CrossRef]
  20. Liu, Y.; Lin, B.; Xie, Y.; Soon, B.W.; Cai, Y.; He, J.; Sun, C. Boosting Performance of SAW Resonator via AlN/ScAlN Composite Films and Dual Reflectors. IEEE Trans. Ultrason. Ferroelectr. Freq. Control 2023. [Google Scholar] [CrossRef] [PubMed]
  21. Nian, L.; Qu, Y.; Gu, X.; Luo, T.; Xie, Y.; Wei, M.; Cai, Y.; Liu, Y.; Sun, C. Preparation, Characterization, and Application of AlN/ScAlN Composite Thin Films. Micromachines 2023, 14, 557. [Google Scholar] [CrossRef] [PubMed]
  22. Luo, T.; Xu, Q.; Wen, Z.; Qu, Y.; Zhou, J.; Lin, B.; Cai, Y.; Liu, Y.; Sun, C. Spurious-Free S1 Mode AlN/ScAlN-Based Lamb Wave Resonator with Trapezoidal Electrodes. IEEE Electron Device Lett. 2023, 44, 574–577. [Google Scholar] [CrossRef]
  23. Bjurström, J.; Katardjiev, I.; Yantchev, V. Lateral-field-excited thin-film Lamb wave resonator. Appl. Phys. Lett. 2005, 86, 154103. [Google Scholar] [CrossRef]
  24. Yantchev, V.; Enlund, J.; Biurström, J.; Katardjiev, I. Design of high frequency piezoelectric resonators utilizing laterally propagating fast modes in thin aluminum nitride (AlN) films. Ultrasonics 2006, 45, 208–212. [Google Scholar] [CrossRef] [PubMed]
  25. Liu, J.; Zhao, Z.; Zhang, M.; Jin, J.; Zhu, Y.; Fang, Z.; Gao, T.; Du, L. Analyzing the effect of the Front-end circuit for the FBAR sensor. Measurement 2020, 151, 107237. [Google Scholar] [CrossRef]
  26. Zou, Y.; Gao, C.; Zhou, J.; Liu, Y.; Xu, Q.; Qu, Y.; Liu, W.; Soon, J.B.W.; Cai, Y.; Sun, C. Aluminum scandium nitride thin-film bulk acoustic resonators for 5G wideband applications. Microsyst. Nanoeng. 2022, 8, 124. [Google Scholar] [CrossRef] [PubMed]
  27. Pohl, A. A review of wireless SAW sensors. IEEE Trans. Ultrason. Ferroelectr. Freq. Control 2000, 47, 317–332. [Google Scholar] [CrossRef]
  28. Wen, Y.; Li, P.; Yang, J.; Zheng, M. Detecting and evaluating the signals of wirelessly interrogational passive SAW resonator sensors. IEEE Sens. J. 2004, 4, 828–836. [Google Scholar] [CrossRef]
Figure 1. (a) TCF measurement system block diagram, (b) oscillation circuit measurement system block diagram, and (c) wireless measurement system block diagram.
Electronics 12 03863 g001
Figure 2. (a) Three-dimensional model of AlN/ScAlN thin film SAW resonator, (b) comparison of simulation results of three different types of films, (c) simulated impedance curve and device surface displacement diagram at fs of the AlN/ScAlN composite thin-film SAW resonator, (d) simulation of resonator impedance variation with temperature.
Electronics 12 03863 g002
Figure 5. Circuit diagram of wireless passive sensor system.
Electronics 12 03863 g005
Figure 6. (a,b) Direct measurement system, (c) S parameter test curve, and (d) impedance curve of AlN/ScAlN SAW resonator.
Electronics 12 03863 g006
Figure 7. (a) Scatter diagrams and fitting curves of the relationship between frequency and temperature measured by direct measurement method, (b) measured temperature accuracy of measurement by network analyzer, and (c) the test curve of the sensor resolution, showing the fs values at the three temperatures of 70 °C, 70.1 °C, and 70.2 °C were 446.873 MHz, 446.874 MHz, and 446.875 MHz, respectively.
Electronics 12 03863 g007
Figure 8. (a) Oscillation circuit test system and the PCB board of oscillator, and (b) oscillator output spectrogram.
Electronics 12 03863 g008
Figure 9. (a) Scatter diagrams and fitting curves of the relationship between frequency and temperature measured by oscillator circuit, (b) accuracy of temperature measurement by oscillator circuit, and (c) the test curve of the sensor resolution, showing the output signal frequencies at the three temperatures of 70 °C, 70.1 °C, and 70.2 °C were 446.449 MHz, 446.448 MHz, and 446.446 MHz, respectively.
Electronics 12 03863 g009
Figure 10. (a) Wireless sensor test system and radio request unit, and (b) excitation and response signal test results diagram of wireless sensor measurement system.
Electronics 12 03863 g010
Table 1. Deposition parameters of AlN and ScAlN.
MaterialAlNScAlN
Target power (kW)610
Pulsing frequency (kHz)100100
Temperature (°C)200200
Ar flow (sccm)2519
N2 flow (sccm)155105
Base pressure (Torr)<5 × 10⁻⁸<2 × 10⁻⁷
Table 2. Fitting parameters of the resonator mBVD model.
CmLmRmC0R0Rs
10.007 fF12.697 nH2.000 Ohm3.544 pF12.602 Ohm15.724 Ohm
Disclaimer/Publisher’s Note: The statements, opinions and data contained in all publications are solely those of the individual author(s) and contributor(s) and not of MDPI and/or the editor(s). MDPI and/or the editor(s) disclaim responsibility for any injury to people or property resulting from any ideas, methods, instructions or products referred to in the content.

