1. Introduction
Air-to-air refueling (AAR) is an important method to extend the range of aircraft and ensure the successful completion of flight missions. The concept of air-to-air refueling aircraft was initially proposed by Alexander de Seversky. Subsequently, the US Land Aviation Team pioneered the use of a 15 m long rubber hose for air-to-air refueling and achieved success [
1]. Since then, air-to-air refueling technology has seen significant advancements in both military and civilian applications. In the military domain, air-to-air refueling has proven increasingly advantageous for military aircraft, especially after the Gulf War. In the civilian field, the European Union (EU) has demonstrated the benefits of refueling in civil aviation and introduced the concept of the “Civil Air-to-Air Refueling Transport System”. Research indicates that this system can reduce the overall refueling costs by 9% [
2].
Air-to-air refueling planning (AARP) plays a critical role in ensuring the seamless execution of air-to-air refueling missions, encompassing the selection of refueling airspace, route planning, and determination of refueling volume. The planning outcomes directly impact the economic and time costs of air-to-air refueling missions, ultimately influencing mission efficiency. Consequently, optimizing the air-to-air refueling planning process holds significant potential for enhancing mission success. In conventional planning methods, experienced task planners often rely on tools such as wind recorders to deduce the chart. However, this manual approach lacks the ability to balance overall objectives, may overlook crucial conditions, and requires considerable human and material resources, leading to increased costs. Therefore, employing an optimization algorithm for air-to-air refueling planning becomes imperative to achieve high-efficiency air-to-air refueling missions.
In recent years, scholars have proposed numerous constructive planning models and optimization methods for air-to-air refueling planning, broadly categorized into unmanned aerial vehicle (UAV) planning and manned aerial vehicle planning [
3,
4,
5,
6]. For UAV AARP, Yoon introduced a two-stage UAV rendezvous approach with refueling tankers during air-to-air refueling, along with three-dimensional rendezvous path planning based on this theory [
7]. Sundar and Rathinam presented a single UAV and multiple depots planning model formulated as a mixed-integer linear programing problem, enabling UAVs to traverse given target points with minimal fuel consumption [
8]. Building upon this, Levy employed fast variable neighborhood descent and variable neighborhood search (VNS) heuristics to plan refueling paths for multiple UAVs and depots [
9]. Ferdowsi utilized a zero-one integer programing model to optimize the distribution of refueling tankers [
10]. For large UAV AARP, Hansknecht applied the ordinary differential equations (ODE) model to optimize the refueling tanker’s path for fleet air-to-air refueling scenes, resulting in a more than 50% reduction in the fleet’s overall fuel consumption [
11]. Bush developed a heuristic algorithm with refueling legs and refueling fuel as variables to determine the optimal strategy for single-aircraft air-to-air refueling deployment. This involved setting up multiple air-to-air refueling aircraft at fixed positions to provide refueling services for the fuel-receiving aircraft [
12]. Kannon considered threat zone and no-fly zone constraints to enhance the simulation model’s resemblance to the actual environment and proved that AARP is a nondeterministic polynomial (NP) problem [
13]. In subsequent research, Kannon compared the performance of mixed-integer linear programing (MILP) and dynamic programing (DP) in solving AARP efficiency, demonstrating that DP can achieve faster solving speed and more accurate planning solutions.
The aforementioned methods and planning models offer valuable insights for addressing air-to-air refueling planning (AARP). However, the majority of these approaches primarily focus on single-objective optimization, meaning they only consider a single objective function. As air-to-air refueling technology becomes more widespread and the demand for tasks increases, the conflict between economic efficiency and timeliness in air-to-air refueling becomes more and more pronounced. Experts have recognized that both the two goals must be simultaneously considered as planning objectives for AARP [
14,
15,
16]. Consequently, the planning algorithm designed for single-objective optimization is no longer adequate to meet the demands of AARP planning [
17,
18].
Nondominated Sorting Genetic Algorithm-II (NSGA-II), being a multi-objective optimization algorithm, has gained widespread application across various domains owing to its exceptional characteristics [
19,
20,
21]. It reduces the complexity of noninferior sorting genetic algorithm and has the advantages of fast running speed and good convergence of solution set. Therefore, NSGA-II has gradually become the benchmark of the performance of other multi-objective optimization algorithms. Nevertheless, when it comes to the complexity and nonlinearity of air-to-air refueling planning, research indicates that the standard NSGA-II encounters the following issues while addressing such problems: firstly, the selection and crossover operators utilized by NSGA-II are based on genetic algorithms [
22,
23], resulting in reduced efficiency and convergence of the results [
22,
24]. Secondly, the algorithm’s performance is significantly influenced by the initial parameter settings [
25], relying heavily on manual user adjustments.
To enhance the computational efficiency of NSGA-II, three improvements were implemented. Firstly, the selection and crossover operators from differential evolution were substituted for those in the standard NSGA-II. This modification aimed to bolster the algorithm’s performance. Secondly, an adaptive algorithm parameter change strategy was adopted, enabling dynamic algorithm parameter adjustments to further optimize efficiency. Lastly, a quadratic solution strategy based on prior knowledge was utilized to attain more precise and dependable results.
In this article, an enhanced NSGA-II algorithm is proposed to improve the convergence and diversity of the solution set. Simulation experiments demonstrate that the proposed NSGA-II offers higher reliability and yields relatively stable results. The research findings have a considerable impact on enhancing the efficiency of air-to-air refueling planning, providing decision makers with a valuable theoretical reference for determining optimal air-to-air refueling plans.
2. Task Description and Basic Assignments
Currently, three primary methods of convergence between refueling tankers and fuel receivers exist: concomitant, convergence, and air waiting. Each of the three methods has its advantages and disadvantages. Among them, the accompanying and air holding methods have disadvantages such as high fuel consumption and easy detection [
26], which is inconsistent with the research objectives of this article, so it is not currently considered. As a result, this study focuses on the convergence mode, where refueling tankers and fuel receivers come together at a designated location for air-to-air refueling.
2.1. Task Description
In the scenario studied in this article, the aircraft remote delivery task is divided into two stages. The first stage involves the mission aircraft traveling from the takeoff airport to the delivery point. During this phase, the mission aircraft has the flexibility to fly in local and open sea areas, allowing for the selection of flight routes and refueling points that best suit the mission’s requirements. The second stage encompasses the completion of air-to-air refueling and the safe exit from the landing airport, while also avoiding hazardous weather conditions and challenging terrains after fulfilling the delivery mission. During this stage, refueling points are strategically selected along the established route.
In this research, we refer to the first stage of air-to-air refueling planning as the “Entry stage” and the second stage as the “Exit stage”.
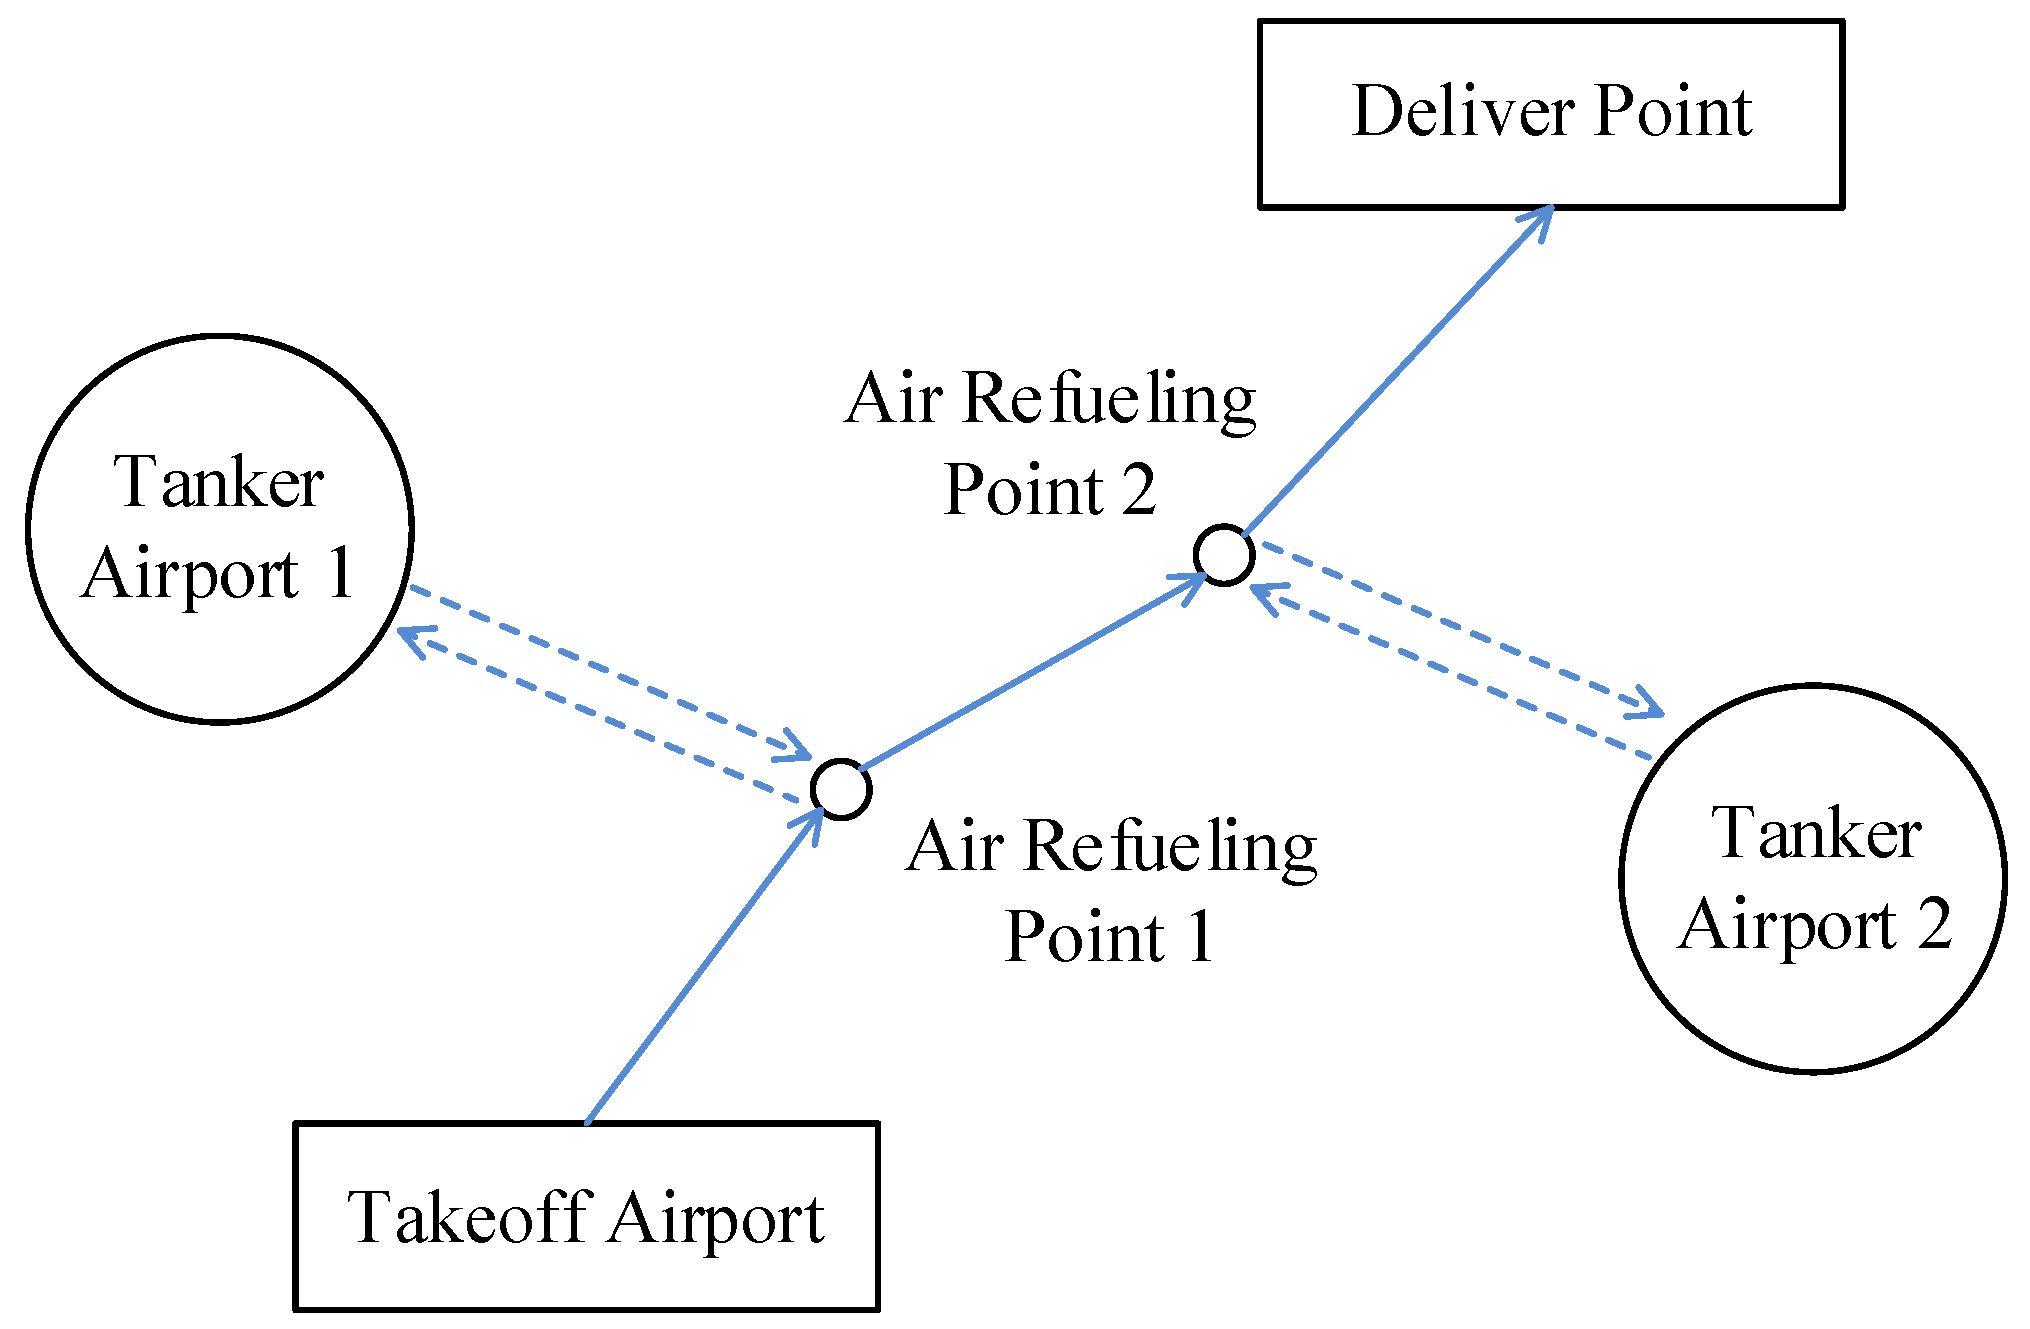
Figure 1 illustrates the route planning for the mission aircraft, flying from the takeoff airport to the target area for the next phase. To ensure smooth aircraft progression and reserve an adequate fuel supply, multiple air-to-air refueling operations are conducted, with different tanker airports responsible for refueling and providing alternate landing support. After completing air-to-air refueling in the designated airspace, the mission aircraft continues its flight to the next target point, while the refueling tanker returns to the airport following the original route.
In the exit stage, once the delivery mission is completed, the mission aircraft follows the predetermined route to reach the designated landing airport, as depicted in
Figure 2. To guarantee that the aircraft has sufficient fuel for a safe exit to the landing airport, tanker airport 3 will provide air-to-air refueling support along the route.
2.2. Basic Assumption
In order to ensure the convenience and applicability of establishing the model, this study has reviewed the data and formulated the following five fundamental assumptions, which do not compromise the authenticity of the experiment:
Ignoring the influence of wind direction, wind speed, and weather, the aircraft flies at cruising speed throughout the entire journey.
Neglecting the time and flight distance consumed by the aircraft during refueling.
The refueling efficiency of air-to-air refueling is a necessary parameter to describe the refueling loss. It refers to the ratio of the amount of fuel received by the receiver to the amount of fuel output by the tanker (received fuel/output fuel ∗100%). During the implementation of aerial refueling, a small amount of fuel consumption (about 5%) will be caused by the instability of the aircraft itself and other factors, so the refueling efficiency is set to 95%.
All aircraft use fixed heights and fly at large circular distances.
represent two points in longitude and latitude and the distance
between these two points is:
where
R is the earth radius, taking 6371.393 km.
3. Air-To-Air Refueling Planning Model
3.1. Fuel Consumption Parameter
According to the flight dynamics formula [
27], it can be seen that:
In the given analysis, several key parameters are defined to model the flight dynamics of the mission aircraft:
represents the flight distance of the mission aircraft.
and denote the total weight of the aircraft at takeoff and after flying the distance, respectively, where the difference is the fuel consumption during the flight.
represents the engine propulsion efficiency (engine power) of the aircraft.
is the ratio of the aircraft’s lift coefficient to drag coefficient.
stands for the cruising speed of the aircraft.
denotes the local gravitational acceleration.
signifies the fuel consumption efficiency for aircraft engines.
To simplify the formula, coefficient
c is introduced to represent the constant in Formula (2) excluding weight.
By combining Formulas (2) and (3), the following equation can be derived:
In this way, the flight distance when the aircraft consumes fuel and the maximum flight distance when the aircraft carries fuel can be calculated.
By transforming Formula (4), the fuel consumption can be obtained when the takeoff weight of the aircraft is
and the range is
:
3.2. Time Consuming Parameters
According to the formula of flight distance and time:
When the flight speed remains constant, the time parameter can be equivalently represented by the flight distance. As depicted in
Figure 3, the theoretical shortest flight distance is denoted as
, and the actual total flight distance is given by:
where
is the flight distance of each segment.
The flight time coefficient of the mission aircraft can be defined as the ratio of the actual flight time to the theoretical shortest flight time.
3.3. Objective Function and Constraints
In the whole flight process of the mission, on the one hand, it is necessary to consider the total fuel consumption of the tanker and the mission aircraft as little as possible, so as to improve the economy. On the other hand, it is necessary to consider the time required for the task aircraft from the beginning to the completion of the task to ensure the timeliness of the task. Therefore, based on the above two optimization parameters, the objective function of the model can be obtained as follows:
where
is the set of all nodes on the planned path, from which the distance
of each leg can be calculated.
is the air refueling volume of a single aircraft when the aircraft performs the air refueling task,
is the fuel load of the aircraft at the beginning of the segment, and
is the type of aircraft (including tanker and receiver, and the aerodynamic performance parameters and empty weight of different aircraft are different).
represents the total fuel consumption of the task and
represents the time-consuming parameter of the task.
In the whole model, the input variables are the location information of takeoff airport, landing airport, tanker airport, and delivery point, as well as the takeoff fuel load of the receiver and two tankers. The optimization variable is the longitude and latitude co-ordinates of multiple aerial refueling points, and the routes with different focuses are planned according to the different positions of refueling points.
To guarantee the successful completion of the task by both the aircraft and the refueling tanker, while also allowing room for emergency contingencies, the following constraints are established:
At least 5% of the maximum fuel capacity of the backup fuel capacity when reaching a path node.
Upon completion of the refueling task, the refueling tanker maintains a sufficient fuel level to safely return to the designated airport.
The mission aircraft is equipped with an ample fuel supply to facilitate its return to the previous refueling point or an alternate landing site after successfully completing the assigned mission at the target point.
The takeoff weight of both the refueling tanker and the mission aircraft is constrained to be less than the maximum takeoff weight of the respective aircraft.
4. Improvement and Implementation of NSGA-II Algorithm
The Non-dominated Sorting Genetic Algorithm (NSGA) was originally proposed by Srinivas and Deb building upon the concept of Pareto optimal solutions [
28,
29]. This algorithm has found widespread application in multi-objective optimization. However, as the problem complexity increases, its solving complexity also rises, and it exhibits a drawback of relying on specific shared parameters. To enhance the algorithmic efficiency, Deb et al. introduced the NSGA-II [
30], which significantly enhances the algorithm’s solving capability. The specific improvements can be summarized as follows:
In NSGA, the computational complexity for non-dominated sorting is , where M represents the number of optimization objectives and N is the population size. However, the NSGA-II, which employs fast non-dominated sorting, effectively reduces the computational complexity to .
In contrast to NSGA, which relies on user-specified shared parameters (where the appropriateness of parameter settings significantly affects algorithmic efficiency), NSGA-II enhances population diversity by evaluating the crowding distance of each individual and employing crowding distance comparison operators to guide offspring selection.
NSGA-II employs a strategy that combines the parent population with the offspring population to expand the sampling space of the population. Additionally, it utilizes a hierarchical elite retention strategy to preserve the best individuals, thus minimizing the loss of exceptional individuals.
4.1. Algorithm Improvement
Owing to its aforementioned characteristics, particularly its remarkable performance in handling complex scenarios, NSGA-II has found widespread application in research related to intricate task planning, path search, and various other domains. Nonetheless, the standard NSGA-II exhibits certain limitations in areas such as initial population generation, crossover, and selection operators [
31]. To enhance the algorithm’s optimization efficiency, the following three improvements were proposed in this study for air-to-air refueling planning (see
Section 4.1.1,
Section 4.1.2 and
Section 4.1.3 for details).
4.1.1. Selection and Crossover Operators Based on Differential Evolution Algorithm
In NSGA-II, the crossover and mutation operations are traditionally based on genetic algorithms. However, research indicates that this approach can reduce the rate of convergence and search speed of NSGA-II [
24]. To enhance the algorithm’s efficiency in solving the air-to-air refueling planning model, this paper introduces the crossover and mutation operations of differential evolution, thereby improving the traditional NSGA-II.
Differential evolution (DE) is an intelligent search algorithm rooted in the theory of swarm intelligence. It was originally proposed by Storn et al. to address Chebyshev’s polynomials [
32]. When compared to traditional intelligent algorithms such as genetic algorithms, particle swarm optimization, and simulated annealing, DE has been demonstrated to exhibit superior search speed and accuracy [
33,
34].
The following methods are employed for mutation and crossover operations:
Randomly select three distinct individuals
,
, and
from the previous generation population, and combine them with a mutation operator to generate new individuals:
In order to enhance the diversity of interference parameters, a crossover operator
is applied after mutation. This crossover operator combines the variables from the original population
with those from the mutated population
, resulting in a new crossover population
, which is denoted as:
Among them, is a random number between 0 and 1, and is a random quantity between 0 and , which ensures that at least one dimension of the variable is obtained from the mutated population.
4.1.2. Adaptive Algorithm Parameter Changes Strategy
The coefficient of variation and cross coefficient are two crucial parameters that significantly impact the efficiency of differential evolution. In the standard differential evolution process, these parameters are typically predetermined before the algorithm commences, and their values remain constant throughout the execution. However, using larger coefficients can potentially result in the loss of excellent individuals within the population, while smaller coefficients may lead to sluggish population evolution. Research has shown that employing adaptive algorithm parameters can effectively enhance population diversity and search efficiency in differential evolution [
35]. Based on this insight, this article proposes the following method to implement adaptive algorithm adjustments:
As the number of iterations of the algorithm increases, the selection of mutation operator
of varying sizes becomes crucial:
where
represents the maximum evolution generation, while
signifies the current evolution generation. The value of
decreases progressively as the evolution generation advances. Consequently, the mutation operator
can be denoted as:
In this approach, during the initial stages of the algorithm evolution, the mutation operator is set to a larger value to prevent premature convergence. As the algorithm progresses, the mutation operator gradually decreases and approaches a specific threshold value to prevent the destruction of excellent individuals.
where
is the crossover probability and
is the random two decimal places obtained in 0–1.
This characteristic allows the crossover operator to vary within a defined range, which aids in preserving population diversity throughout the search process.
4.1.3. Second Search Strategy Based on Prior Knowledge
A second search strategy based on prior knowledge takes the result of the first search as a known condition, that is, prior knowledge. Based on this known condition, a second search is carried out to obtain more optimized results. In the initial phase of the algorithm, a population is typically generated, which can have considerable limitations in terms of exploration. By incorporating prior knowledge, the algorithm’s initial search efficiency can be effectively enhanced, leading to improved accuracy of the solution set [
36]. In light of this, this study employs a secondary search strategy to leverage prior knowledge and assist in algorithm evolution. The specific steps are outlined below:
Set as parameter interfaces in the algorithm.
During the initial search, set the parameter to and save the solution set obtained from the initial search.
During the second search, integrate the parameters of into the incoming parameters and use this combined set to create a new population. This new population is then utilized as the initial population for the second search phase.
The flow chart of this algorithm is shown in
Figure 4.
4.2. Algorithm Implementation
4.2.1. Encoding and Initialization
Due to the inability of NSGA-II to directly manage the parameters of the problem space, it is necessary to use encoding to represent the required feasible solutions as chromosomes for ease of solution. The commonly used encoding methods include binary encoding, grey encoding, real encoding, and permutation encoding. Among these methods, real number encoding is particularly suitable for solving the air-to-air refueling planning model since it does not require decoding and allows direct algorithm operations on the representation of the solution. Consequently, this study adopts the real number coding method to create chromosomes. The creation method is as follows:
Use a random function to generate a matrix with values ranging from 0 to 1 for each element, and is the number of variables.
Multiply the matrix by the corresponding variable value range matrix to obtain the matrix .
Add the minimum value of each variable to the matrix to obtain the chromosome matrix .
Analyze the feasibility of the chromosome. If not, recreate this process.
4.2.2. Fast Non-Dominated Sorting
The complexity of non-dominated sorting has a significant impact on the efficiency of the algorithm. To address this, this article introduces an efficient non-dominated sorting algorithm framework (ENS) [
37] and applies a sequential search strategy for non-dominated sorting (ENS-SS) within this framework.
In contrast to the standard NSGA-II, which sequentially determines the individuals in each frontier to complete non-dominated sorting, the ENS framework sequentially extracts individuals from the population and directly determines their frontiers. The flowchart in
Figure 5 illustrates this process, as shown below.
As depicted in
Figure 5, the individuals within the population are initially sorted based on the objective function values of each dimension, ensuring that individuals in lower ranks do not dominate those in higher ranks. Subsequently, the individuals in the population are sequentially selected and placed on their respective frontier surfaces from
to
to
. In this process, assuming that the leading edge of the individual
is
, and its number is
, and
is the set of dominant individuals that dominates
, then there is:
Next, Formula (16) can be utilized to determine the number of the leading-edge surface where the individual
is located, thereby transforming the problem into finding values of
that satisfy the conditions from 1 to
.
During the search process, individuals are evaluated to determine whether they dominate individual . If there are individuals dominating , then will be assigned to the corresponding front surface. The front surface of the first individual that does not dominate is the front surface where it is located. If there are individuals dominating until the last front surface, will be placed on a new front surface. Additionally, for individuals within the same frontier, since they are non-dominated by each other, their ranking order on the second dimensional goal is opposite to the first dimensional goal. Therefore, only needs to be compared with the last individual in the frontier to determine whether there is an individual dominating A within that frontier.
With these steps, the non-dominated sorting of the population is completed.
4.2.3. Fitness Calculation
Fitness serves as a crucial criterion for selecting operators to inherit to the next generation of individuals. In this study, individual fitness is determined based on two key indicators:
For two individuals , it is first determined whether they are on the same Pareto front. If not, the individuals with high frontier level are excellent individuals. If they are in the same frontier, their crowding degree is compared. To ensure that the obtained Pareto optimal solution is as widely distributed as possible in the solution space, it is essential to prioritize individuals with larger crowding distances, as they are more likely to have better fitness and contribute to a more evenly spread Pareto optimal front.
4.2.4. Selection Observer
This study adopts the tournament selection method to choose individuals from the population who will be inherited to the next generation, based on the comparison rules of individual fitness. The steps are as follows:
Randomly select individuals from the population (usually select ).
Select the individual with the best fitness from to inherit to the next generation.
Return the remaining individuals to the population and repeat the above steps until the selected population meets the required quantity.
This approach ensures that the majority of high-performing individuals are preserved for the next generation while also allowing for a certain probability of selecting individuals with slightly lower rankings, thereby increasing the diversity within the population. Consequently, the algorithm complexity is reduced as it eliminates the need for fitness ranking for all individuals.
7. Conclusions
Utilizing intelligent algorithms to address the task planning problem of multi-point air-to-air refueling represents a vital approach to reconcile the trade-off between timeliness and economy during long-distance flights. The objective function of this study comprehensively considers both time and fuel consumption factors, enabling the acquisition of solutions with varying emphases through multi-stage analysis, thereby enhancing task execution flexibility.
From the theoretical analysis and simulation experimental results presented in this article, two key conclusions emerge. Firstly, the test outcomes of the three ZDT series functions demonstrate the superiority of the improved NSGA-II over the standard NSGA-II. The proposed improvement to NSGA-II effectively enhances the diversity and convergence of the algorithm’s solution set. Secondly, employing the improved NSGA-II to tackle the AARP problem allows for the accurate generation of multiple solution sets with distinct focuses. In contrast to traditional single-objective optimization algorithms, the obtained solution set is more representative, facilitating decision makers in selecting suitable solutions based on the actual task.
8. Future Recommendation
Nevertheless, certain simplifications were unavoidable in the model established in this article, such as neglecting the handshake time of air-to-air refueling and assuming uniform flight speeds across different regions. During practical application, the planning method described herein should be comprehensively considered alongside the specific task conditions. By thoroughly mastering the information data elements and planning tasks in finer granularity, the rationality of air-to-air refueling planning can be improved, thus ensuring successful task completion.
In future work, we will continue to conduct in-depth research on algorithms and models. In terms of the algorithm, we plan to include the initial fuel load of the aircraft and the transmitted fuel volume of aerial refueling into the calculation scope of the algorithm to realize the whole process planning of the task. This can make the factors considered in mission planning more comprehensive. In terms of modeling, the meteorological factors in the airspace and the specific implementation process of aerial refueling (such as refueling docking time and the change in flight speed during refueling) will be further considered. At the same time, the airspace unsuitable for refueling is appropriately avoided during the calculation process, so that the planning results are more in line with the actual task requirements.


