
Remaining Useful Life Prediction Method of PEM Fuel Cells Based on a Hybrid Model

 ,
,  ,
,
Abstract
:1. Introduction
2. Data Set Analysis and Preprocessing
2.1. PEMFC Experimental Data Set
2.2. PEMFC Performance Degradation Index
2.3. EMD Denoising
3. RUL Prediction Method of PEM Fuel Cell Based on Hybrid Model
3.1. Prediction Framework
3.2. MK-RVM Model
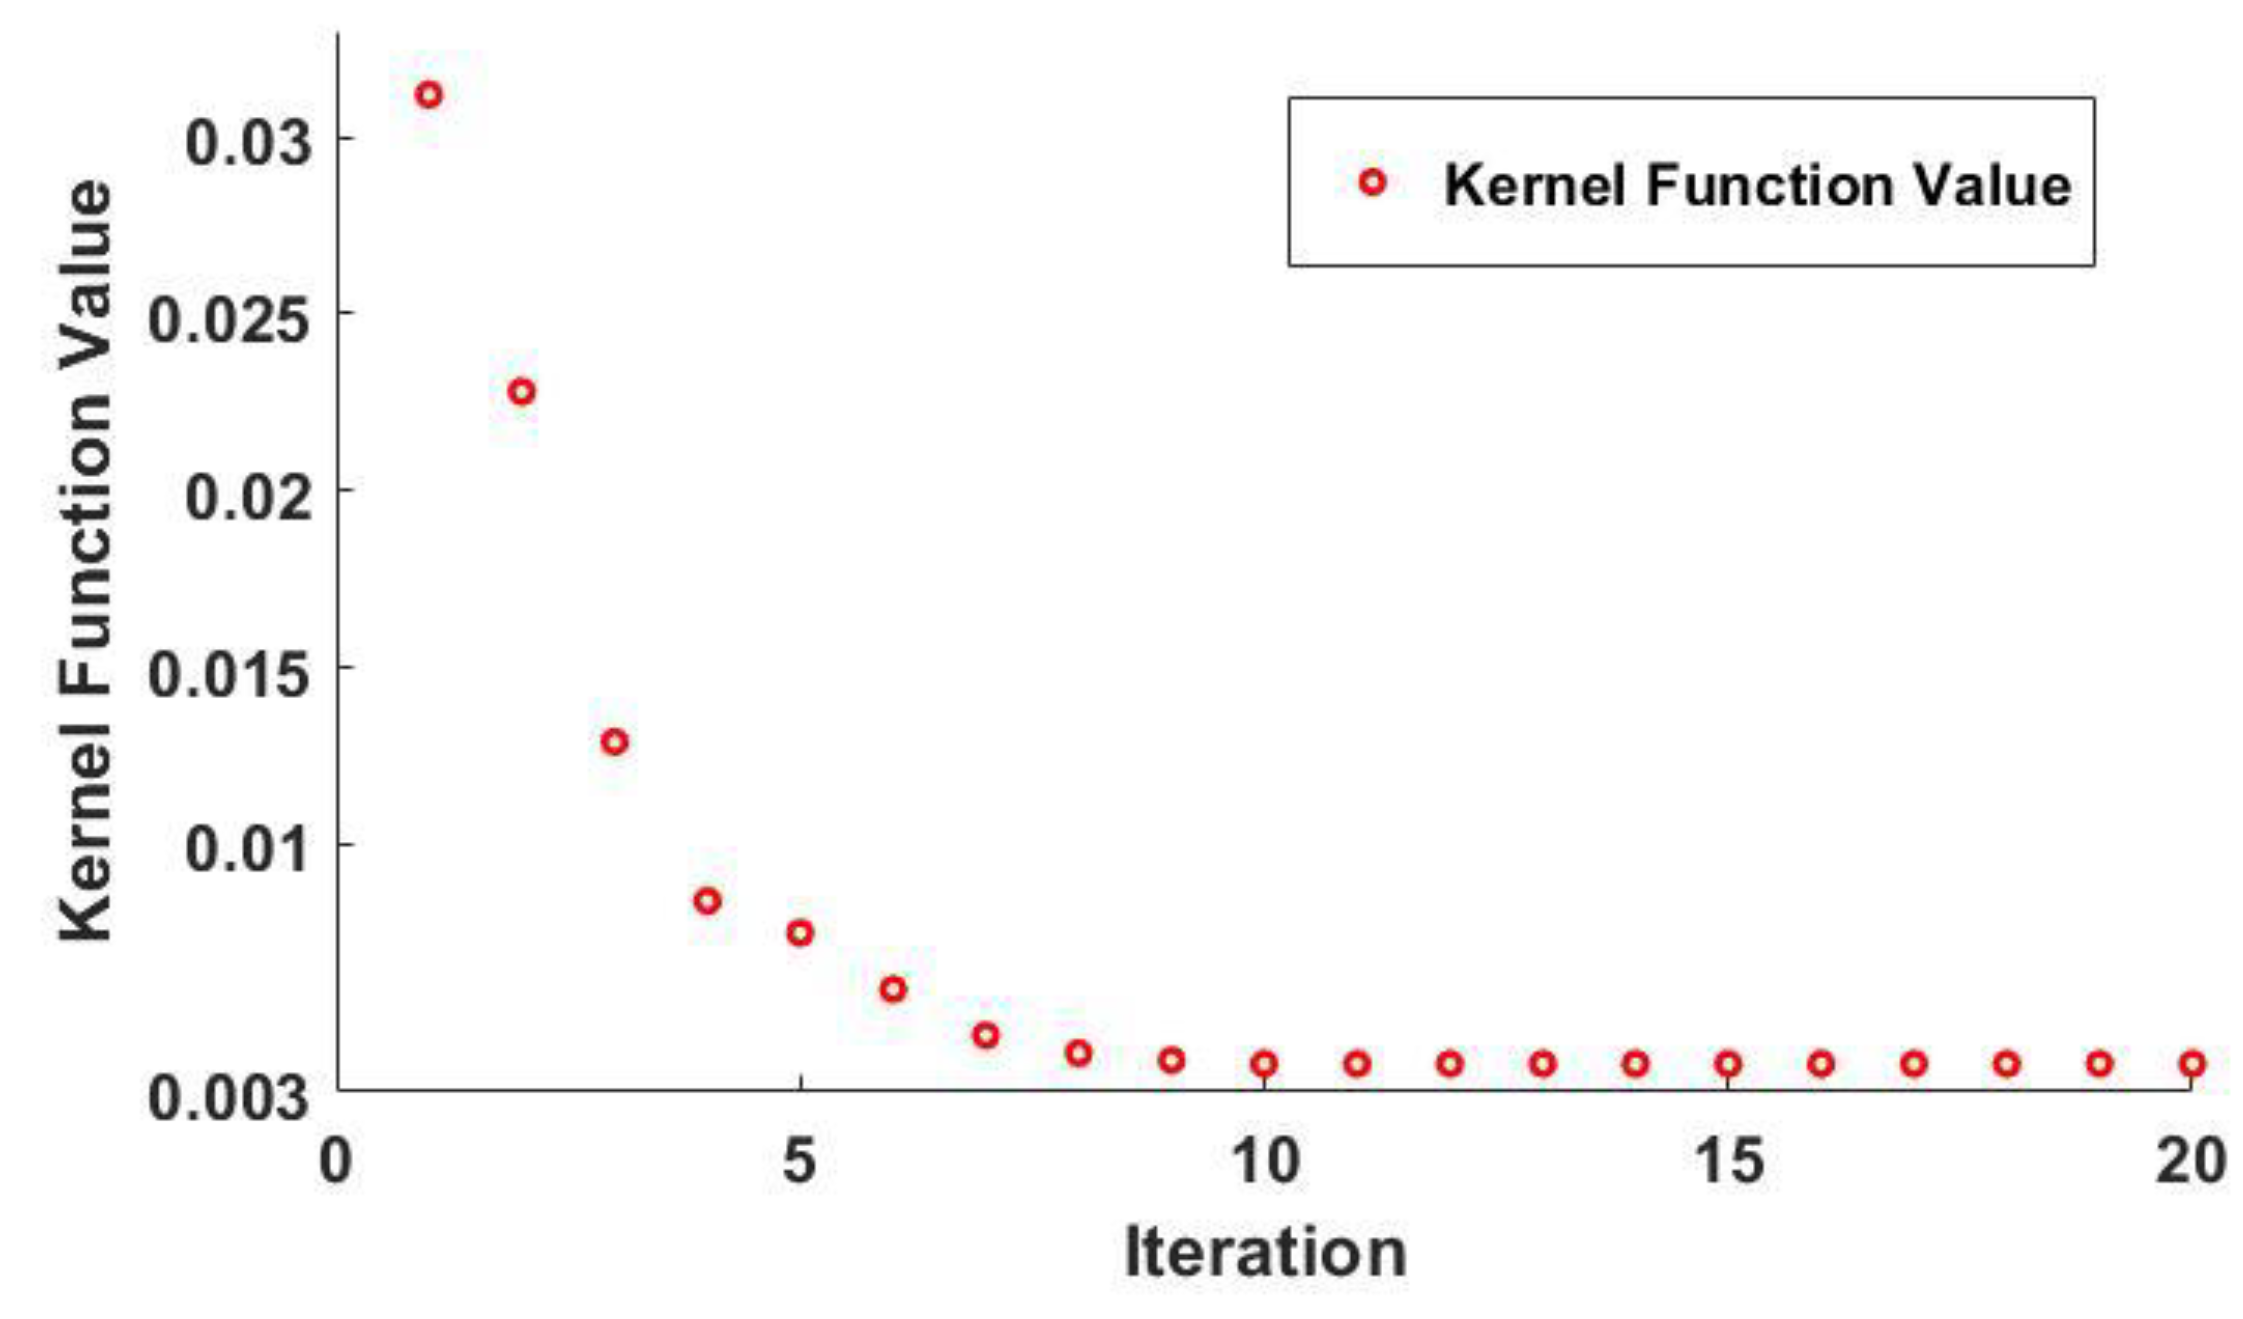
3.3. Bayesian Optimization Algorithm
| Algorithm 1: Bayesian Optimization |
| INPUT: objective function , collection function ; OUTPUT: parameter vector ; 1: Initialize parameter vector; 2: for t = 1,2,…,T do; 3: Maximize the to obtain the next evaluation point: ; 4: Evaluate the objective function value ; 5: Integrate data: , and update the probabilistic proxy model; 6: End. |
3.4. Voltage Recovery Model
4. Experiment and Discussion
4.1. RUL
4.2. Prediction Result Analysis
4.3. Discussion
5. Conclusions
Author Contributions
Funding
Data Availability Statement
Conflicts of Interest
Abbreviations
| RUL | Remaining Useful Life |
| PEMFC | Proton Exchange Membrane Fuel Cell |
| MK-RVM | Multi-kernel Relevance Vector Machine |
| EMD | Empirical Mode Decomposition |
| FCLAB | Fuel Cell Laboratory |
| DOE | Department of Energy |
| ANFIS | Adaptive Neuro-fuzzy Inference System |
| LSSVM | Least Square Support Vector Machine |
| RPF | Regularized Particle Filter |
| GMDH | Group Method of Data Handling |
| WA | Wavelet Analysis |
| R2 | Coefficient of Determination |
| MAPE | Mean Absolute Percent Error |
| RMSE | Root Mean Square Error |
| IMF | Intrinsic Mode Function |
| MAE | Mean Square Error |
| RA | Relative Accuracy |
| BO-MK-RVM | Bayesian optimization MK-RVM |
| VR-BO-MK-RVM | Bayesian optimization MK-RVM of Voltage Recovery Model |
References
- Bressel, M.; Hilairet, M.; Hissel, D.; Bouamama, B.O. Extended Kalman Filter for prognostic of Proton Exchange Membrane Fuel Cell. Appl. Energy 2016, 164, 220–227. [Google Scholar] [CrossRef]
- Jouin, M.; Gouriveau, R.; Hissel, D.; Péra, M.-C.; Zerhouni, N. Prognostics of PEM fuel cell in a particle filtering framework. Int. J. Hydrog. Energy 2014, 39, 481–494. [Google Scholar] [CrossRef]
- Kimotho, J.K.; Meyer, T.; Sextro, W. PEM fuel cell prognostics using particle filter with model parameter adaptation. In Proceedings of the 2014 International IEEE Conference on Prognostics and Health Management, Cheney, WA, USA, 22–25 June 2014; pp. 1–6. [Google Scholar]
- Zhang, X.; Pisu, P. An unscented Kalman filter based approach for the health-monitoring and prognostics of a Polymer Electrolyte Membrane fuel cell. In Proceedings of the Annual Conference of the Prognostics and Health Management Society 2012, Minneapolis, MI, USA, 23–27 September 2012; pp. 353–361. [Google Scholar]
- Lechartier, E.; Laffly, E.; Péra, M.-C.; Gouriveau, R.; Hissel, D.; Zerhouni, N. Proton exchange membrane fuel cell behavioral model suitable for prognostics. Int. J. Hydrog. Energy 2015, 40, 8384–8397. [Google Scholar] [CrossRef]
- Polverino, P.; Pianese, C. Control algorithm design for degradation mitigation and lifetime improvement of Polymer Electrolyte Membrane Fuel Cells. Energy Procedia 2017, 142, 1706–1713. [Google Scholar] [CrossRef]
- Morando, S.; Jemei, S.; Gouriveau, R.; Zerhouni, N.; Hissel, D. Fuel cells prognostics using echo state network. In Proceedings of the IECON 2013-39th Annual Conference of the IEEE Industrial Electronics Society, Vienna, Austria, 10–13 November 2013; pp. 1632–1637. [Google Scholar]
- Ma, R.; Yang, T.; Breaz, E.; Li, Z.; Briois, P.; Gao, F. Data-driven proton exchange membrane fuel cell deg-radation predication through deep learning method. Appl. Energy 2018, 231, 102–115. [Google Scholar] [CrossRef]
- Morando, S.; Jemei, S.; Hissel, D.; Gouriveau, R.; Zerhouni, N. ANOVA method applied to proton exchange membrane fuel cell ageing forecasting using an echo state network. Math. Comput. Simul. 2017, 131, 283–294. [Google Scholar] [CrossRef]
- Zhang, H.; Xi, X.; Pan, R. A two-stage data-driven approach to remaining useful life prediction via long short-term memory networks. Reliab. Eng. Syst. Saf. 2023, 237, 109332. [Google Scholar] [CrossRef]
- Fu, J.; Fu, Z.; Song, S. Proton membrane fuel cell stack performance prediction through deep learning method. Energy Rep. 2022, 8, 5387–5395. [Google Scholar] [CrossRef]
- Wilberforce, T.; Alaswad, A.; A, G.-P.; Xu, Y.; Ma, X.; Panchev, C. Remaining useful life prediction for proton exchange membrane fuel cells using combined convolutional neural network and recurrent neural network. Int. J. Hydrog. Energy 2023, 48, 291–303. [Google Scholar] [CrossRef]
- Zhou, D.; Al-Durra, A.; Zhang, K.; Ravey, A.; Gao, F. Online remaining useful lifetime prediction of proton exchange membrane fuel cells using a novel robust methodology. J. Power Source 2018, 399, 314–328. [Google Scholar] [CrossRef]
- Sun, B.; Liu, X.; Wang, J.; Wei, X.; Yuan, H.; Dai, H. Short-term performance degradation prediction of a commercial vehicle fuel cell system based on CNN and LSTM hybrid neural network. Int. J. Hydrog. Energy 2023, 48, 8613–8628. [Google Scholar] [CrossRef]
- Ibrahim, M.; Steiner, N.; Jemei, S.; Hissel, D. Wavelet-Based Approach for Online Fuel Cell Remaining Useful Lifetime Prediction. IEEE. Trans. Ind. Electron. 2016, 63, 5057–5068. [Google Scholar] [CrossRef]
- Hua, Z.; Zheng, Z.; Pahon, E.; Péra, M.; Gao, F. Lifespan Prediction for Proton Exchange Membrane Fuel Cells Based on Wavelet Transform and Echo State Network. IEEE Trans. Transp. Electrif. 2022, 8, 420–431. [Google Scholar] [CrossRef]
- Li, H.; Chen, Q.; Zhang, L.; Liu, L.; Xiao, P. Degradation prediction of proton exchange membrane fuel cell based on the multi-inputs Bi-directional long short-term memory. Appl. Energy 2023, 344, 121294. [Google Scholar] [CrossRef]
- Zhang, C.; Zhang, Y.; Wang, L.; Deng, X.; Liu, Y.; Zhang, J. A health management review of proton exchange membrane fuel cell for electric vehicles: Failure mechanisms, diagnosis techniques and mitigation measures. Renew. Sustain. Energy Rev. 2023, 182, 113369. [Google Scholar] [CrossRef]
- Mayur, M.; Gerard, M.; Schott, P.; Bessler, W.G. Lifetime Prediction of a Polymer Electrolyte Membrane Fuel Cell under Automotive Load Cycling Using a Physically-Based Catalyst Degradation Model. Energies 2018, 8, 2054. [Google Scholar] [CrossRef]
- Koltsova, E.M.; Vasilenko, V.A.; Shcherbakov, A.I.; Fokina, E.A.; Bogdanovskaya, V.A. Mathematical Simulation of PEMFC Platinum Cathode Degradation Accounting Catalyst’s Nanoparticles Growth. Chem. Eng. Trans. 2018, 70, 1301–1308. [Google Scholar]
- Robin, C.; Gérard, M.; Quinaud, M.; D’arbigny, J.; Bultel, Y. Proton exchange membrane fuel cell model for aging predictions: Simulated equivalent active surface area loss and comparisons with durability tests. J. Power Source 2016, 326, 417–427. [Google Scholar] [CrossRef]
- Li, D.; Zhang, Z.; Zhou, L.; Liu, P.; Wang, Z.; Deng, J. Multi-time-step and multi-parameter prediction for real-world proton exchange membrane fuel cell vehicles (PEMFCVs) toward fault prognosis and energy consumption prediction. Appl. Energy 2022, 325, 119703. [Google Scholar] [CrossRef]
- Meraghni, S.; Terrissa, L.S.; Yue, M.; Ma, J.; Jemei, S.; Zerhouni, N. A data-driven digital-twin prognostics method for proton exchange membrane fuel cell remaining useful life prediction. Int. J. Hydrog. Energy 2021, 46, 2555–2564. [Google Scholar] [CrossRef]
- Kouhestani, H.S.; Liu, L.; Wang, R.; Chandra, E. Data-driven prognosis of failure detection and prediction of lithium-ion batteries. J. Energy Storage 2023, 70, 108045. [Google Scholar] [CrossRef]
- Silva, R.; Gouriveau, R.; Jemeï, S.; Hissel, D.; Boulon, L.; Agbossou, K.; Steiner, N.Y. Proton exchange membrane fuel cell degradation prediction based on Adaptive Neuro-Fuzzy Inference Systems. Int. J. Hydrog. Energy 2014, 39, 11128–11144. [Google Scholar] [CrossRef]
- Wu, Y.; Breaz, E.; Gao, F.; Miraoui, A. Prediction of PEMFC stack aging based on Relevance Vector Machine. In Proceedings of the 2015 IEEE Transportation Electrification Conference and Expo (ITEC), Dearborn, MI, USA, 14–17 June 2015; pp. 1–5. [Google Scholar] [CrossRef]
- Nguyen, H.; Lee, S.; Yu, S. A Comprehensive Review of Degradation Prediction Methods for an Automotive Proton Exchange Membrane Fuel Cell. Energies 2023, 16, 4772. [Google Scholar] [CrossRef]
- Cheng, Y.; Zerhouni, N.; Lu, C. A hybrid remaining useful life prognostic method for proton exchange membrane fuel cell. Int. J. Hydrog. Energy 2018, 43, 12314–12327. [Google Scholar] [CrossRef]
- Liu, H.; Chen, J.; Hissel, D.; Su, H. Remaining useful life estimation for proton exchange membrane fuel cells using a hybrid method. Appl. Energy 2019, 237, 910–919. [Google Scholar] [CrossRef]
- Hua, Z.; Zheng, Z.; Pahon, E.; Péra, M.; Gao, F. A review on lifetime prediction of proton exchange membrane fuel cells system. J. Power Source 2022, 529, 231256. [Google Scholar] [CrossRef]
- Zhou, D.; Gao, F.; Breaz, E.; Ravey, A.; Miraoui, A. Degradation prediction of PEM fuel cell using a moving window based hybrid prognostic approach. Energy 2017, 138, 1175–1186. [Google Scholar] [CrossRef]
- Li, Z.; Zheng, X.; Outbib, R. Adaptive Prognostic of Fuel Cells by Implementing Ensemble Echo State Networks in Time-Varying Model Space. IEEE Trans. Ind. Electron. 2020, 67, 379–389. [Google Scholar] [CrossRef]
- FCLAB Research. IEEE PHM 2014 DATA CHALLENGE. 2014. Available online: http://eng.fclab.fr/ieee-phm-2014-data-challenge/ (accessed on 3 December 2021).
- Pei, P.; Meng, Y.; Chen, D.; Ren, P.; Wang, M.; Wang, X. Lifetime prediction method of proton exchange membrane fuel cells based on current degradation law. Energy 2023, 265, 126341. [Google Scholar] [CrossRef]
- Ghozat, A.; Sharafati, A.; Motta, D. A novel intelligent approach for predicting meteorological drought based on satellite-based precipitation product: Application of an EMD-DFA-DBN hybrid model. Comput. Electron. Agric. 2023, 211, 107946. [Google Scholar] [CrossRef]
- Mounir, N.; Ouadi, H.; Jrhilifa, I. Short-term electric load forecasting using an EMD-BI-LSTM approach for smart grid energy management system. Energy Build. 2023, 288, 113022. [Google Scholar] [CrossRef]
- Sun, X.; Zhong, K.; Han, M. A hybrid prognostic strategy with unscented particle filter and optimized multiple kernel relevance vector machine for lithium-ion battery. Measurement 2021, 170, 108679. [Google Scholar] [CrossRef]
- Meng, H.; Geng, M.; Han, T. Long short-term memory network with Bayesian optimization for health prognostics of lithium-ion batteries based on partial incremental capacity analysis. Reliab. Eng. Syst. Saf. 2023, 236, 109288. [Google Scholar] [CrossRef]
- Zhang, D.; Cadet, C.; Yousfi-Steiner, N.; Bérenguer, C. Proton exchange membrane fuel cell remaining useful life prognostics considering degradation recovery phenomena. J. Risk Reliab. 2018, 232, 415–424. [Google Scholar] [CrossRef]
- Yang, C.; Li, Z.; Liang, B.; Cui, Q.; Lu, W.; Yang, J. A novel fusion strategy for failure prognostic of proton exchange membrane fuel cell stack. In Proceedings of the 2017 36th Chinese Control Conference (CCC), Dalian, China, 26–28 July 2017; pp. 7070–7076. [Google Scholar] [CrossRef]


| Parameter | Physical Significance |
|---|---|
| Time | Aging time (h) |
| U1-U5, Ut | Single cells and stack voltage (V) |
| J, I | Current density (A/cm2), Current (A) |
| TinH2, ToutH2 | Inlet and Outlet temperatures of H2 (°C) |
| TinAIR, ToutAIR | Inlet and Outlet temperatures of Air (°C) |
| TinWAT, ToutWAT | Inlet and Outlet temperatures of cooling Water (°C) |
| PinAIR, PoutAIR | Inlet and Outlet Pressure of Air (mbara) |
| PinH2, PoutH2 | Inlet and Outlet Pressure of H2 (mbara) |
| DinH2, DoutH2 | Inlet and Outlet flow rate of H2 (L/min) |
| DinAIR, DoutAIR | Inlet and Outlet flow rate of Air (L/min) |
| DWAT | Flow rate of cooling water (L/min) |
| HrAIRFC | Inlet Hygrometry(Air)—estimated (%) |
| Start–Stop Number | 1 | 2 | 3 | 4 | 5 | 6 | 7 |
|---|---|---|---|---|---|---|---|
| Time/h | 48 | 185 | 348 | 515 | 658 | 823 | 991 |
| Algorithm | MAE | RMSE | RA | Confidence Interval |
|---|---|---|---|---|
| MK-RVM | 0.0619 | 0.0810 | 69.38% | 214 h |
| BO-MK-RVM | 0.0162 | 0.0218 | 81.78% | 106 h |
| VR-BO-MK-RVM | 0.0048 | 0.0069 | 95.35% | 29 h |
Disclaimer/Publisher’s Note: The statements, opinions and data contained in all publications are solely those of the individual author(s) and contributor(s) and not of MDPI and/or the editor(s). MDPI and/or the editor(s) disclaim responsibility for any injury to people or property resulting from any ideas, methods, instructions or products referred to in the content. |
© 2023 by the authors. Licensee MDPI, Basel, Switzerland. This article is an open access article distributed under the terms and conditions of the Creative Commons Attribution (CC BY) license (https://creativecommons.org/licenses/by/4.0/).
Share and Cite
Tian, Q.; Chen, H.; Ding, S.; Shu, L.; Wang, L.; Huang, J. Remaining Useful Life Prediction Method of PEM Fuel Cells Based on a Hybrid Model. Electronics 2023, 12, 3883. https://doi.org/10.3390/electronics12183883
Tian Q, Chen H, Ding S, Shu L, Wang L, Huang J. Remaining Useful Life Prediction Method of PEM Fuel Cells Based on a Hybrid Model. Electronics. 2023; 12(18):3883. https://doi.org/10.3390/electronics12183883
Chicago/Turabian StyleTian, Qiancheng, Haitao Chen, Shuai Ding, Lei Shu, Lei Wang, and Jun Huang. 2023. "Remaining Useful Life Prediction Method of PEM Fuel Cells Based on a Hybrid Model" Electronics 12, no. 18: 3883. https://doi.org/10.3390/electronics12183883
APA StyleTian, Q., Chen, H., Ding, S., Shu, L., Wang, L., & Huang, J. (2023). Remaining Useful Life Prediction Method of PEM Fuel Cells Based on a Hybrid Model. Electronics, 12(18), 3883. https://doi.org/10.3390/electronics12183883