Article

Decoding Electroencephalography Underlying Natural Grasp Tasks across Multiple Dimensions

1
Shanxi Key Laboratory of Signal Capturing & Processing, North University of China, Taiyuan 030051, China
2
The State Key Laboratory for Electronic Testing Technology, North University of China, Taiyuan 030051, China
3
School of Information and Communication Engineering, North University of China, Taiyuan 030051, China
4
North University of China, Taiyuan 030051, China
5
Noncommissioned Officer Academy of PAP, Hangzhou 311400, China
6
North Institute of Science and Technology Information, Beijing 100089, China
*
Authors to whom correspondence should be addressed.
Electronics 2023, 12(18), 3894; https://doi.org/10.3390/electronics12183894
Submission received: 17 August 2023 / Revised: 13 September 2023 / Accepted: 13 September 2023 / Published: 15 September 2023
(This article belongs to the Special Issue Emerging Trends in Advanced Video and Sequence Technology)

Abstract

:
Individuals suffering from motor dysfunction due to various diseases often face challenges in performing essential activities such as grasping objects using their upper limbs, eating, writing, and more. This limitation significantly impacts their ability to live independently. Brain–computer interfaces offer a promising solution, enabling them to interact with the external environment in a meaningful way. This exploration focused on decoding the electroencephalography of natural grasp tasks across three dimensions: movement-related cortical potentials, event-related desynchronization/synchronization, and brain functional connectivity, aiming to provide assistance for the development of intelligent assistive devices controlled by electroencephalography signals generated during natural movements. Furthermore, electrode selection was conducted using global coupling strength, and a random forest classification model was employed to decode three types of natural grasp tasks (palmar grasp, lateral grasp, and rest state). The results indicated that a noteworthy lateralization phenomenon in brain activity emerged, which is closely associated with the right or left of the executive hand. The reorganization of the frontal region is closely associated with external visual stimuli and the central and parietal regions play a crucial role in the process of motor execution. An overall average classification accuracy of 80.3% was achieved in a natural grasp task involving eight subjects.

1. Introduction

Individuals afflicted by conditions such as stroke, spinal cord injuries, and other ailments often experience motor impairments, leading to limitations or a loss of limb mobility [1,2]. These difficulties can significantly disrupt their daily lives and place burdens on both the patients and their families. Remarkably, despite these challenges, the cognitive capabilities of these patients remain akin to those of healthy individuals. They can effectively employ electroencephalography (EEG) signals to interact with the external environment [3,4]. Hence, decoding the intricate real-time dynamics underlying natural grasp tasks across multiple dimensions not only aids in comprehending the brain’s dynamic reorganization but also introduces innovative concepts for intelligent assistance grounded in brain–computer interfaces (BCIs). Such innovations have the potential to assist patients in surmounting motor limitations and alleviate the family’s burden [3,5,6].
An EEG signal is a multirhythmic nonlinear signal that holds abundant information within the time and frequency domains. The brain achieves efficient cognitive processing through the intricate exchange of time and frequency domain information among different brain regions [7]. Movement-related cortical potentials (MRCPs) delineate the dynamic changes in EEG signal amplitude over time during movement. These potentials exhibit a distinct pattern: a negative deflection emerges during the preparation period of movement, reaching its peak negativity at movement initiation, and subsequently gradually returning to the baseline level [8,9,10,11,12,13]. The dynamic evolution of EEG signal power over time within a specific frequency band is assessed using event-related desynchronization (ERD) and event-related synchronization (ERS). The ERD(S) phenomenon is notably observed in the alpha (8–13 Hz) and beta (13–30 Hz) frequency bands during the execution of movements [14,15,16,17,18,19]. Moreover, functional brain connectivity reveals the process of information transmission among brain regions during movement. Time–frequency cross mutual information (TFCMI), a typical method for analyzing brain functional connectivity, effectively leverages the time–frequency domain characteristics of EEG signals. This approach enables the evaluation of potential linear and nonlinear correlations among these signals, providing a more precise and comprehensive explanation of information propagation within the intricate brain network [20,21,22,23].
The majority of brain–computer interfaces utilized for controlling assistive devices depend on abstract imagery [5,6,24]. For instance, repetitive foot movements may be employed to regulate exoskeletal movements in the left forearm of a subject [24]. However, these strategies are not inherently linked to the intended movements they aim to produce, potentially imposing an increased cognitive burden on the brain [25]. In recent years, a prominent trend has emerged in research, with studies increasingly emphasizing the utilization of EEG signals derived from authentic movements. The objective is to implement more intuitive control strategies for intelligent assistive devices [8,26,27,28,29,30]. Reference [26] initially down-sampled the signal to 16 Hz and employed the individual shrinkage-based linear discriminant classification model (sLDA) to classify grasping activities, ultimately achieving a classification accuracy of 61.3% [26]. In contrast, Reference [8] employed low-frequency time domain features ranging from 0.3 to 13 Hz to classify grasping activities, resulting in an impressive accuracy of 72.4% [8]. Reference [27] adopted a joint feature approach encompassing both time and frequency domains to classify grasping activities, achieving a classification accuracy of 65% [27]. And Reference [30] focused on classifying two-handed grasping activities using time domain features ranging from 0.3 to 3 Hz, culminating in a classification accuracy of 38.6% [30]. Nevertheless, relying solely on low-frequency time domain data or a singular combination of time and frequency domains for decoding EEG signals during movement proves insufficient. By introducing wavelet packet decomposition, an extension of the wavelet transform, to extract EEG energy features, a comprehensive approach is established that skillfully leverages both time and frequency domain information. This, in turn, facilitates a more accurate decoding of EEG signals during movement.
The objective of this study was to decode the dynamic changes occurring within the brain during various grasp tasks from a multidimensional perspective. Comparative analyses were conducted on MRCPs and ERD(S) across three types of natural grasp tasks. Simultaneously, the study explored the functional connectivity among different brain regions during movement states, employing the TFCMI approach. Furthermore, an assessment was conducted on the coupling strengths of brain-region connections during different movement periods within the same movement state. This investigation could reveal the dynamic process of brain functional connectivity changes throughout the progression of movement. In the final stage, the global coupling strengths derived from TFCMI were employed to pinpoint electrode data that that demonstrated a robust correlation with grasp tasks. Subsequently, wavelet packets were then employed to extract energy features, followed by the application of random forest algorithms to decode the EEG signals for three types of natural grasp tasks.
Compared to previous research, our contributions are summarized as follows: Firstly, we conducted the simultaneous decoding of EEG signals from grasping tasks in three dimensions: MRCPs, ERD(S), and functional connectivity. This comprehensive approach allowed for a profound analysis of the dynamic brain changes during grasping tasks. In our analysis, we introduced considerations of attention and cognitive processes during the motor preparation period, leading to a more coherent understanding of the evolving EEG signals during motor processes. Secondly, we leveraged brain functional connectivity strength to carefully select EEG electrodes, effectively reducing data dimensionality. Additionally, we harnessed wavelet packet analysis to extract energy features, resulting in a substantial enhancement of classification accuracy through random forest decoding. The structure of this paper is as follows: Section 2 provides an introduction to the principles of MRCPs, ERD(S), TFCMI, and the random forest classification method, respectively. Section 3 presents and analyzes the experimental results. Section 4 discusses the experimental findings. Finally, Section 5 concludes the paper.

2. Materials and Methods

The raw EEG signals of palmar grasp, lateral grasp, and rest state were decoded from the three dimensions of MRCPs, ERD(S), and brain functional connectivity. Following this, EEG electrodes were chosen based on the coupling strength of brain functional connectivity. The extraction of EEG signal energy was accomplished through wavelet packet analysis, with the subsequent application of a random forest algorithm for the classification of the three task tasks.

2.1. Data and Preprocessing

The data that underpin the results of this study were sourced from the Institute of Neural Engineering at Graz University of Technology [26]. The experimental procedure unfolded as follows: the participant grasped an object—either an empty can (palmar grasp) or a can with a spoon (lateral grasp)—positioned at an equidistant point. Before initiating the grasping action, a 1–2 s period was dedicated to fixing one’s gaze on the target object. Subsequently, following the successful grasp of the object, they were also required to sustain the grasping action for an additional 1–2 s. An illustration of the experimental process is depicted in Figure 1. Three types of EEG signals were recorded during this experiment: palmar grasp, lateral grasp, and rest state. The data were acquired from a group of 8 healthy individuals, all of whom were right-handed. For each participant, a total of 58 channels of EEG signals were recorded, alongside 6 channels of electrooculography (EOG) signals. These EOG signals encompassed the inferior and superior orbits of both eyes, in addition to the external corners of the eyes. The data were sampled at a frequency of 256 Hz, with the right earlobe utilized as the reference electrode and the electrode AFz serving as the grounding point. The spatial distribution of the 58 channels is illustrated in Figure 2.
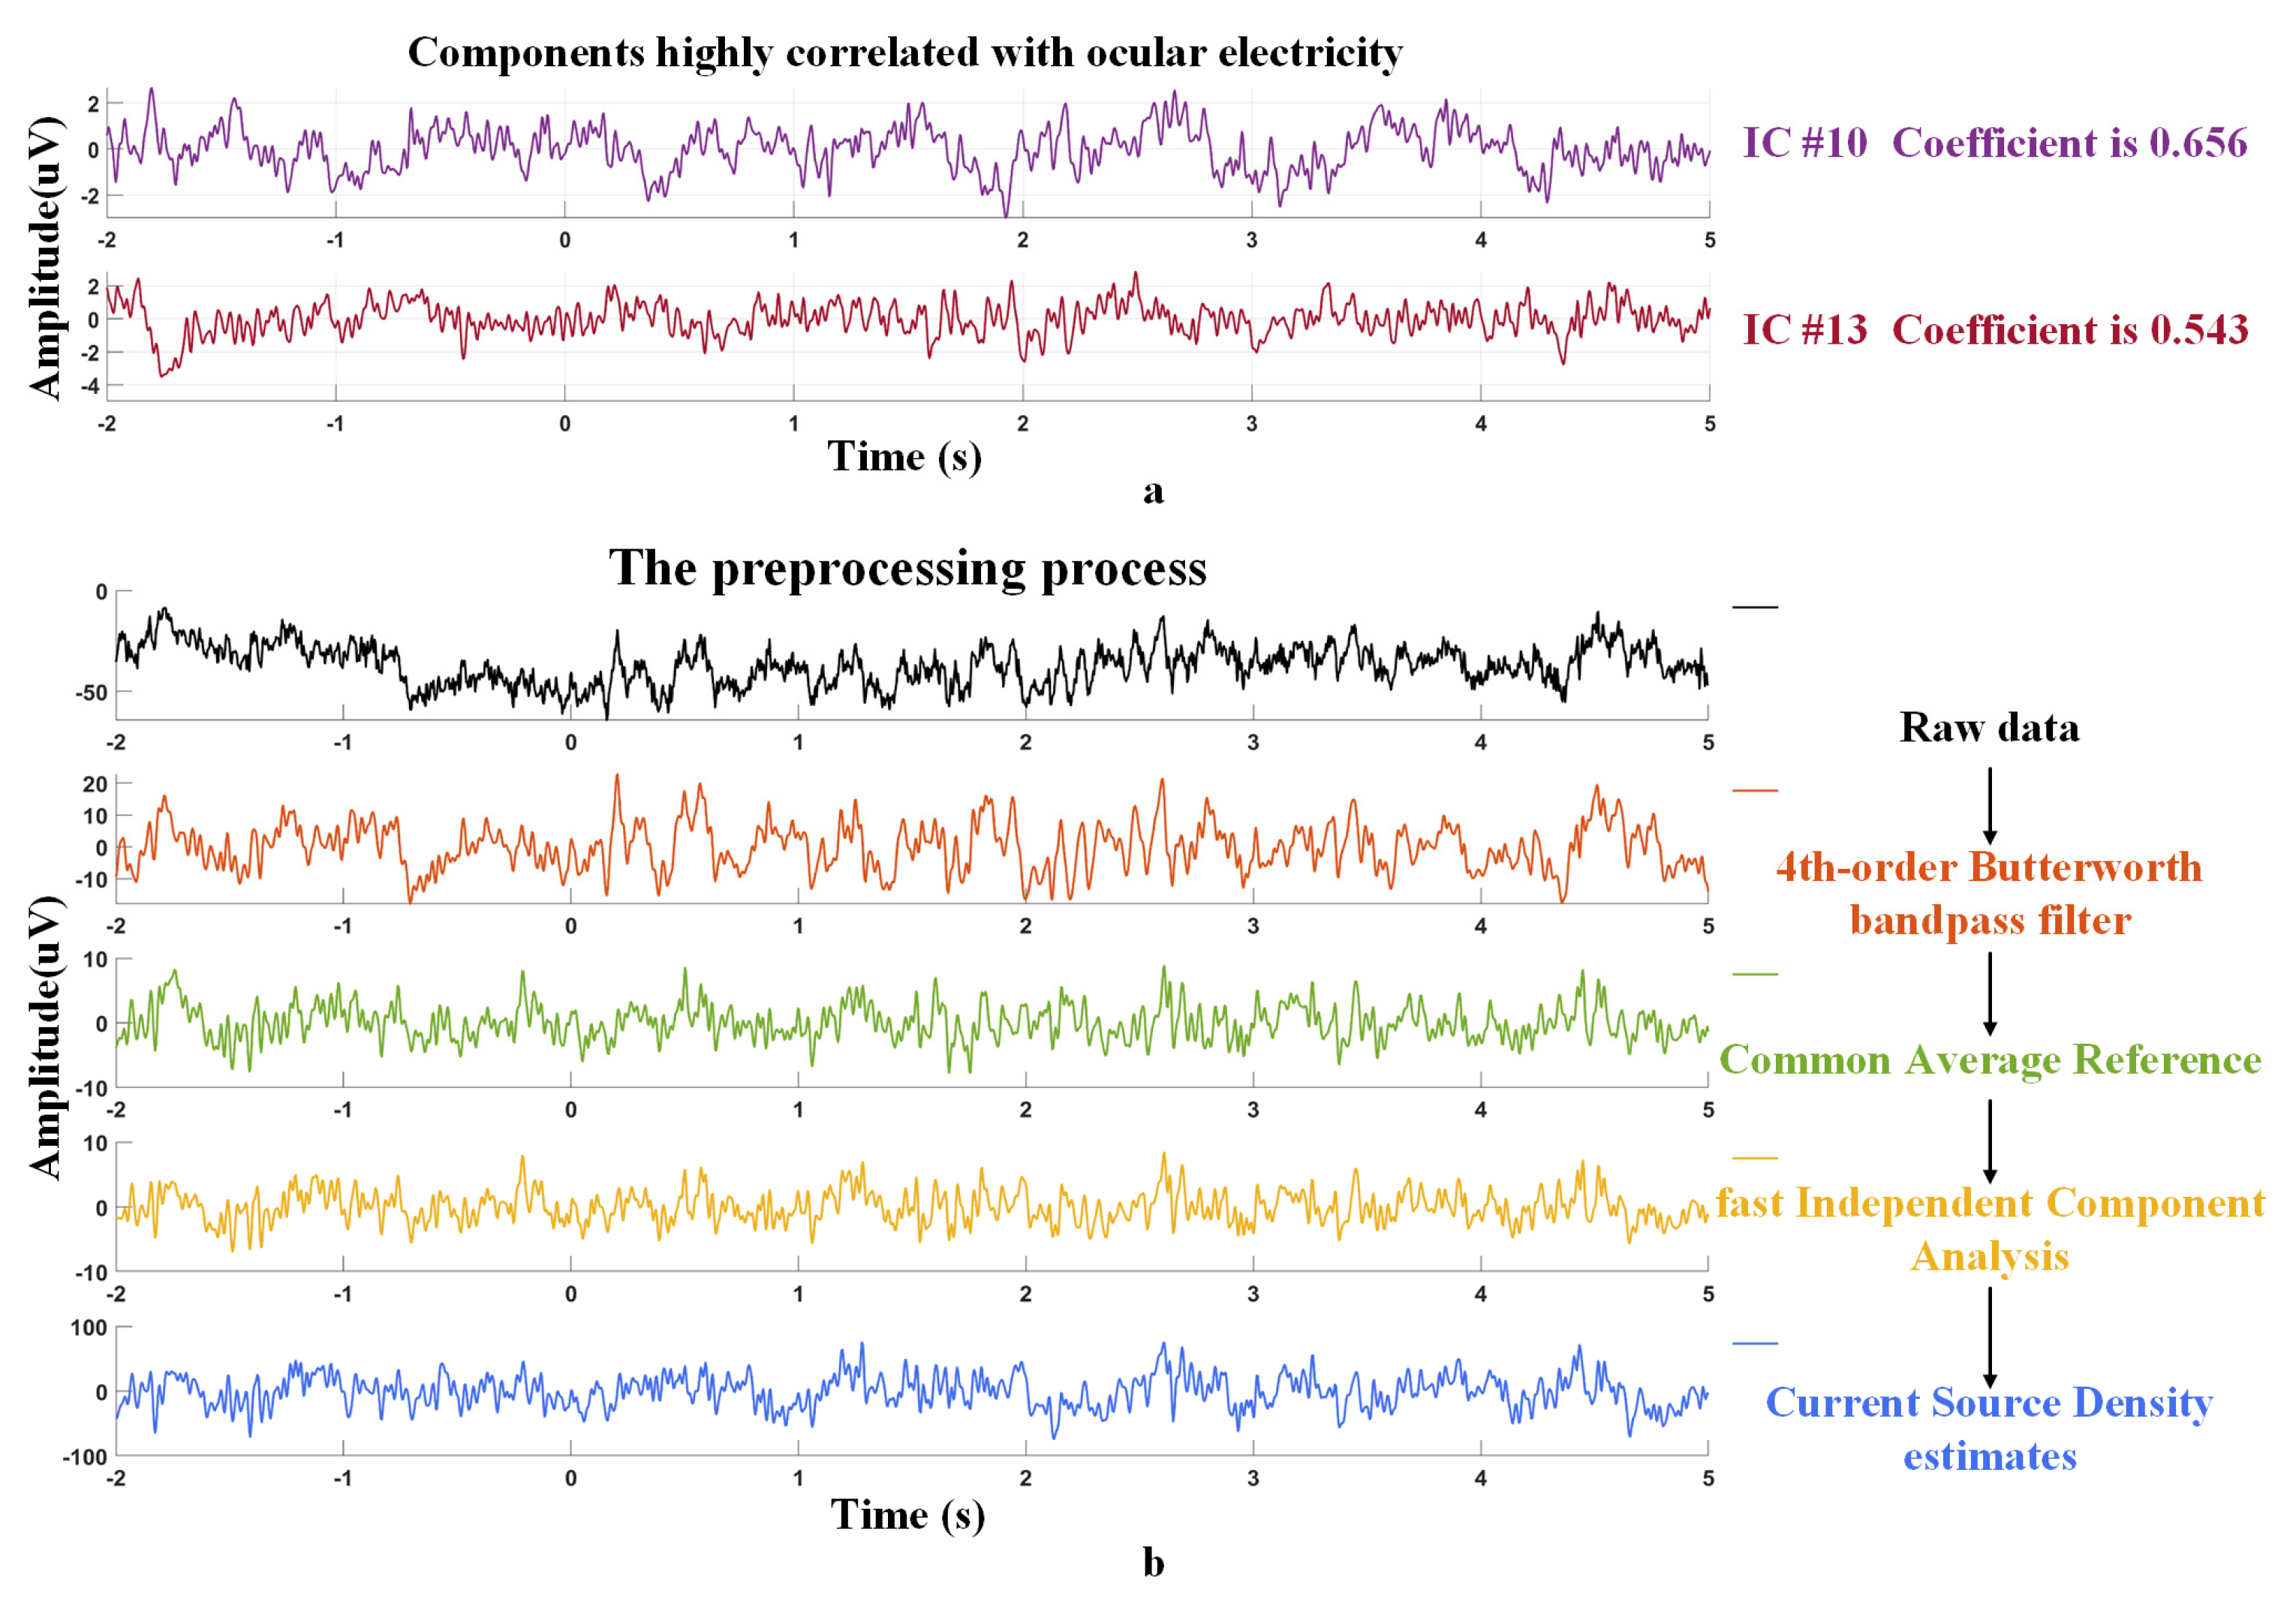
EEG signals are characterized by their low amplitude and susceptibility to various interferences, including baseline drift, respiratory disturbances, and ocular artifacts. Consequently, it becomes imperative to reprocess the acquired signals to obtain clean data as much as possible. In this study, a 4th-order Butterworth bandpass filter was applied to the raw EEG, restricting the passband range to 0.3 to 40 Hz. Additionally, the reference was converted into an averaged reference to reduce the potential influence of lateralization effects. In order to minimize EOG interference, the fast Independent Component Analysis (Fast ICA) algorithm, based on negative entropy maximization [31], was employed. The EEG signal underwent decomposition into independent IC components using the Fast ICA algorithm. Subsequently, the correlation between each IC component and the EOG signal was quantified. IC components exhibiting an absolute correlation coefficient exceeding 0.5 were identified as those strongly associated with the EEG. Following this, the specific IC components were nullified, effectively producing an EEG signal devoid of electrooculogram interference. Furthermore, to address the potential impact of volume conduction effects on the functional connectivity and enhance the depiction of authentic connectivity among brain regions, this study adopted Current Source Density (CSD) estimation [32]. This approach not only amplifies the local information within channels of interest but also reduces common noise across each channel. Figure 3b visually demonstrates the comprehensive preprocessing procedure, employing a single instance of a grasping activity to exemplify the process.
In this study, data within the time range of [−2 5] s, relative to the initiation of movement, were selected as the study window for subsequent investigation. For the rest data, a window spanning 7 s, with intervals of 0.5 s, was employed. Ultimately, a total of 556 valid trials were extracted for each motor state type across all eight subjects. To decode the dynamic changes in EEG signals during the entire grasp task more comprehensively, with particular emphasis on capturing subtle changes during movement transitions, the study window was partitioned into 13 distinct segments, as illustrated in Figure 1. Importantly, there was a 0.5 s overlap of data between consecutive segments. Furthermore, in order to better analyze the brain functional connectivity, the 58-channel electrodes were divided into 10 brain regions, as shown in Table 1.

2.2. Movement-Related Cortical Potentials

Movement-related cortical potentials are a type of event-related potential that can depict the dynamic processing stages of movement preparation, movement execution, and movement termination [13,33,34]. The typical composition of MRCPs predominantly comprises the Readiness Potential (RP) and the Movement Execution Potential (MEP). RP, also known as Bereitschaftspotential (BP), signifies the potential shifts occurring in the brain cortex before the initiation of movement. This phenomenon materializes as a gradually intensifying negative potential, indicative of the brain’s strategic planning and preliminary arrangements for the impending movement [35]. Conversely, MEP emerges during the actual execution of the movement, reflecting the activation of the brain cortex [36,37]. Given the consistent waveform nature of MRCPs, this study performed an average overlay of preprocessed EEG signals from the eight participants to heighten the signal-to-noise ratio of EEG signals and mitigate the impact of random EEG components on MRCPs. Additionally, this procedure aids in reducing variability in EEG waveforms caused by variations in grasp task speeds among participants. As a result, it facilitates a clearer observation of the dynamic changes in EEG signals during the progression of grasp tasks [38].

2.3. Event-Related Desynchronization and Synchronization

Event-related desynchronization (ERD) and synchronization (ERS) are employed to gauge the changes in power within specific frequency bands of the EEG provoked by different tasks [39]. In this framework, ERD corresponds to the diminishing process of EEG rhythmic power, whereas synchronization denotes an increasing process. The standard calculation method is outlined as follows: Initially, the preprocessed EEG signal underwent band-pass filtering, within the ranges of the alpha band (8–13 Hz) and beta band (13–30 Hz), respectively. Subsequently, the square of the wave amplitude of the EEG data was computed to derive its power data s i g n a l p o w e r . Next, the power samples from the same task were averaged to yield the average power data, referred to as A v g s i g n a l p o w e r . Then, the mean of the average power samples within the time interval [−2 to −1] seconds was chosen as the baseline b a s e l i n e p o w e r . This step aimed to enhance data smoothness and minimize experimental variability [15,40]. Lastly, the average power data A v g s i g n a l p o w e r were compared to the baseline power samples b a s e l i n e p o w e r , and the relative change in power was calculated as a percentage or ratio. Based on the description provided above, Equation (1) is defined as follows:
E R D S = A v g s i g n a l p o w e r b a s e l i n e p o w e r b a s e l i n e p o w e r × 100 %

2.4. Brain Functional Connectivity

Brain functional connectivity unveils the process of information transfer between different regions of the brain during movement. Time–frequency cross mutual information (TFCMI) is a research approach rooted in information theory, without making assumptions about the signal adhering to any specific probability distribution [20,21,23,41,42]. Its underlying principle involves utilizing wavelet transform to extract amplitude information from the signals and employing the mutual information method to assess potential linear and nonlinear relationships between the signals within a specific frequency band. By applying this approach to analyze brain functional connectivity across the 13 target segments during natural grasp, a more accurate evaluation of the dynamic reorganization process of brain functional connectivity during natural movement can be attained.
The Morlet wavelet demonstrates a unique capability in multiresolution analysis. Its application to EEG signal analysis effectively extracts time-varying band information [43], enabling it to adeptly capture the transient changes that unfold during movement processes. In parallel, mutual information is an information-theoretic metric, gauging the level of nonlinear interdependence among signals. This metric excels in providing a more precise insight into the intricate information propagation mechanisms between various brain regions during movement. Consider the data from the ith channel at time instant t, denoted as x i t . The associated Morlet wavelet transformation can be expressed as:
W x i t , f = x i λ ϕ * t , f t λ d λ
In this context, W x i t , f represents the amplitude information at frequency f for the ith channel at time t.
The Morlet wavelets are
ϕ t , f λ = σ 2 1 / 2 e i 2 π f λ t e λ t 2 2 σ 2
where their time spread is defined by σ = 8 2 π f . ϕ * t , f λ are the complex conjugates of ϕ t , f λ .
Let us represent the averaged amplitude of the ith channel as a random variable F i , with its probability density function (pdf) denoted as P F i , b . Similarly, we computed the joint pdf between the ith and jth EEG channels as P F i , b , F j , b . The calculation of TFCMI between two random variables F i and F j proceeded as follows:
T F C M I F i , F j = b = 1 n P F i , b , F j , b ln P F i , b , F j , b P F i , b P F j , b
where b denotes the index of the sampling bins employed to create the approximate probability density function (pdf). Accurate estimation of both the pdf and joint pdf from the data histogram is essential for mutual information calculation. In EEG analysis, it is common practice to utilize a range of 40 to 60 bins when constructing these histograms [44].
The TFCMI matrix exhibits a reciprocal nature, with its elements representing the magnitude of mutual coupling between EEG electrodes. Normalizing these elements using diagonal values aids in better understanding the interdependence between channels. By calculating the average cumulative coupling strengths across the 13 segments, the global coupling strength of the brain is determined, reflecting the information exchange process among electrodes during movement. The greater the global coupling strength of an electrode, the more extensive its information exchange with other electrodes, indicating a higher relevance to the task. Therefore, the global coupling strength is utilized for channel selection, which reduces data volume and enhances classification efficiency during subsequent recognition of grasping activities.

2.5. Classification

2.5.1. Wavelet Packet Decomposition

Wavelet packet decomposition is an extension of the wavelet transform, addressing the limitations of wavelet decomposition by encompassing both low and high-frequency components of a signal. It features multiscale analysis, high time–frequency resolution, and energy concentration [45]. Through wavelet packet decomposition, the changing information within EEG signals during the grasp process at different moments and across various frequency bands can be effectively captured. This enables a more precise decoding of the dynamic evolution. Wavelet packet decomposition orthogonalizes the signal’s energy into adjacent, nonoverlapping frequency bands, following the principle of energy conservation. Thus, the energy of wavelet packets can reflect the magnitude of corresponding frequency band energy. Leveraging the multiscale characteristics and energy concentration inherent in wavelet packet decomposition, utilizing the extracted energy as classifier features could effectively mitigate the influence of redundant information, subsequently reducing feature dimensions and computational complexity, and thereby enhancing classifier performance and robustness. Furthermore, the adaptive analytical capability of wavelet packet decomposition enables the extracted energy features to exhibit strong generalizability for classifying EEG signals across different tasks. In this study, the Daubechies 4 wavelet (db-4 wavelet) was chosen as the foundational basis function, with a decomposition depth of 3 layers. Following the preprocessing of the EEG signal, the energy of the wavelet packet associated with the i node subsequent to three layers of wavelet packet decomposition is as follows:
E i = i = 1 N η i 2
where N represents the quantity of coefficients in the corresponding frequency band, while η i denotes the wavelet packet coefficients of the corresponding band.

2.5.2. Random Forest

Random forest is a classifier constructed by combining multiple decision trees as its foundational classifiers. Essentially, it is an ensemble learning method that aggregates the outcomes of numerous decision trees, thereby providing enhanced classification accuracy. Additionally, this algorithm demonstrates exceptional adaptability to high-dimensional data and robustness against noise and outliers, effectively reducing the risk of overfitting. The specific implementation process unfolded as follows: Initially, a training sample set undergoes repetitive random sampling with replacement, generating bootstrap sample sets. This procedure is repeated k times. Subsequently, each bootstrap sample set is utilized as a training dataset to cultivate an individual decision tree. Suppose there are a total of M input features, and a positive integer m adheres to the condition m M , at each node of the tree, m features are randomly selected from the M features for computation. The optimal point of division is then determined from these m features, following the principle of minimizing node impurity, which guides the growth of branches. Throughout the entire progression of building the forest, m remains consistent. The individual trees are allowed to grow comprehensively, ensuring that impurity at every node is minimized without employing pruning techniques. Subsequently, the aforementioned steps are iterated until a collection of k classification regression trees are generated. Lastly, the class predictions are made through majority voting among the trees within the forest [46,47].

2.6. Difference Evaluation

The two-serial correlation coefficient is a statistical measure that assesses the differences among variables, with larger values denoting more significant disparities among these variables [48]. In this study, it was utilized to analyze the differences of the three tasks in MRCPs, ERD(S), and brain functional connectivity, which made the analysis results not only obtained by observation but also reflected by data, which is more scientific. The formula is as follows
X r = N + N N + + N m e a n X m e a n X + s t d X X +

3. Results

3.1. Motor Cortex-Related Potentials

Figure 4 illustrates the MRCPs for three types of grasp tasks, recorded via electrodes C1, Cz, and C2. Specifically, Figure 4a portrays the MRCPs for palmar grasp, Figure 4b for lateral grasp, and Figure 4c for the rest state. During the rest state, the MRCPs exhibited relatively smooth patterns with random fluctuations around the baseline. For both grasp tasks, a prominent positive peak emerged in the initial 0.5 s of the motor task (−1 S). Subsequently, negative deflections followed suit, culminating in a negative peak at the moment of motor onset (0 S). Approximately 300 ms after the onset of motor, a smaller positive peak manifested. Prior to the grasp initiation (0.5–1 S), yet another substantial positive peak materialized, followed by a gradual return to a level closely aligned with the baseline.
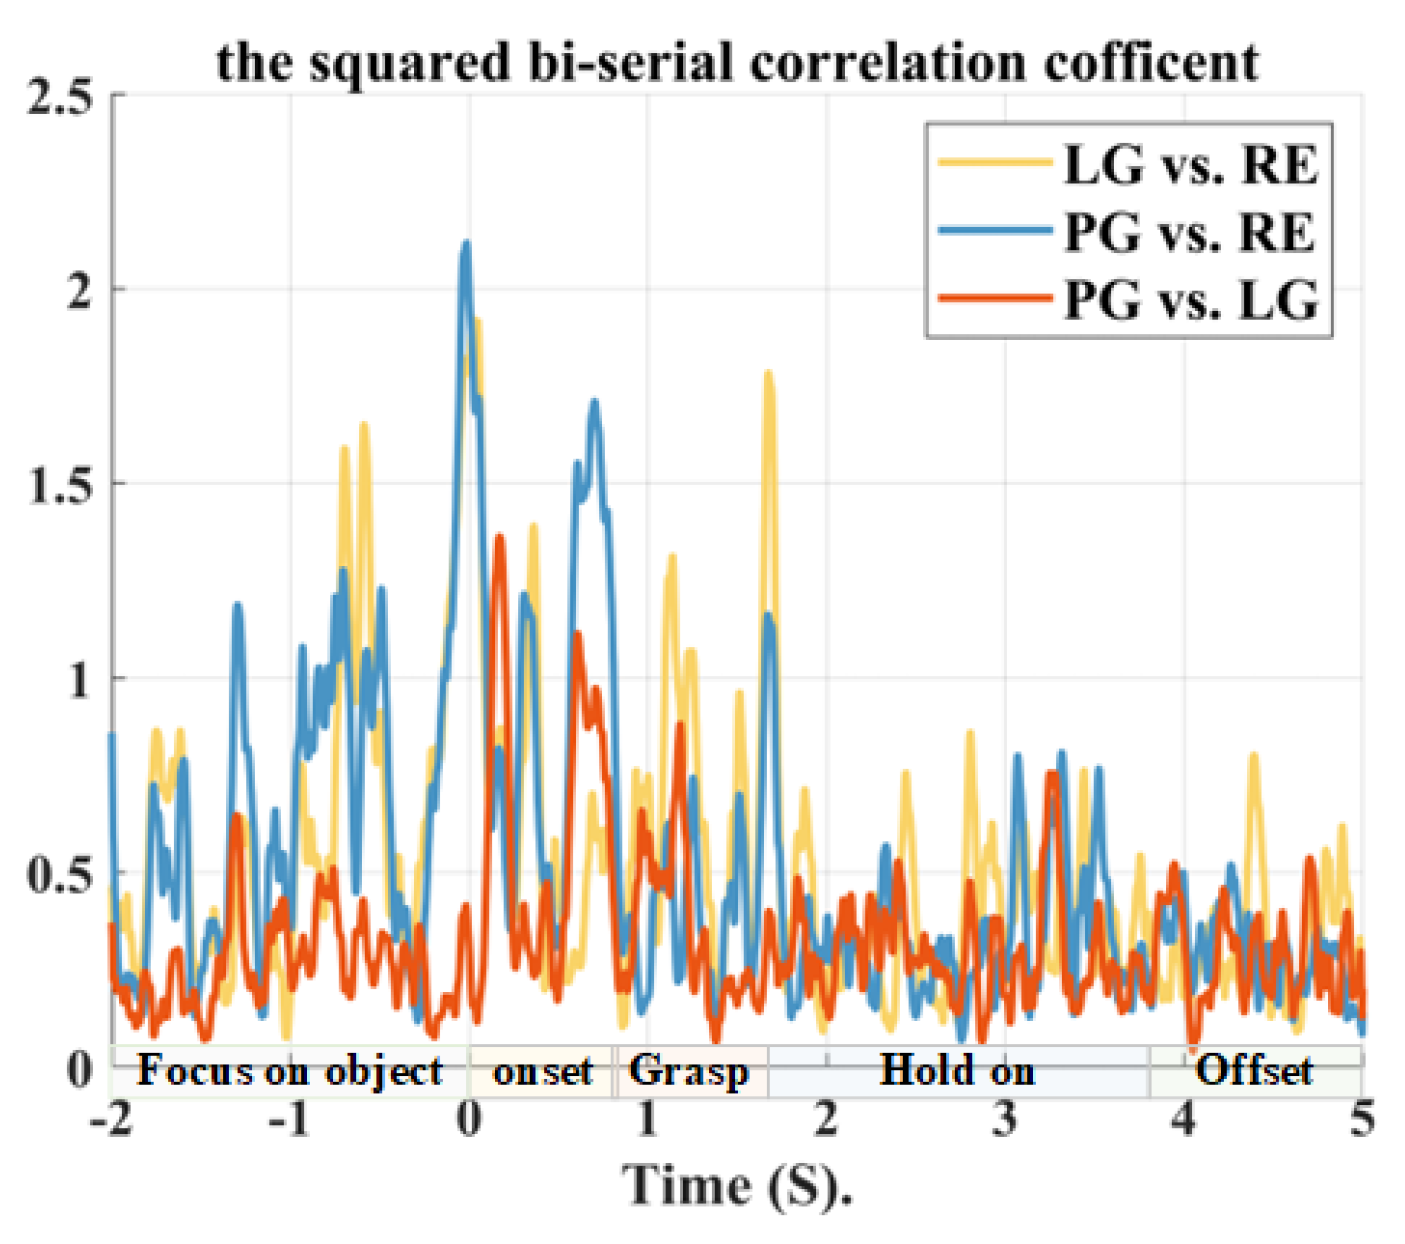
Upon comparing the MRCPs of the two grasp tasks, notable differences come to light. During the palmar grasp, a prominent negative peak emerged prior to the movement onset (−1.3 S), succeeded by a subsequent transition to a positive peak (−1 S). This positive peak exhibited an extended duration, and concurrently, the amplitude of the positive peak before the onset of grasp (0.5–1 S) was pronounced. In contrast, in the case of the lateral grasp, the positive peak before the initiation of the grasp demonstrated a prolonged duration, accompanied by a heightened amplitude of the positive peak at 300 ms. Furthermore, an incidental positive peak fluctuation is observable at the negative maximum peak during lateral grasp. It is worth noting that, in both grasp tasks, the magnitude of the positive peak before the onset of movement, as well as the negative peak at the onset of movement, was significantly higher at electrode C1 compared to electrode C2. These distinctions were visualized and quantified using the two-series correlation coefficient, as depicted in Figure 5.

3.2. Event-Related Desynchronization and Synchronization

The ERD(S) for three types of grasp tasks at electrodes C1, Cz, and C2 are depicted in Figure 6. In particular, Figure 6a–c correspond to the alpha band (8–13 Hz), while Figure 6d–f represent the beta band (20–30 Hz). It is noteworthy that the rest state did not exhibit any significant ERD(S) phenomena in either frequency band. However, for both types of grasp tasks, a substantial ERD phenomenon became evident within the initial 1 s after the onset of movement. Additionally, the ERD phenomenon at electrode C1 was markedly more pronounced compared to C2. In the alpha band, the palmar grasp exhibited a minor amplitude peak approximately 500 ms after the onset of movement, which persisted until the initiation of the grasp (1 S). In the beta band, both grasp tasks demonstrated a larger amplitude peak occurring between 1.5 S and 2.5 S. Notably, the duration of this peak was more extended in the palmar grasp compared to the lateral grasp. Furthermore, a brief amplitude peak emerged during the palmar grasp precisely at the moment of movement onset (0 S). The differences among the three tasks were quantified using the two-series correlation coefficient, and the results are presented in Figure 7.

3.3. Brain Functional Connectivity

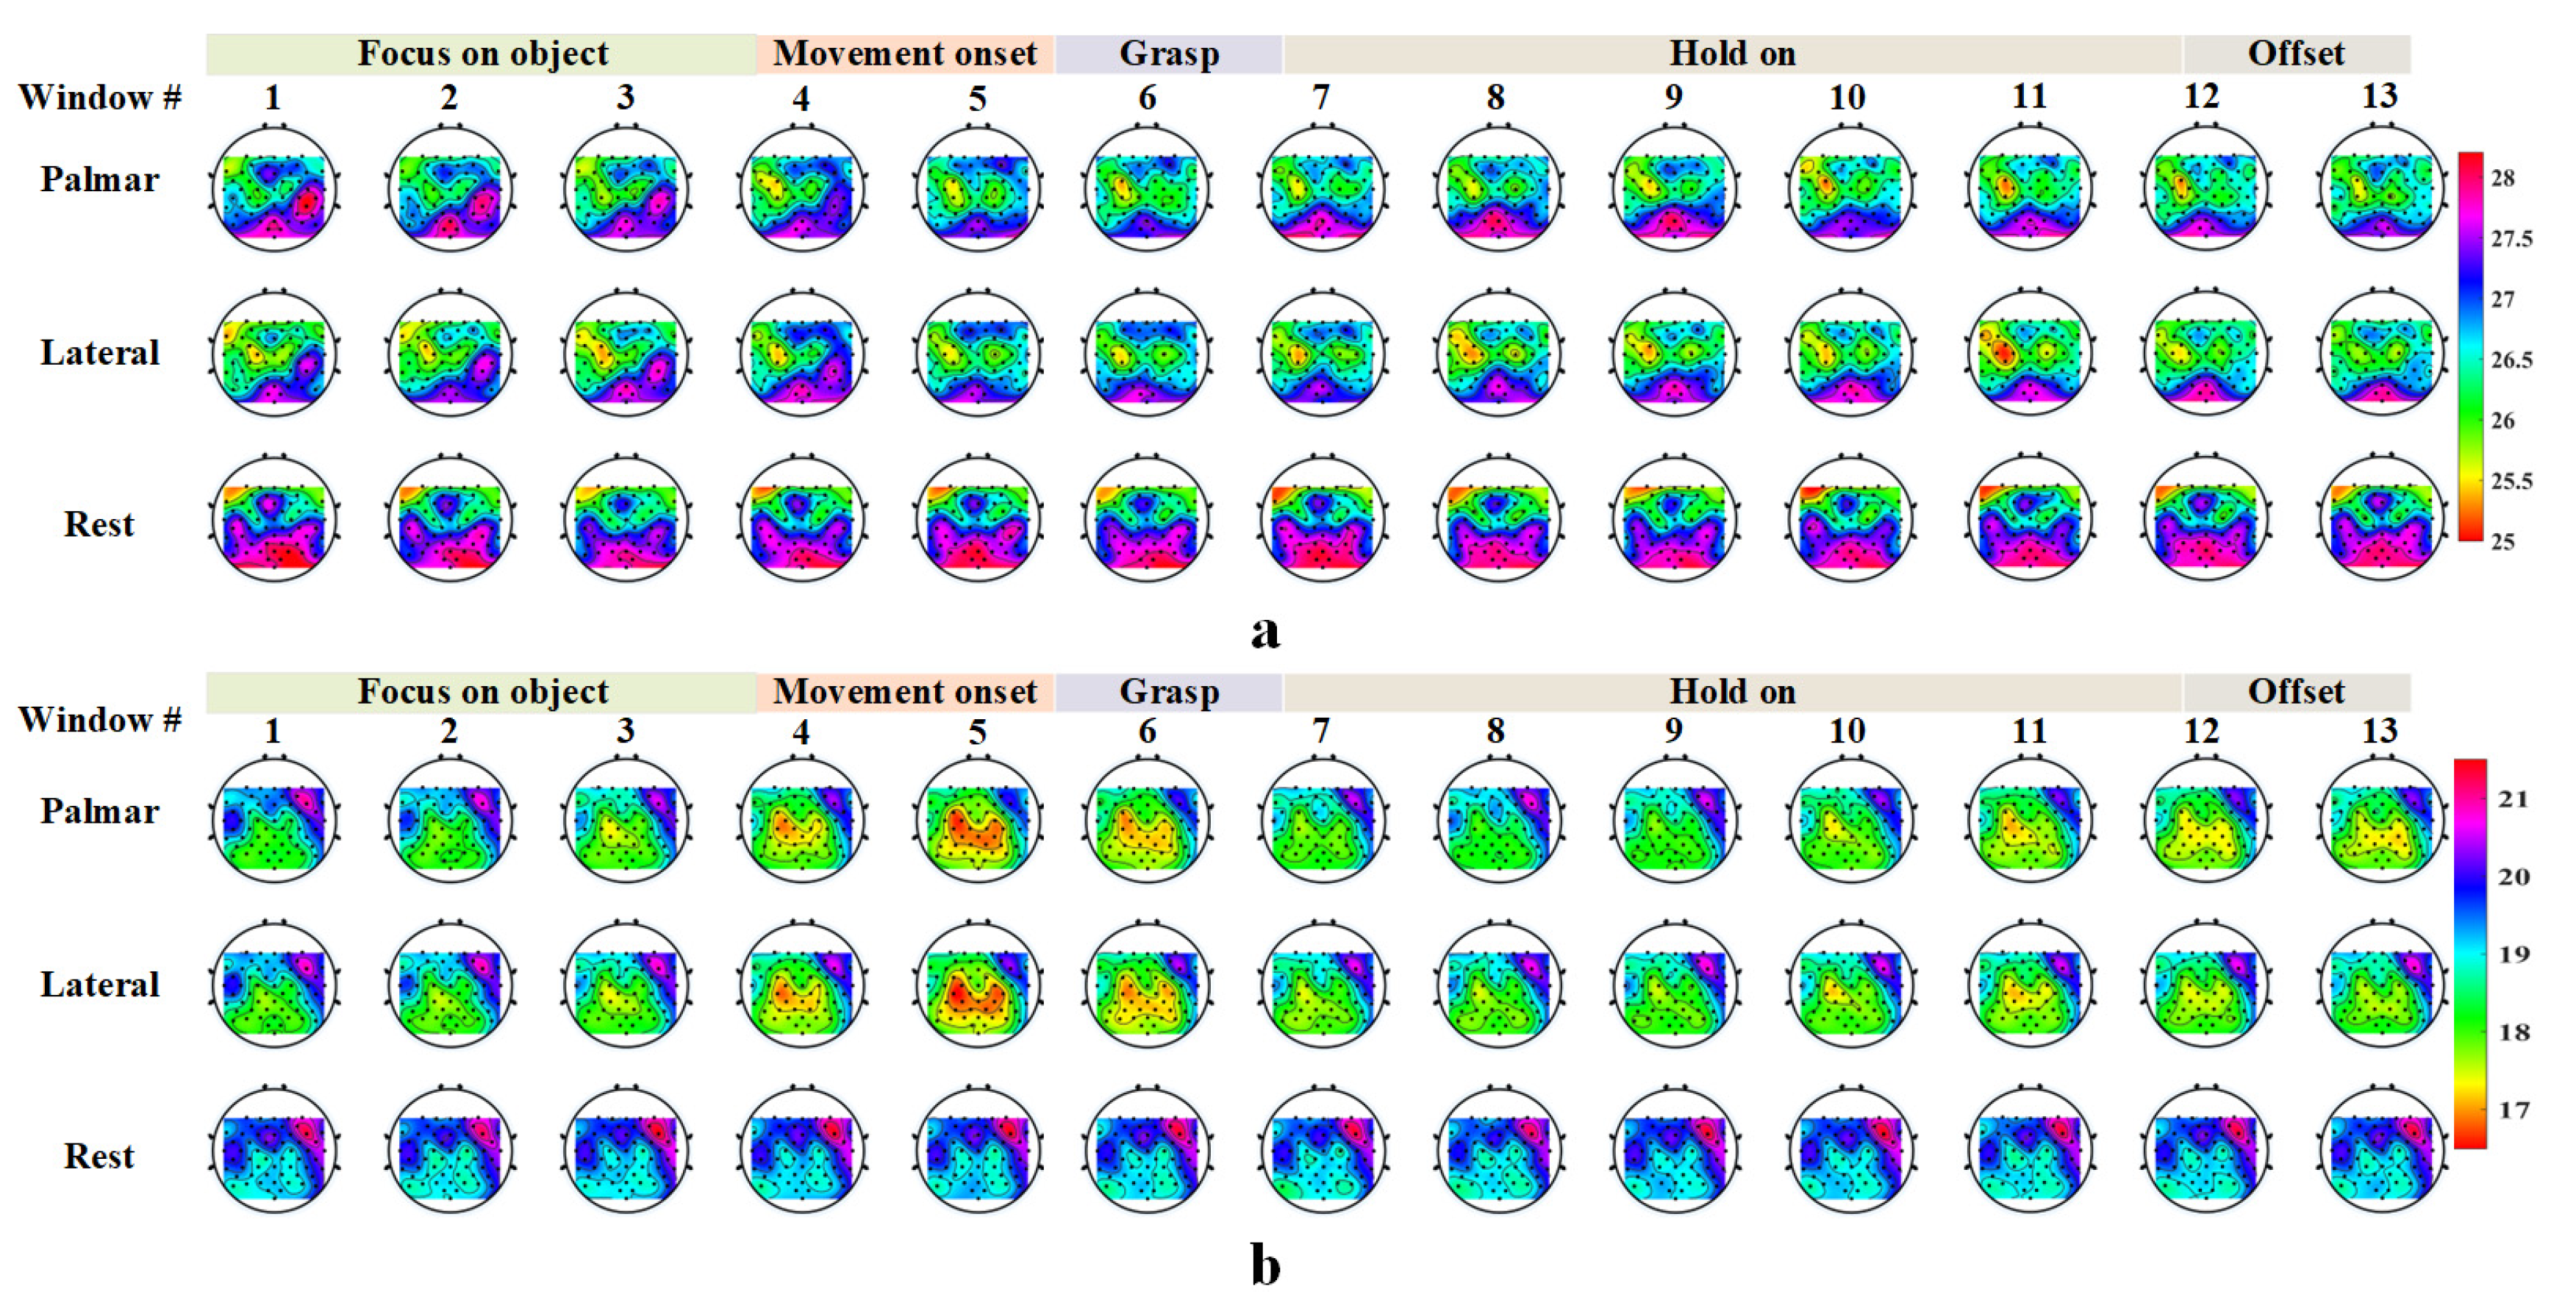
Figure 8 illustrates the topography of coupling strength, as derived from the TFCMI, across different movement periods for the palmar grasp, lateral grasp, and rest state, with Figure 8a representing the alpha band (8–13 Hz) and Figure 8b corresponding to the beta band (20–30 Hz). It can be seen that the coupling strength for the rest state showcased a relatively smooth pattern in both the alpha and beta bands.
From Figure 8a, it can be observed that compared to the rest state, during the movement preparation period (1–3), there was a noticeable decrease in coupling strength in the left and middle of the central region, as well as the left and middle of the parietal region, and the occipital region, whereas there was an evident increase in the right frontal region and the areas adjacent to the frontal in the right central region. At the movement onset (4–5), the coupling strength further weakened in the left and right central regions, right parietal region, and occipital region. Concurrently, the counterpart in the central region and the right side of the frontal region strengthened. At the beginning of the grasp (6), the coupling strength exhibited a more substantial reduction in the middle and right of the frontal region, the left and right central region, and the right parietal region. Throughout the grasp hold period (7–9), there was a notable enhancement in the coupling strength in the central region, parietal region, and occipital region. Remarkably, at the onset of the grasp (6) of the palmar grasp, the coupling strength in the middle and right frontal region, left central region, right parietal region, and occipital region was significantly lower compared to the lateral grasp. Conversely, during the grasp hold period (7–9), the lateral grasp demonstrated notably lower coupling strength in the left central region, middle parietal region, and occipital region compared to the palmar grasp.
Observing Figure 8b, it is evident that, compared to the rest state, during the movement preparation period (1–3), there was a significant decrease in coupling strength in the left and middle of the frontal region, the left and middle of the central region, the left and middle of the parietal region, and the occipital region. As the movement initiated (4–5), the coupling strength further diminished in the right frontal region, the central region, the parietal region, and the occipital region. At the onset of the grasp (6), there was an enhancement in coupling strength within the central region, the parietal region, and the occipital region. Conversely, the counterpart in the right frontal region experienced notable weakening. During the grasp hold period (7–9), an overall fortification in the brain’s coupling strength became evident, particularly notable in the right frontal region, the central region, and the parietal region. For the palmar grasp, the coupling strength in the right frontal region was significantly lower at the onset of the grasp (6) compared to the lateral grasp, while it was higher in the left occipital region than in the lateral grasp. However, during the grasp hold period (7–9), the lateral grasp demonstrated notably lower coupling strength in the central region and in the areas adjacent to the central part of the frontal regions compared to the palmar grasp.
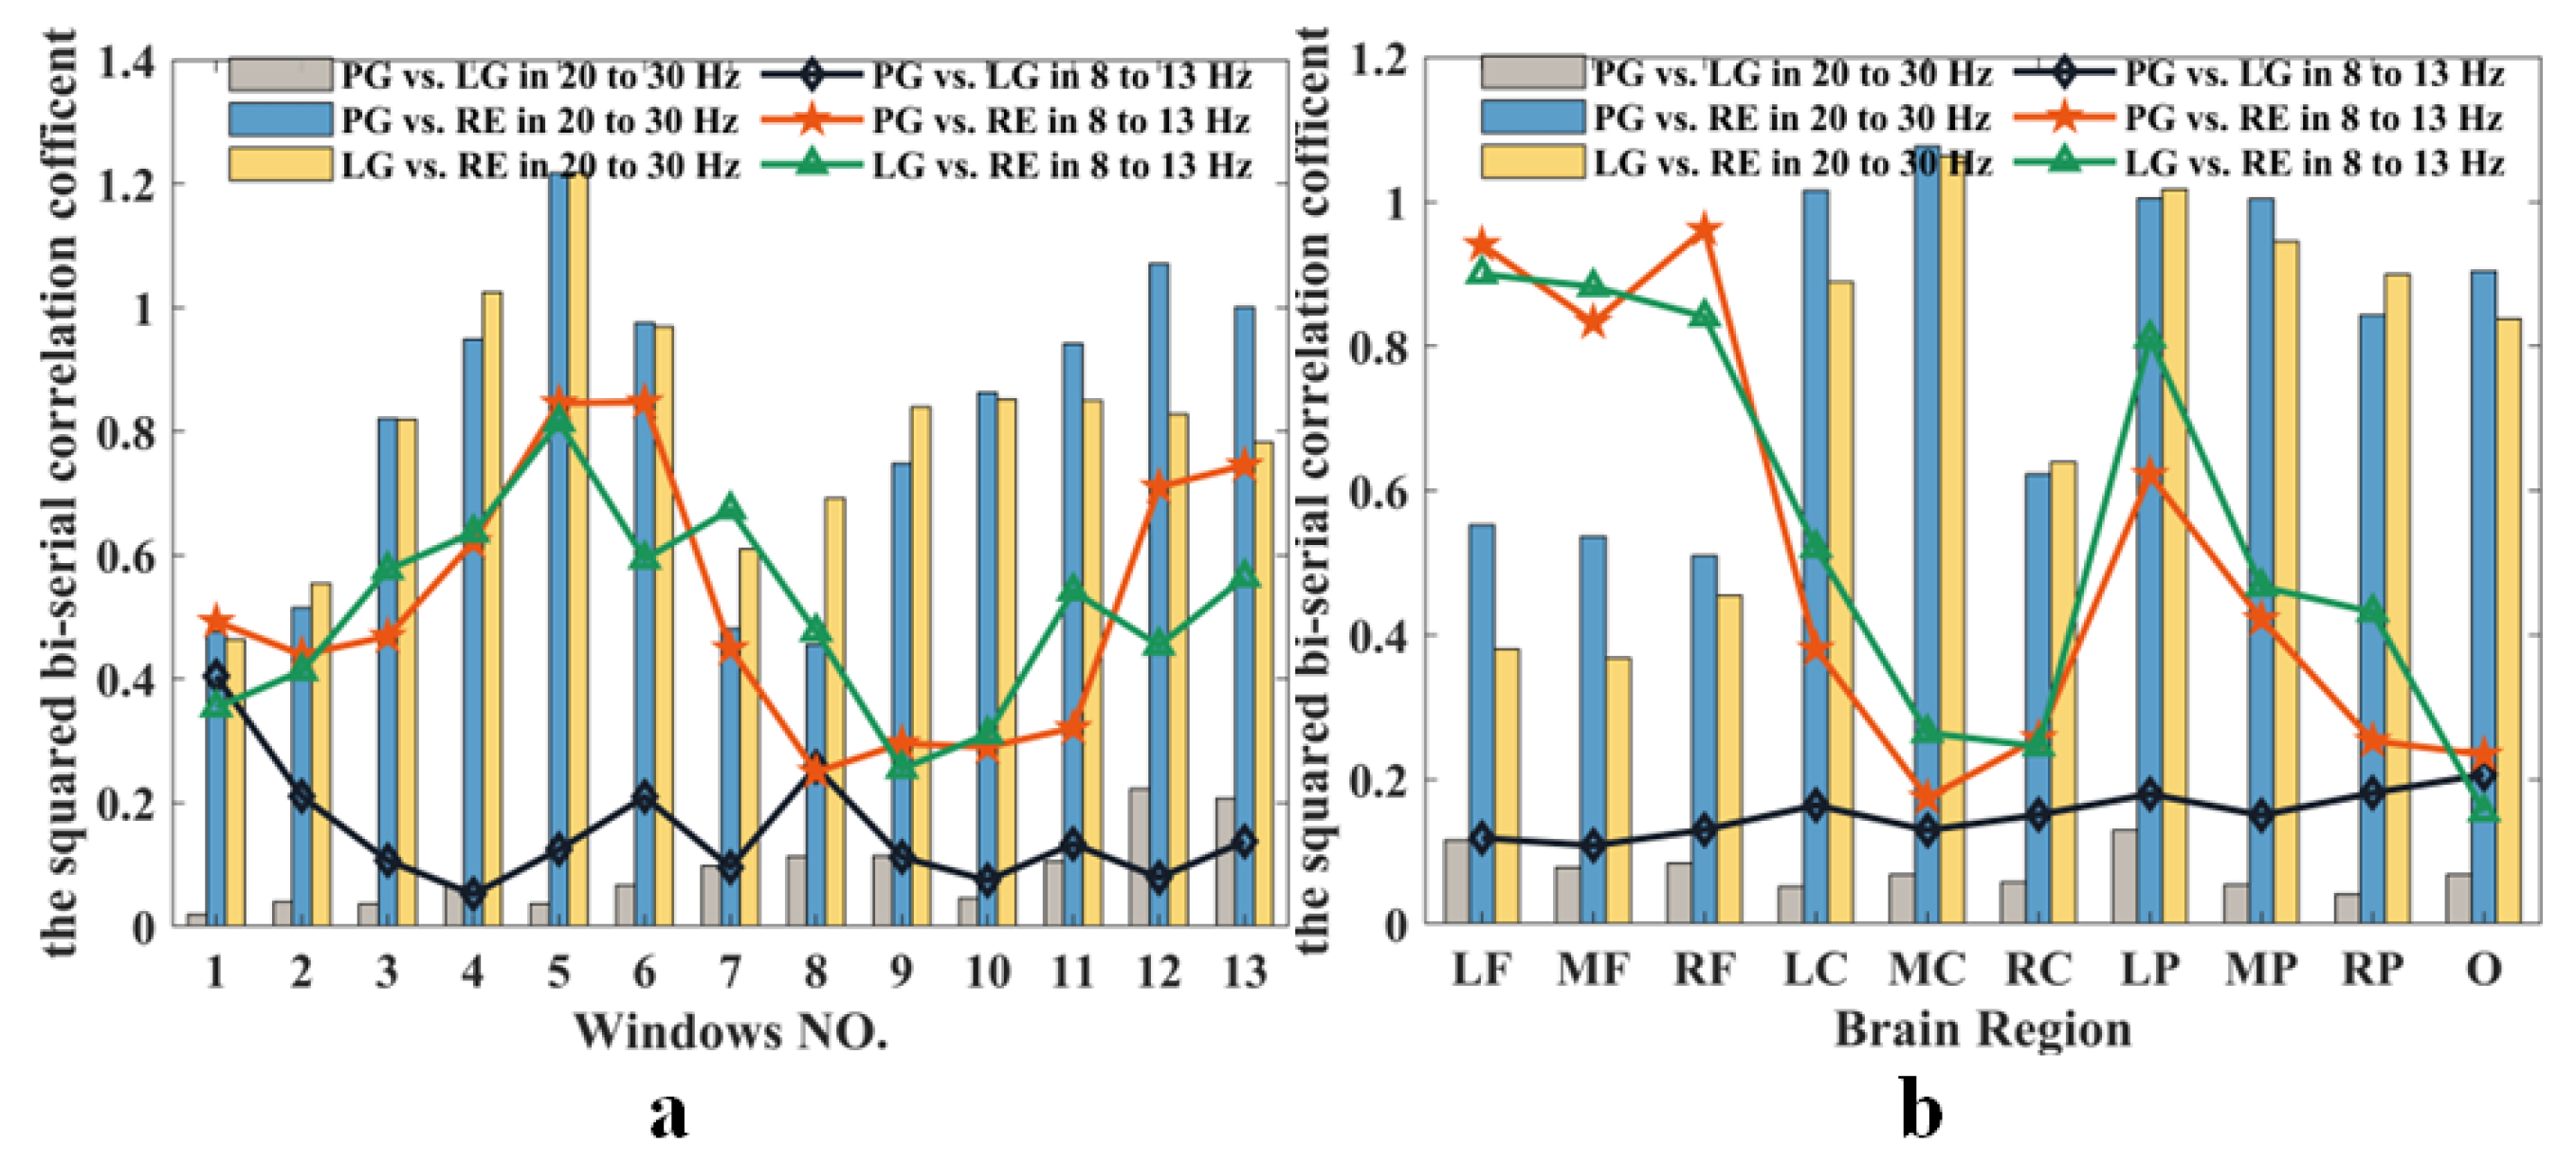
Figure 9 depicts the outcomes of two-series correlation coefficient analysis, aimed at quantifying differences in the coupling strength across the three tasks. Figure 9a represents the 13 motor periods, while Figure 9b focuses on brain regions. Notably, the difference in coupling strength between the rest state and the two grasp tasks was significantly greater than the counterpart between the two distinct motor tasks, both in terms of motor period and brain regions. As can be seen in Figure 9a, in the alpha band (8–13 Hz), the difference in coupling strength between the two grasp tasks gradually decreased during the preparation period (1–3), reaching its minimum at the moment of movement onset (4). Subsequently, this difference increased at the initiation of the grasp task (6) and continued to rise during the grasp maintain period (8), eventually regressing closer to the baseline. In the beta band (20–30 Hz), the contrast between the two tasks was more pronounced at the beginning of the grasp period (6) and during the grasp hold (8). From Figure 9b, it is evident that in the alpha band (8–13 Hz), the differences in coupling strengths were more prominent in the left central region, the left and right parietal regions, and the occipital region. Meanwhile, in the beta band (20–30 Hz), the contrast in coupling strength was more substantial between the left parietal area and the frontal area.

3.4. Classification

Utilizing the global coupling strength computed via TFCMI, electrodes exhibiting lower activity during the rest state yet displaying activity during the two grasp tasks were systematically filtered out. This filtering process resulted in a final selection of 20 channel electrodes, which are as follows: F3, F1, Fz, FFC3h, FC5, FC3, FC1, FCC3h, FCC2h, C1, Cz, C2, CCP3h, CCP1h, CCP2h, CP5, CP1, CPP6h, P5, and P6.
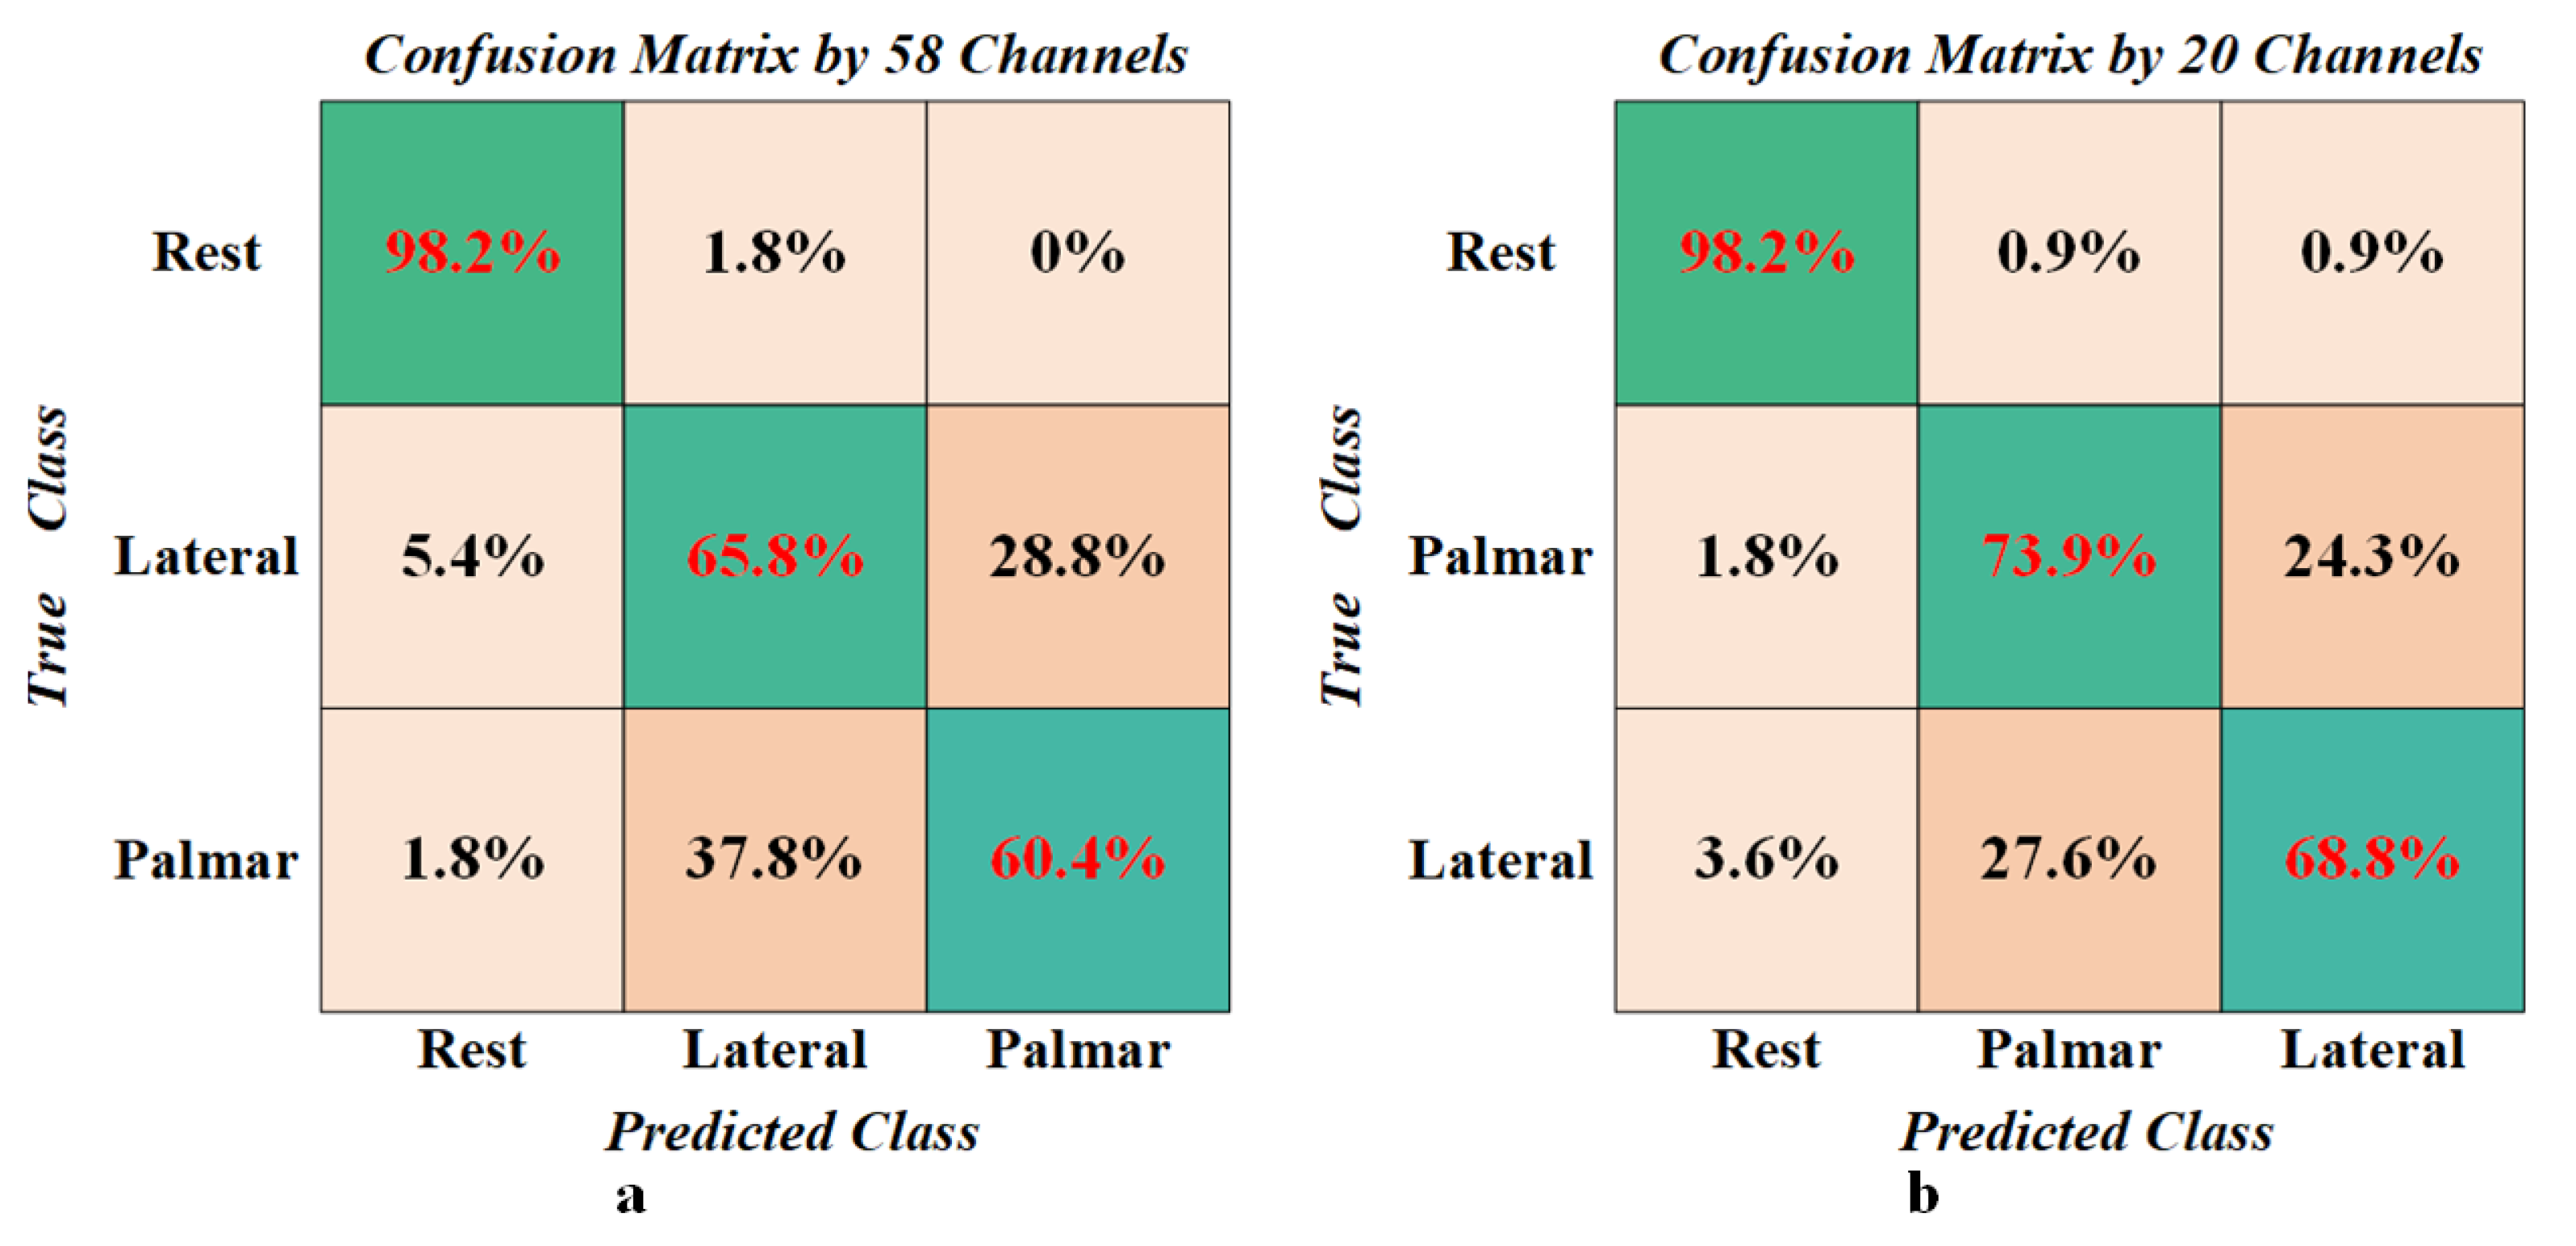
Figure 10 illustrates the confusion matrix showcasing the average classification outcomes for the three states. Within this representation, Figure 10a portrays the data employing the complete electrodes with 58 channels, while Figure 10b showcases the data utilizing the filtered electrodes with 20 channels. From the depiction in Figure 10a, it is apparent that the rest state attained the highest recognition accuracy, standing at an impressive 98.2%. Subsequently, the lateral grasp achieved a recognition accuracy of 65.8%, followed by palmar grasp with a recognition accuracy of 60.4%. The cumulative average accuracy when utilizing the full 58 channels of EEG data amounted to 74.8%. Turning attention to Figure 10b, the recognition accuracy for the resting state remained consistently high at 98.2%. However, there was an improvement in accuracy for palmar grasp, reaching 73.9%, and for lateral grasp, achieving 68.8%. Through the utilization of 20 channels of EEG data for classification, the recognition accuracy for the rest state remained unaltered, yet the accuracy for both grasp tasks showed enhancement, culminating in an overall average accuracy of 80.3%. Furthermore, Table 2 provides a comprehensive overview of the individual classification results for each of the eight subjects.

4. Discussion

In this study, the analysis focused on MRCPs and ERD(S) of three grasp tasks. The waveform distribution of MRCPs was in line with previous reports in [8,26,27,30]. Research has confirmed the connection between positive and negative potentials of EEG signals and synaptic activity [49]. These negative deflections have been associated with the energy demands or the level of effort required for movement planning or execution [50]. The amplitude of the short-duration positive peak around 300 ms after the onset of movement was greater for lateral grasp; in other words, before the onset of grasp, there was a larger negative pullback of this positive peak. Simultaneously, the positive peak persisted longer during the lateral grasp compared to the palmar grasp. This difference suggests that a lateral grasp involves more intricate and nuanced activity compared to a palmar grasp, resulting in heightened synaptic activity in the brain cortex. This, in turn, signifies a greater energy demand or exertion during the execution of a lateral grasp. Moreover, a distinct lateralization effect emerged in both MRCPs and ERD(S) for both grasp tasks; specifically, the amplitude of MRCPs exhibited lower values while ERD(S) displayed higher values at the onset of movement from electrode C1 compared to electrode C2. This phenomenon corresponds to the left or right side of the motor executive hand and aligns with earlier research findings [8,12,15,30,51].
This study employed TFCMI to investigate brain functional connectivity in EEG signals during motion states, confirming the close association of the alpha (8–13 Hz) and beta (20–30 Hz) bands with subjects’ motor and cognitive behaviors [52]. During the rest state, the coupling relationships between the brain regions remained relatively stable, which is commonly referred to as the default mode network (DMN) [53]. In comparison to the rest state, the coupling strengths within the central, parietal, and occipital regions exhibited a notable decrease during the movement preparation period in both the alpha (8–13 Hz) and beta (20–30 Hz) bands. Conversely, the coupling strength in the right frontal region and the right side of the central region adjacent to the frontal region demonstrated a substantial increase in the alpha band (8–13 Hz). This phenomenon occurred because the subjects were instructed to direct their gaze toward the grasp target during the motor preparation period, thereby introducing an external visual stimulus. Previous research has demonstrated that the default mode activates when external stimuli are absent, while the default mode network is inhibited and the Central Executive Network (CEN) becomes active when subjects focus on external stimuli [54]. Furthermore, the increased coupling strength observed between frontal regions and other brain regions in the presence of visual stimuli might indicate improved communication during visual processing [55]. At the onset of the movement, a distinct lateralization effect became evident, with notably lower coupling strength observed in the left-brain region compared to the right. This observed phenomenon aligns with earlier findings from studies focusing on MRCPs and ERDS. The coupling strengths of both the central and parietal regions exhibited a significant weakening at the onset of movement when contrasted with the movement preparation period. At the beginning of the grasp, there was a further attenuation in coupling strength between the central and parietal regions. Subsequently, throughout the grasp hold period, an increase in coupling strength within the central areas was observed. This is due to the fact that at the onset of the movement, the brain assigns higher priority to the motor task compared to the visual stimulus present during the preparation period. As a result, the DMN is further suppressed, and the CEN is activated to execute the grasping activity. Throughout the entire movement, the frontal regions remained consistently engaged, underscoring their crucial role in visual processing. During palmar grasp, the connectivity within the central region was more pronounced, while for lateral grasp, the connectivity within the parietal region was more active. This suggests that both the central and parietal regions are involved in motor-related activities, with the parietal region specifically overseeing finer motor control [56,57,58,59]. Furthermore, during our brain functional connectivity analysis, we divided the study window into 13 segments, each with a 0.5 s overlap. This decision was made thoughtfully, considering both the experimental design and the duration of each movement period. A window that is too brief might miss capturing the motor transition process accurately, while an overly long window could span multiple motor periods, potentially compromising the accuracy of motor transition depiction.
This study employed wavelet packet energy extraction and the random forest method to effectively decode EEG signals. Prior studies [8,27,30,51] utilized 58 channels of EEG signals during decoding, yet not all brain regions covered by these channels are relevant to grasp tasks. Channels from non-motion-related areas do not significantly enhance classification performance, thus rendering the data redundant. Additionally, excessive channels lead to longer experiment preparation times, causing inconvenience for participants. Hence, in this research, the global coupling strength derived from TFCMI was used to select 20 EEG signal channels relevant to grasp tasks. These selected channels were used for energy extraction and decoding with the random forest technique, ultimately achieving an average accuracy of 80.3%.
It is important to highlight that the EEG data utilized in this study were derived from healthy participants rather than individuals with upper limb motor dysfunction. This distinction underscores the need for a further exploration of specific issues pertinent to practical brain–computer interface (BCI) applications within the latter group. Moreover, the dataset does not strictly enforce specific completion times for the various motor periods of the participants. Instead, it solely relies on sensor calibration for delineation, leading to a certain degree of error in delineating the different motor period. This imprecision can subsequently impact the analysis of brain functional connectivity associated with these motor states. It is important to highlight that this investigation primarily concentrates on assessing the impact of varying EEG signal channel numbers on classification accuracy. It does not delve deeply into a comprehensive comparison of different classification methods and their effects on accuracy. The observed issue is that of significantly higher accuracy during the classification of rest states compared to grasp tasks. This is mainly due to the high similarity in movement processes between a palmar grasp and a lateral grasp. In our upcoming studies, we will be dedicated to addressing this imbalance by distinguishing between these closely related processes. Our plan involves the utilization of advanced models and the exploration of new signal features to effectively tackle this challenge.

5. Conclusions

This study delved into the decoding of EEG signals associated with a palmar grasp, a lateral grasp, and the rest state from various dimensions. The analysis encompassed MRCPs and ERD(S), while also investigating the dynamic alterations in brain functional connectivity during the grasp tasks via the employment of TFCMI. Moreover, relevant electrodes were selected based on global coupling strength, energy features were extracted using wavelet packets, and random forest was employed to decode three types of grasp tasks, achieving an average classification accuracy of 80.3%. Introducing attention and cognitive processes into the analysis of the movement preparation period enhances the coherence and rationality of EEG signal analysis during the movement process. At the onset of movement, noteworthy lateralization effects were observed in MRCPs, ERD(S), and brain functional connectivity, which could be attributed to the execution of the hand’s movement on the left or right side. Notable differences in brain functional connectivity were observed between different grasp tasks compared to the rest state. Additionally, distinct variations in brain functional connectivity for the same grasp task at different time periods were evident. These findings contribute to a deeper understanding of interregional information exchange in real-world motor scenarios, providing a theoretical foundation for the utilization of motion-related EEG signals to control intelligent assistive devices. Furthermore, they offer novel insights for the development and application of BCI intelligent assistive devices.

Author Contributions

Conceptualization, H.G., J.W., F.J., W.X. and Y.H.; methodology, H.G. and Y.H.; software, H.G. and J.W.; validation, Y.H., F.J., W.X. and X.Z.; formal analysis, W.X. and X.Z.; investigation, H.G., J.W., F.J., W.X. and X.Z.; writing—original draft preparation, H.G., J.W. and W.X.; writing—review and editing, H.G., F.J. and Y.H.; supervision, W.X. and X.Z.; project administration, H.G., J.W. and Y.H.; funding acquisition, J.W. and Y.H. All authors have read and agreed to the published version of the manuscript.

Funding

This research was partly funded by the National Natural Science Foundation of China under grants 62122070 and 61971381, in part by the Natural Science Foundation of Shanxi Province under grants 20210302124190 and 20210302124191, and in part by the Fundamental Research Program of Shanxi Province under grant 202203021222034.

Data Availability Statement

The data presented in this study are available on request from the corresponding author.

Conflicts of Interest

The authors declare no conflict of interest.

References

  1. Biasiucci, A.; Leeb, R.; Iturrate, I.; Perdikis, S.; Al-Khodairy, A.; Corbet, T.; Schnider, A.; Schmidlin, T.; Zhang, H.; Bassolino, M.; et al. Brain-actuated functional electrical stimulation elicits lasting arm motor recovery after stroke. Nat. Commun. 2018, 9, 2421. [Google Scholar] [CrossRef]
  2. Snoek, G.J.; MJ, I.J.; Hermens, H.J.; Maxwell, D.; Biering-Sorensen, F. Survey of the needs of patients with spinal cord injury: Impact and priority for improvement in hand function in tetraplegics. Spinal Cord 2004, 42, 526–532. [Google Scholar] [CrossRef] [PubMed]
  3. Wolpaw, J.R.; Birbaumer, N.; McFarland, D.J.; Pfurtscheller, G.; Vaughan, T.M. Brain-computer interfaces for communication and control. Clin. Neurophysiol. Off. J. Int. Fed. Clin. Neurophysiol. 2002, 113, 767–791. [Google Scholar] [CrossRef] [PubMed]
  4. Edelman, B.J.; Meng, J.; Suma, D.; Zurn, C.; Nagarajan, E.; Baxter, B.S.; Cline, C.C.; He, B. Noninvasive neuroimaging enhances continuous neural tracking for robotic device control. Sci. Robot. 2019, 4, eaaw6844. [Google Scholar] [CrossRef] [PubMed]
  5. Muller-Putz, G.R.; Scherer, R.; Pfurtscheller, G.; Rupp, R. Brain-computer interfaces for control of neuroprostheses: From synchronous to asynchronous mode of operation. Biomed. Tech. 2006, 51, 57–63. [Google Scholar] [CrossRef] [PubMed]
  6. Muller-Putz, G.R.; Scherer, R.; Pfurtscheller, G.; Rupp, R. EEG-based neuroprosthesis control: A step towards clinical practice. Neurosci. Lett. 2005, 382, 169–174. [Google Scholar] [CrossRef] [PubMed]
  7. Abrams, D.A.; Lynch, C.J.; Cheng, K.M.; Phillips, J.; Supekar, K.; Ryali, S.; Uddin, L.Q.; Menon, V. Underconnectivity between voice-selective cortex and reward circuitry in children with autism. Proc. Natl. Acad. Sci. USA 2013, 110, 12060–12065. [Google Scholar] [CrossRef] [PubMed]
  8. Schwarz, A.; Ofner, P.; Pereira, J.; Sburlea, A.I.; Muller-Putz, G.R. Decoding natural reach-and-grasp actions from human EEG. J. Neural Eng. 2018, 15, 016005. [Google Scholar] [CrossRef]
  9. Vuckovic, A.; Sepulveda, F. Delta band contribution in cue based single trial classification of real and imaginary wrist movements. Med. Biol. Eng. Comput. 2008, 46, 529–539. [Google Scholar] [CrossRef]
  10. Jochumsen, M.; Niazi, I.K.; Dremstrup, K.; Kamavuako, E.N. Detecting and classifying three different hand movement types through electroencephalography recordings for neurorehabilitation. Med. Biol. Eng. Comput. 2016, 54, 1491–1501. [Google Scholar] [CrossRef]
  11. Jochumsen, M.; Niazi, I.K.; Mrachacz-Kersting, N.; Farina, D.; Dremstrup, K. Detection and classification of movement-related cortical potentials associated with task force and speed. J. Neural Eng. 2013, 10, 056015. [Google Scholar] [CrossRef] [PubMed]
  12. Ofner, P.; Schwarz, A.; Pereira, J.; Müller-Putz, G.R. Movements of the same upper limb can be classified from low-frequency time-domain EEG signals. In Proceedings of the Sixth International Brain-Computer Interface Meeting: BCI Past, Present, and Future, Pacific Grove, CA, USA, 30 May–3 June 2016. [Google Scholar]
  13. Shibasaki, H.; Hallett, M. What is the Bereitschaftspotential? Clin. Neurophysiol. Off. J. Int. Fed. Clin. Neurophysiol. 2006, 117, 2341–2356. [Google Scholar] [CrossRef]
  14. de Melo, G.C.; Martes Sternlicht, V.; Forner-Cordero, A. EEG Analysis in Coincident Timing Task towards Motor Rehabilitation. In Proceedings of the 2020 42nd Annual International Conference of the IEEE Engineering in Medicine & Biology Society (EMBC), Montreal, QC, Canada, 20–24 July 2020; pp. 3027–3030. [Google Scholar] [CrossRef]
  15. Pfurtscheller, G.; Lopes da Silva, F.H. Event-related EEG/MEG synchronization and desynchronization: Basic principles. Clin. Neurophysiol. 1999, 110, 1842–1857. [Google Scholar] [CrossRef]
  16. Rimbert, S.; Fleck, S. Long-term kinesthetic motor imagery practice with a BCI: Impacts on user experience, motor cortex oscillations and BCI performances. Comput. Hum. Behav. 2023, 146, 107789. [Google Scholar] [CrossRef]
  17. Lopes da Silva, F.H.; van Rotterdam, A.; Barts, P.; van Heusden, E.; Burr, W. Models of neuronal populations: The basic mechanisms of rhythmicity. Prog. Brain Res. 1976, 45, 281–308. [Google Scholar] [CrossRef] [PubMed]
  18. Pfurtscheller, G.; Berghold, A. Patterns of cortical activation during planning of voluntary movement. Electroencephalogr. Clin. Neurophysiol. 1989, 72, 250–258. [Google Scholar] [CrossRef]
  19. Paek, A.Y.; Prashad, S. Repetitive execution of a reach-and-lift task causes longitudinal attenuation in movement-related EEG features. bioRxiv 2023. [Google Scholar] [CrossRef]
  20. Lu, C.F.; Teng, S.; Hung, C.I.; Tseng, P.J.; Lin, L.T.; Lee, P.L.; Wu, Y.T. Reorganization of functional connectivity during the motor task using EEG time-frequency cross mutual information analysis. Clin. Neurophysiol. Off. J. Int. Fed. Clin. Neurophysiol. 2011, 122, 1569–1579. [Google Scholar] [CrossRef]
  21. Gong, A.; Liu, J.; Chen, S.; Fu, Y. Time-Frequency Cross Mutual Information Analysis of the Brain Functional Networks Underlying Multiclass Motor Imagery. J. Mot. Behav. 2018, 50, 254–267. [Google Scholar] [CrossRef]
  22. Chen, C.C.; Hsieh, J.C.; Wu, Y.Z.; Lee, P.L.; Chen, S.S.; Niddam, D.M.; Yeh, T.C.; Wu, Y.T. Mutual-information-based approach for neural connectivity during self-paced finger lifting task. Hum. Brain Mapp. 2008, 29, 265–280. [Google Scholar] [CrossRef]
  23. Gu, H.; Wang, J.; Han, Y. Decoding of Brain Functional Connections Underlying Natural Grasp Task Using Time-Frequency Cross Mutual Information. IEEE Access 2023, 11, 84912–84921. [Google Scholar] [CrossRef]
  24. Pfurtscheller, G.; Muller, G.R.; Pfurtscheller, J.; Gerner, H.J.; Rupp, R. ‘Thought’—control of functional electrical stimulation to restore hand grasp in a patient with tetraplegia. Neurosci. Lett. 2003, 351, 33–36. [Google Scholar] [CrossRef] [PubMed]
  25. Xu, B.; Zhang, D.; Wang, Y.; Deng, L.; Wang, X.; Wu, C.; Song, A. Decoding Different Reach-and-Grasp Movements Using Noninvasive Electroencephalogram. Front. Neurosci. 2021, 15, 684547. [Google Scholar] [CrossRef] [PubMed]
  26. Schwarz, A.; Escolano, C.; Montesano, L.; Muller-Putz, G.R. Analyzing and Decoding Natural Reach-and-Grasp Actions Using Gel, Water and Dry EEG Systems. Front. Neurosci. 2020, 14, 849. [Google Scholar] [CrossRef]
  27. Schwarz, A.; Pereira, J.; Lindner, L.; Muller-Putz, G.R. Combining frequency and time-domain EEG features for classification of self-paced reach-and-grasp actions. In Proceedings of the 2019 41st Annual International Conference of the IEEE Engineering in Medicine and Biology Society (EMBC), Berlin, Germany, 23–27 July 2019; pp. 3036–3041. [Google Scholar] [CrossRef]
  28. Schwarz, A.; Holler, M.K.; Pereira, J.; Ofner, P.; Muller-Putz, G.R. Decoding hand movements from human EEG to control a robotic arm in a simulation environment. J. Neural Eng. 2020, 17, 036010. [Google Scholar] [CrossRef]
  29. Pereira, J.; Kobler, R.; Ofner, P.; Schwarz, A.; Muller-Putz, G.R. Online detection of movement during natural and self-initiated reach-and-grasp actions from EEG signals. J. Neural Eng. 2021, 18, 046095. [Google Scholar] [CrossRef]
  30. Schwarz, A.; Pereira, J.; Kobler, R.; Muller-Putz, G.R. Unimanual and Bimanual Reach-and-Grasp Actions Can Be Decoded From Human EEG. IEEE Trans. Biomed. Eng. 2020, 67, 1684–1695. [Google Scholar] [CrossRef]
  31. Hyvärinen, A.; Oja, E. Independent component analysis: Algorithms and applications. Neural Netw. 2000, 13, 411–430. [Google Scholar] [CrossRef]
  32. Hjorth, B. Principles for transformation of scalp EEG from potential field into source distribution. J. Clin. Neurophysiol. Off. Publ. Am. Electroencephalogr. Soc. 1991, 8, 391–396. [Google Scholar] [CrossRef]
  33. do Nascimento, O.F.; Nielsen, K.D.; Voigt, M. Movement-related parameters modulate cortical activity during imaginary isometric plantar-flexions. Exp. Brain Res. 2006, 171, 78–90. [Google Scholar] [CrossRef]
  34. Cunnington, R.; Iansek, R.; Bradshaw, J.L.; Phillips, J.G. Movement-related potentials associated with movement preparation and motor imagery. Exp. Brain Res. 1996, 111, 429–436. [Google Scholar] [CrossRef] [PubMed]
  35. Kornhuber, H.H.; Deecke, L. Brain potential changes in voluntary and passive movements in humans: Readiness potential and reafferent potentials. Pflug. Arch. 2016, 468, 1115–1124. [Google Scholar] [CrossRef] [PubMed]
  36. Slobounov, S.M.; Ray, W.J. Movement-related potentials with reference to isometric force output in discrete and repetitive tasks. Exp. Brain Res. 1998, 123, 461–473. [Google Scholar] [CrossRef] [PubMed]
  37. do Nascimento, O.F.; Nielsen, K.D.; Voigt, M. Relationship between plantar-flexor torque generation and the magnitude of the movement-related potentials. Exp. Brain Res. 2005, 160, 154–165. [Google Scholar] [CrossRef]
  38. Luck, S.J. An Introduction to the Event-Related Potential Technique; MIT Press: Cambridge, MA, USA, 2005. [Google Scholar]
  39. Neuper, C.; Wortz, M.; Pfurtscheller, G. ERD/ERS patterns reflecting sensorimotor activation and deactivation. Prog. Brain Res. 2006, 159, 211–222. [Google Scholar] [CrossRef]
  40. Pfurtscheller, G.; Aranibar, A. Evaluation of event-related desynchronization (ERD) preceding and following voluntary self-paced movement. Electroencephalogr. Clin. Neurophysiol. 1979, 46, 138–146. [Google Scholar] [CrossRef]
  41. Duncan, T.E. On the Calculation of Mutual Information. SIAM J. Appl. Math. 1970, 19, 215–220. [Google Scholar] [CrossRef]
  42. Shannon, C.E. A mathematical theory of communication. Bell Syst. Tech. J. 1948, 27, 379–423. [Google Scholar] [CrossRef]
  43. Bostanov, V. BCI Competition 2003—Data sets Ib and IIb: Feature extraction from event-related brain potentials with the continuous wavelet transform and the t-value scalogram. IEEE Trans. Biomed. Eng. 2004, 51, 1057–1061. [Google Scholar] [CrossRef]
  44. Fraser, A.M.; Swinney, H.L. Independent coordinates for strange attractors from mutual information. Phys. Rev. A Gen. Phys. 1986, 33, 1134–1140. [Google Scholar] [CrossRef]
  45. Zandi, A.S.; Javidan, M.; Dumont, G.A.; Tafreshi, R. Automated Real-Time Epileptic Seizure Detection in Scalp EEG Recordings Using an Algorithm Based on Wavelet Packet Transform. IEEE Trans. Biomed. Eng. 2010, 57, 1639–1651. [Google Scholar] [CrossRef] [PubMed]
  46. Efron, B.; Tibshirani, R. Bootstrap Methods for Standard Errors, Confidence Intervals, and Other Measures of Statistical Accuracy. Stat. Sci. 1986, 1, 54–75. [Google Scholar] [CrossRef]
  47. Breiman, L. Random Forests. Mach. Learn. 2001, 45, 5–32. [Google Scholar] [CrossRef]
  48. Müller, K.R.; Krauledat, M.; Dornhege, G.; Curio, G.; Blankertz, B. Machine learning techniques for brain-computer interfaces. Biomed. Tech. 2004, 49, 11–22. [Google Scholar]
  49. Deecke, L. Planning, preparation, execution, and imagery of volitional action. Cogn. Brain Res. 1996, 3, 59–64. [Google Scholar] [CrossRef]
  50. Lang, W.; Beisteiner, R.; Lindinger, G.; Deecke, L. Changes of cortical activity when executing learned motor sequences. Exp. Brain Res. 1992, 89, 435–440. [Google Scholar] [CrossRef]
  51. Zhang, W.; Han, X.; Qiu, S.; Li, T.; Chu, C.; Wang, L.; Wang, J.; Zhang, Z.; Wang, R.; Yang, M.; et al. Analysis of Brain Functional Network Based on EEG Signals for Early-Stage Parkinson’s Disease Detection. IEEE Access 2022, 10, 21347–21358. [Google Scholar] [CrossRef]
  52. Pfurtscheller, G.; Stancák, A., Jr.; Neuper, C. Event-related synchronization (ERS) in the alpha band—An electrophysiological correlate of cortical idling: A review. Int. J. Psychophysiol. Off. J. Int. Organ. Psychophysiol. 1996, 24, 39–46. [Google Scholar] [CrossRef]
  53. Buckner, R.L.; Andrews-Hanna, J.R.; Schacter, D.L. The brain’s default network—Anatomy, function, and relevance to disease. In Year in Cognitive Neuroscience 2008; Kingstone, A., Miller, M.B., Eds.; Annals of the New York Academy of Sciences: New York, NY, USA, 2008; Volume 1124, pp. 1–38. [Google Scholar]
  54. Sheline, Y.I.; Price, J.L.; Yan, Z.; Mintun, M.A. Resting-state functional MRI in depression unmasks increased connectivity between networks via the dorsal nexus. Proc. Natl. Acad. Sci. USA 2010, 107, 11020–11025. [Google Scholar] [CrossRef]
  55. Sehatpour, P.; Molholm, S.; Schwartz, T.H.; Mahoney, J.R.; Mehta, A.D.; Javitt, D.C.; Stanton, P.K.; Foxe, J.J. A human intracranial study of long-range oscillatory coherence across a frontal-occipital-hippocampal brain network during visual object processing. Proc. Natl. Acad. Sci. USA 2008, 105, 4399–4404. [Google Scholar] [CrossRef]
  56. Binkofski, F.; Buccino, G.; Posse, S.; Seitz, R.J.; Rizzolatti, G.; Freund, H. A fronto-parietal circuit for object manipulation in man: Evidence from an fMRI-study. Eur. J. Neurosci. 1999, 11, 3276–3286. [Google Scholar] [CrossRef] [PubMed]
  57. Johnson, P.B.; Ferraina, S.; Bianchi, L.; Caminiti, R. Cortical networks for visual reaching: Physiological and anatomical organization of frontal and parietal lobe arm regions. Cereb. Cortex 1996, 6, 102–119. [Google Scholar] [CrossRef] [PubMed]
  58. Culham, J.C.; Valyear, K.F. Human parietal cortex in action. Curr. Opin. Neurobiol. 2006, 16, 205–212. [Google Scholar] [CrossRef] [PubMed]
  59. Graziano, M.S.A.; Taylor, C.S.R.; Moore, T. Complex Movements Evoked by Microstimulation of Precentral Cortex. Neuron 2002, 34, 841–851. [Google Scholar] [CrossRef] [PubMed]
Figure 1. Experimental paradigm.
Electronics 12 03894 g001
Figure 2. Distribution of EEG electrodes.
Electronics 12 03894 g002
Figure 3. Signal preprocessing procedure.
Electronics 12 03894 g003
Figure 4. MRCPs of three types of grasp tasks at electrodes C1, Cz, and C2.
Electronics 12 03894 g004
Figure 5. Differences in MRCPs among the three tasks.
Electronics 12 03894 g005
Figure 6. ERD(S) of three types of grasp tasks at electrodes C1, Cz, and C2.
Electronics 12 03894 g006
Figure 7. Differences in ERD(S) among the three tasks.
Electronics 12 03894 g007
Figure 8. The dynamics of coupling strength during three types of grasp tasks, with (a) representing the alpha band (8–13 Hz) and (b) corresponding to the beta band (20–30 Hz).
Electronics 12 03894 g008
Figure 9. Differences in coupling strength among the three tasks. with (a) representing the 13 motor periods and (b) corresponding to t on brain regions.
Electronics 12 03894 g009
Figure 10. Confusion matrix for three types of grasp tasks.
Electronics 12 03894 g010
Table 1. Distribution of electrodes in each brain region.
Cortical locationChannels
Left frontal area (LF)F3, FFC3h
Middle frontal area (MF)F1, FZ, F2, FFC1h, FFC2h
Right frontal area (RF)F4, FFC4h
Left central area (LC)FC5, FC3, FCC5h, FCC3h, C5, C3, CCP5h, CCP3h, CP5, CP3
Middle central area (MC)FC1, FCz, FC2, FCC1h, FCC2h, C1, Cz, C2, CCP1h, CCP2h, CP1, CPz, CP2
Right central area (RC)FC4, FC6, FCC4h, FCC6h, C4, C6, CCP4h, CCP6h, CP4, CP6
Left parietal area (LP)CPP5h, CPP3h, P5, P3
Middle parietal area (MP)CPP1h, CPP2h, Pz, P1, P2
Right parietal area (RP)CPP4h, CPP6h, P4, P6
Occipital area (O)PPO1h, PPO2h, POz
Table 2. Classification results for eight subjects.
SubjectPalmar (%)Lateral (%)Rest (%)AVG (%)
G0178.5760.00100.0079.52
G0285.7178.5792.8685.71
G0378.5778.5792.8683.33
G0485.7166.6792.8681.75
G0585.7178.57100.0088.09
G0671.4373.33100.0081.59
G0760.0071.43100.0077.14
G0863.6463.6491.6772.98
STD9.526.813.744.47
Disclaimer/Publisher’s Note: The statements, opinions and data contained in all publications are solely those of the individual author(s) and contributor(s) and not of MDPI and/or the editor(s). MDPI and/or the editor(s) disclaim responsibility for any injury to people or property resulting from any ideas, methods, instructions or products referred to in the content.