Article

Vulnerable Area Identification of Islanded Combined Electrical and Heat Networks Based on Static Sensitivity Analysis

1
School of Electrical Engineering, Guangxi University, Nanning 530004, China
2
Guangxi Power Grid Co., Ltd., Nanning 530023, China
*
Author to whom correspondence should be addressed.
Electronics 2023, 12(18), 3936; https://doi.org/10.3390/electronics12183936
Submission received: 17 August 2023 / Revised: 11 September 2023 / Accepted: 15 September 2023 / Published: 18 September 2023
(This article belongs to the Section Systems & Control Engineering)

Abstract

:
In combined electrical and heat networks (CEHNs) under the Islanded mode, the district heating network (DHN) is more vulnerable to fluctuations in the electrical load, resulting in the transgression of the CHEN power flow. Identifying vulnerable areas in islanded CEHNs is necessary. In this paper, we introduce a static sensitivity analysis method into islanded CHENs, which can identify vulnerable areas susceptible to these impacts, and explore the energy interaction mechanisms between the electrical network (EN) and DHN. We established a power flow model of the islanded CEHN, and developed the sensitivity matrix. Then, the decomposition model is solved, based on which the static sensitivity matrices can be calculated. The case study shows that the sensitivity can effectively represent the impact of EN load changes on the mass flow rate of the DHN, thus we can locate the weak areas of the CEHN. It can provide auxiliary information for the safe and stable operation of an islanded CEHN, with fewer calculations compared to the power flow calculation method. In addition, the results present the enhancement of islanded CHEN stability by using a kind of combination of CHP units.

1. Introduction

Traditional fossil fuels are facing the problems of depletion and environmental pollution, and to alleviate this problem, the integrated energy system (IES) can improve the utilization of energy by unified planning, design, and operation optimization of multiple energy sources such as electricity, gas, and heat [1,2,3]. Therefore, IESs have been rapidly developed in various countries and regions in recent years and are one of the popular research areas at the intersection of electrical engineering, energy, thermal, and low carbon economy [4,5,6,7]. However, due to the integration of multiple energy systems in the IES, disturbances in one subsystem have the potential to be transmitted to other subsystems via the coupling elements, thereby resulting in an impact on this system. The impact may in turn affect the original system and transfer the disturbance to the whole IES. The uncoupled elements affect the other systems through the coupling elements [8]. When a vulnerable area is disturbed, the degree of system state change is greater, or the influence of disturbances from other subsystems is more significant. Therefore, when the IES faces load fluctuations or disturbances, it is necessary to identify the disturbed areas that are more significantly affected and cause greater impacts, in order to strengthen the stability of vulnerable areas and the whole system.
The combined electrical and heat network (CEHN) is one of the most widely used IESs, and it is an vital application scenario and carrier for realizing a high percentage of renewable energy to the grid in the future, which has been widely studied by scholars from various countries in recent years [9,10,11,12]. CEHNs are generally coupled to the electrical network (EN) and the district heating network (DHN) through combined heat and power (CHP) units, and transfer of energy between ENs and DHNs through power to heat (P2H) devices (heat pumps, electric boilers, etc.).
There are two common modes of operation for CEHNs: grid-connected operation mode and islanded operation mode. In grid-connected mode, the slack node of the EN is connected to the large power grid, and when loads of the electrical or heat networks change, the power can be regulated through the large grid, so it is easier for the CEHN to operate stably in grid-connected mode; In islanded mode, the EN is no longer connected to the large grid, and the power of the CEHN is provided by only one or more CHP units, and when there are changes in the load of the EN or DHN, it can lead to significant changes in the system state or result in excessive power flow in the CEHN [13,14].
For integrated energy system modeling and power flow calculations, a modeling method for separate thermal networks was proposed and validated in [15]. A hydraulic steady-state model of the DHN was developed in [16]. In [13], a model for combined analysis of DHNs and ENs was developed, and a unified and decomposed power flow calculation method for CEHNs was proposed. In [17], an integrated framework based on the Newton–Raphson method was proposed to perform a unified steady-state power flow analysis to solve the current operating state of an integrated energy network containing electricity, heat, and gas.
The case study in [18] shows that lower reliability in hybrid combined cooling, heating, and power (CCHP) systems leads to more energy and greenhouse gas reduction benefits. Complex coupling relationships in IESs also lead to more system safety issues. It is necessary to identify vulnerable areas in IESs. The identification of vulnerabilities in power systems and IES has also been studied by methods such as graph theory, energy hubs, and random matrix theory. Ref. [19] presented a new graph theoretic approach for quickly identifying the power transfer capability of a line when multiple component outages occur in rapid succession. Ref. [20] proposed a methodology for MES reliability and vulnerability assessment based on the energy hub model and utilizes Multi-parametric linear programming with a self-adaptive critical region set to reduce the computation of the iteration, which is suitable for calculating the functional reliability of system components. Ref. [21] proposed a weak node identification method based on random matrix theory, and establishes an IES weak node identification model based on entropy theory, which is suitable for identifying nodes that have a large impact on the system state.
Sensitivity analysis is a method for studying and analyzing the sensitivity of changes in the state or output of a system (or model) to changes in system parameters or surrounding conditions. In recent years, many studies have used sensitivity analysis methods to power systems and integrated energy systems. In [22], Monte Carlo simulation is used for probabilistic power system reliability assessment and a sensitivity analysis is used to assess the reasonable capacity of a multi-energy storage system in power systems. Ref. [23] analyzed the impact of energy coupling unit capacity on wind power consumption based on the sensitivity matrix. Ref. [24] proposed a regional energy system uncertainty and sensitivity analysis methodology to identify the uncertainties introduced by various renewable energy sources during the optimization of the district energy system. In [25], sensitivity analysis and scenario analysis of the stand-alone hybrid energy system for a typical rural village in northwest China were conducted to demonstrate the influences of changing and uncertain environmental policies on total system cost and performance. Ref. [26] proposed an event-triggered-based distributed algorithm with some desirable features, which is suitable for the issues of day-ahead and real-time cooperative energy management for multi-energy systems formed by many energy bodies.
Most of the current studies of sensitivity analysis for IESs focus on system optimization. However, there have been some studies using sensitivity for system state estimation of IESs: [27] introduced the Power Transfer Distribution Factors from power system analysis into IES, which greatly speeds up the estimation of the overall state of the system after a power change in a coupled unit compared to power flow calculations. In [28], a static sensitivity analysis of power system voltages was performed, and the weak buses of power systems could be quickly identified. In [29], the electricity–gas coupled system was analyzed by a sensitivity method, and the interaction between the power system and the natural gas system was analyzed.
In this paper, we use the islanded CEHN as a scenario and focus on the impact of EN load changes on the power flow of the DHN to identify the areas of the CEHN that are more vulnerable to the impact of EN load changes. In addition, we investigate the coupling and interaction mechanisms between ENs and DHNs of the CEHN in the islanded mode, and study the connection and change mechanisms between physical parameters of different systems. Meanwhile, we investigate the vulnerability of different combinations of CHP units of the system.

2. CEHN Model

A CEHN generally consists of an EN, a DHN, and coupling elements. The coupling elements realize the energy conversion and coupling between the EN and the DHN. The coupling elements in the DHN are generally combined heat and power (CHP) units, electric boilers, heat pumps, circulating water pumps, and other elements.

2.1. EN Model

For an EN with n nodes, the polar form of the AC power flow model is expressed as:
P i = V i j = 1 n V j ( G i j c o s θ i j + B i j s i n θ i j ) Q i = V i j = 1 n V j ( G i j s i n θ i j B i j c o s θ i j )
P i = P i , s o u r c e P i , l o a d Q i = Q i , s o u r c e Q i , l o a d
where P i is the active power injection of node i ;   Q i is the reactive power injection of node i ;   V i and V j are the node voltages of node i and node j ; G i j and B i j are the real and imaginary parts of the branch admittance between node i and node j ; θ i j is the phase angle difference between node i and node j ; P i , s o u r c e and Q i , s o u r c e are the active and reactive power generated by the power source connected to node i ; P i , l o a d and Q i , l o a d are the active and reactive power consumed by the electrical load connected to node i .

2.2. DHN Model

The steady-state model of the DHN is divided into the hydraulic model and the thermal model.

2.2.1. Hydraulic Model

The Equation (3) continuity of flow, the Equation (4) loop pressure equation and the Equation (5) head loss equation are analogous to the Kirchhoff’s current law, Kirchhoff’s voltage law and Ohm’s law in the EN [30].
A h m ˙ = m ˙ q
B h h f = 0
h f = K h m ˙ m ˙
where A h is the network incidence matrix; m ˙ is the mass flow rate within each pipe; m ˙ q is the mass flow rate injected into each node; B h is the loop incidence matrix; h f is the head losses; K h is the resistance coefficients of each pipe [31].

2.2.2. Thermal Model

The formulas for calculating the node heat power in relation to the node temperature and the node mass flow rate are as follows:
Φ = c p m ˙ q T S T o
where Φ is the heat power of the node; T S and T o are the supply temperature and return temperature of the node; c p is the specific heat of water, c p = 4.182 × 10 3 M J · k g 1 · 1 .
With a known pipe inlet temperature, the pipe outlet temperature is calculated by using the pipe temperature drop equation:
T e n d = ( T s t a r t T a ) e λ L c p m ˙ + T a
where T s t a r t and T e n d are the temperatures at the start node and the end node of the pipe; T a is the ambient temperature; λ is the heat transfer coefficient of the pipe; L is the length of the pipe.
The temperature calculation formula for the intersection of multiple thermal pipe is as follows:
m ˙ o u t T m = m ˙ i n T i n
where m ˙ o u t and m ˙ i n are the mass flow rates out of and into a node; T m and T i n are the mixed temperature at the node and the temperature at the end of the pipe flowing into the node.

2.3. Combined Heat and Power Units

The coupling elements realize the energy conversion and coupling between the EN and the DHN. In this section, we will introduce a coupling element: CHP units. Gas turbines and condensing steam turbines are two common types of CHP units.
Gas turbines have a fixed heat-to-electric ratio, which means that the ratio between their heat output power and electrical output power remains constant. The heat-to-electric ratio can be expressed as:
c m = Φ C H P P C H P
where c m is the heat-to-electric ratio of the CHP unit; Φ C H P is the heat output power of the CHP unit; P C H P is the electrical output power of the CHP unit.
For a condensing steam turbine with extraction, the relationship between heat power and electrical power is as follows:
Z = Φ C H P Φ c o n P c o n P C H P
where Φ c o n and P c o n are the heat power and electrical power generation of the extraction unit in full condensing mode.
The ratio properties of the gas turbines and condensing steam turbines between heat power and electrical power are contrary. Simultaneously using both types of CHP units in an islanded CEHN will enhance the stability of the system when the fluctuations occur. We will verify it in Section 5.3.

3. Static Sensitivity Matrix of the Islanded CEHN

When there is concentrated large-scale electricity consumption, the power demand of the EN increases significantly. In islanded mode, all the additional power demand are supplied by CHP units. As a result, the changes in the electrical load will affect the DHN power flow through the CHP units. Sensitivity can reflect the extent to which changes in the electrical load impact the DHN power flow. In this paper, we only investigate the static power flow changes in the system, which means that the mutual influence between the DHN and the EN is considered only from the perspective of energy interaction. Therefore, the dynamic characteristics of the DHN and the EN are not taken into account, and it is assumed that the output power adjustment time of the CHP units is within seconds.
The generic expression for static sensitivity is [29]:
d x d u = F x 1 F u
For the static sensitivity method in this article, x is the mass flow rate of pipes in the DHN, and u is the injected active power at nodes in the EN, d x / d u is the magnitude of the static sensitivity of the mass flow rate of pipes to the injected active power at nodes. Its value indicates the degree to which the injected active power at nodes in the EN affects the mass flow rate of pipes in the DHN through the energy transfer of coupling elements.
According to Equation (11), the static sensitivity matrix S h e of the mass flow rate of pipes to the injected active power at nodes is:
S h e = m ˙ P s p = c m · S h · S e
S h = m ˙ Φ C H P 1 ;   S e = P C H P 1 P s p ;   c m = Φ C H P 1 P C H P 1
where S h is static sensitivity matrix of the pipe mass flow rate to the CHP unit heat power, and S e is the static sensitivity matrix of the CHP unit electrical power to the node injected power; P s p is the injected active power at nodes in the EN; P C H P 1 and Φ C H P 1 are the electrical power and heat power of CHP unit 1 at the DHN slack node; c m is the heat-to-electric ratio of CHP unit 1. s i j h e is the element in the i -th row and j -th column of S h e , which represents the degree to which the injected power at EN node i ( i   = 1, 2, …,   n e ) affects the mass flow rate of DHN pipe j ( j   = 1, 2, …, n h ).
For the DHN, the inverse of its Jacobian matrix J h 1 is:
J h 1 = J 11 J 12 J 21 J 22 = m ˙ Φ T Φ m ˙ T T T
According to Equations (13) and (14), S h is the column of elements in J 11 that is related to CHP unit on the DHN slack node.
For the EN, according to the conservation equation of active power, when there is a change in the injected active power at a certain node, there is:
P C H P 1 + P C H P 2 = k = 2 n e P s p + P l o s s
where P l o s s is the loss of the EN.
For Equation (9), when the load at node i in the EN changes, the injected electrical power at all nodes except node i will remain unchanged. Therefore, the partial derivative of P i s p is:
P C H P 1 P i s p + P C H P 2 P i s p = 1 + P l o s s P i s p
where P l o s s / P i s p is the incremental transmission loss [32]. The incremental transmission loss can be solved by combining Equations (17) and (18), and the inverse matrix of the Jacobi matrix in the form of the polar coordinates of the EN [32].
P l o s s P s p = θ P s p   V P s p P l o s s θ   P l o s s P l o s s T
P l o s s θ k = 2 j = 1 n e G j k V j V k sin θ j k P l o s s V k = 2 j = 1 n e G j k V k sin θ j k
The P C H P 2 / P i s p in Equation (16) can be computed by using Equations (19) and (20).
P C H P 2 P s p = P C H P 2 Φ C H P 2 · Φ C H P 2 P s p
Φ C H P 2 P s p = Φ C H P 2 Φ C H P 1 · Φ C H P 1 P C H P 1 · P C H P 1 P s p
According to the heat power conservation law, the heat power in the system is conserved. When Φ C H P 1 increases, Φ C H P 2 must decrease. Therefore, it can be approximately assumed that Φ C H P 1 / P C H P 1 = 1 .
According to Equations (9) and (16)–(18), S e can be represented as:
S e = 1 c m 1 1 c m 2 1 · 1 + P l o s s P s p
where c m 1 is the heat-to-power ratio of the CHP unit 1 at the DHN slack node, and c m 2 is the heat-to-power ratio of the CHP unit 2 at the EN slack node.
When CHP unit 2 is condensing steam turbine, S e can be represented as:
S e = 1 c m 1 1 Z 1 · 1 + P l o s s P s p
where Z is the heat-to-power ratio of the condensing steam turbine.

4. The Power Flow Calculation Method for Islanded CEHN

4.1. Decomposition Power Flow Models of EN and DHN

The most commonly used method for solving the power flow in IESs is the Newton–Raphson method [33,34,35]. Depending on the solving approach, it can be further categorized into the unified and the decomposed solving method. The unified solving method is a method of solving all subsystem models together, which has good convergence properties. However, the drawback is that when the system size becomes large, the dimension of the Jacobian matrix is high, resulting in a long computation time. The decomposed solving method is a method of solving each subsystem separately, resulting in a relatively shorter computation time and being more suitable for power flow calculation in dual-system scenarios. This paper will mainly focus on the decomposed solving method.
When we solve the power flow model by the Newton–Raphson method, the iteration formula is as follows:
x i + 1 = x i J i 1 F
where i is the iteration number; F is the deviation vector; x i is the state variables for the i -th iteration.
The equations for F h in a DHN is:
F h = Φ p T s T r = c p A h m ˙ T S T o Φ s p B h K h m ˙ m ˙ A s T s , l o a d b s A r T r , l o a d b r
where Φ , p , T s , and T r are the deviation vectors for heat power, circuit pressure drop, supply temperature, and return temperature; T s = T s T a , T r = T r T a , where T a is the ambient temperature; Φ s p is the given heat power in the system; T s , l o a d and T r , l o a d are the deviation vectors for supply temperature and return temperature at the load nodes; A s and A r are matrices related to the structure and the pipe power flow of the supply and return networks [14]; b s and b r are column vectors related to the supply and return temperatures. The calculation methods can be found in reference [14].   x is the state variable, x = m ˙ , T s , l o a d , T r , l o a d T .
The equations for F e in an EN is:
F e = P Q = P s p R e a l V Y V * Q s p I m a g V Y V *
where P and Q are the deviation vectors for active power and reactive power in the EN; P s p and Q s p are the given values for active power and reactive power in the EN; V is the voltage vector; Y is the admittance matrix.
The process of decomposed load flow calculation is shown in Algorithm 1. Node 1, where CHP Unit 1 is located, is the DHN slack node, and node 2, where CHP Unit 2 is located, is the EN slack node.
Algorithm 1 Islanded CEHN power flow calculation
Input:
EN: Network topology; Line impedance; Known active power, reactive power, voltage magnitude and voltage phase angle.
DHN: Network topology; Pipe length, diameter, and roughness; Known heat power; Supply temperature of the source and return temperature of the load
Output:
EN: Voltage magnitude and voltage phase angle; Jacobian matrix.
DHN: Pipe mass flow rate; Supply temperature and return temperature; Jacobian matrix.
Initialize variables
While   M a x ( Φ C H P 2 ) > ε do
While   M a x ( F h , T s , T r ) > ε do
       Calculation of hydraulic vector of mismatches
       Calculation of hydro-thermal Jacobi matrix
       Update pipe mass flow rate
       Calculation of nodal supply and return temperatures
  Calculation of heat power of CHP unit 1
  Calculation of electrical power of CHP unit 1
While   M a x ( F e ) > ε do
       Calculation of electrical vector of mismatches
       Calculation of electrical Jacobi matrix
       Update voltage magnitude and voltage phase angle
  Calculation of electrical power of CHP unit 2
  Calculation of heat power of CHP unit 2
Output data
In grid-connected mode, if we use the decomposition method for solving, the DHN power flow is solved first. The calculated heat power is then converted into electrical power through coupling elements, which is subsequently incorporated into the EN model for solving, thereby completing the solution. In islanded mode, after we have calculated the electrical power flow data of the EN, the results need to be re-introduced into the thermal model for the next solution until the calculated data error are sufficiently small.

4.2. Combined Heat and Power Units

For s i j h e in S h e , the larger its value, the greater the impact of the electrical power variation at EN node i ( i = 1 , 2 ,   n e ) on the mass flow rate of the DHN pipe j ( j = 1 , 2 , , n h ) . The pipes with higher sensitivity are more prone to exceed the boundary of flow constraint when there is a sudden increase in electrical loads. Therefore, the pipes with larger sensitivity can be defined as the vulnerable areas in the system.
The steps for the vulnerable area identification of an islanded CEHN are as follows:
Step 1: Input the network topology and parameters of the CEHN, and solve the CEHN power flow by using decomposition method.
Step 2: Calculate S h based on Equations (13) and (14).
Step 3: Calculate S e based on Equations (19)–(21).
Step 4: Calculate S h e based on Equation (21) or (22).
Step 5: Compare the elements in S h e . The pipes and nodes with higher sensitivity values indicate that these areas are more vulnerable.

5. Case Study

5.1. Introduction of the Network

The network of Barry Island is a typical case of Islanded CEHNs [13]. The structure of Barry Island is shown in Figure 1, which consists of a DHN with 32 nodes and an EN with 9 nodes, coupled through 3 CHP units.
The parameters of the EN and the DHN are in [14,36,37]. The return water network of the DHN is the same as the supply water network, and it is not shown separately in the figure. Node h32 is the slack node for the DHN, and node e9 is the slack node for the EN.
The CHP unit 3 is a gas turbine that produces constant electrical and heat power. It is connected to the fixed heat power node h31 in the DHN and the PV node e5 in the EN. The CHP unit 1 is connected to the slack node e9 in the EN and the fixed heat power node h30 in the DHN. The CHP unit 2 is connected to the slack node h32 in the DHN and the PV node e8 in the EN.
Table 1 is the CEHN voltage data of Barry Island and Table 2 is the DHN power flow data of Barry Island. Table A1 and Table A2 in Appendix A are the DHN and the EN Jacobian matrix of Barry Island. Table A3 shows some parameters in CHP units. Table A4 and Table A5 in Appendix B are the electrical and heating loads.

5.2. Calculation and Analysis of the Static Sensitivity

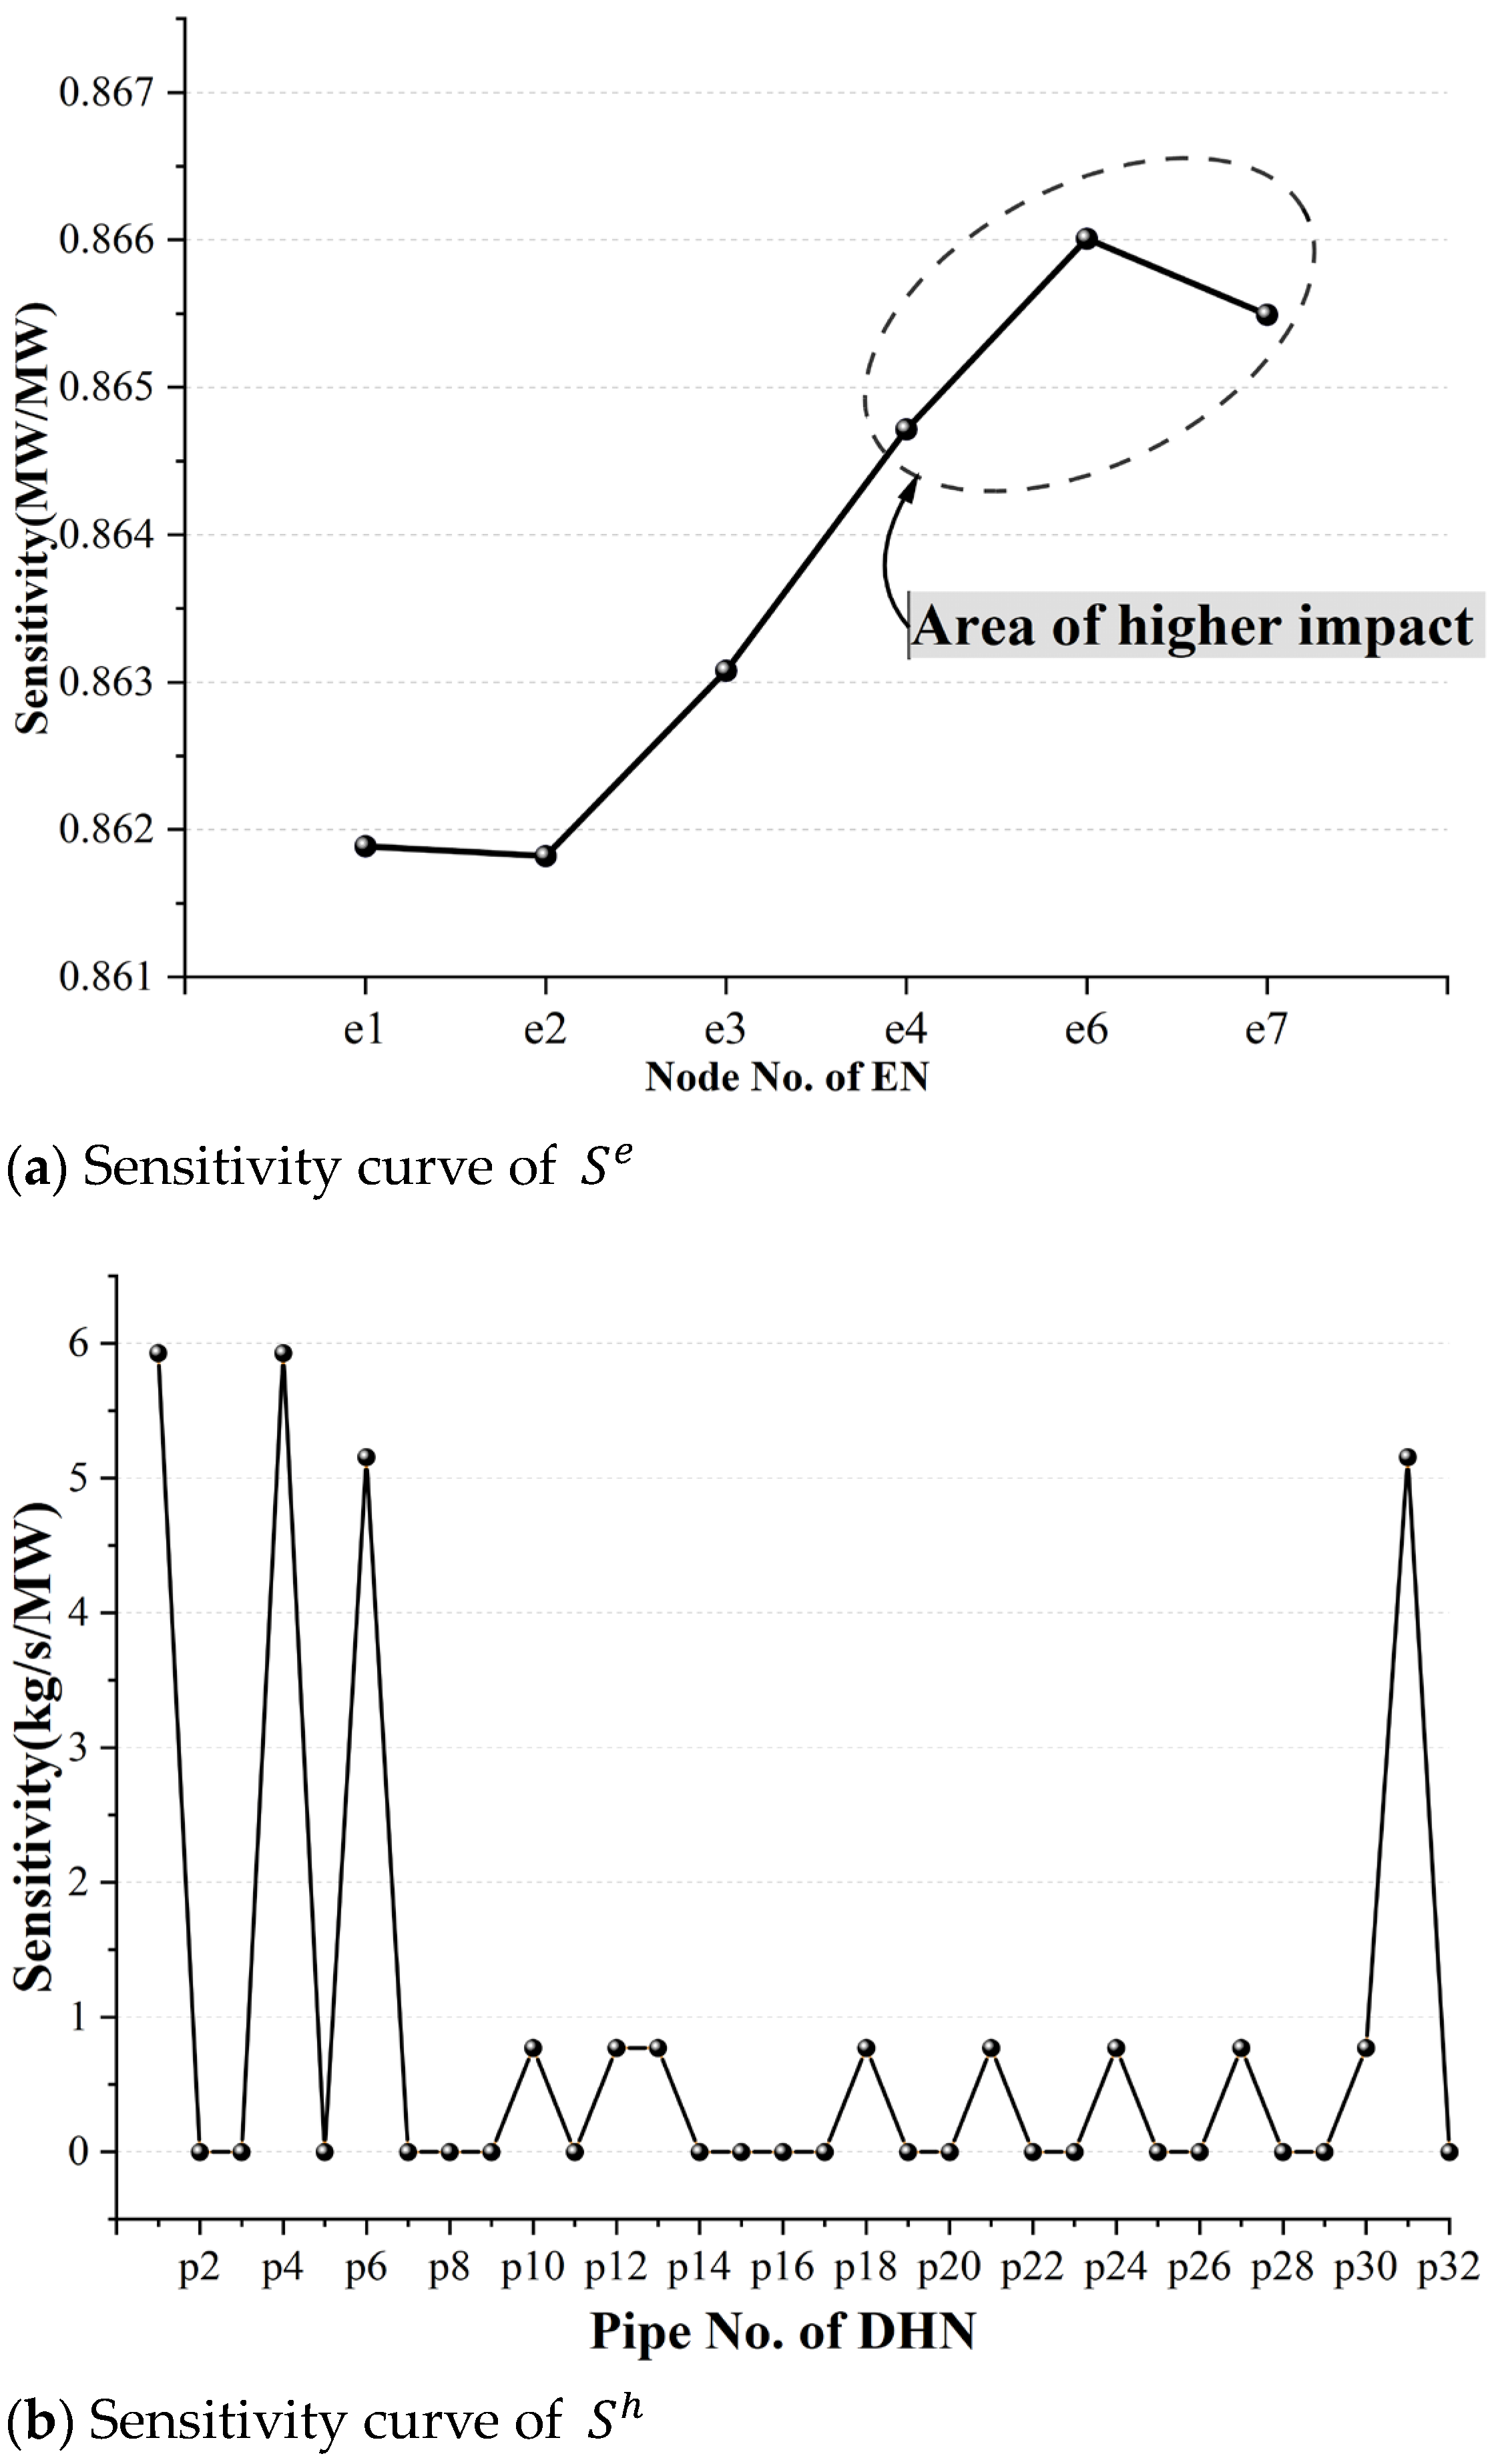
The sensitivity curve of S e is shown in Figure 2a. The sensitivity of node e6 is the highest, reaching 0.8667, indicating that the variation in injection power at node e6 of the EN has the greatest impact on the electrical power of the CHP unit at the EN slack node. According to Figure 2a, the values of the sensitivity of several nodes in the EN are similar, indicating that the effect of load changes on the electrical power of the CHP unit is approximately the same for each node. It shows that under the EN of Barry Island, the changes in the system loss caused by load variations at different nodes are small. The sensitivity of nodes e4, e6, and e7 in the EN are relatively large. It suggests that these nodes are relatively vulnerable areas in the EN.
The sensitivity curve of S h is shown in Figure 2b. The sensitivity of pipes p1, p4, p6, and p31 are higher, indicating that variations in CHP heat power have a significant impact on the mass flow rates in these pipes.
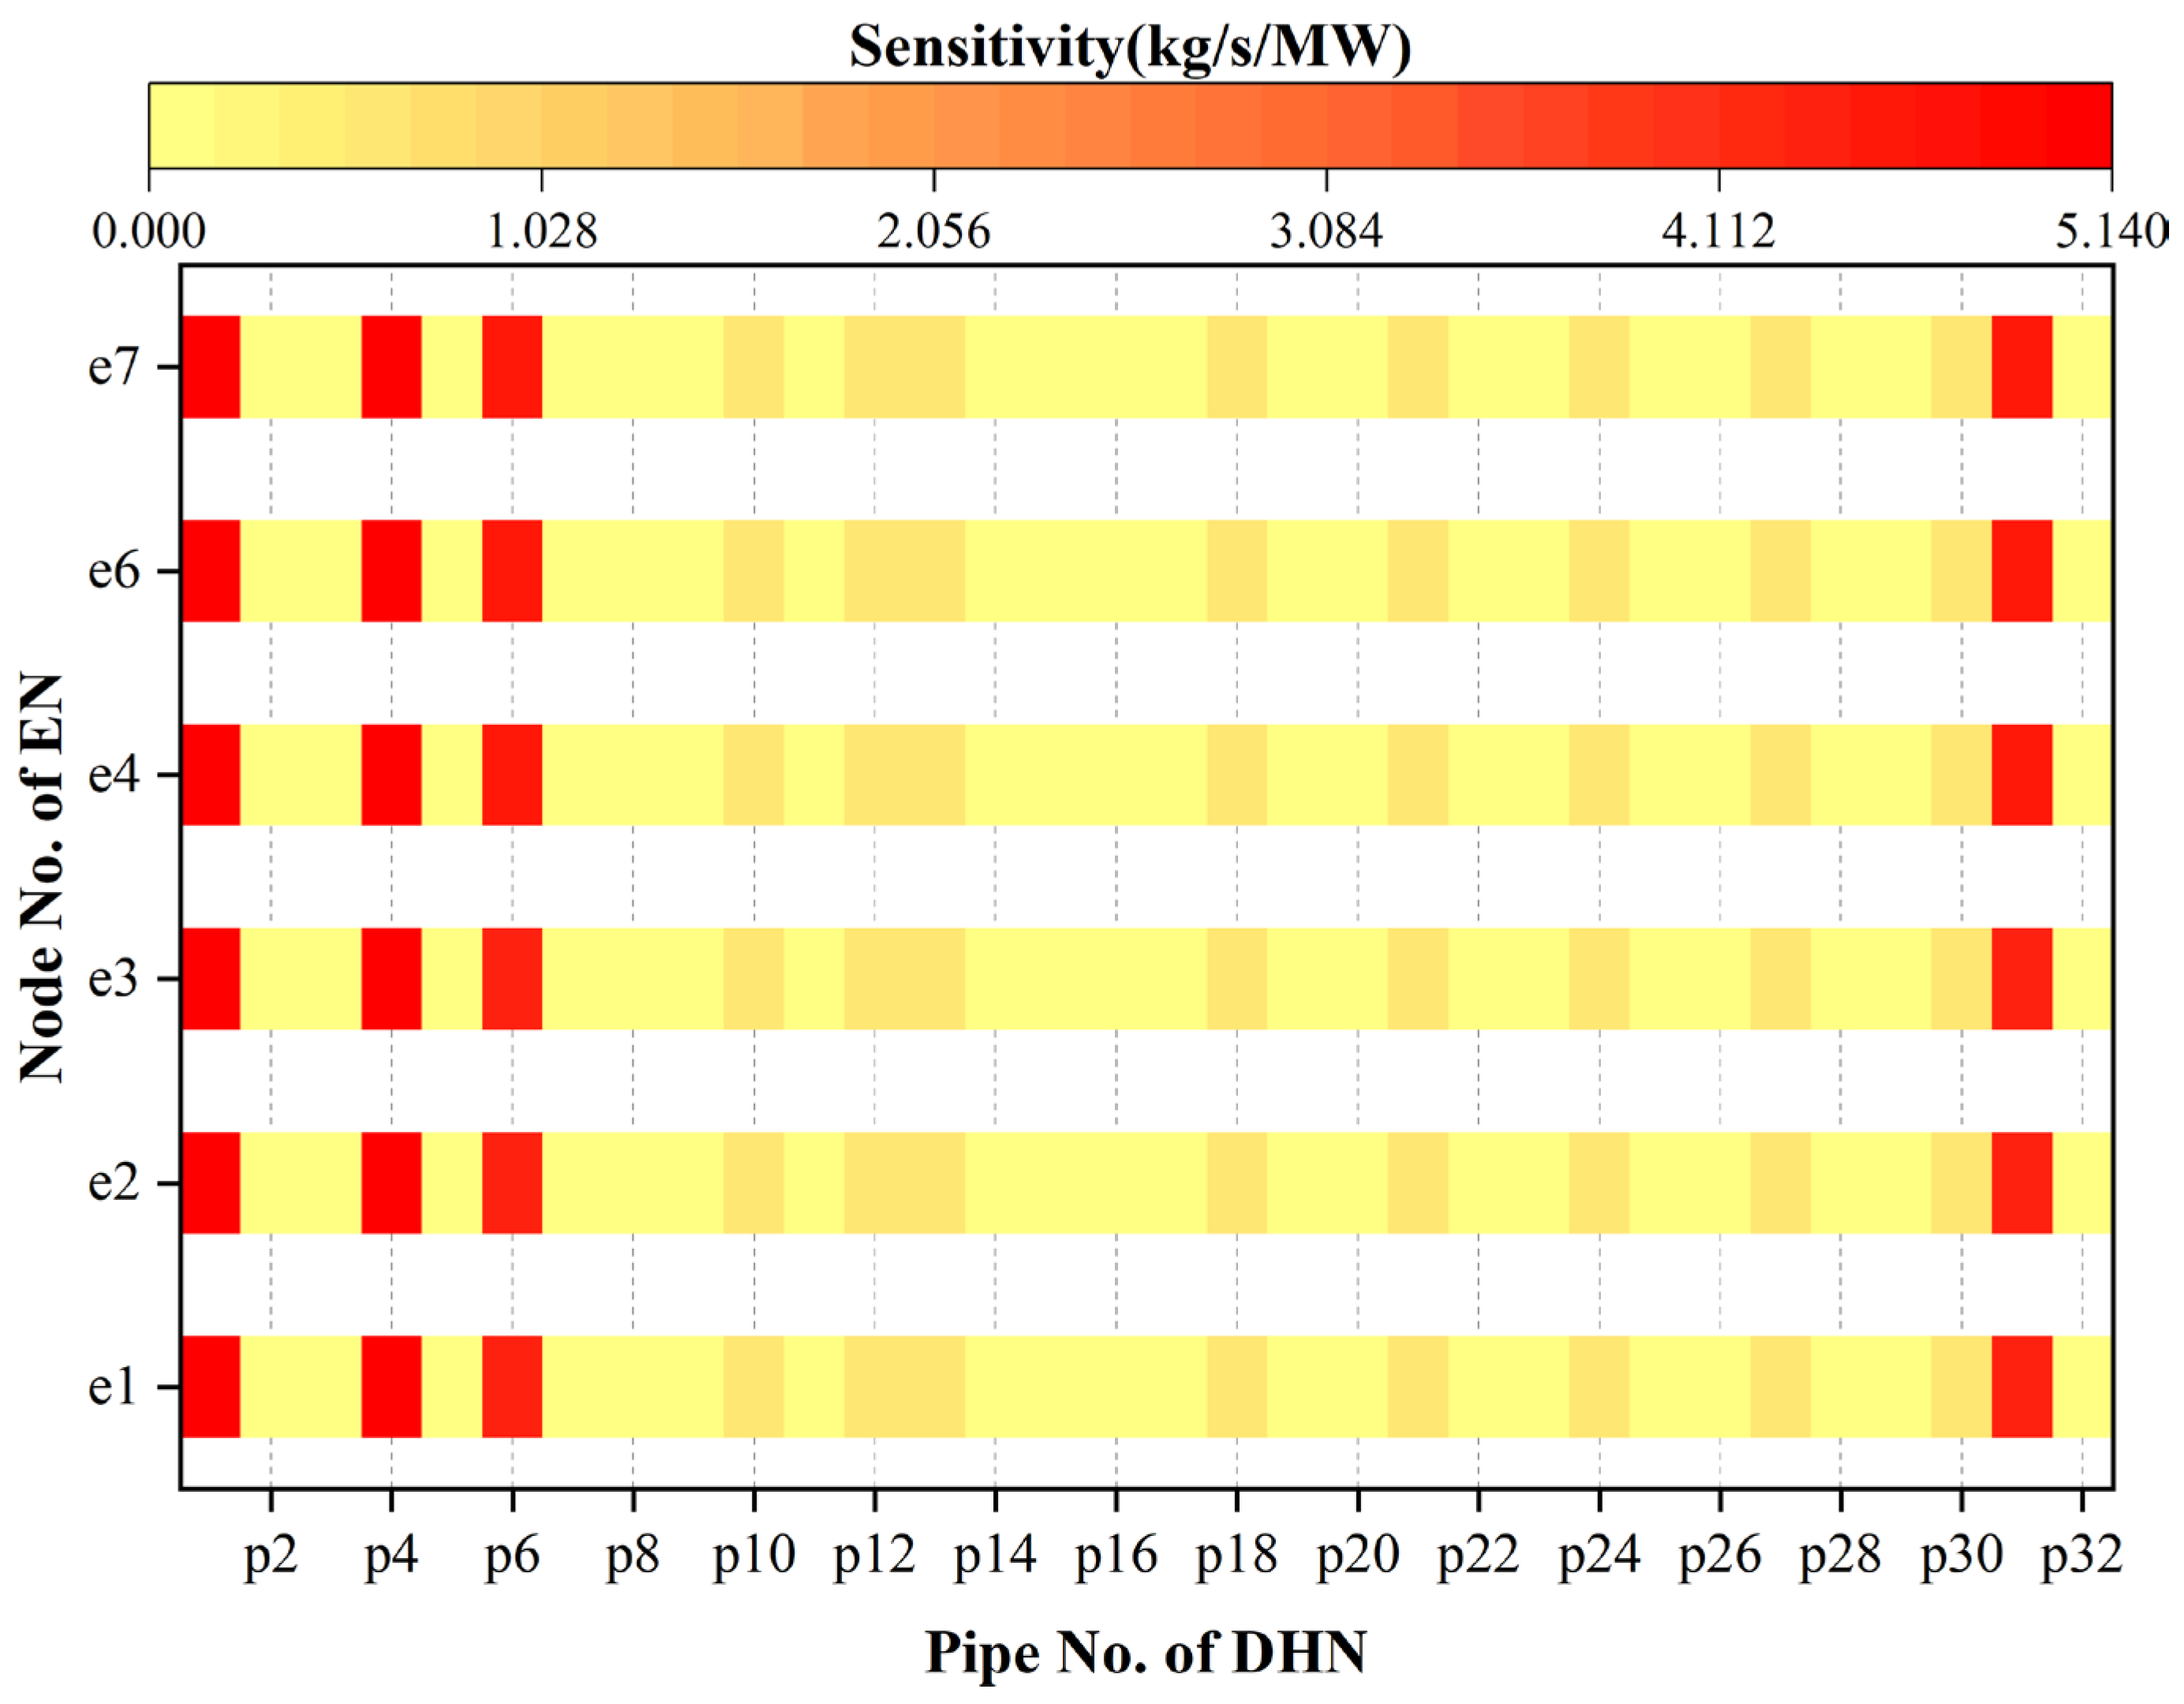
Figure 3 is the sensitivity heat map of S h e , where the y-axis represents the sensitivity of the mass flow rates in the DHN pipes to the changes of the electrical loads. In Figure 3, the values for the DHN pipes p1, p4, p6, and p31 are relatively high, indicating that these pipes in the CEHN are vulnerable areas. They are prone to exceed the boundary of system mass flow rate constraint, therefore require special attention and protection.
To validate the effectiveness of the proposed method, we use the decomposition method to calculate the mass flow rates with the electrical loads increased by 10%, 20%, 30%, 40%, and 50%. The results are shown in Figure 4. The mass flow rates in pipes p1 and p4 have reversed direction, while the mass flow rate in pipe p31 has exceeded the boundary, and the mass flow rate in pipe p6 is close to the boundary. It can be observed that the mass flow rates in these pipes are most affected by the variation in electrical loads and exceed the boundary of the system mass flow rates constraint first. The static sensitivity calculation is consistent with the actual situation and accurately reflects the vulnerable areas of the islanded CEHN.
In addition, if we use the method of power flow calculation to identify the vulnerable area of CHEN, we need to carry out the process of power flow calculation six times under different electrical load conditions to identify the four most vulnerable pipes when the electrical load is increased by 10% each time during each calculation. However, if we use the sensitivity method, we only need one power flow calculation and one sensitivity calculation without iteration, which can reduce the calculation.
The total time for six power flow calculations and the time for one sensitivity calculation in the same experimental environment and network are shown in Table 3. (The times in the table are the average of twenty calculations).
The time for sensitivity calculation is much less than the time for power flow calculation, indicating that the sensitivity method saves much computation.

5.3. Stability Enhancement Effect of Simultaneous Use of Different Types of CHP Units in an Islanded CEHN

According to Section 2.2, the CHP units that simultaneously use gas turbines and condensing steam turbines in islanded CEHNs can enhance the stability of the system. In this section, we will compare and discuss two different scenarios. In scenario 1, the gas turbine at the slack node of the EN determines the heat power based on the electrical power, while the condensing steam turbine at the slack node for the DHN determines the electrical power based on the heat power. In scenario 2, both the slack node of the EN and the slack node of the DHN use gas turbines. Similarly, at the slack node of the EN, the heat power is determined by the electric power, while at the slack node of the DHN, the electric power is determined by the heat power. The structure of scenario 1 and scenario 2 are shown in Figure 5.
The heat-to-electricity ratios of scenario 1 and scenario 2 is shown in Table 4. Both scenarios operate under the same initial parameters of the Barry Island system.
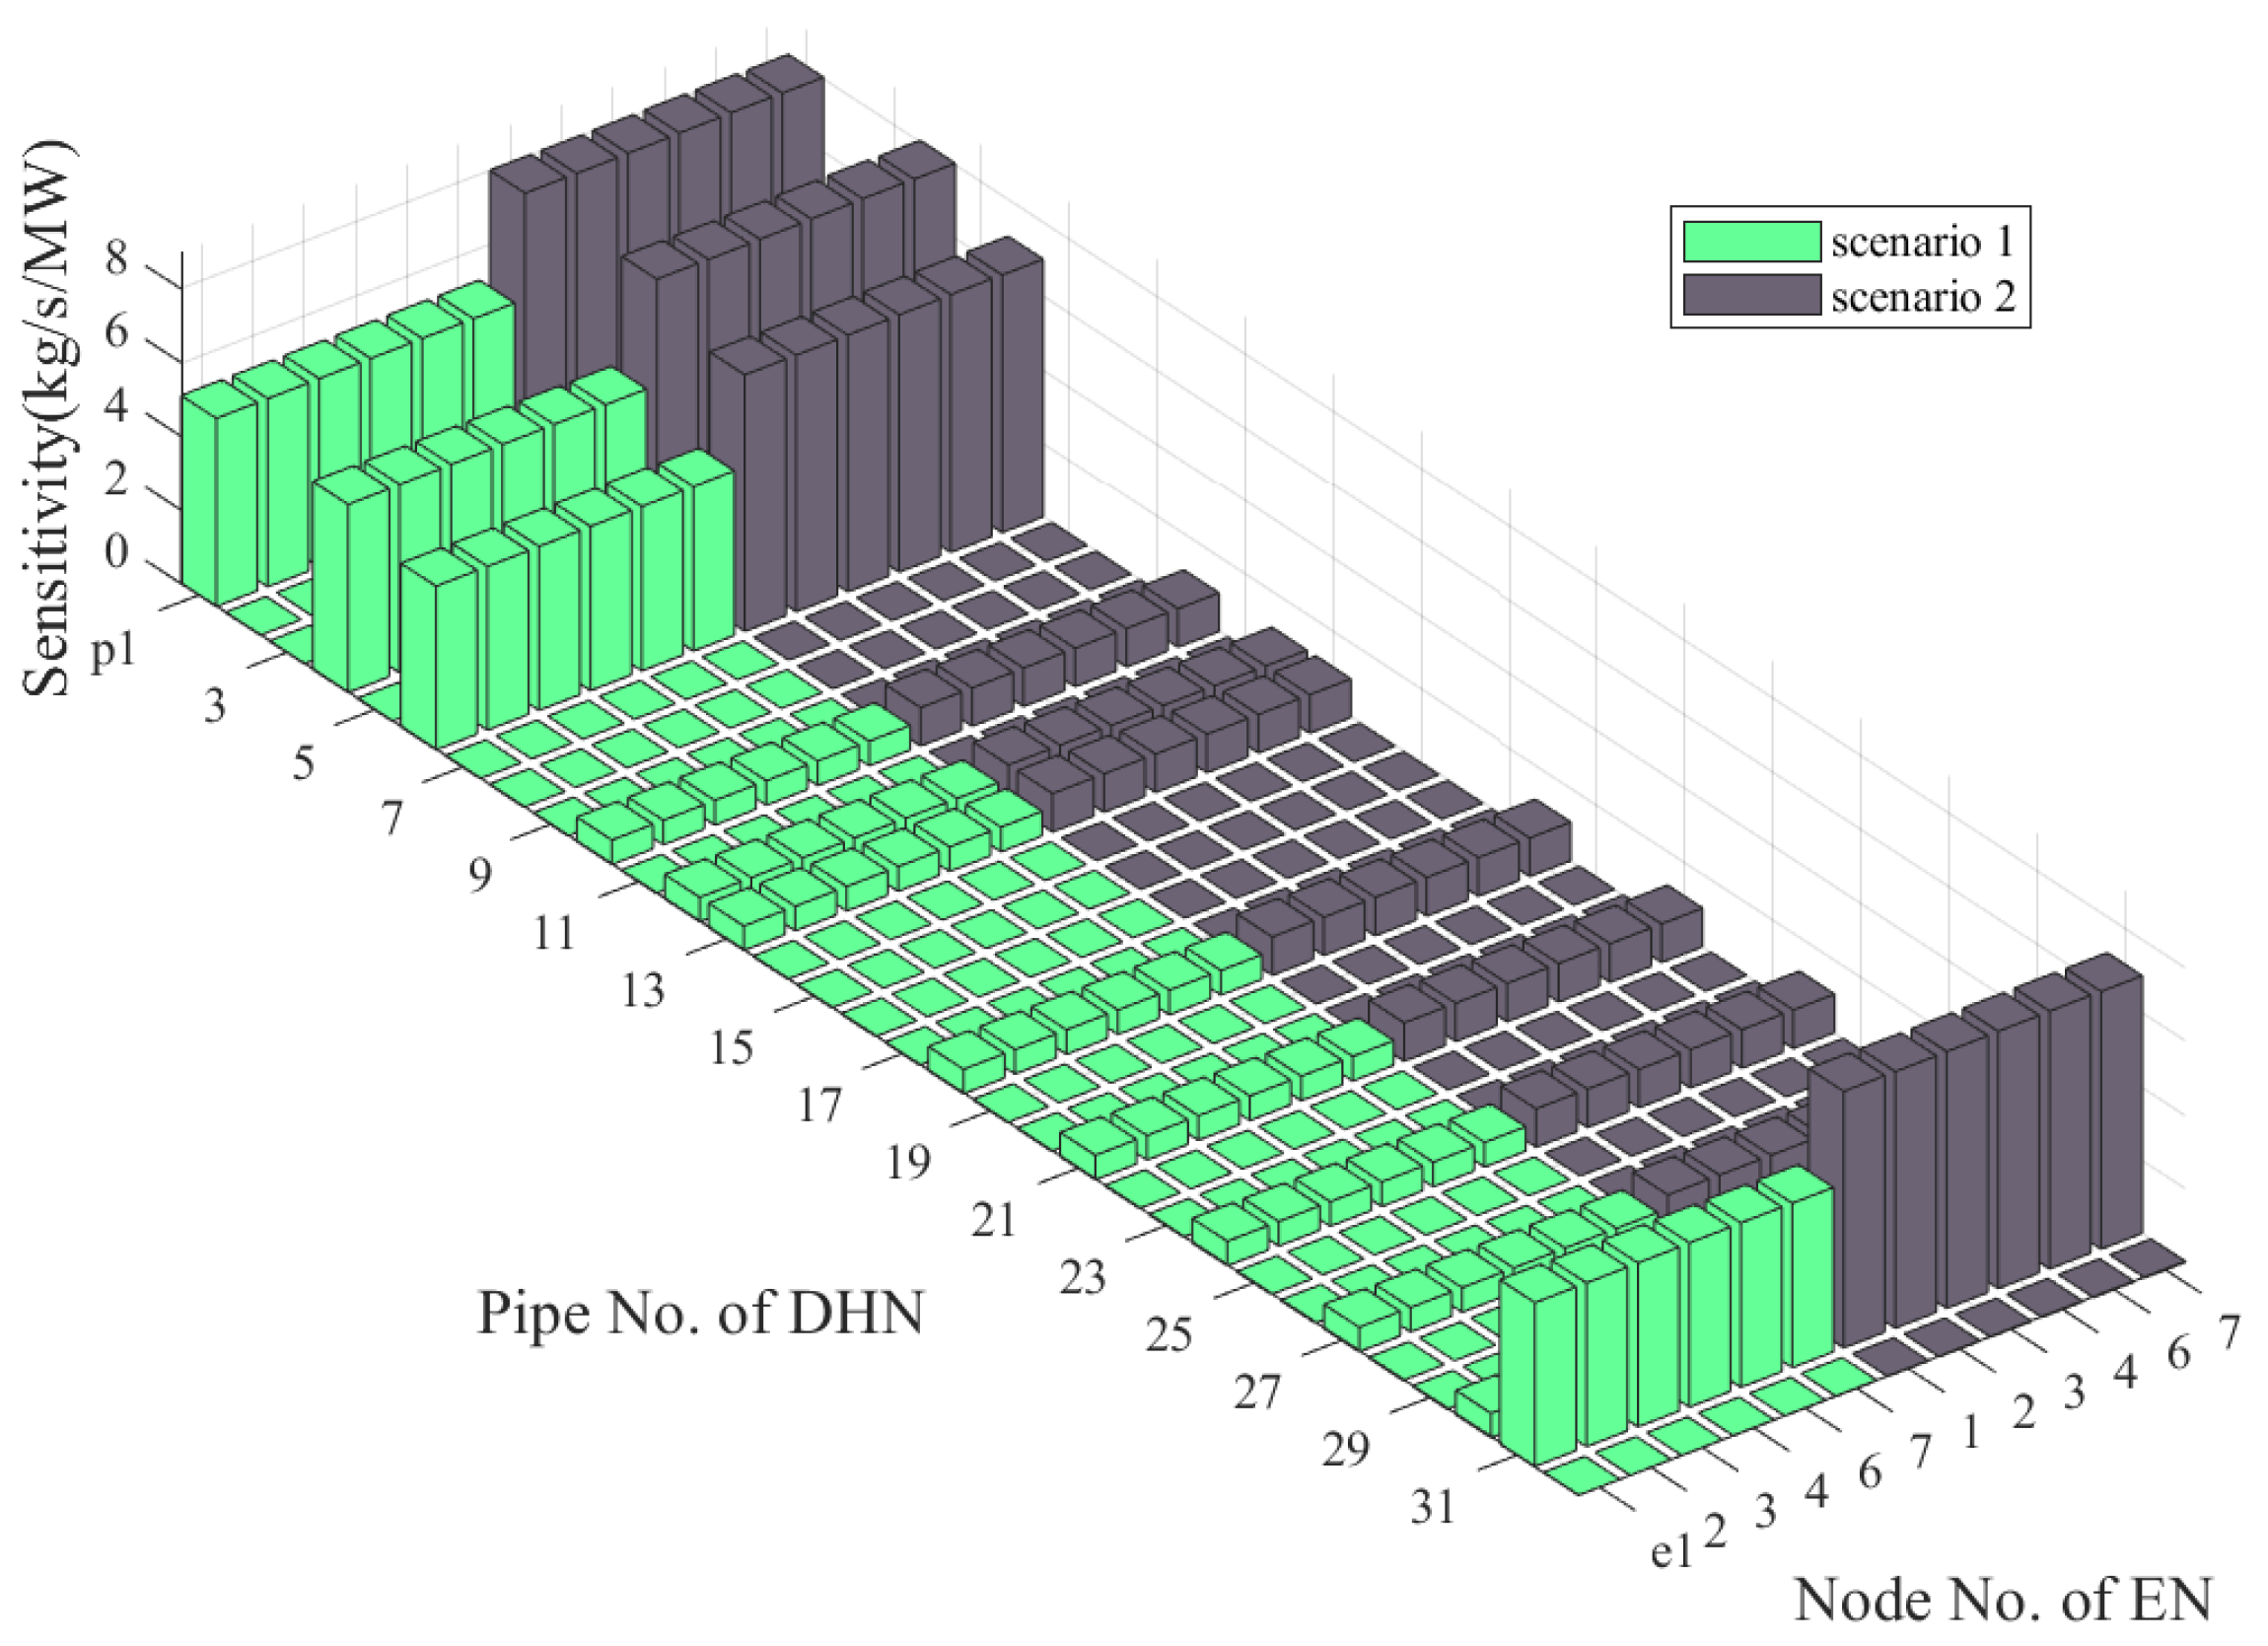
The static sensitivities of scenario 1 and scenario 2 are shown in Figure 6. According to Figure 6, the sensitivity under scenario 1 is lower than that under scenario 2. It shows that the slack node of the EN uses a gas turbine with a positive heat–electrical ratio, and the slack node of the DHN uses a condensing steam turbine with a heat–electrical ratio can effectively mitigate the impact of electrical load fluctuations on the mass flow rates of the DHN pipes. That is, it can reduce the vulnerability of the islanded CEHN. The theory that different CHP unit combinations can enhance the stability of CEHNs was verified by the sensitivity analysis method.
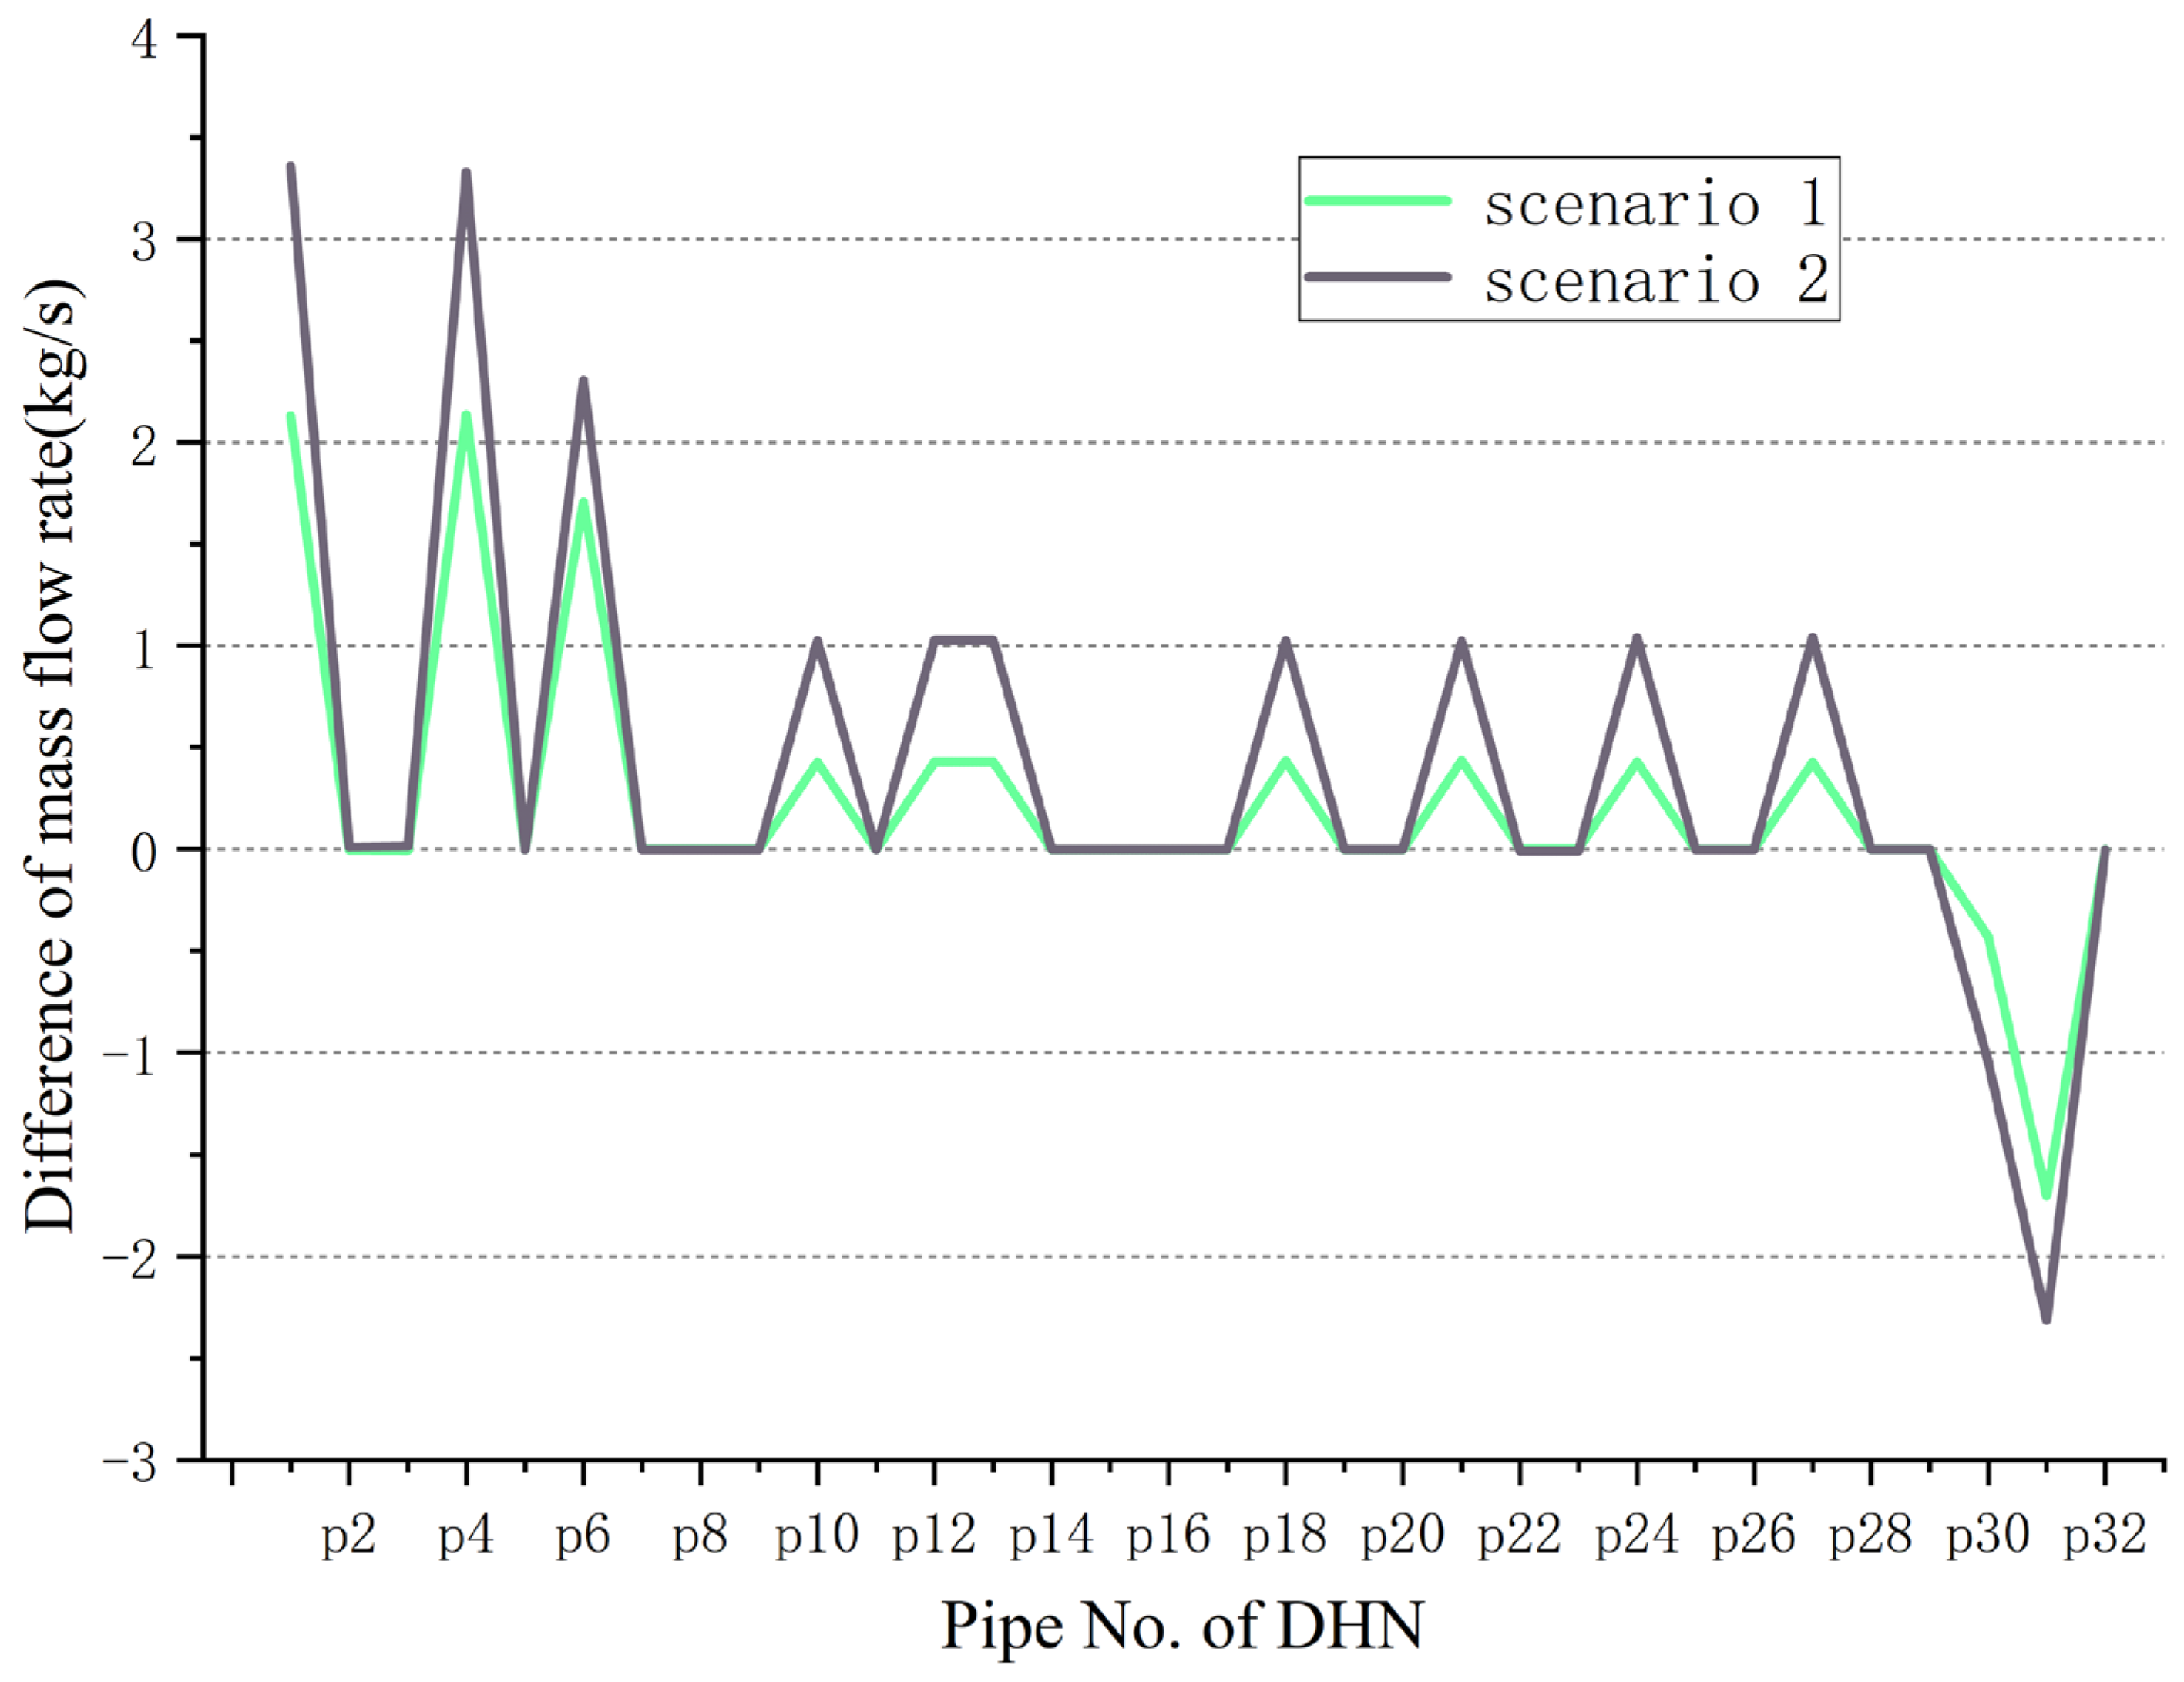
The power flow calculations are performed for Scenario 1 and Scenario 2. Then, the load on the grid is increased by 20%, and the power flow calculations are performed for Scenario 1 and Scenario 2 again. The results of the two calculations are subtracted, and the results are shown in Figure 7.
According to Figure 7, when the EN load increases, the change in the DHN pipe mass flow rate is smaller in scenario 1 with different types of CHP units, and the change in the mass flow rate is larger in scenario 2, which indicates that scenario 1 enhances the stability of the islanded CEHN. The results of the power flow calculations are consistent with the results of the sensitivity calculations in Figure 6, which also proves the effectiveness of the sensitivity calculation method.

6. Conclusions

In this paper, we use a multi-energy flow model of IESs to solve the islanded CEHN power flows by the decomposition solution method. Based on this, we proposed a calculation and analysis method for the static sensitivity of CEHN. This method can effectively reflect the impact of EN load changes on the mass flow rate of DHN pipes in islanded CEHNs, and identify the vulnerable areas of CEHNs, which can provide auxiliary information for the safe and stable operation of islanded CEHNs. The case studies show that:
  • The mass flow rate to node power injection sensitivity can reflect the DHN mass flow rate security margin.
  • Based on the value of the elements in the sensitivity matrix, the vulnerable areas of the islanded CEHN can be quickly identified, which can avoid extensive power flow calculations.
  • Two CHP units with contrary heat-to-electric ratio characteristics are used at the EN slack node and the DHN slack node, which can reduce the sensitivity of the islanded CEHN and improve the system stability.
In future work, we will improve an unsupervised or semi-supervised clustering method, incorporate sensitivity as one of the influencing factors and consider additional factors that affect the vulnerability of the areas, such as the dynamic characteristics of IESs, to achieve a more comprehensive and accurate prediction of the vulnerable areas in the IES.

Author Contributions

Z.S.: Methodology, Validation, Visualization, and Writing—original draft, Writing—review and editing, Software. Y.N.: Data curation, Investigation, Supervision, Project administration. L.Y.: Investigation, Supervision, and Project administration. All authors have read and agreed to the published version of the manuscript.

Funding

This research received no external funding.

Data Availability Statement

Not applicable.

Conflicts of Interest

The authors declare no conflict of interest.

Appendix A

Table A1. DHN Jacobian matrix of Barry Island.
Coordinate (Row, Column)ValueCoordinate (Row, Column)Value
(2, 1)0.1662(14, 18)−0.1633
(2, 2)−0.1662(14, 18)−0.1633
(3, 2)0.1644(19, 18)0.1630
(2, 3)−0.1662(32, 18)0.1682
(4, 3)0.1655(19, 19)−0.1630
(2, 4)−0.1662(20, 19)0.1600
(5, 4)0.1651(19, 20)−0.1630
(5, 5)−0.1651(21, 20)0.1600
(6, 5)0.1606(19, 21)−0.1630
(5, 6)−0.1651(22, 21)0.1624
(7, 6)0.1658(32, 21)0.2557
(32, 6)−1.0814(22, 22)−0.1624
(7, 7)−0.1658(23, 22)0.1597
(8, 7)0.1625(22, 23)−0.1624
(7, 8)−0.1658(24, 23)0.1602
(9, 8)0.1639(22, 24)−0.1624
(7, 9)−0.1658(25, 24)0.1663
(10, 9)0.1612(32, 24)0.0477
(5, 10)−0.1651(25, 25)−0.1663
(11, 10)0.1647(26, 25)0.1639
(32, 10)0.2936(25, 26)−0.1663
(11, 11)−0.1647(27, 26)0.1641
(12, 11)0.1623(25, 27)−0.1663
(11, 12)−0.1647(28, 27)0.1668
(13, 12)0.1639(32, 27)6.0557
(32, 12)0.4071(28, 28)−0.1668
(13, 13)−0.1639(29, 28)0.1651
(14, 13)0.1633(1, 29)0.1650
(32, 13)0.9648(28, 29)−0.1668
(14, 14)−0.1633(28, 30)0.1668
(15, 14)0.1628(30, 30)−0.1687 *
(15, 15)−0.1628(32, 30)−0.0320
(16, 15)0.1602(7, 31)0.1658
(15, 16)−0.1628(30, 31)−0.1687 *
(17, 16)0.1598(32, 31)0.1494
(14, 17)−0.1633(11, 32)0.1647
(18, 17)0.1603(31, 32)−0.1690
* The row of elements in J 11 of Equation (14) that is related to CHP unit on the DHN slack node is marked by * in Table A1. The column of elements in J 11 that is related to CHP unit on the DHN slack node is column 30 in the inverse of the DHN Jacobi matrix.
Table A2. EN Jacobian matrix of Barry Island.
Coordinate (Row, Column)ValueCoordinate (Row, Column)Value
(1, 1)3.2357(3, 8)−1.0029
(2, 1)−2.0024(8, 8)2.6010
(7, 1)−1.2334(10, 8)3.2849
(9, 1)−6.6334(11, 8)2.0511
(10, 1)4.1066(1, 9)6.3175
(1, 2)−2.0037(2, 9)−3.9113
(2, 2)3.6055(7, 9)−2.4065
(8, 2)−1.6020(9, 9)3.0818
(9, 2)4.1060(10, 9)−1.9072
(10, 2)−7.3915(1, 10)−3.9106
(3, 3)2.3921(2, 10)7.0395
(4, 3)−1.3934(8, 10)−3.1292
(8, 3)−0.9991(9, 10)−1.9084
(11, 3)−4.9043(10, 10)3.4340
(12, 3)2.8512(3, 11)4.6729
(3, 4)−1.3892(4, 11)−2.7172
(4, 4)3.2726(8, 11)−1.9565
(6, 4)−1.8838(11, 11)2.2797
(11, 4)2.8532(12, 11)−1.3280
(12, 4)−6.7094(3, 12)−2.7200
(14, 4)3.8559(4, 12)6.3952
(5, 5)1.2299(6, 12)−3.6759
(6, 5)−1.2300(11, 12)−1.3243
(13, 5)−2.5215(12, 12)3.1198
(14, 5)2.5214(14, 12)−1.7959
(4, 6)−1.8792(5, 13)2.4038
(5, 6)−1.2299(6, 13)−2.4042
(6, 6)3.2025(13, 13)1.1727
(12, 6)3.8582(14, 13)−1.1728
(13, 6)2.5215(4, 14)−3.6786
(14, 6)−6.3842(5, 14)−2.4041
(1, 7)−1.2320(6, 14)6.0870
(7, 7)1.2334(12, 14)−1.7917
(9, 7)2.5274(13, 14)−1.1726
(2, 8)−1.6031(14, 14)3.0534
(3, 8)−1.0029
Table A3. Parameters in CHP units.
Parameters NameValue
Heat power of Source 1 (MW)1.055355
Electrical power of Source 1 (MW)0.811811
Heat power of Source 2 (MW)0.810157
Electrical power of Source 2 (MW)0.499981
Electricity losses (MW)0.011792
Heat losses (MW)0.081259

Appendix B

Table A4. EN load.
Table A4. EN load.
Node No. of ENElectrical Load (MW)
e10.2
e20
e30.5
e40.5
e5Electrical source node
e60.2
e70.2
e8Electrical source node
e9Electrical source node
Table A5. DHN load.
Table A5. DHN load.
Node No. of DHNHeating Load (MW)Node No. of DHNHeating Load (MW)
h10.107h170.0805
h20h180.0805
h30.107h190
h40.107h200.0805
h50h210.0805
h60.107h220
h70.107h230.107
h80.107h240.107
h90.107h250
h100.107h260.107
h110.145h270.107
h120.107h280
h13 0h290.107
h140.0805h30Heat source node
h150h31Heat source node
h160.0805h32Heat source node

References

  1. Jin, H. A new principle of synthetic cascade utilization of chemical energy and physical energy. Sci. China Ser. E 2005, 48, 163–179. [Google Scholar] [CrossRef]
  2. Huang, A.Q.; Crow, M.L.; Heydt, G.T.; Zheng, J.P.; Dale, S.J. The Future Renewable Electric Energy Delivery and Management (FREEDM) System: The Energy Internet. Proc. IEEE 2011, 99, 133–148. [Google Scholar] [CrossRef]
  3. Li, G.; Zhang, R.; Jiang, T.; Chen, H.; Bai, L.; Li, X. Security-constrained bi-level economic dispatch model for integrated natural gas and electricity systems considering wind power and power-to-gas process. Appl. Energy 2017, 194, 696–704. [Google Scholar] [CrossRef]
  4. Chang, M.; Lund, H.; Thellufsen, J.Z.; Østergaard, P.A. Perspectives on purpose-driven coupling of energy system models. Energy 2023, 265, 126335. [Google Scholar] [CrossRef]
  5. Dong, H.; Fang, Z.; Ibrahim, A.-W.; Cai, J. Optimized Operation of Integrated Energy Microgrid with Energy Storage Based on Short-Term Load Forecasting. Electronics 2022, 11, 22. [Google Scholar] [CrossRef]
  6. Gao, F.; Gao, J.; Huang, N.; Wu, H. Optimal Configuration and Scheduling Model of a Multi-Park Integrated Energy System Based on Sustainable Development. Electronics 2023, 12, 1204. [Google Scholar] [CrossRef]
  7. Tahir, M.F.; Chen, H.; Javed, M.S.; Jameel, I.; Khan, A.; Adnan, S. Integration of Different Individual Heating Scenarios and Energy Storages into Hybrid Energy System Model of China for 2030. Energies 2019, 12, 2083. [Google Scholar] [CrossRef]
  8. Pan, Z.; Guo, Q.; Sun, H. Interactions of district electricity and heating systems considering time-scale characteristics based on quasi-steady multi-energy flow. Appl. Energy 2016, 167, 230–243. [Google Scholar] [CrossRef]
  9. Yin, X.; Ye, C.; Ding, Y.; Song, Y. Exploiting Internet Data Centers as Energy Prosumers in Integrated Electricity-Heat System. IEEE Trans. Smart Grid 2023, 14, 167–182. [Google Scholar] [CrossRef]
  10. Guo, S.; Ji, W.; Wang, C.; Song, T.; Wang, J. Hydraulic-thermal coupling dynamic models based on mechanism and data-driven methods of the heating networks in integrated energy systems. Energy Convers. Manag. 2023, 292, 117353. [Google Scholar] [CrossRef]
  11. Chong, Z.; Yang, L.; Jiang, Y. Hybrid-timescale dispatch of heat and electricity integrated system considering dynamic heat flow. Electr. Power Syst. Res. 2023, 224, 109713. [Google Scholar] [CrossRef]
  12. Guan, A.; Zhou, S.; Gu, W.; Zhang, K.; Ding, L.; Lv, H. An optimal step-size simulation framework for large-scale heat-electric integrated energy system considering fault states. Electr. Power Syst. Res. 2023, 223, 109617. [Google Scholar] [CrossRef]
  13. Liu, X.; Wu, J.; Jenkins, N.; Bagdanavicius, A. Combined analysis of electricity and heat networks. Appl. Energy 2016, 162, 1238–1250. [Google Scholar] [CrossRef]
  14. Liu, X. Combined Analysis of Electricity and Heat Networks. Ph.D. Thesis, Cardiff University, Cardiff, Wales, 2013. [Google Scholar]
  15. Hassine, I.B.; Eicker, U. Impact of load structure variation and solar thermal energy integration on an existing district heating network. Appl. Therm. Eng. 2013, 50, 1437–1446. [Google Scholar] [CrossRef]
  16. Li, G.; Zhang, R.; Jiang, T.; Chen, H.; Bai, L.; Cui, H.; Li, X. Optimal dispatch strategy for integrated energy systems with CCHP and wind power. Appl. Energy 2017, 192, 408–419. [Google Scholar] [CrossRef]
  17. Shabanpour-Haghighi, A.; Seifi, A.R. An Integrated Steady-State Operation Assessment of Electrical, Natural Gas, and District Heating Networks. IEEE Trans. Power Syst. 2016, 31, 3636–3647. [Google Scholar] [CrossRef]
  18. Wang, J.; Qi, X.; Ren, F.; Zhang, G.; Wang, J. Optimal design of hybrid combined cooling, heating and power systems considering the uncertainties of load demands and renewable energy sources. J. Clean. Prod. 2021, 281, 125357. [Google Scholar] [CrossRef]
  19. Biswas, R.S.; Pal, A.; Werho, T.; Vittal, V. A Graph Theoretic Approach to Power System Vulnerability Identification. IEEE Trans. Power Syst. 2021, 36, 923–935. [Google Scholar] [CrossRef]
  20. Huang, W.; Du, E.; Capuder, T.; Zhang, X.; Zhang, N.; Strbac, G.; Kang, C. Reliability and Vulnerability Assessment of Multi-Energy Systems: An Energy Hub Based Method. IEEE Trans. Power Syst. 2021, 36, 3948–3959. [Google Scholar] [CrossRef]
  21. Zhu, D.; Wang, B.; Ma, H.; Wang, H. Evaluating the vulnerability of integrated electricity-heat-gas systems based on the high-dimensional random matrix theory. CSEE J. Power Energy Syst. 2020, 6, 878–889. [Google Scholar] [CrossRef]
  22. Oh, U.; Lee, Y.; Choi, J.; Karki, R. Reliability evaluation of power system considering wind generators coordinated with multi-energy storage systems. IET Gener. Transm. Distrib. 2020, 14, 786–796. [Google Scholar] [CrossRef]
  23. Mu, Y.; Wang, C.; Kang, G.; Wang, Z.; Jiang, T.; Li, J.; Dou, W. Research on sensitivity analysis of wind power consumption capability of integrated energy system based on unified optimal power flow model. J. Eng. 2019, 2019, 8471–8476. [Google Scholar] [CrossRef]
  24. Liu, T.; Jiao, W.; Tian, X. A framework for uncertainty and sensitivity analysis of district energy systems considering different parameter types. Energy Rep. 2021, 7, 6908–6920. [Google Scholar] [CrossRef]
  25. Ji, L.; Liang, X.; Xie, Y.; Huang, G.; Wang, B. Optimal design and sensitivity analysis of the stand-alone hybrid energy system with PV and biomass-CHP for remote villages. Energy 2021, 225, 120323. [Google Scholar] [CrossRef]
  26. Li, Y.; Zhang, H.; Liang, X.; Huang, B. Event-Triggered-Based Distributed Cooperative Energy Management for Multienergy Systems. IEEE Trans. Ind. Inform. 2019, 15, 2008–2022. [Google Scholar] [CrossRef]
  27. Dancker, J.; Wolter, M. Power-Transfer-Distribution-Factor-based Sensitivity Factors for Integrated Energy Systems. IEEE Trans. Sustain. Energy 2023, 1–13. [Google Scholar] [CrossRef]
  28. Ruiz-Tipán, F.; Barrera-Singaña, C.; Valenzuela, A. Reactive power compensation using power flow sensitivity analysis and QV curves. In Proceedings of the 2020 IEEE ANDESCON, Quito, Ecuador, 13–16 October 2020; pp. 1–6. [Google Scholar]
  29. Zhao, B.; Luo, B.; Zhou, J.; Meng, X.; Li, Z. Static sensitivity analysis method of integrated energy system based on power flow model. In Proceedings of the 2018 2nd IEEE Conference on Energy Internet and Energy System Integration (EI2), Beijing, China, 20–22 October 2018; pp. 1–9. [Google Scholar]
  30. Li, Z.; Wu, L.; Xu, Y. Risk-Averse Coordinated Operation of a Multi-Energy Microgrid Considering Voltage/Var Control and Thermal Flow: An Adaptive Stochastic Approach. IEEE Trans. Smart Grid 2021, 12, 3914–3927. [Google Scholar] [CrossRef]
  31. Wang, H.; Gu, C.; Zhang, X.; Li, F. Optimal CHP Planning in Integrated Energy Systems Considering Network Charges. IEEE Syst. J. 2020, 14, 2684–2693. [Google Scholar] [CrossRef]
  32. Hongfu, W.; Xianghong, T.; Zhiqiang, Z.; Chong, G.; Hao, Y.; Shixia, M. An improved DC power flow algorithm with consideration of network loss. In Proceedings of the 2014 International Conference on Power System Technology, Chengdu, China, 20–22 October 2014; pp. 455–460. [Google Scholar]
  33. Hu, W.; Wu, Y.; Jing, J.; Jiang, X.; Li, X.; Wang, C. Multi-Energy Flow Calculation Model and Solution Method for Regional Integrated Energy System. In Proceedings of the 2021 IEEE Asia-Pacific Conference on Image Processing, Electronics and Computers (IPEC), Dalian, China, 14–16 April 2021; pp. 238–241. [Google Scholar]
  34. Chen, Y.; Zhao, J.; Ma, J. Fast Decoupled Multi-energy Flow Calculation for Integrated Energy System. J. Mod. Power Syst. Clean Energy 2020, 8, 951–960. [Google Scholar] [CrossRef]
  35. Zhu, M.; Xu, C.; Dong, S.; Tang, K.; Gu, C. An integrated multi-energy flow calculation method for electricity-gas-thermal integrated energy systems. Prot. Control Mod. Power Syst. 2021, 6, 5. [Google Scholar] [CrossRef]
  36. Fu, X.; Sun, H.; Guo, Q.; Pan, Z.; Xiong, W.; Wang, L. Uncertainty analysis of an integrated energy system based on information theory. Energy 2017, 122, 649–662. [Google Scholar] [CrossRef]
  37. Zhang, T.; Zhang, W.; Zhao, Q.; Du, Y.; Chen, J.; Zhao, J. Distributed Real-time State Estimation for Combined Heat and Power Systems. J. Mod. Power Syst. Clean Energy 2021, 9, 316–327. [Google Scholar] [CrossRef]
Figure 1. Structure Diagram of the DHN of Barry Island system.
Electronics 12 03936 g001
Figure 2. Sensitivity curves of EN and DHN.
Electronics 12 03936 g002
Figure 3. Sensitivity heat map of S h e .
Electronics 12 03936 g003
Figure 4. Mass flow rate of DHN pipes for different electrical load growth.
Electronics 12 03936 g004
Figure 5. Schematic diagram of different CHP unit combinations.
Electronics 12 03936 g005
Figure 6. Sensitivities for different scenarios.
Electronics 12 03936 g006
Figure 7. Difference of mass flow rate for different scenarios.
Electronics 12 03936 g007
Table 1. The EN voltage data of Barry Island.
Node NumberVoltage Amplitude (pu.)Voltage Phase Angle (rad)
11.0488−0.6306
21.0488−0.6288
31.0490−0.6633
41.0493−0.7060
51.0500−0.7599
61.0500−0.7500
71.0499−0.7409
81.0500−0.7245
91.02000.0000
Table 2. The DHN power flow data of Barry Island.
Pipe NumberMass Flow Rate (kg/s)Supply Temperature (°C)Return Temperature (°C)
14.798969.445230.0000
20.651069.753329.7125
30.876069.305630.0000
43.271969.578930.0000
50.666469.476429.6517
6−0.879568.392230.0000
70.658569.656529.6881
80.652968.855330.0000
90.663769.186730.0000
103.485068.548930.0000
110.659369.390329.7259
124.192668.809130.0000
134.192669.184529.7243
141.006269.056629.7669
150.502468.928229.7738
160.503868.312230.0000
170.502168.211430.0000
182.191468.335930.0000
190.503168.976129.7605
200.503068.257930.0000
211.185368.269730.0000
220.669968.831229.8015
230.668068.195230.0000
24−0.152668.299530.0000
250.652869.754729.7795
260.651969.194730.0000
27−1.457369.246130.0000
280.648069.882129.7956
290.648669.485830.0000
302.753970.000029.6552
313.499770.000029.5907
322.247170.000029.6314
Table 3. Times for different method.
MethodTime (s)
Power flow calculation (Total time for 6 sessions)0.275367
Sensitivity calculation0.037139
Table 4. Heat-to-electricity ratios of scenario 1 and scenario 2.
Heat-to-Electric Ratio of CHP1Heat-to-Electric Ratio of CHP2
scenario 1 c m 1 = 1.3 = Φ C H P 1 P C H P 1 (gas turbines) c m 2 = Z = 8.1 = Φ C H P 2 Φ c o n P c o n P C H P 2 (condensing steam turbine with extraction)
scenario 2 c m 1 = 1.3 = Φ C H P 1 P C H P 1 (gas turbines) c m 2 = 5 = Φ C H P 2 P C H P 2 (gas turbines)
Disclaimer/Publisher’s Note: The statements, opinions and data contained in all publications are solely those of the individual author(s) and contributor(s) and not of MDPI and/or the editor(s). MDPI and/or the editor(s) disclaim responsibility for any injury to people or property resulting from any ideas, methods, instructions or products referred to in the content.