Abstract
Recently, artificial intelligence (AI) has gained an abundance of attention in cybersecurity for Industry 4.0 and has shown immense benefits in a large number of applications. AI technologies have paved the way for multiscale security and privacy in cybersecurity, namely AI-based malicious intruder protection, AI-based intrusion detection, prediction, and classification, and so on. Moreover, AI-based techniques have a remarkable potential to address the challenges of cybersecurity that Industry 4.0 faces, which is otherwise called the IIoT. This manuscript concentrates on the design of the Golden Jackal Optimization with Deep Learning-based Cyberattack Detection and Classification (GJODL-CADC) method in the IIoT platform. The major objective of the GJODL-CADC system lies in the detection and classification of cyberattacks on the IoT platform. To obtain this, the GJODL-CADC algorithm presents a new GJO-based feature selection approach to improve classification accuracy. Next, the GJODL-CADC method makes use of a hybrid autoencoder-based deep belief network (AE-DBN) approach for cyberattack detection. The effectiveness of the AE-DBN approach can be improved through the design of the pelican optimization algorithm (POA), which in turn improves the detection rate. An extensive set of simulations were accomplished to demonstrate the superior outcomes of the GJODL-CADC technique. An extensive analysis highlighted the promising performance of the GJODL-CADC technique compared to existing techniques.
1. Introduction
The Industrial Internet of Things (IIoT) is a wide-ranging system containing various resourceful and interconnected devices, which provide several benefits to smart computing in frameworks and organizations, from manufacturers to services [1]. In Industry 4.0, manufacturing and industrial processes and techniques remain automated with the latest technologies [2]. Large-scale machine-to-machine and IoT transmissions are incorporated for improving automation, enhancing self-monitoring and communications, and emerging intelligent machines, which can recognize problems with no requirement for human interaction [3]. Massive devices and sensors are interconnected for generating information, and processing, safe transmission, and accurate data gathering becomes significant in IIoT environments [4]. The desirable advantages and possibilities of the IIoT revolution aside, industrial devices and the IIoT have been exposed to attacks by hackers who continuously attempted to obtain necessary information or cultivate destructive processes [5]. Since IIoT applications are growing, related security risks and cyberattacks have also increased [6]. There are various examples of cyberattacks on the IIoT that have taken place recently, which affect hardware components like sensors or pump conditions as well as the software components of the system [7].
Various organizations use intrusion detection systems (IDSs) to resist malicious attacks and protect the security of IIoT nodes and networks [8]. IDSs allow secure, private, and reliable data transmissions across the network, and they play an important role in the IIoT [9]. Tasks that involve fully protecting an IIoT network from attacks or partially detecting, reporting, avoiding, and responding to malicious activities are executed by the IDS. IDSs produced through statistical approaches are behavior-based [10]. Their reviews depend on earlier rules that are employed for modelling behaviors based on the network [11]. However, this technique is not chosen nowadays because it is challenging to measure such reviews. The classification of standard IDSs is typically introduced as hybrid, anomaly-based, and signature-based IDSs [12]. ML approaches are the most commonly desired techniques to carry out intrusion detection. ML can enable the experiential learning and decision-making method of the different systems by enhancing the expertise and capability without the use of open programming [13]. In IDSs that are made via employing DL approaches, recent and updated databases are selected to execute widespread intrusion detection [14]. DL-based IDSs are generally trained by employing state-of-the-art databases that have been produced for intrusion detection [15].
This manuscript focuses on the design of the Golden Jackal Optimization with Deep Learning-based Cyberattack Detection and Classification (GJODL-CADC) technique in the IIoT platform. The GJODL-CADC system presents a new GJO-based feature selection approach to improve classification accuracy. Next, the GJODL-CADC technique makes use of a hybrid autoencoder-based deep belief network (AE-DBN) system for cyberattack detection. The effectiveness of the AE-DBN model can be improved through the design of the pelican optimization algorithm (POA), which in turn improves the detection rate. An extensive set of outcomes was accomplished to depict the greater outcome of the GJODL-CADC methodology.
2. Related Works
Golchha et al. [16] introduced a technique for identifying cyberattacks in the IIoT network by utilizing the voting-based ensemble learning technique. In this developed model, recent ensemble and traditional ML algorithms such as Histogram Gradient Boosting (HGB), RF, and CatBoost, as well as complex voting classifiers, are utilized for effectively detecting cyberattacks. The authors of [17] presented a DL technique to create a novel, balanced representation of imbalanced databases. The novel representation was provided for an ensemble DL attack identification method that was specially developed for an ICS platform. This method leverages DNN and DT classifiers for detecting cyberattacks from innovative representations. Hasan et al. [18] developed a smart DL-enabled algorithm for protecting the IIoT platform from lethal and complex multivariant botnet attacks.
Yazdinejad et al. [19] suggested an ensemble DL method that employs the advantages of the LSTM and AE structures. The LSTM is employed to make a model of normal data time-series to learn standard data formats, and the significant data features can be detected by an AE. This developed technique extracts novel balanced data in imbalanced databases, and these novel balanced data are provided in the deep-LSTM-AE anomaly recognition algorithm. In [20], a secure automatic 2-stages-IDS (SATIDS) was introduced that employs the MRMR-FS approaches and an improved form of a LSTM that depends on an artificial RNN for increasing the IDS effectiveness. Huma et al. [21] introduced a new method, termed the hybrid deep RNN (HDRNN), for identifying cyberattacks in IIoT systems. The HDRaNN incorporates a DRaNN and MLP with dropout normalization.
Gómez et al. [22] recommended a DL-based approach named SUSAN for making anomaly detectors to identify cyberattacks that influence the sustainability of industrial systems. SUSAN has followed an adaptable and modular design, which permits the ensembling of various detectors for attaining more accurate identifications. The authors [23] suggested a dependable DL-based routing attack recognition method for the IIoT. The authors reviewed the adversarial training model to identify attempted attacks in RPL. It supports the achievement of reliable learning methods. A GAN-Classifier (GAN-C) algorithm is established for attack detection activities that involve a two-phase incorporation of the SVM and GAN approaches.
3. The Proposed Model
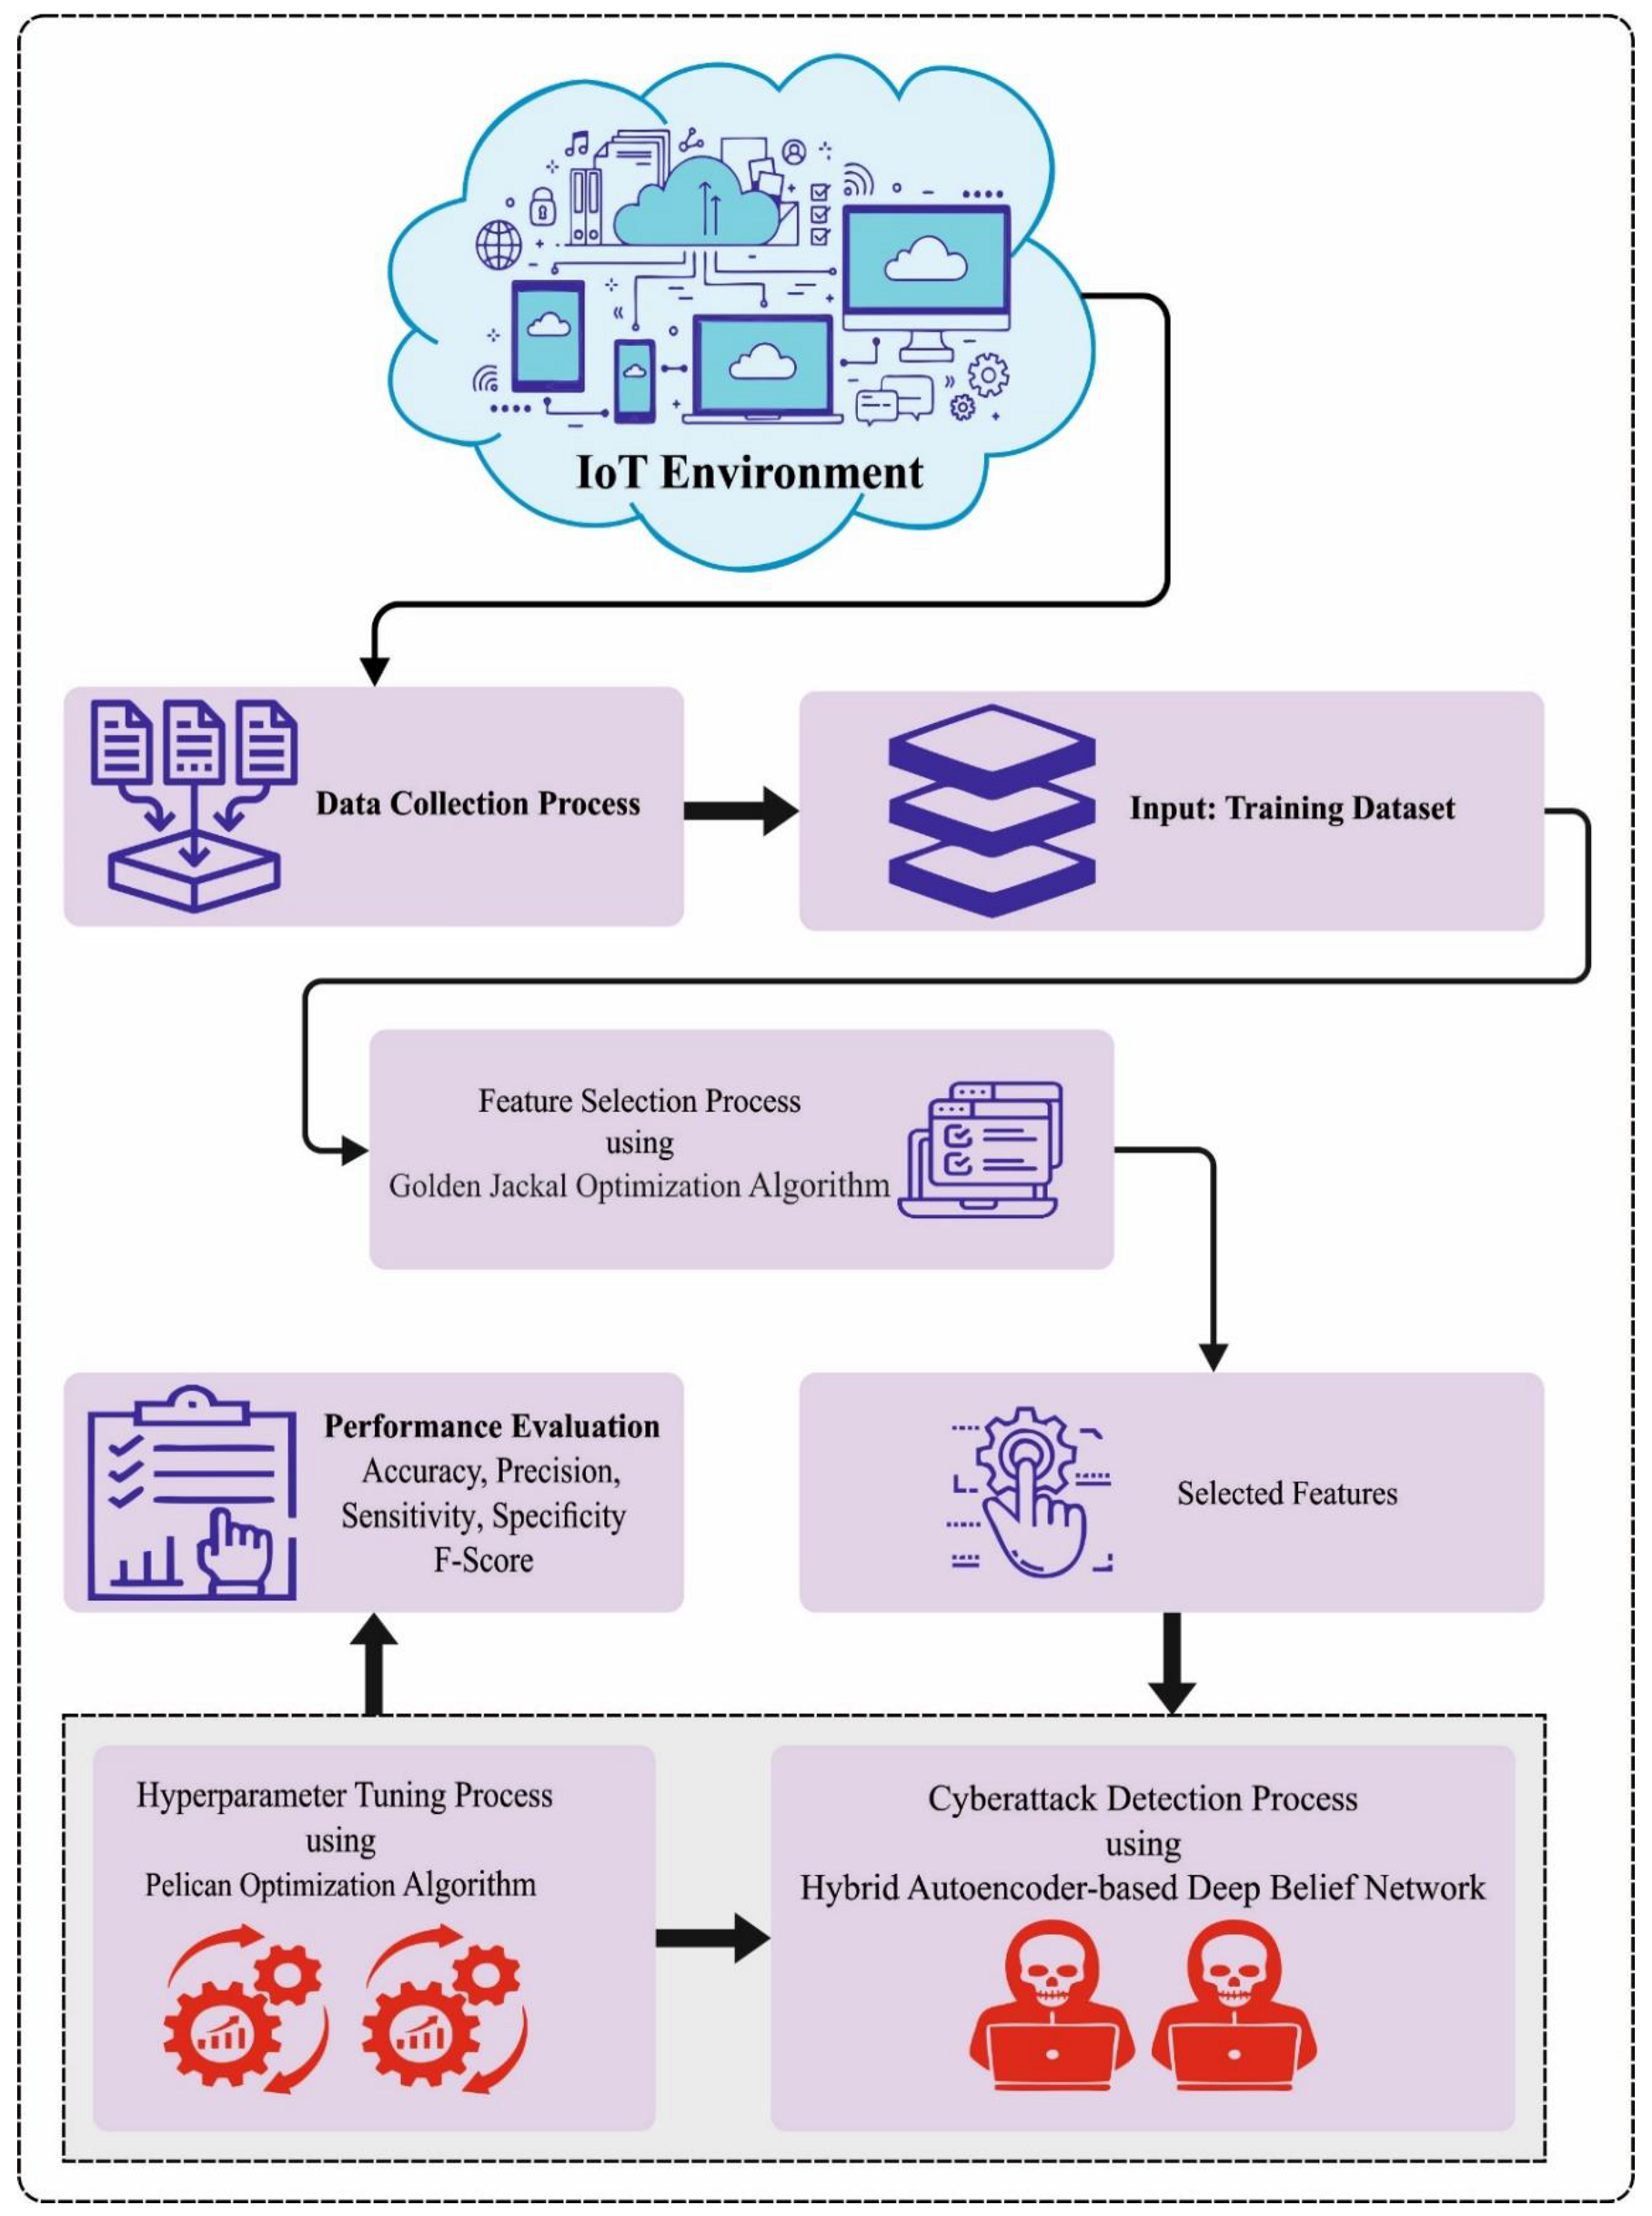
This manuscript has developed a novel GJODL-CADC method for cyberattack recognition and classification in the IIoT platform. The purpose of the GJODL-CADC method lies in the detection and classification of cyberattacks from the IoT platform. To obtain this, the GJODL-CADC method comprises three main procedures such as GJO-based feature selection, AE-DBN-based detection, and POA-based hyperparameter tuning. Figure 1 defines the workflow of the GJODL-CADC approach.

Figure 1.
Workflow of the GJODL-CADC approach.
3.1. Design of Feature Selection Using GJO Algorithm
The GJO algorithm can be applied to electing the features. The traditional GJO technique is derived from the hunting strategy of golden jackal couples, and also adopted a swarm-based technique [24]. The foraging procedure involves searching for capturing prey, prey tracking neighboring prey, and attacking prey. Like other metaheuristic approaches, the initial solution of the GJO technique is distributed uniformly on the searching range and is given below:
The initial procedure includes the generation of the initial prey matrix, with the FMJ and MJ conquering the initial and following locations, correspondingly. In Equation (1), shows the primary random population and and represent the upper and lower limitations of the decision variable. denotes the random integer that ranges from zero to one. The composition of prey is shown below:
In Equation (2), refers to the prey’s parameter. There are variables and preys in total. The prey location is considered an optimum solution.
In the optimization process, an objective function evaluates the fitness of all the prey with the resultant fitness value being compiled as determined in the following matrix:
In Equation (3), shows the values of the parameter of the target, denotes the objective function, and indicates the matrix to store the fitness of the prey. The jackal pair search for a suitable target position.
Generally, jackals locate food effectively, with the extraordinary ability to pursue and detect targets. Nonetheless, there are instances in which their efforts have failed, and the possible prey avoids capture, which prompts them to abandon and find alternate sources of nourishment. While hunting, the MJ takes the lead, whereas the FMJ closely follows them, and the mathematical model can be expressed as follows:
Here () indicates the vector of the target location, shows the existing iteration. and denote the locations of the MJ and FMJ, correspondingly. The revised locations of the MJ and FMJ regarding the target are signified as and . The evasive energy of the target was calculated as follows:
where illustrates the random number from the range of zero and one. denotes the initial state of the target’s energy and signifies the prey’s diminishing energy.
indicates the iteration counter and denotes the constant value of 1.5. linearly reduces through iteration, from 1.5 to . In Equations (4) and (5), the distance between the jackals and the prey is evaluated using . This distance is either deducted from or added to its existing location based on how well the prey manages to avoid the jackals. The vector of random numbers in Equations (4) and (5) represent the Lévy movement and are calculated according to the LF.
In Equation (9), denotes the LF function that can be evaluated using the following expression:
In Equation (10), the value of is fixed to 1.5 and denotes a randomly generated value within the range of . The position of the jackal was updated by averaging Equations (4) and (5) as follows:
Since the prey are chased by jackals, their evasive decline of energy results in the final encirclement of the target through the pair of jackals that were recognized in an earlier stage. The target is attacked when surrounded and used up by the jackals. The mathematical expression of the hunting behavior of the MJ and FMJ jackals that pursue in pairs is given below:
where refers to the vector position of prey in the existing iteration , and and represent the position of the MJ and FMJ. The upgraded MJ and FMJ locations in connection with the prey are signified by and . Equation (6) defines the prey’s escaping energy or .
The FF employed in the presented GJO system is intended to find a balance between the count of elected features in all the performances (lesser) and the classifier accuracy (higher) acquired by deploying these elected features; Equation (14) defines the FF for evaluating outcomes.
In which defines the classifier errors of the provided classifier. defines the cardinality of the elected subsets and stands for the entire feature counts from the database; and are two parameters corresponding to the importance of the classification quality and subset length. ∈ [1,0] and
3.2. Cyberattack Detection Using AE-DBN Model
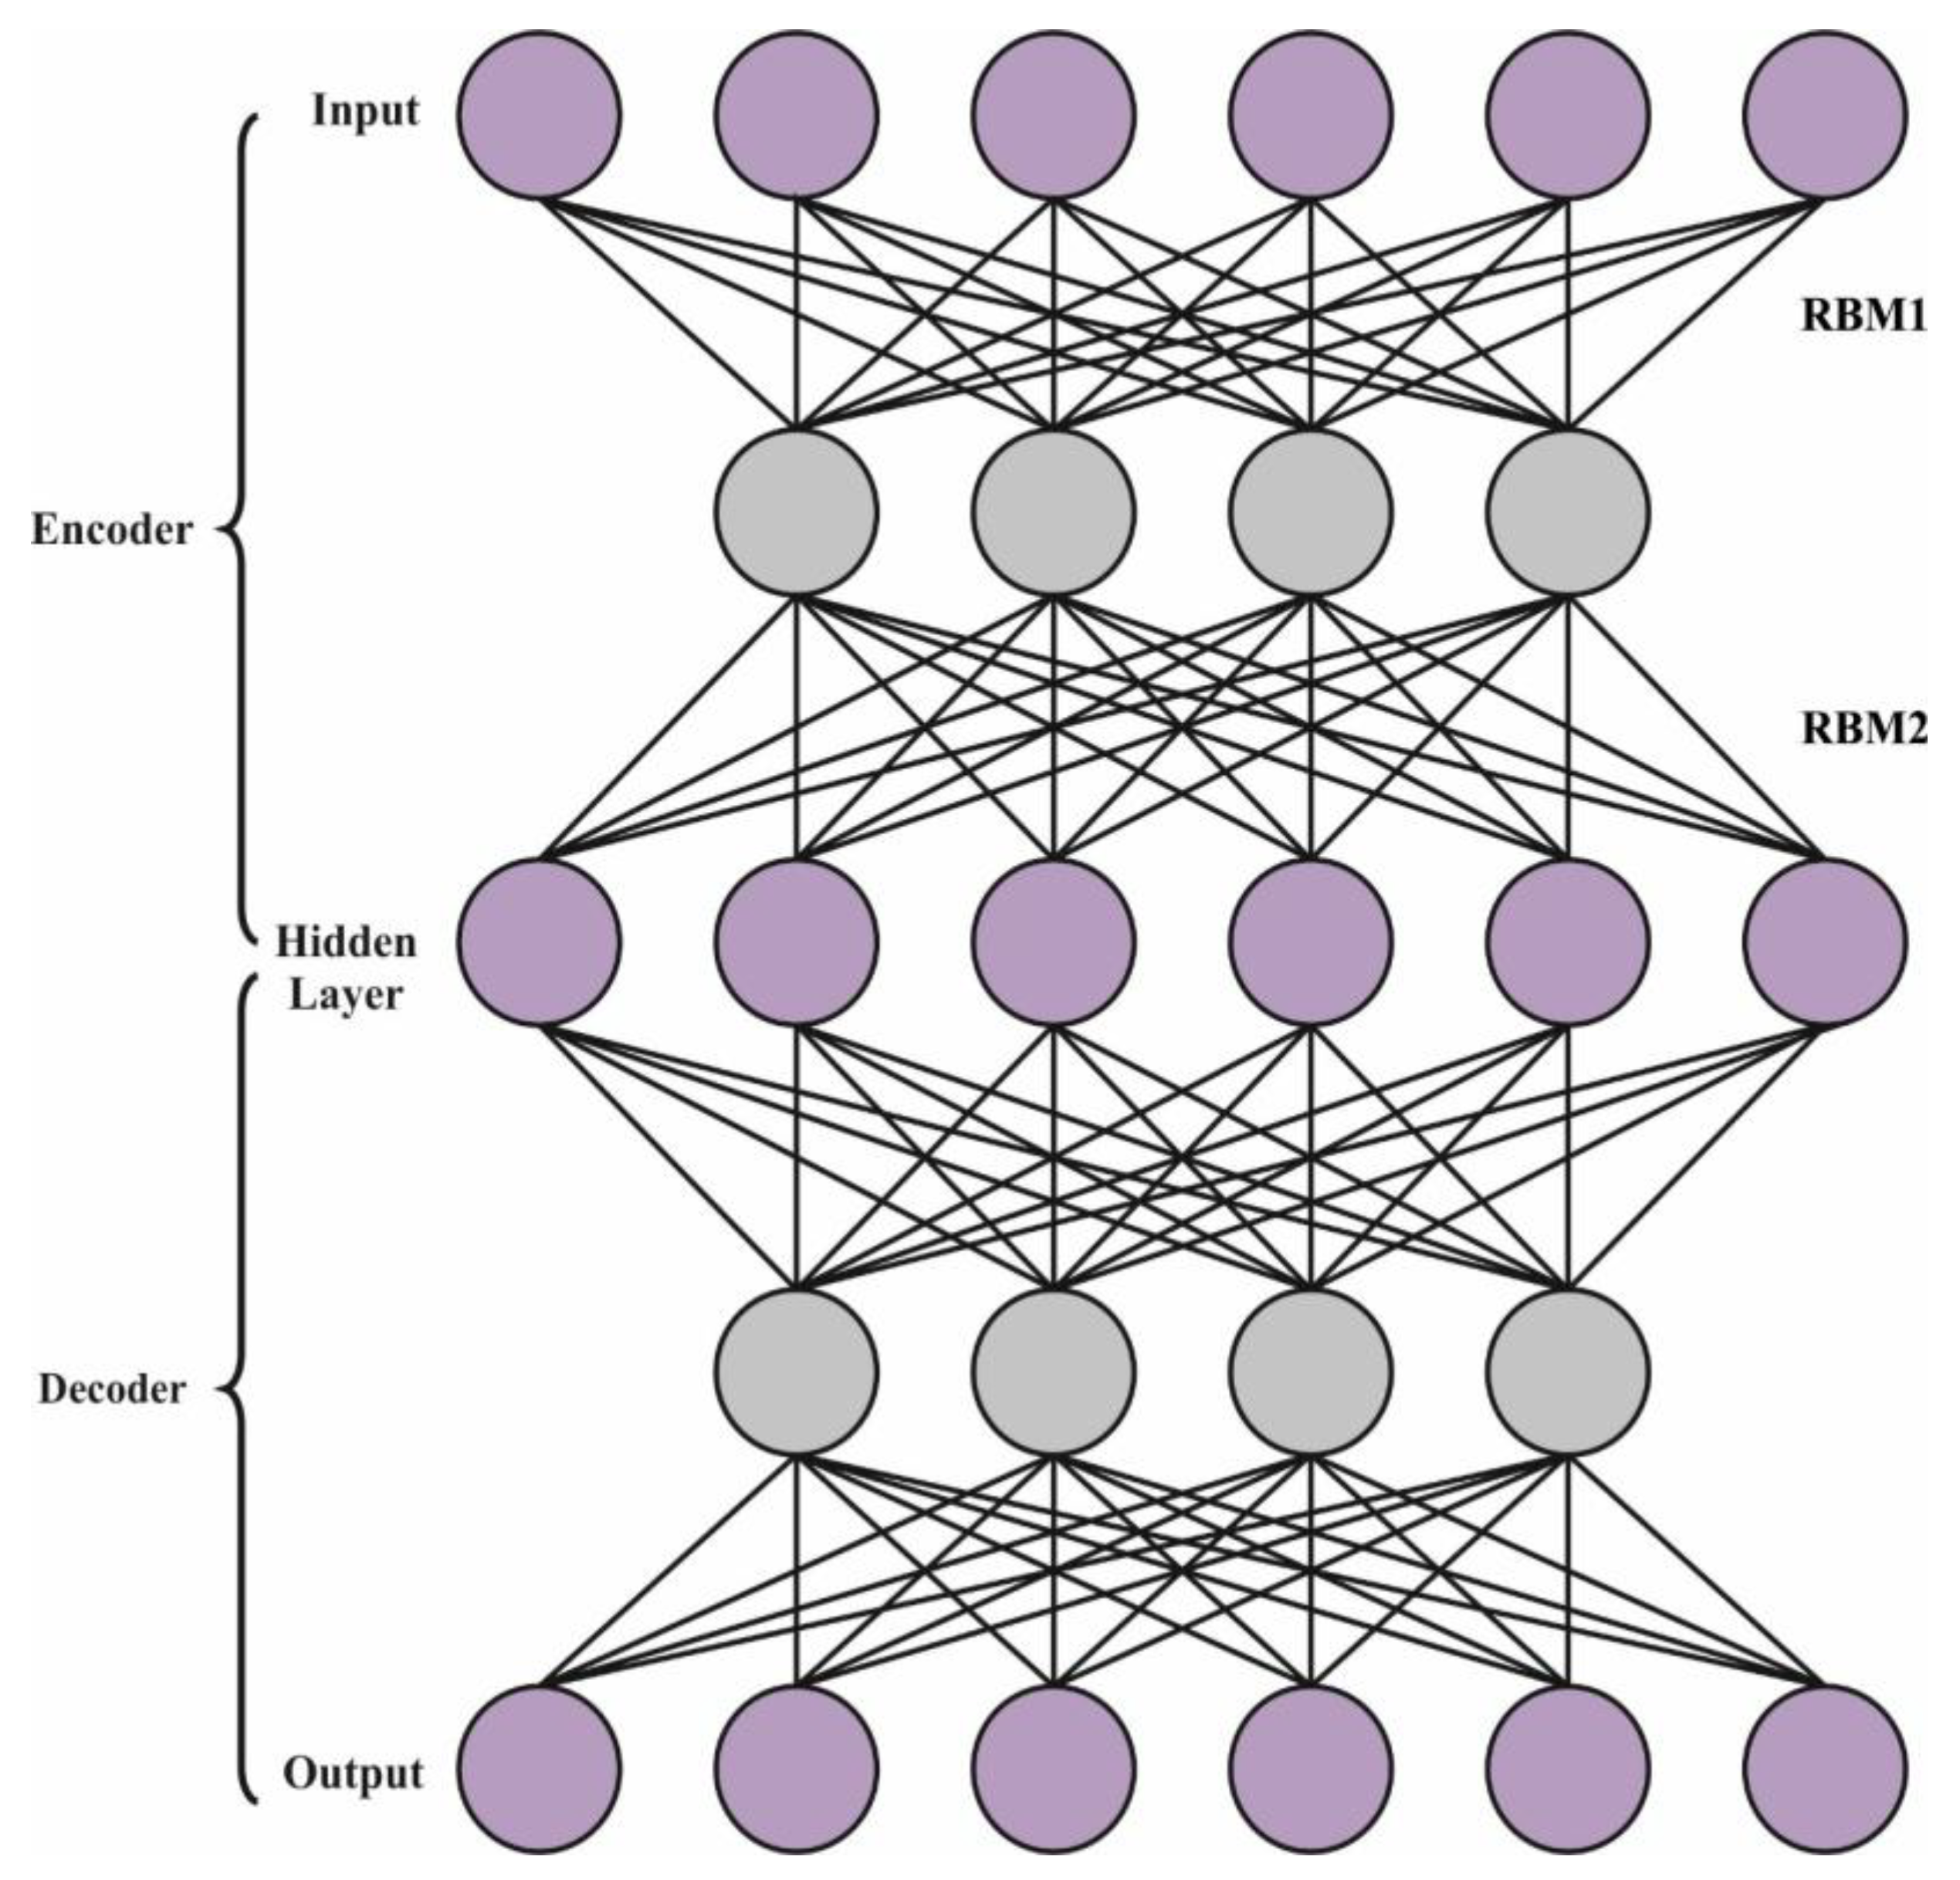
For detecting cyberattacks, the AE-DBN model can be applied. The DBN is regarded as a group of easy unsupervised networks, like RBM, that perform as the hidden state of all the subnets and the visible layer of the subsequent layers [25]. The layer in the DBN infrastructure takes an effectual-by-layer process that defines how variables are dependent upon variables from the layer above. The presented DBN network comprises many hidden and visible RBM layers and LR for classification from the end layer. During the primary phase of the development method, distinct feature spaces of vectors can be mapped, and then all the layers of the RBM network have been trained in an unsupervised manner, correspondingly, to preserve the feature data of all components. During the secondary phase, fine alterations are developed. Figure 2 depicts the infrastructure of AE-DBN.

Figure 2.
Structure of the AE-DBN.
An AE is a three-layer unsupervised NN. It can be understood that the simplest procedure of NNs is employed for representation learning, like FS, or decreasing the size and attempts to recreate the input patterns from the resultant layer.
Assume that X is data with instances and features. represents the encoded result. The mathematical expressions of the encoder and decoder functions for a simple AE are provided in Equations (15) and (16), correspondingly.
In Equations (15) and (16), and signify the adaptable parameters, and denote the activation function, defines the weighted transpose, and stands for the reconstructed input vector from the resultant layer. The presented AE-DBN structure comprises two major parts. During the primary part, the AE is employed as a DL approach for extraction features in the input data. The secondary part is defined by the DL approach that is dependent upon the DBN for forecasting the RUL. The encoder portion of the AE is responsible for the feature extract that signifies the features of the input data. These feature extractions are provided to the DBN of the presented structure that is utilized for predicting the RUL. Primarily, the AE has been trained individually for obtaining the weighted matrix that was previously trained in the DBN RUL forecast method. The decoder portion of the AE has been employed to verify the feature extraction validity to recreate the novel data. Afterwards, the achieved weighted matrix for the AE was integrated with the DBN approach and was lastly trained to utilize the input data for the RUL forecast.
3.3. Hyperparameter Tuning Using POA
Finally, the POA can be applied to the hyperparameter tuning process. The POA inspires the natural behavior of pelicans in the hunting procedure that is separated into two main stages, namely approaching the prey and the surface flight [26].
3.3.1. Exploration Stage
The exploration stage is a primary step of the POA, and it arbitrarily defines the prey location and moves near to its determined region. The mathematical formula for the pelican performance in this stage is as follows:
where implies the location of the prey chosen by pelican; denotes the value of the main function, viz., which is the value of the degree of adaptation; indicates the arbitrary natural number made from 1 and N; represents the novel state of pelican from the dimension; stands for the alteration value equivalent to it. defines the random number from the range of zero and one, and the value of is both one and two. and denote the arbitrary numbers utilized for generating the arbitrary POA performance from upgrades and searches.
3.3.2. Exploitation Step
In the secondary step, once the pelicans obtain the surface, they can spread their wings on water and move the fish upwards, having earlier located the prey, from its throat pockets. Modeling this behavioral procedure of pelicans permits the POA technique to converge to the optimum location in the hunting region, which improves the local searching ability and exploitation of the POA. In the mathematical model, this technique can check the locations close to the pelican position so that this method can converge to the optimum position.
In which refers to the existing iteration counts; denotes the maximal iteration counts; represents the constant that is obtaining the value of 0.2; indicates the novel state of pelican from the dimension from the second hunting stage; and refers to the equivalent fitness value from the novel state.
The POA system develops an FF to accomplish the best classifier performances. It explains a positive integer for depicting a good solution for the candidate performances. In this case, the minimized classifier errors suppose an FF, as expressed in Equation (22).
4. Results and Discussion
The performance analysis of the GJODL-CADC methodology is investigated on two datasets: the UNSWNB15 [27] and UCI SECOM [28] datasets. The UNSW-NB15 dataset has 42 features (excluding the labels) and 10 class labels (nine attacks and one normal) such as Normal, Fuzzers, Analysis, Exploits, Backdoors, Generic, Shellcode, DoS, Worms, and Reconnaissance. The GJODL-CADC technique has chosen 27 features from the UNSWNB15 dataset. Next, the UCI-SECOM dataset has 591 features with two classes. The GJODL-CADC model has selected 328 features.
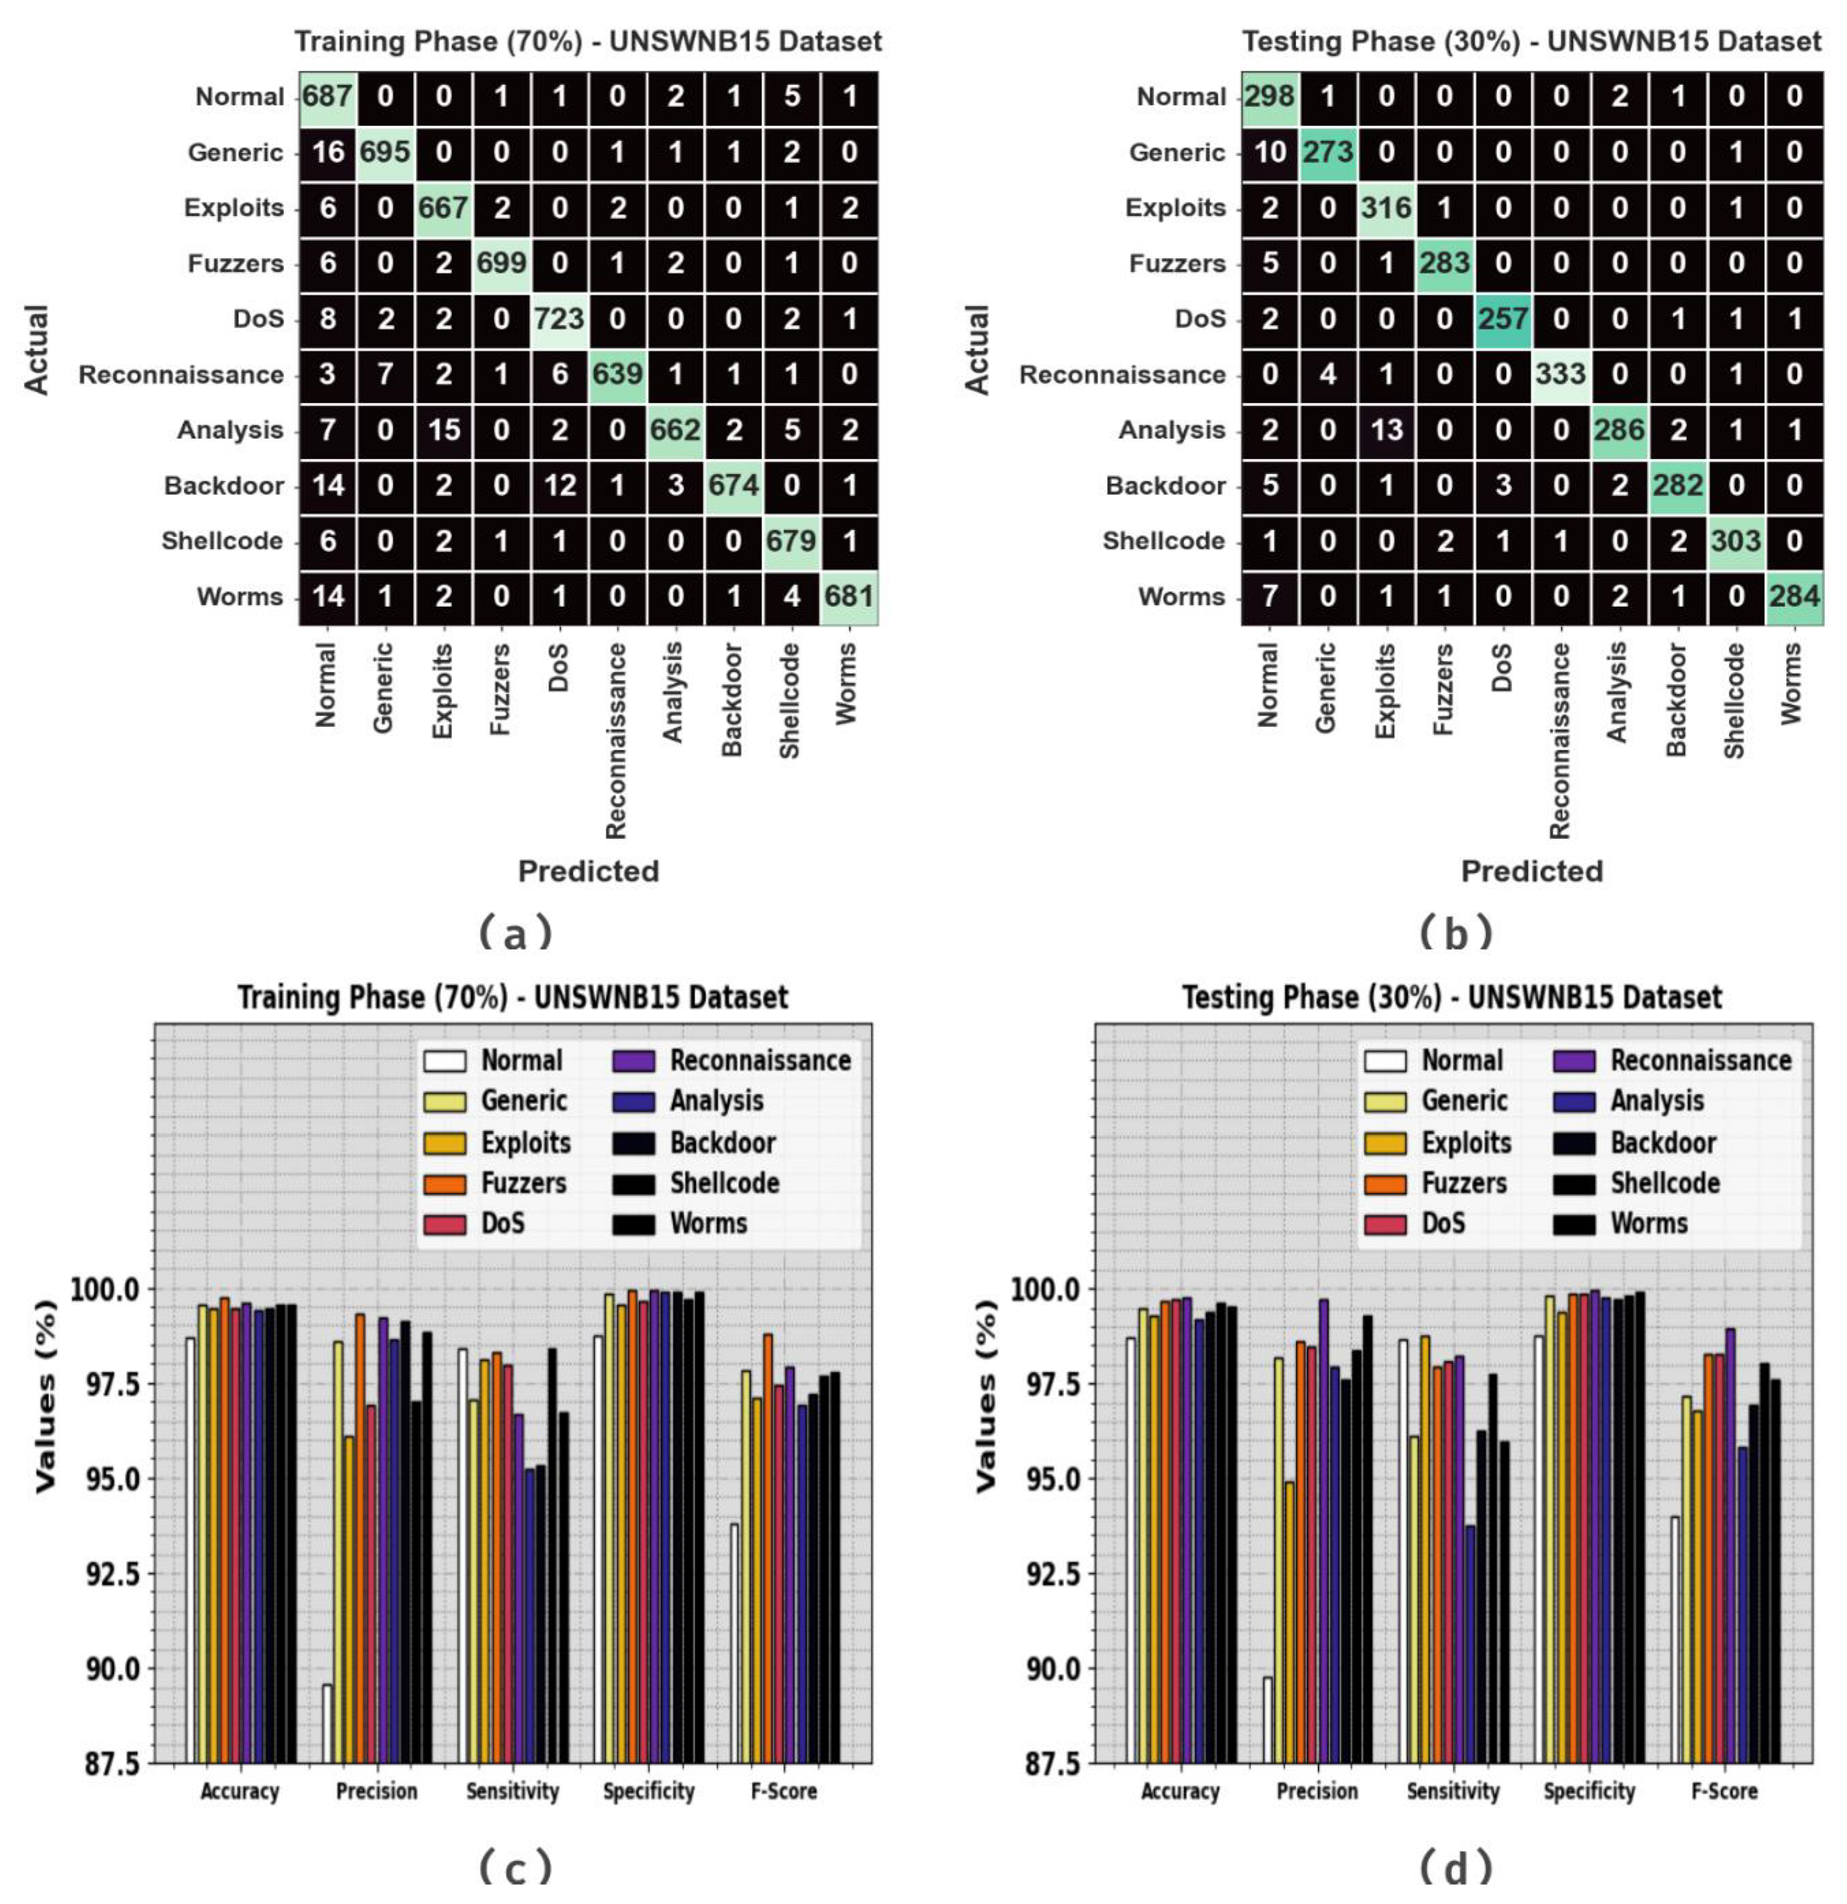
Figure 3 illustrates the classifier analysis of the GJODL-CADC algorithm on the UNSWNB15 dataset. Figure 3a,b represents the confusion matrix achieved via the GJODL-CADC technique on the TR set/TS set at a ratio of 70:30. This outcome represented that the GJODL-CADC system detected and classified all 10 classes accurately. Next, Figure 3c,d describes the classifier result of the GJODL-CADC technique on a ratio of 70:30 of the TR set/TS set. The experimental results demonstrated the effective classification of all types of class labels.
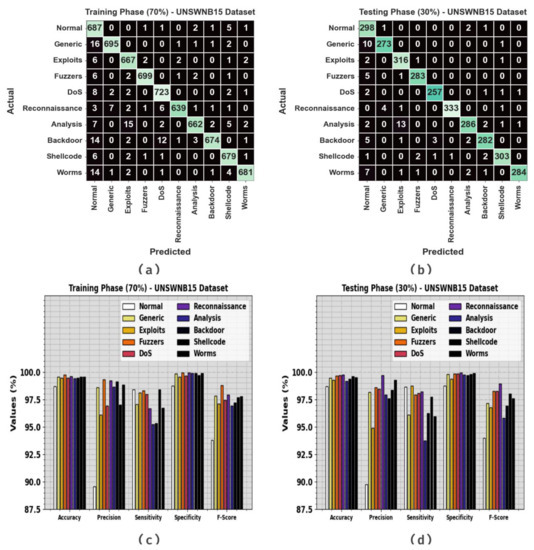
Figure 3.
UNSWNB15 dataset (a,b) confusion matrices and (c,d) classifier outcomes of the TR set/TS set at a 70:30 ratio.
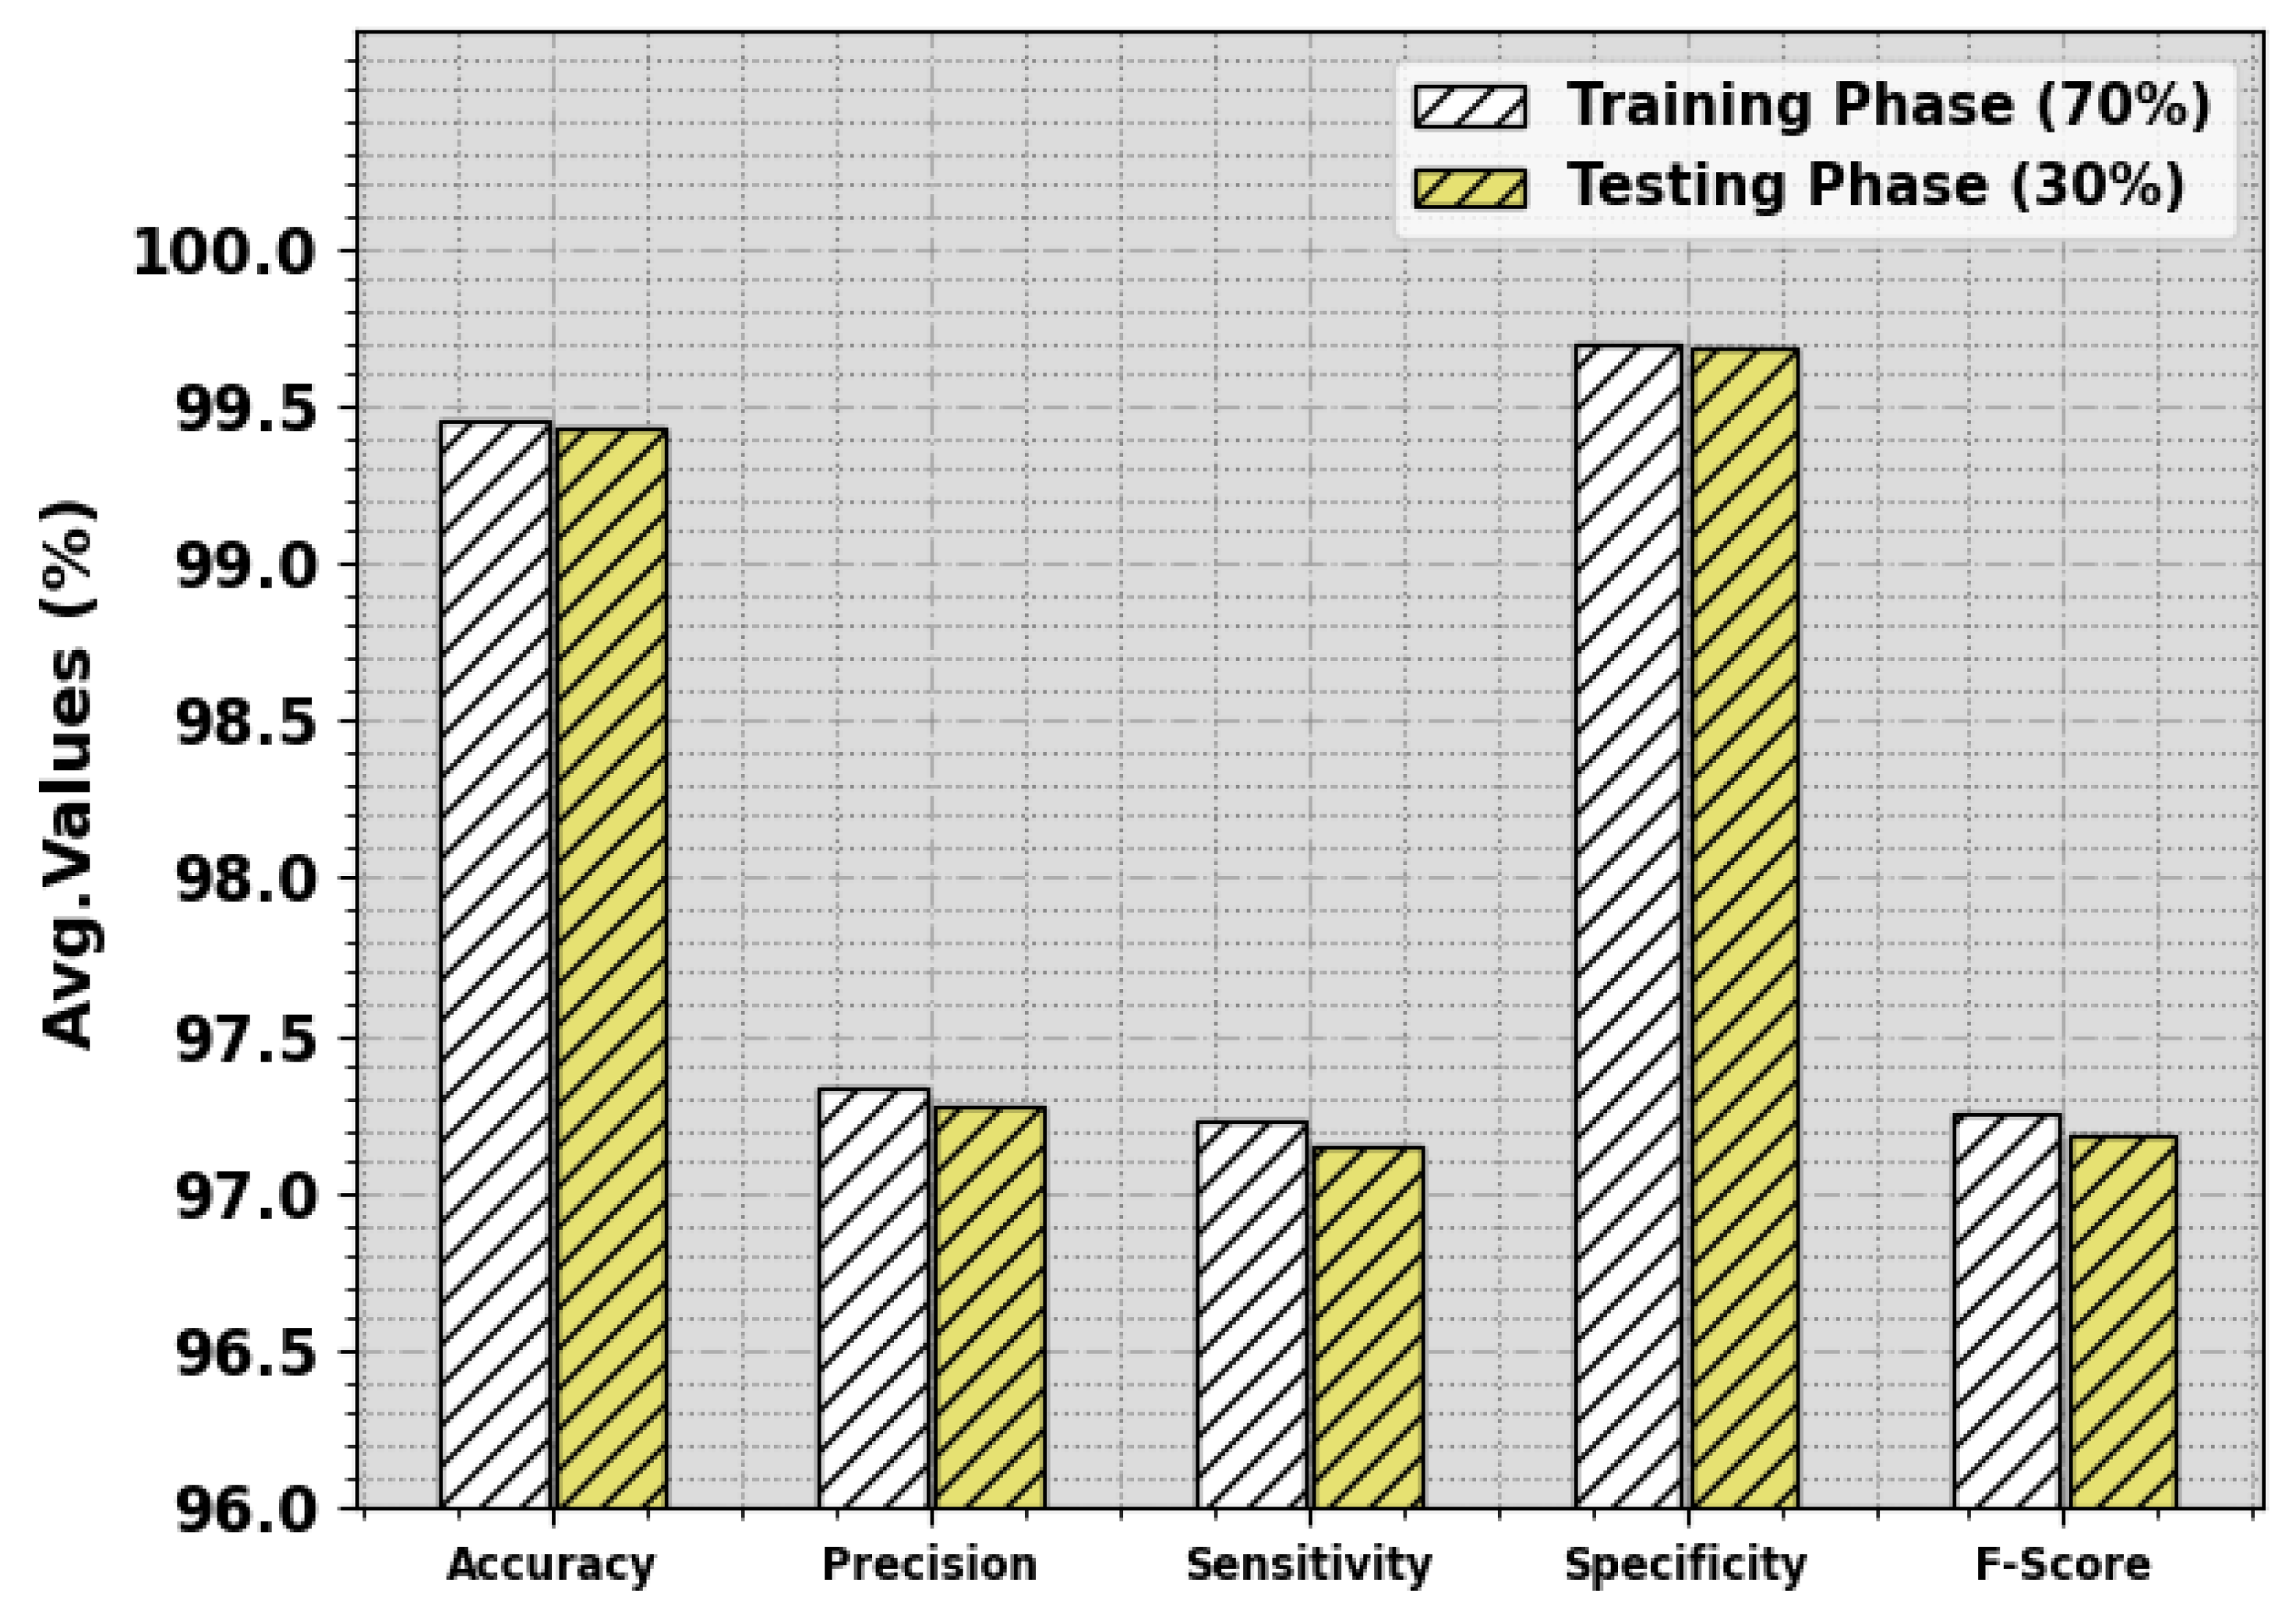
Table 1 and Figure 4 report the complete classifier results of the GJODL-CADC system on the UNSWNB15 database. The outcome value illustrated the effectual classification of all kinds of classes.

Table 1.
Classifier outcome of the GJODL-CADC approach on the UNSWNB15 dataset.

Figure 4.
Average of the GJODL-CADC approach on the UNSWNB15 dataset.
Figure 5 illustrates the training accuracy, denoted using and of the GJODL-CADC method on the UNSWNB15 dataset. The is defined by the estimation of the GJODL-CADC algorithm on the TR dataset, whereas the is calculated by evaluating the performance on a separate testing dataset. The experimental outcomes exhibited that the and rise with an upsurge in epochs. Therefore, the performance of the GJODL-CADC system becomes enhanced with the TR and TS dataset with an increase in the count of epochs.
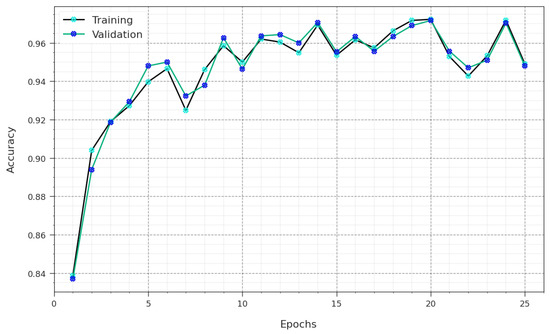
Figure 5.
curve of the GJODL-CADC method on the UNSWNB15 dataset.
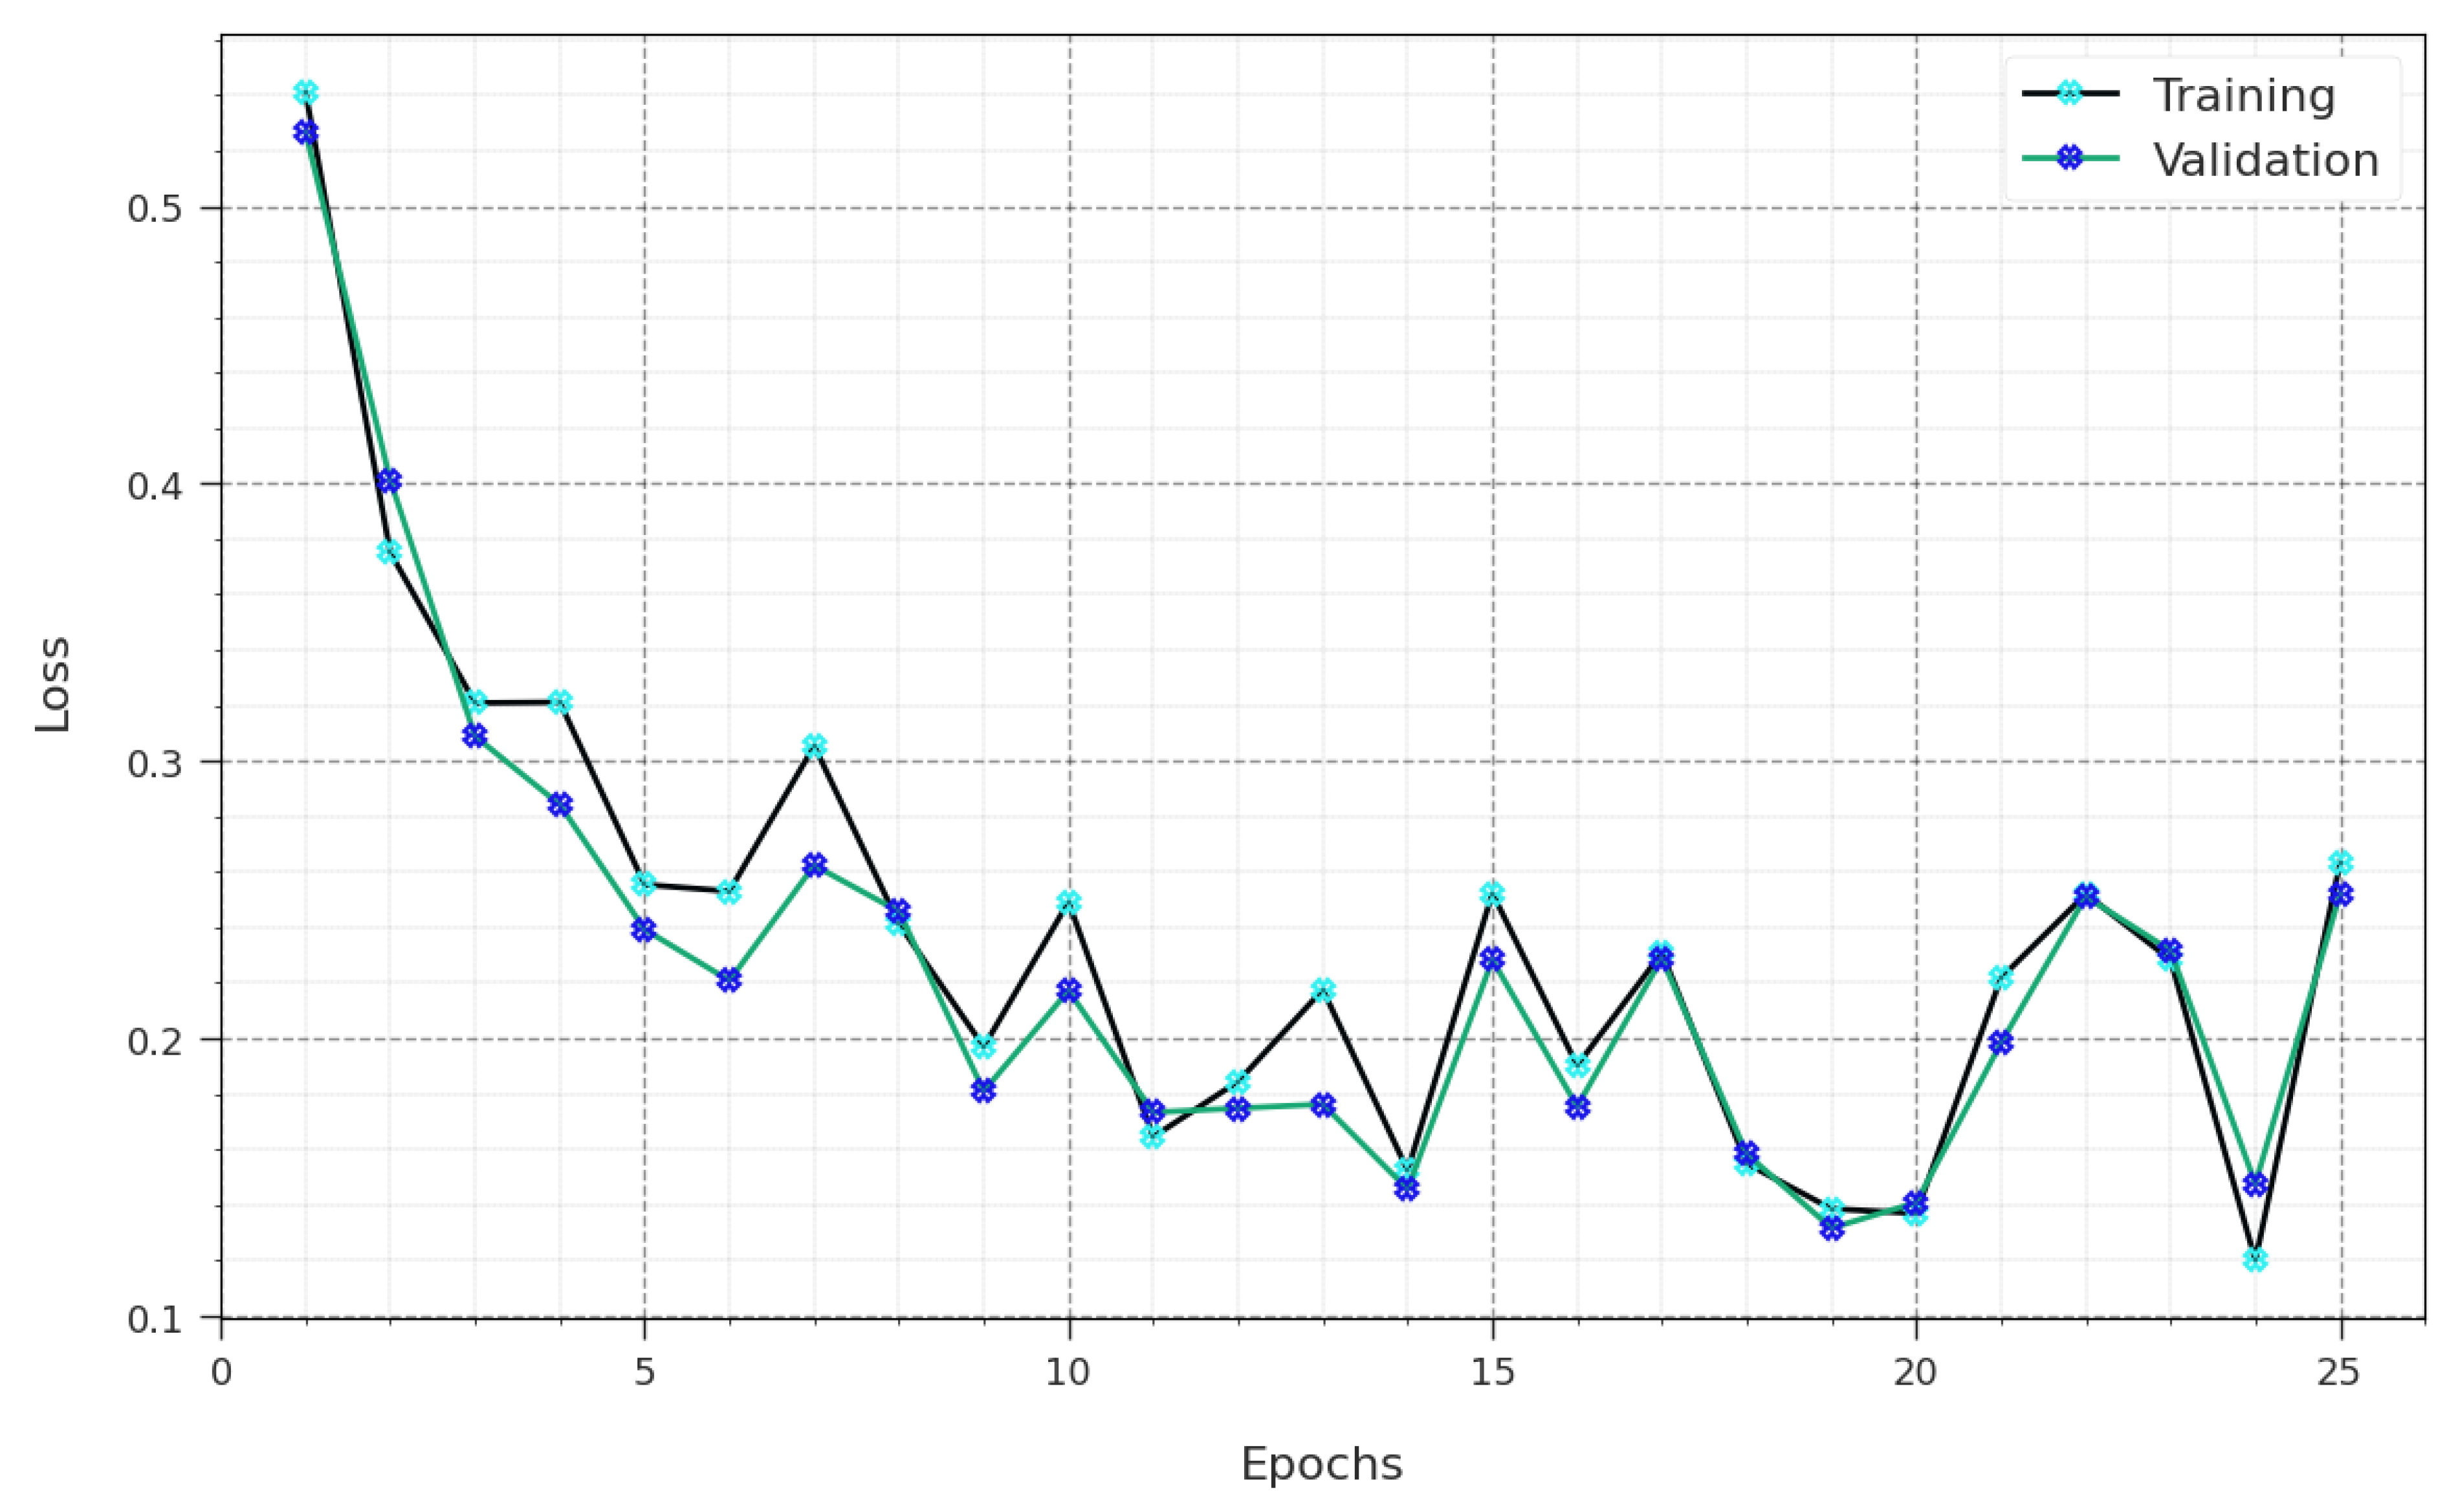
In Figure 6, the and analysis of the GJODL-CADC method on the UNSWNB15 dataset is demonstrated. The defines the error between the forecast performance and original values of the TR data. The denotes the measure of the performance of the GJODL-CADC approach on individual validation data. The outcomes specify that the and tend to reduce with increasing epochs. The outcomes depict the improved performance of the GJODL-CADC algorithm and its ability to generate accurate classification. The minimized values of and exhibit the higher performance of the GJODL-CADC approach on capturing relationships and patterns.
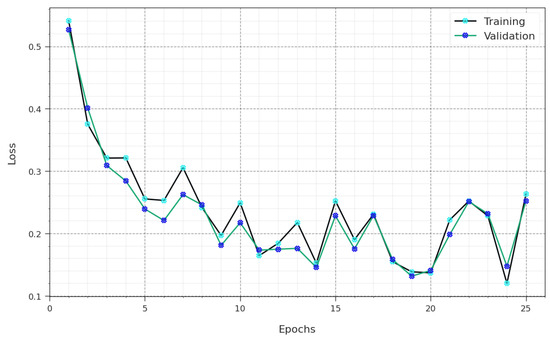
Figure 6.
Loss curve of the GJODL-CADC method on the UNSWNB15 database.
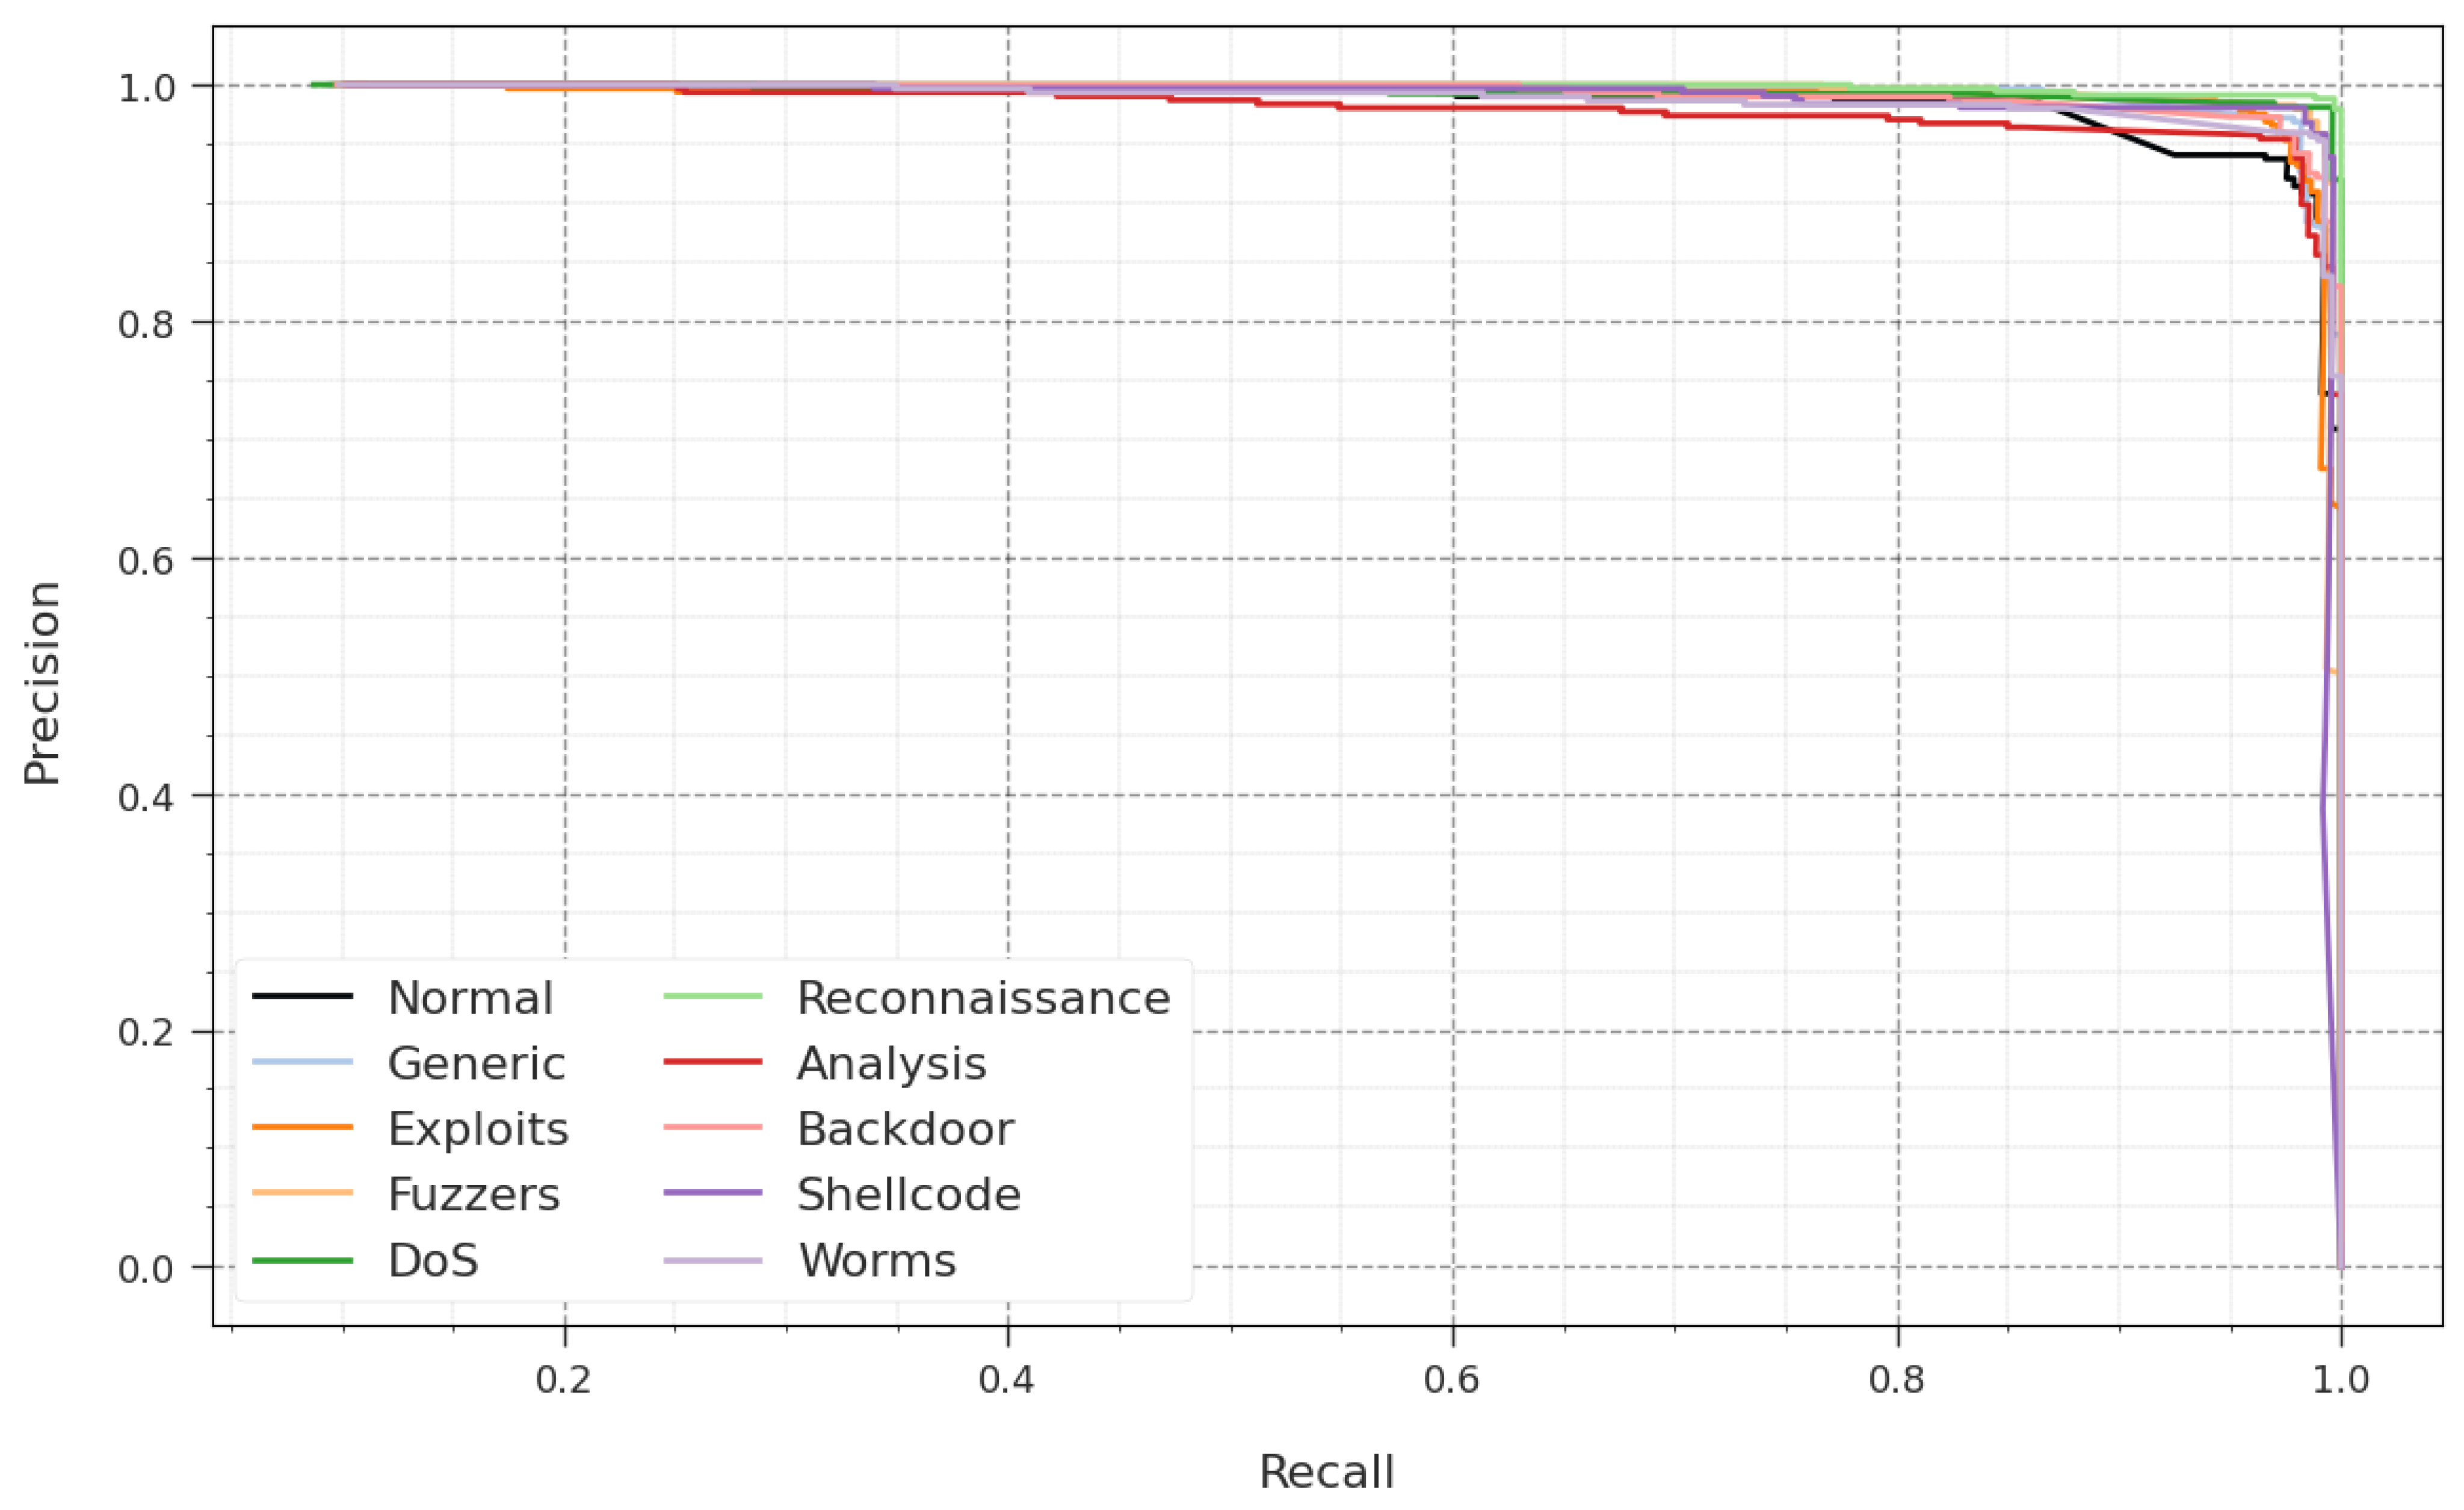
A comprehensive PR analysis of the GJODL-CADC technique is revealed in the UNSWNB15 2015 database in Figure 7. The results described that the GJODL-CADC system leads to raising values of PR. Further, the GJODL-CADC system can achieve greater PR values on all class labels.
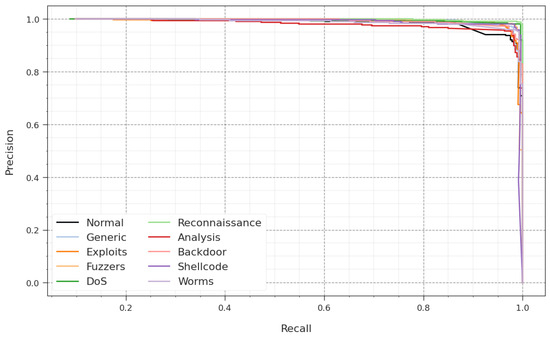
Figure 7.
PR curve of the GJODL-CADC approach on the UNSWNB15 dataset.
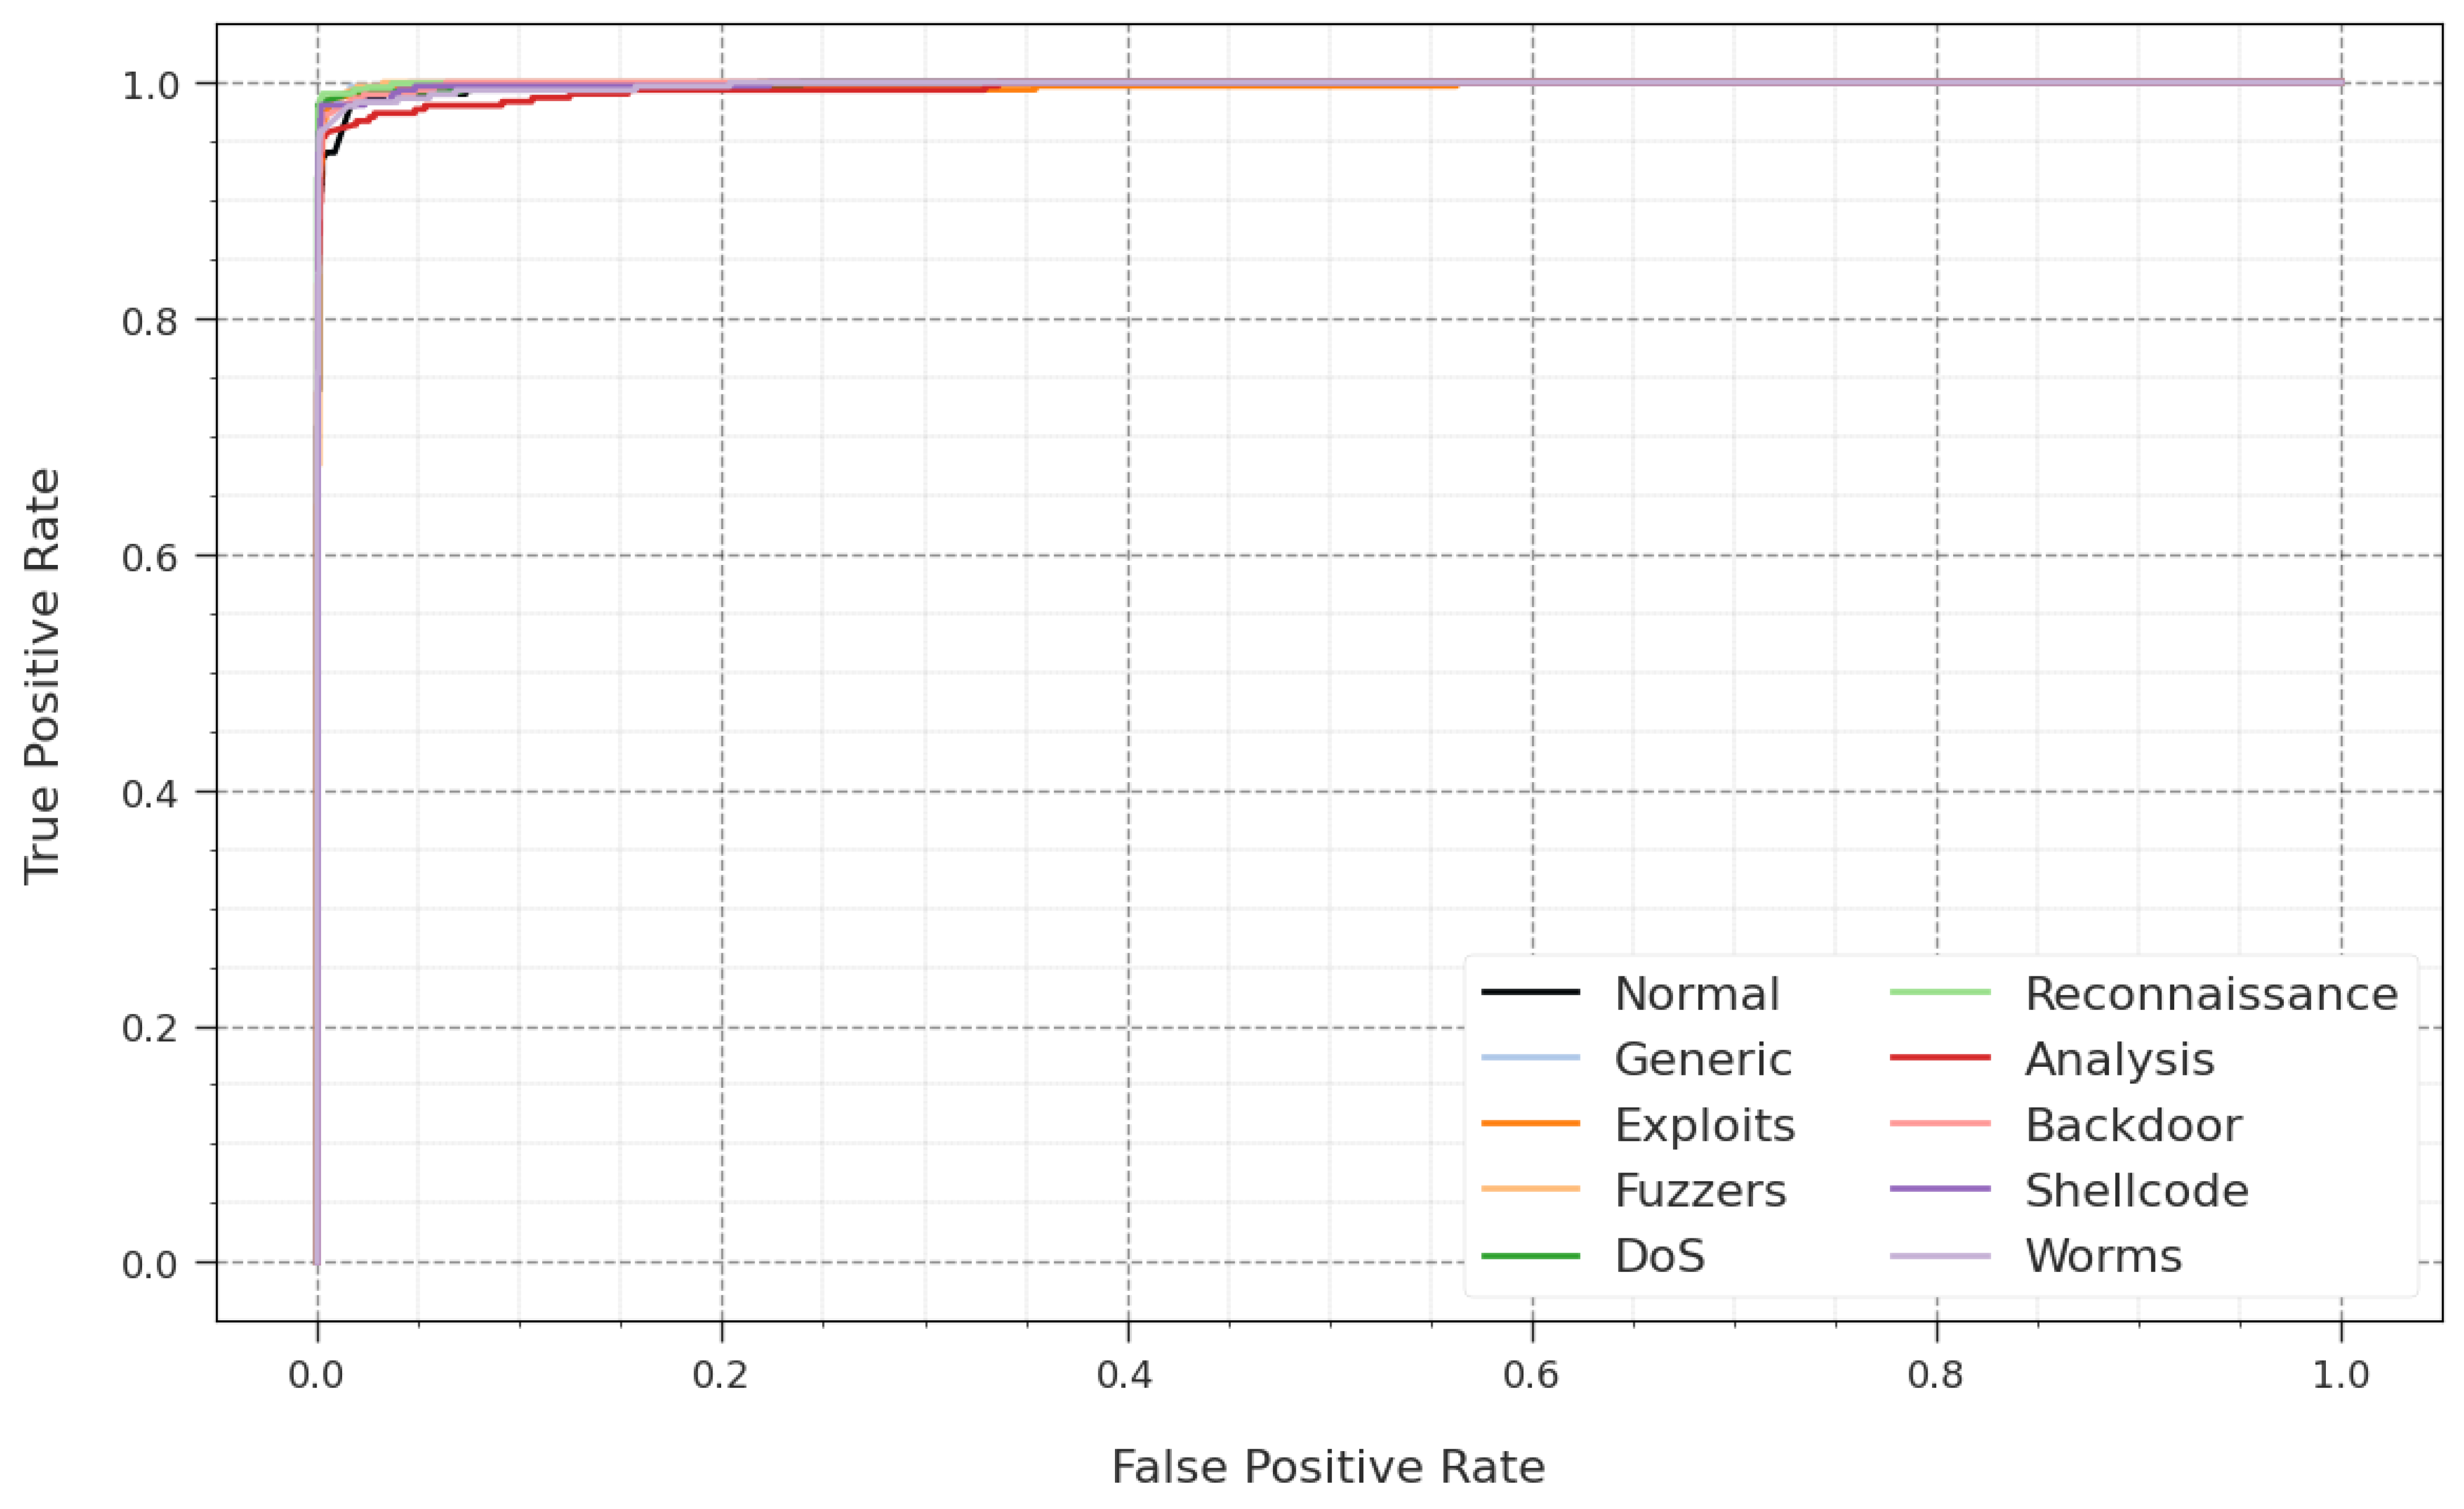
In Figure 8, an ROC analysis of the GJODL-CADC approach is demonstrated on the UNSWNB15 dataset. The outcome defined that the GJODL-CADC algorithm led to greater ROC values. Also, the GJODL-CADC system can extend higher ROC values on all class labels.
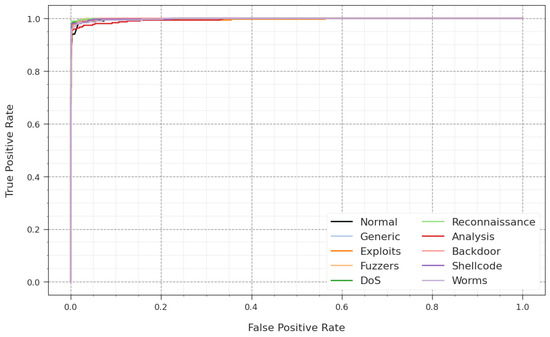
Figure 8.
ROC curve of the GJODL-CADC system on the UNSWNB15 database.
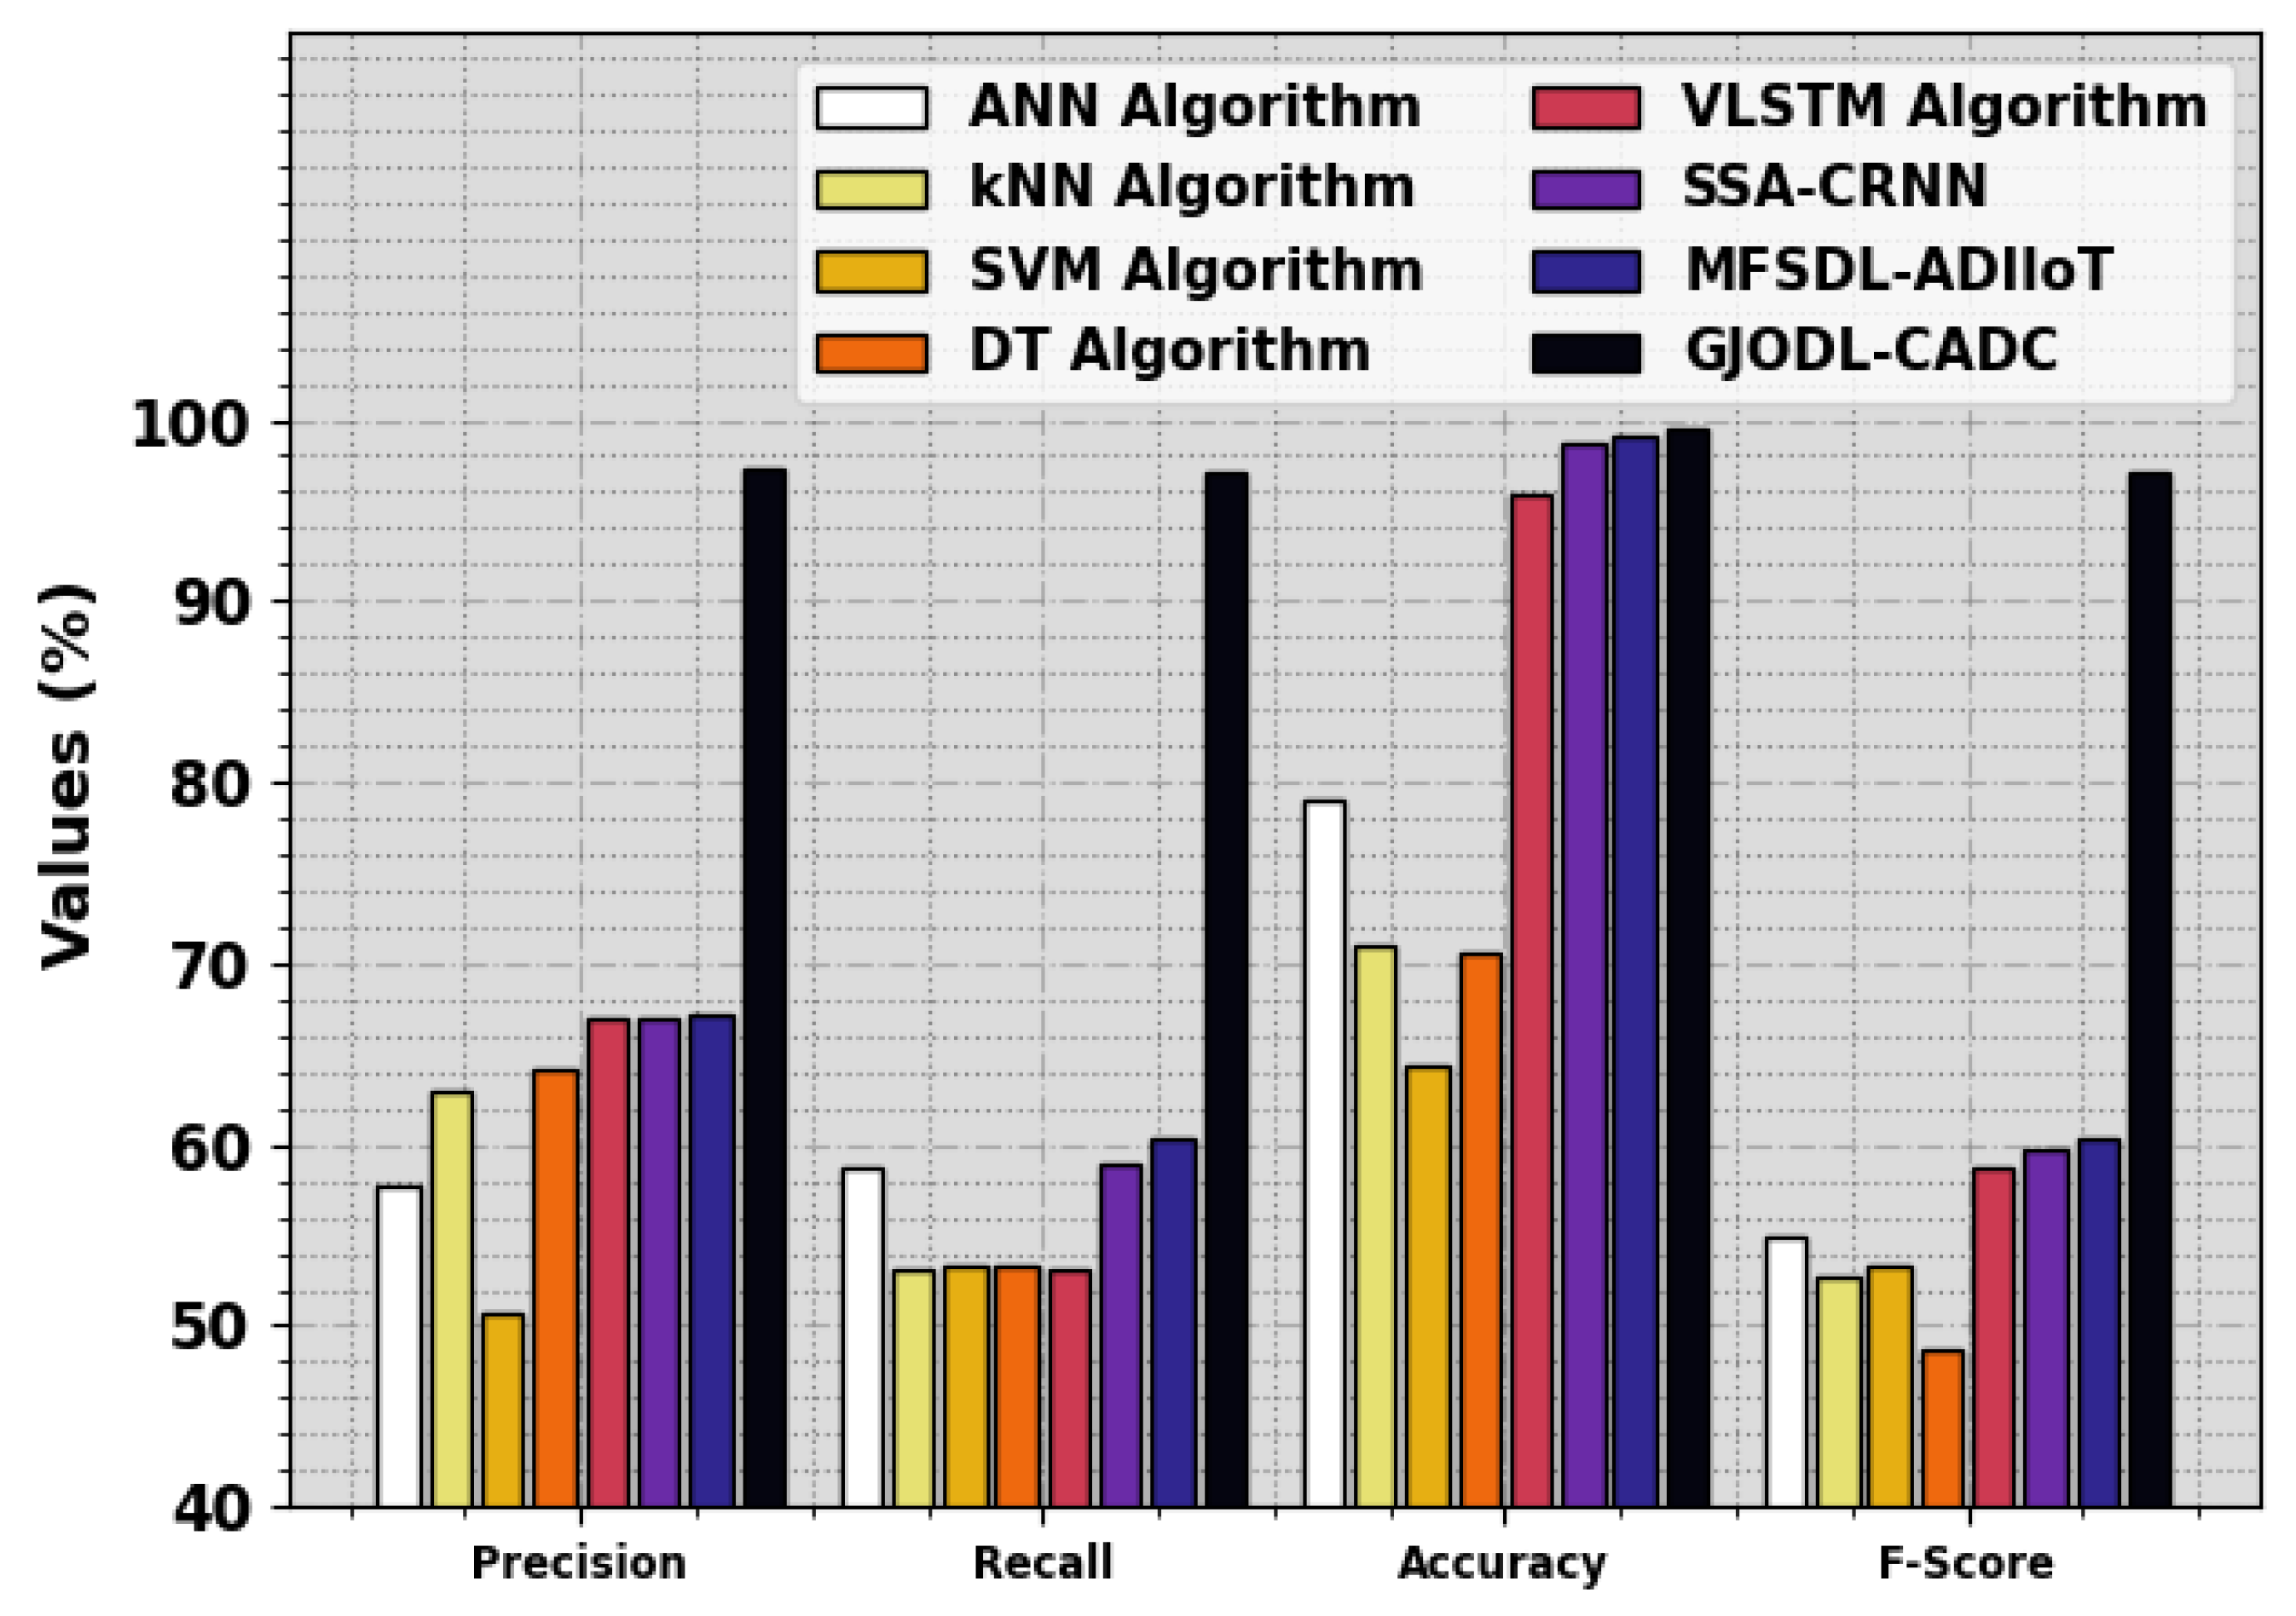
In Figure 9, a brief comparison analysis of the GJODL-CADC technique with existing techniques was made using the UN-SWNB15 dataset [29,30,31,32]. The results described that the ANN and SVM models exhibit poor performance. At the same time, the kNN, DT, VLSTM, MFSDL-ADIIoT, and SSA-CRNN techniques have obtained slightly boosted performance. However, the GJODL-CADC technique exhibits better performance with maximum , , , and percentages of 97.28%, 97.15%, 99.45%, and 97.18%, respectively.
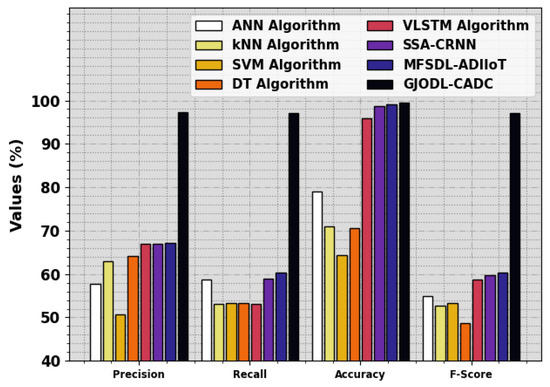
Figure 9.
Comparative analysis of the GJODL-CADC method on the UNSWNB15 dataset.
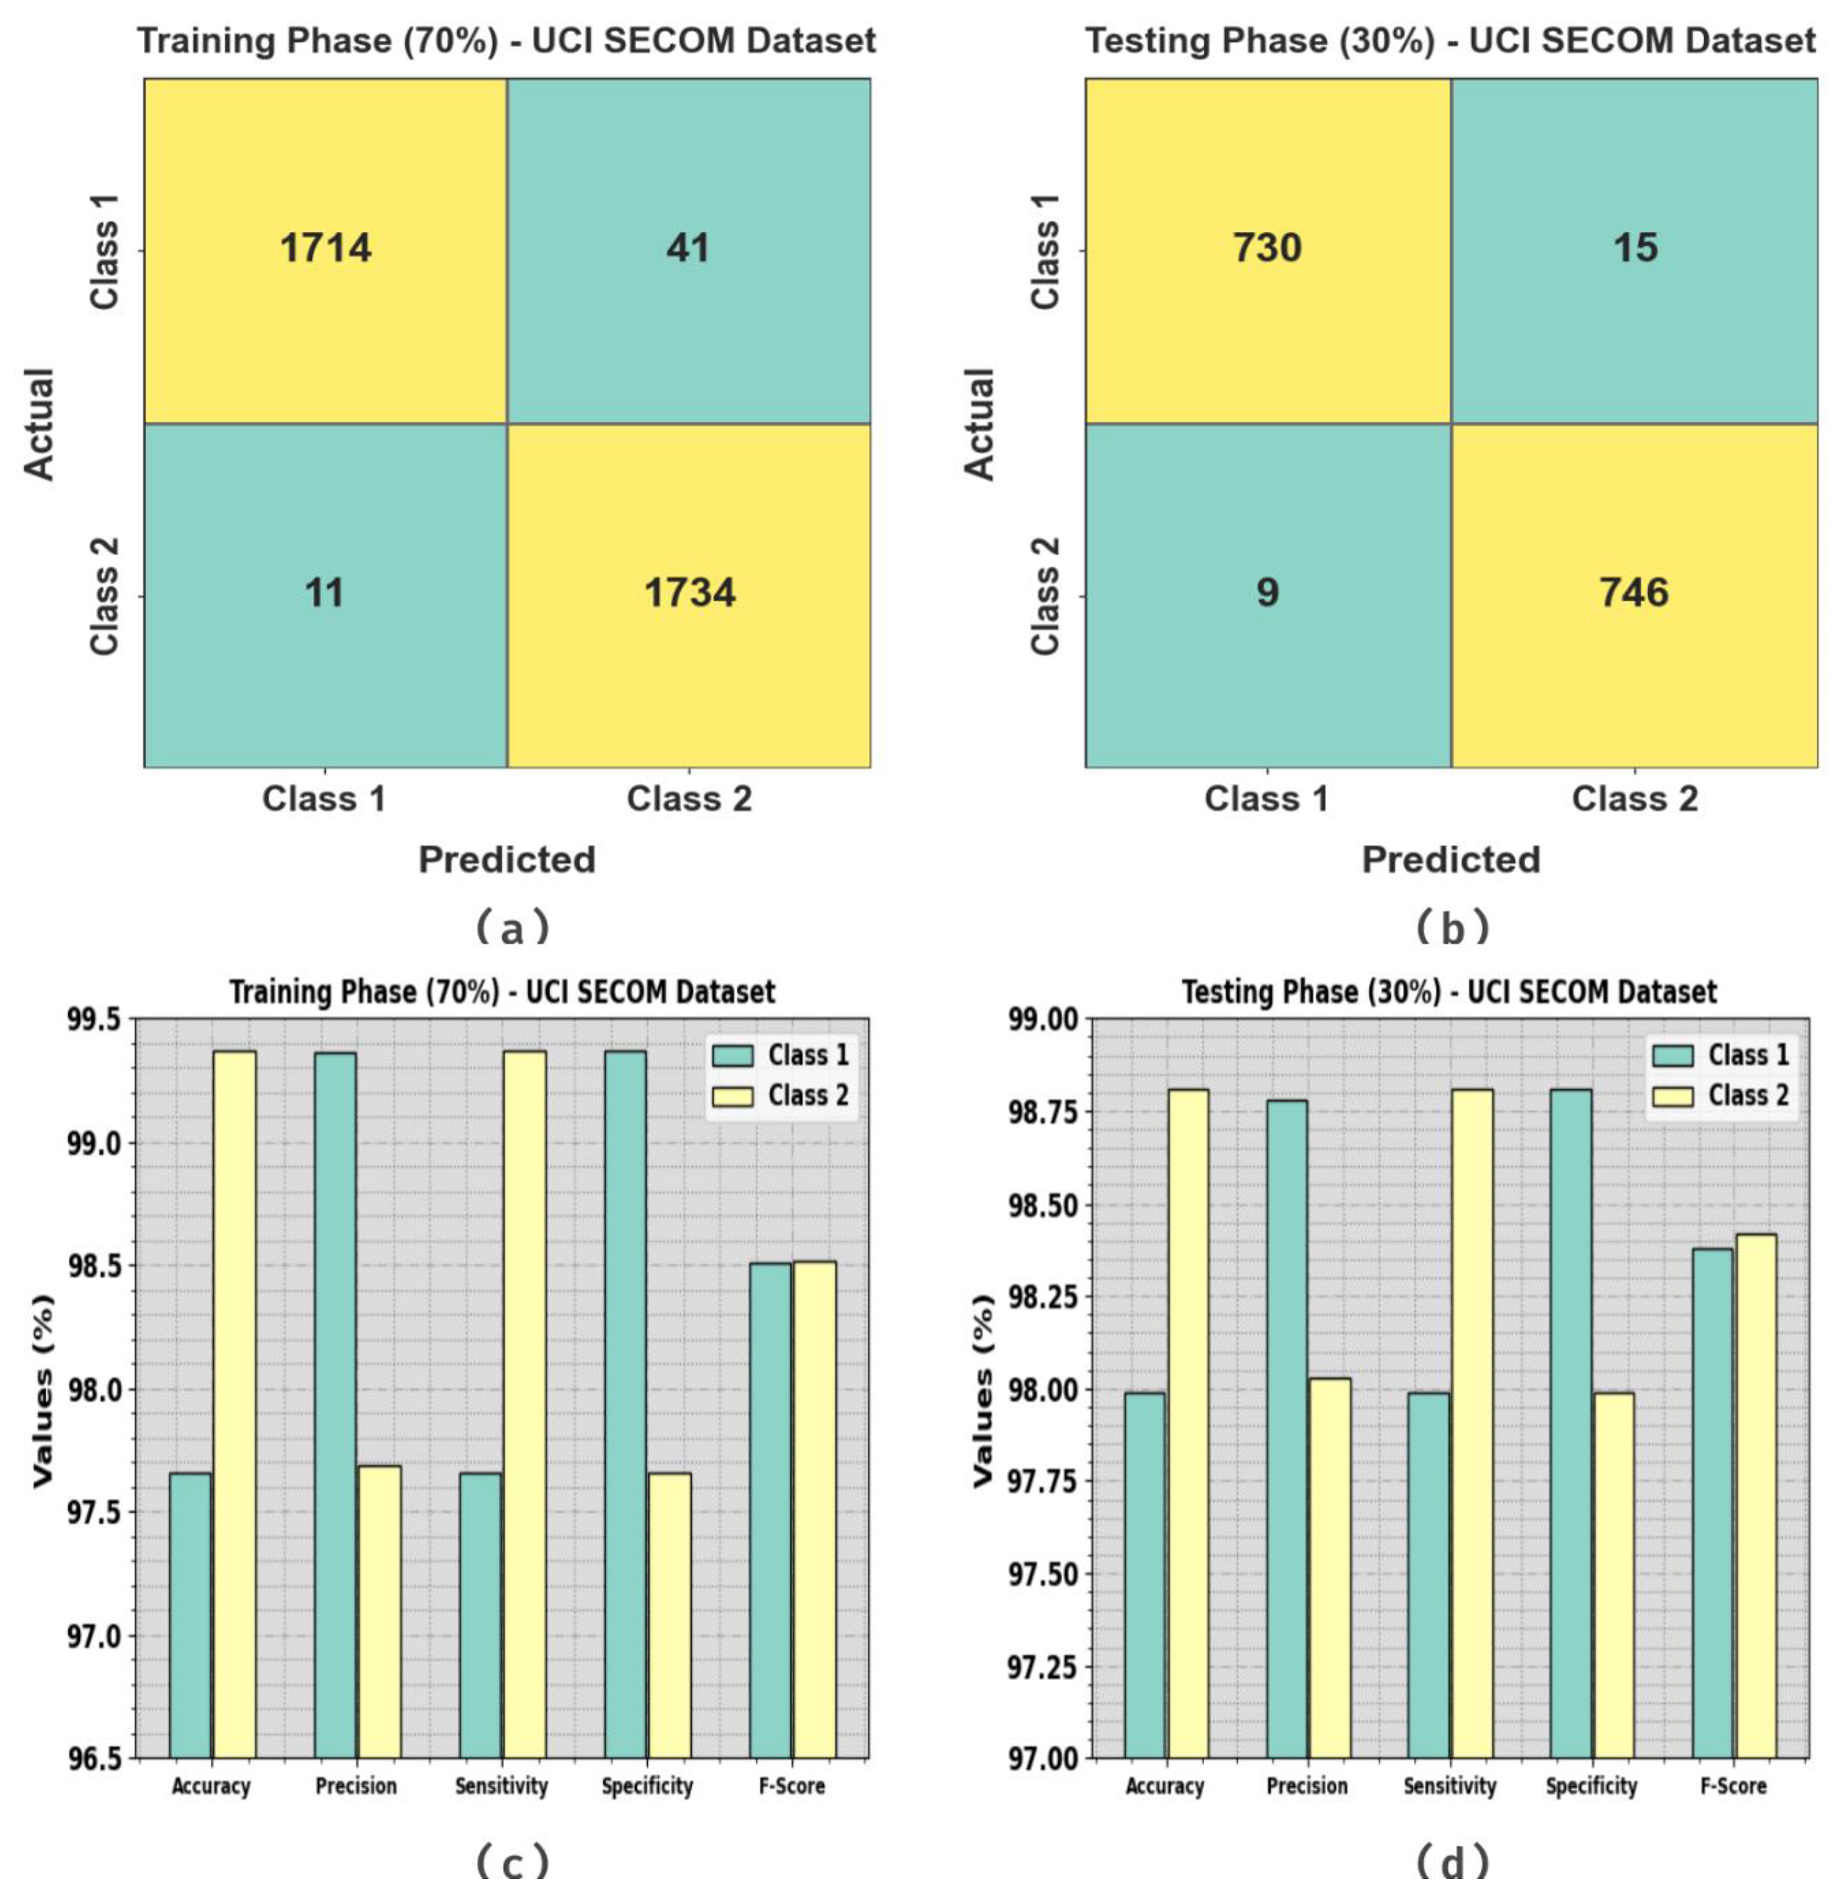
Figure 10 shows the classifier study of the GJODL-CADC method on the UCI SECOM dataset. Figure 10a,b represents the confusion matrix attained via the GJODL-CADC technique on a 70:30 ratio of the TR set/TS set. The outcome signified that the GJODL-CADC method has detected and classified all 10 classes accurately. Then, Figure 10c,d represents the classifier results of the GJODL-CADC approach on a 70:30 ratio of the TR set/TS set. The experimental results show the efficient classification of all kinds of class labels.

Figure 10.
UCI SECOM dataset (a,b) confusion matrices and (c,d) classifier outcomes on a 70:30 ratio of the TR set/TS set.
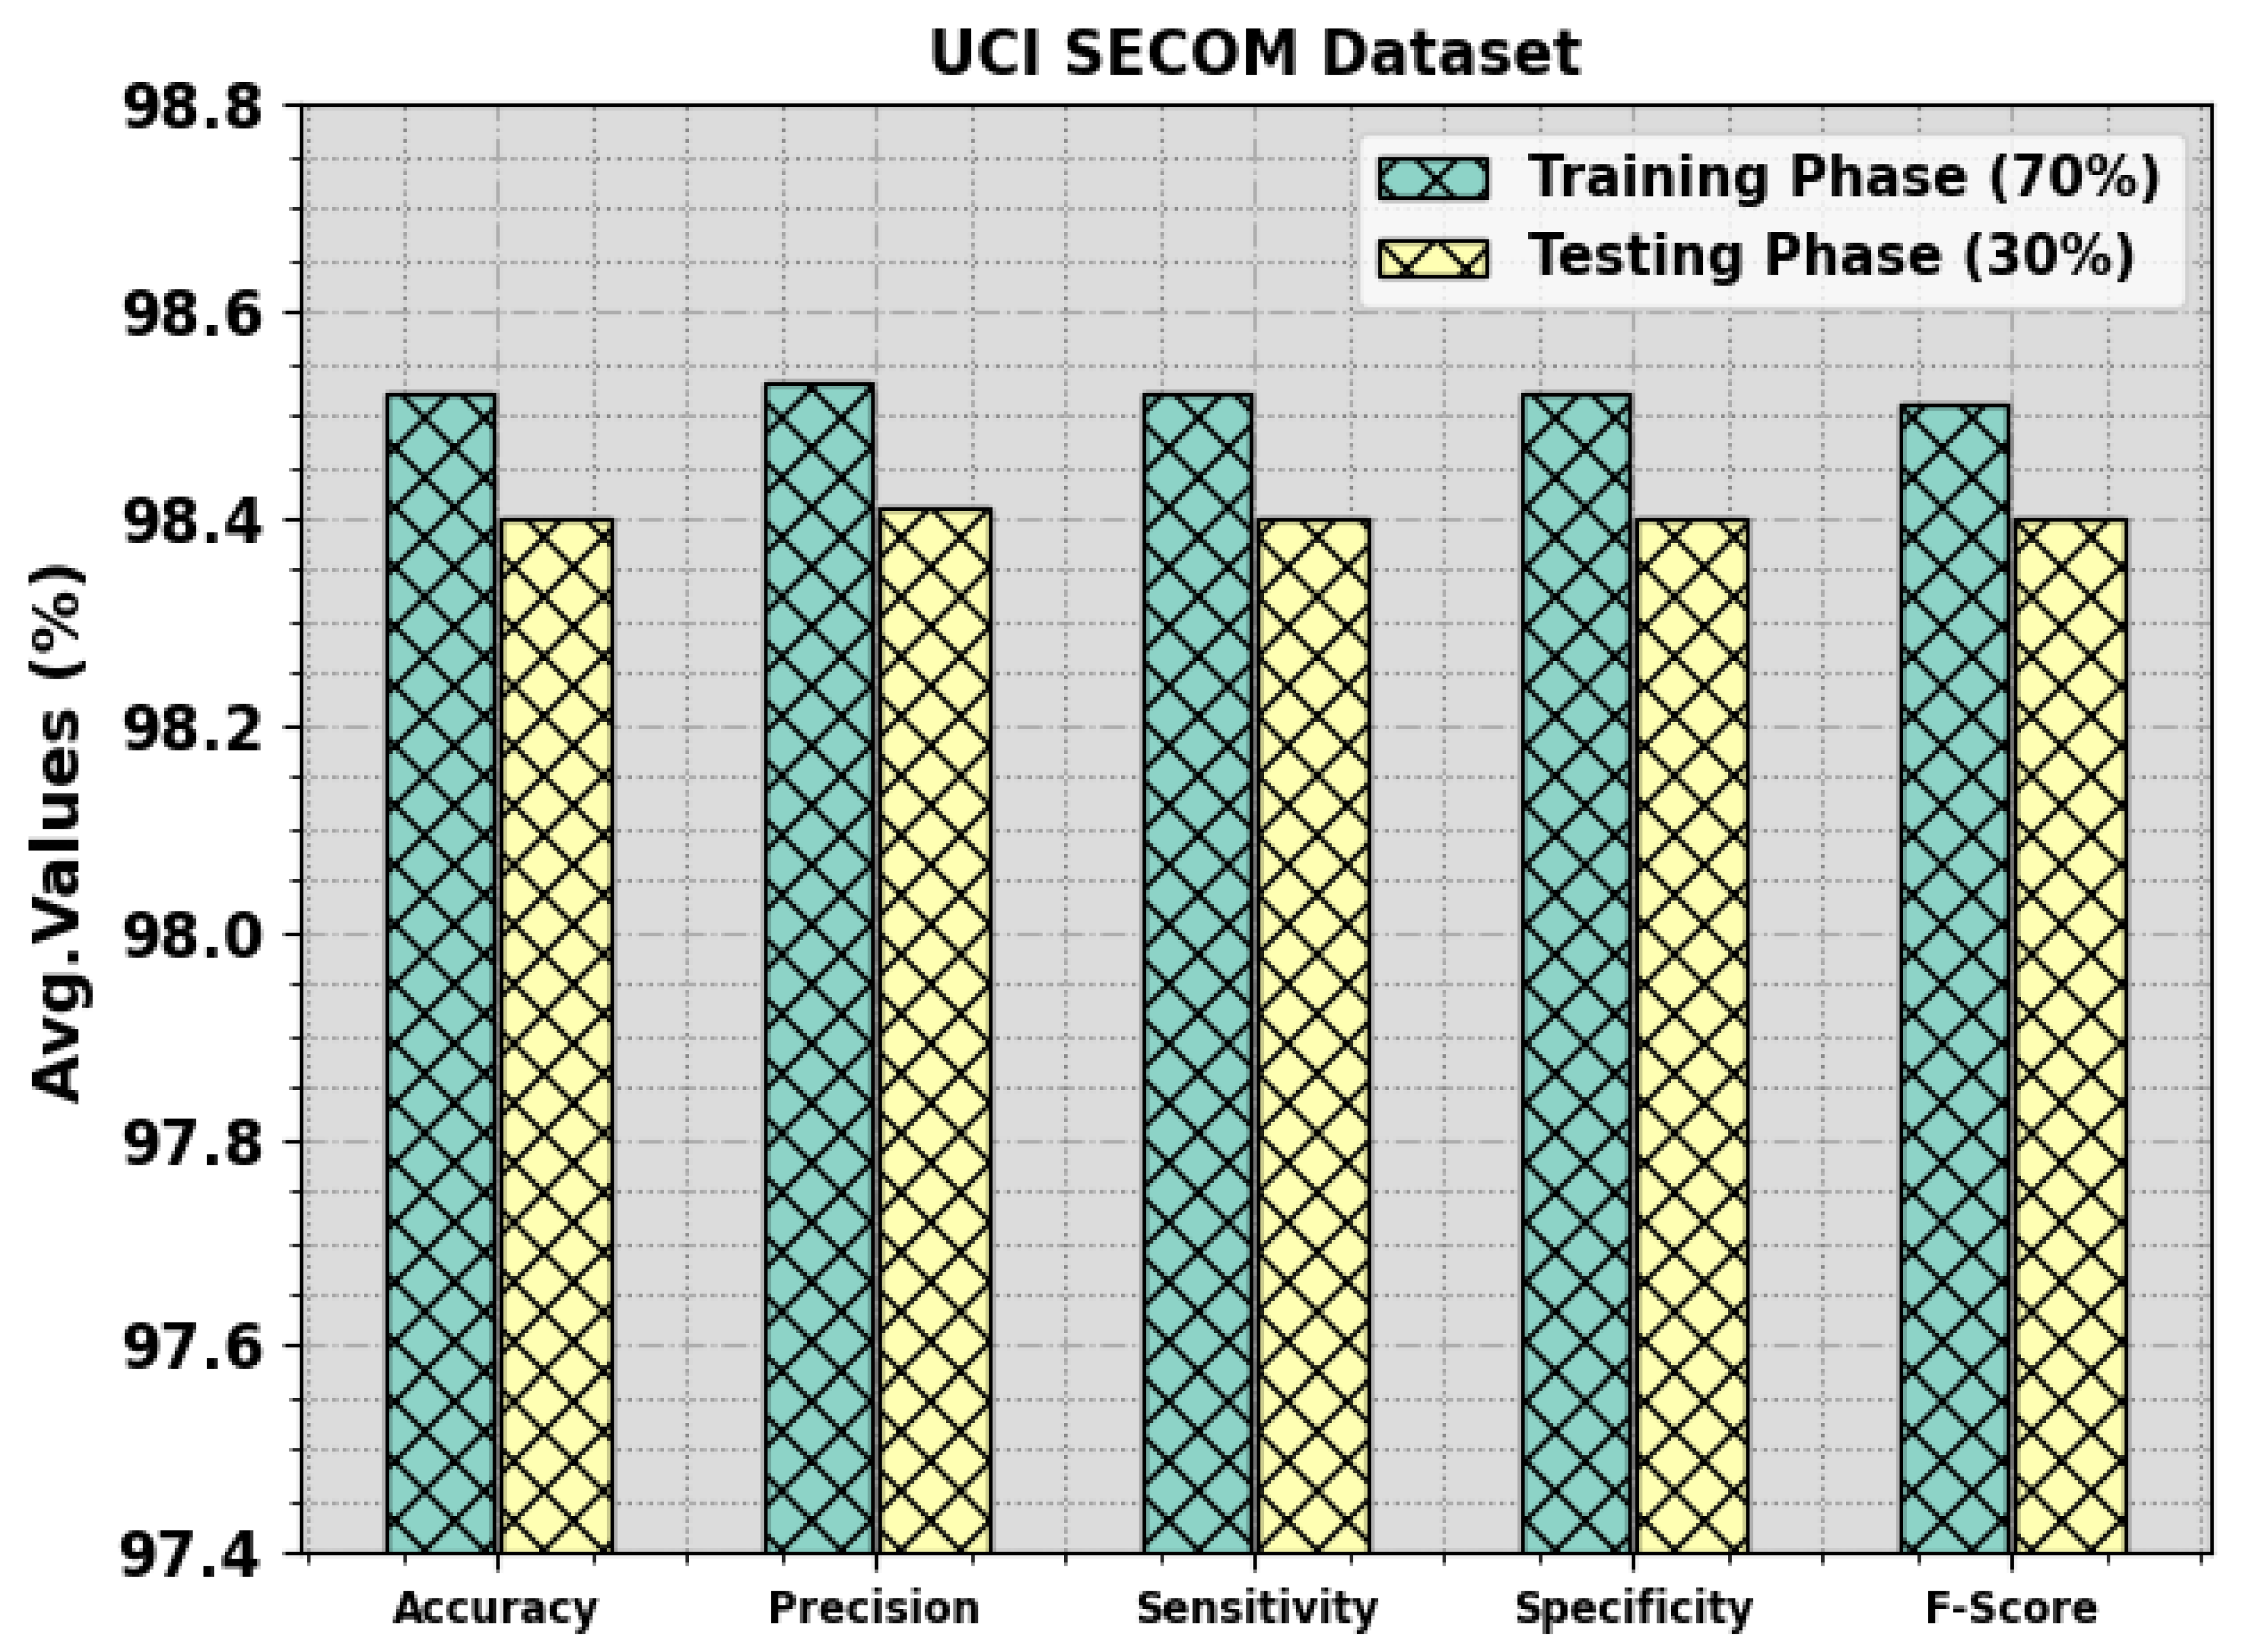
Table 2 and Figure 11 report a complete classifier analysis of the GJODL-CADC methodology based on the UCI SECOM database. The investigational results demonstrated the effective classification of all kinds of class labels. For 70% of the TR set, the GJODL-CADC approach gains average , , , , and percentages of 98.52%, 98.53%, 98.52%, 98.52%, and 98.51%, respectively. Then, for 30% of the TS set, the GJODL-CADC method gains average , , , , and percentages of 98.40%, 98.41%, 98.40%, 98.40%, and 98.40%, correspondingly.
Table 2.
Classifier outcomes of the GJODL-CADC approach on the UCI SECOM database.
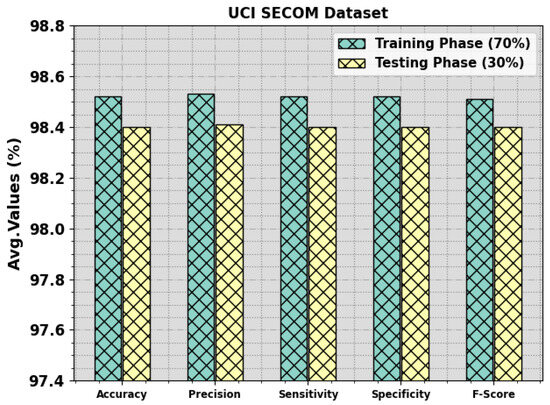
Figure 11.
Average of the GJODL-CADC approach on the UCI SECOM database.
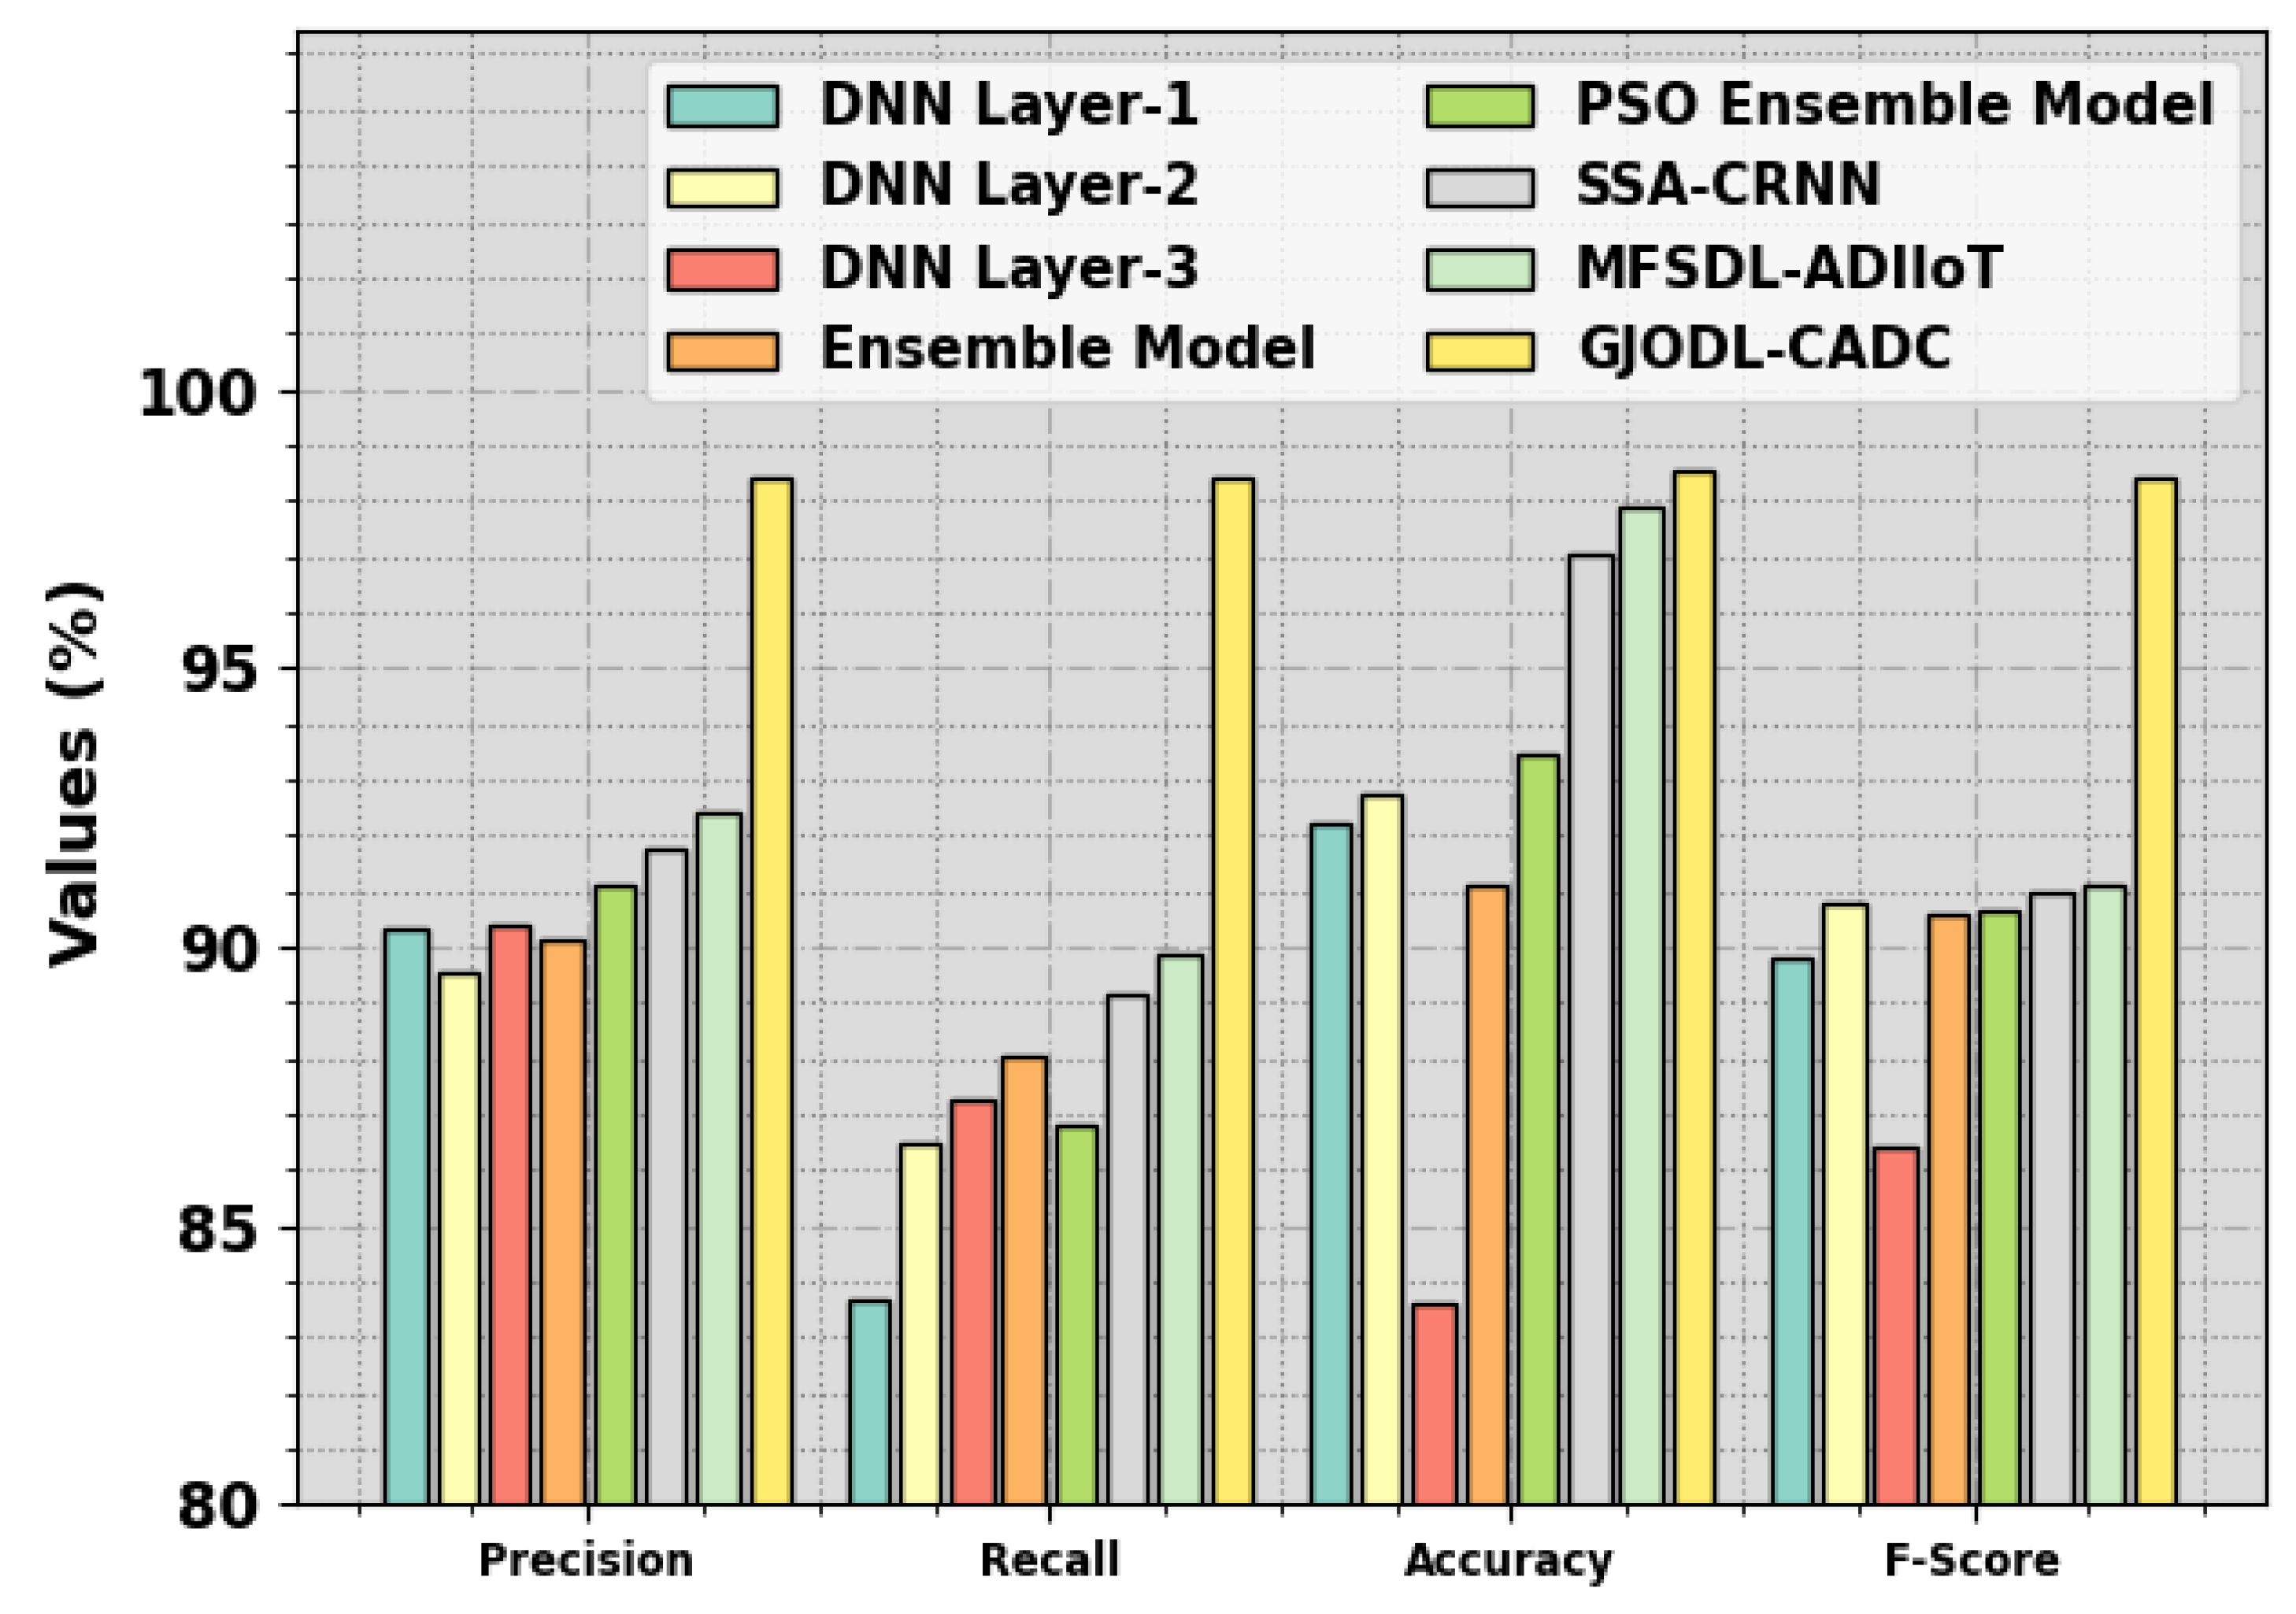
In Figure 12, a detailed comparison result of the GJODL-CADC algorithm with the current methods was made. The outcome indicated that the DNN Layer-1 and DNN Layer-2 techniques exhibit poor performance. Simultaneously, the DNN Layer-3, Ensemble, PSO Ensemble, SSA-CRNN, and MFSDL-ADIIoT systems have acquired slightly increased performance. But the GJODL-CADC approach reveals its higher performance, with maximum , , , and percentages of 98.41%, 98.40%, 98.52%, and 98.40%, correspondingly. These outcomes showcase the enhanced performance of the GJODL-CADC method. The enhanced performance of the proposed model is due to the incorporation of the GJO-based feature subset selection and the POA-based hyperparameter tuning.

Figure 12.
Comparative outcomes of the GJODL-CADC approach on the UCI SECOM database.
5. Conclusions
This study has developed a novel GJODL-CADC technique for cyberattack detection and classification in the IIoT platform. The goal of the GJODL-CADC system lies in the detection and classification of cyberattacks in the IoT environment. To obtain this, the GJODL-CADC algorithm comprises three major processes, namely GJO-based feature selection, AE-DBN-based detection, and POA-based hyperparameter tuning. The effectiveness of the AE-DBN model can be improved through the design of the POA, which in turn improves the detection rate. To demonstrate the greater outcomes of the GJODL-CADC technique, a widespread set of simulations were executed. The extensive outcomes demonstrated the promising outcomes of the GJODL-CADC technique compared to recent models, with maximum accuracy ratings of 99.45% and 98.52% on the UN-SWNB15 and UCI SECOM databases. Thus, the GJODL-CADC technique can be applied for effectual cyberattack recognition in the IIoT environment. Future works can investigate the performance of the proposed model on large-scale databases. In addition, the proposed model can focus on resolving outlier detection and class imbalance data handling problems.
Author Contributions
Conceptualization, M.R.; methodology, L.A.M. and M.R.; software, I.R.A.; validation, L.A.M., I.R.A. and Z.M.A.; formal analysis, L.A.M. and M.R.; investigation, D.A. and D.H.; resources, I.R.A., D.A., Z.M.A. and D.H.; data curation, D.A., Z.M.A. and D.H.; writing—original draft, L.A.M. and M.R.; writing—review and editing, D.A.; visualization, I.R.A. and Z.M.A.; supervision, M.R.; funding acquisition, D.H. All authors have read and agreed to the published version of the manuscript.
Funding
This research was funded by the Institutional Fund Projects under grant no. (IFPIP: 1946-145-1443). Therefore, the authors gratefully acknowledge the technical and financial support provided by the Ministry of Education and the Deanship of Scientific Research (DSR), King Abdulaziz University (KAU), Jeddah, Saudi Arabia.
Data Availability Statement
Data sharing does not apply to this article as no datasets were generated during the current study.
Conflicts of Interest
The authors declare that they have no conflict of interest.
References
- Li, F.; Lin, J.; Han, H. FSL: Federated sequential learning-based cyberattack detection for Industrial Internet of Things. Ind. Artif. Intell. 2023, 1, 4. [Google Scholar] [CrossRef]
- Khan, F.; Jan, M.A.; Alturki, R.; Alshehri, M.D.; Shah, S.T.; ur Rehman, A. A Secure Ensemble Learning-Based Fog-Cloud Approach for Cyberattack Detection in IoMT. IEEE Trans. Ind. Inform. 2023, 19, 10125–10132. [Google Scholar] [CrossRef]
- Alkahtani, H.; Aldhyani, T.H. Intrusion detection system to advance Internet of Things infrastructure-based deep learning algorithms. Complexity 2021, 2021, 5579851. [Google Scholar] [CrossRef]
- Alatawi, T.; Aljuhani, A. Anomaly Detection Framework in Fog-to-Things Communication for Industrial Internet of Things. Comput. Mater. Contin. 2022, 73, 1067–1086. [Google Scholar] [CrossRef]
- Rouzbahani, H.M.; Bahrami, A.H.; Karimipour, H. A snapshot ensemble deep neural network model for attack detection in the industrial internet of things. In AI-Enabled Threat Detection and Security Analysis for Industrial IoT; Springer: Cham, Switzerland, 2021; pp. 181–194. [Google Scholar]
- Hinton, G.E.; Osindero, S.; Teh, Y.W. A fast learning algorithm for deep belief nets. Neural Comput. 2006, 18, 1527–1554. [Google Scholar] [CrossRef] [PubMed]
- Moustafa, N.; Slay, J. UNSW-NB15: A comprehensive data set for network intrusion detection systems (UNSW-NB15 network data set). In Proceedings of the 2015 Military Communications and Information Systems Conference (MilCIS), Canberra, Australia, 10–12 November 2015; IEEE: Piscataway, NJ, USA, 2015; pp. 1–6. [Google Scholar]
- Chopra, N.; Ansari, M.M. Golden jackal optimization: A novel nature-inspired optimizer for engineering applications. Expert Syst. Appl. 2022, 198, 116924. [Google Scholar] [CrossRef]
- Zhou, M.G.; Cao, X.Y.; Lu, Y.S.; Wang, Y.; Bao, Y.; Jia, Z.Y.; Fu, Y.; Yin, H.L.; Chen, Z.B. Experimental quantum advantage with quantum coupon collector. Research 2022, 2022, 798679. [Google Scholar] [CrossRef]
- Trojovský, P.; Dehghani, M. Pelican optimization algorithm: A novel nature-inspired algorithm for engineering applications. Sensors 2022, 22, 855. [Google Scholar] [CrossRef]
- Tomar, K.; Bisht, K.; Joshi, K.; Katarya, R. Cyber Attack Detection in IoT using Deep Learning Techniques. In Proceedings of the 2023 6th International Conference on Information Systems and Computer Networks (ISCON), Mathura, India, 3–4 March 2023; IEEE: Piscataway, NJ, USA, 2023; pp. 1–6. [Google Scholar]
- Kumar, R.; Tripathi, R. DBTP2SF: A deep blockchain-based trustworthy privacy-preserving secured framework in industrial Internet of things systems. Trans. Emerg. Telecommun. Technol. 2021, 32, e4222. [Google Scholar] [CrossRef]
- Al-Hawawreh, M.; Hossain, M.S. A privacy-aware framework for detecting cyber attacks on the internet of Medical Things systems using data fusion and quantum deep learning. Inf. Fusion 2023, 14, 101889. [Google Scholar] [CrossRef]
- Alalayah, K.M.; Alrayes, F.S.; Alzahrani, J.S.; Alaidarous, K.M.; Alwayle, I.M.; Mohsen, H.; Ahmed, I.A.; Al Duhayyim, M. Optimal Deep Learning Based Intruder Identification in Industrial Internet of Things Environment. Comput. Syst. Sci. Eng. 2023, 46, 3121–3139. [Google Scholar] [CrossRef]
- Vaiyapuri, T.; Sbai, Z.; Alaskar, H.; Alaseem, N.A. Deep learning approaches for intrusion detection in IIoT networks–opportunities and future directions. Int. J. Adv. Comput. Sci. Appl. 2021, 12, 86–92. [Google Scholar] [CrossRef]
- Golchha, R.; Joshi, A.; Gupta, G.P. Voting-based Ensemble Learning Approach for Cyber Attacks Detection in Industrial Internet of Things. Procedia Comput. Sci. 2023, 218, 1752–1759. [Google Scholar] [CrossRef]
- Al-Abassi, A.; Karimipour, H.; Dehghantanha, A.; Parizi, R.M. An ensemble deep learning-based cyber-attack detection in industrial control system. IEEE Access 2020, 8, 83965–83973. [Google Scholar] [CrossRef]
- Hasan, T.; Malik, J.; Bibi, I.; Khan, W.U.; Al-Wesabi, F.N.; Dev, K.; Huang, G. Securing industrial Internet of things against botnet attacks using hybrid deep learning approach. IEEE Trans. Netw. Sci. Eng. 2022, 10, 2952–2963. [Google Scholar] [CrossRef]
- Yazdinejad, A.; Kazemi, M.; Parizi, R.M.; Dehghantanha, A.; Karimipour, H. An ensemble deep learning model for cyber threat hunting in the industrial internet of things. Digit. Commun. Netw. 2023, 9, 101–110. [Google Scholar] [CrossRef]
- Elsayed, R.; Hamada, R.; Hammoudeh, M.; Abdalla, M.; Elsaid, S.A. A Hierarchical Deep Learning-Based Intrusion Detection Architecture for Clustered Internet of Things. J. Sens. Actuator Netw. 2022, 12, 3. [Google Scholar] [CrossRef]
- Huma, Z.E.; Latif, S.; Ahmad, J.; Idrees, Z.; Ibrar, A.; Zou, Z.; Alqahtani, F.; Baothman, F. A hybrid deep random neural network for cyberattack detection in the industrial internet of things. IEEE Access 2021, 9, 55595–55605. [Google Scholar] [CrossRef]
- Gómez, Á.L.P.; Maimó, L.F.; Celdrán, A.H.; Clemente, F.J.G. SUSAN: A Deep Learning based anomaly detection framework for sustainable industry. Sustain. Comput. Inform. Syst. 2023, 37, 100842. [Google Scholar] [CrossRef]
- Nayak, S.; Ahmed, N.; Misra, S. Deep learning-based reliable routing attack detection mechanism for industrial Internet of Things. Ad Hoc Netw. 2021, 123, 102661. [Google Scholar] [CrossRef]
- Zhang, K.; Liu, Y.; Mei, F.; Sun, G.; Jin, J. IBGJO: Improved Binary Golden Jackal Optimization with Chaotic Tent Map and Cosine Similarity for Feature Selection. Entropy 2023, 25, 1128. [Google Scholar] [CrossRef] [PubMed]
- Al-Khazraji, H.; Nasser, A.R.; Hasan, A.M.; Al Mhdawi, A.K.; Al-Raweshidy, H.; Humaidi, A.J. Aircraft engines remain useful for life prediction based on a hybrid model of autoencoder and deep belief network. IEEE Access 2022, 10, 82156–82163. [Google Scholar] [CrossRef]
- Zhang, C.; Pei, Y.H.; Wang, X.X.; Hou, H.Y.; Fu, L.H. Symmetric cross-entropy multi-threshold colour image segmentation based on the improved pelican optimization algorithm. PLoS ONE 2023, 18, e0287573. [Google Scholar]
- Available online: https://www.kaggle.com/mrwellsdavid/unsw-nb15 (accessed on 14 June 2023).
- Available online: https://www.kaggle.com/paresh2047/uci-semcom (accessed on 14 June 2023).
- Kasongo, S.M.; Sun, Y. Performance analysis of intrusion detection systems using a feature selection method on the UNSW-NB15 dataset. J. Big Data 2020, 7, 105. [Google Scholar] [CrossRef]
- Kotecha, K.; Verma, R.; Rao, P.V.; Prasad, P.; Mishra, V.K.; Badal, T.; Jain, D.; Garg, D.; Sharma, S. Enhanced Network Intrusion Detection System. Sensors 2021, 21, 7835. [Google Scholar] [CrossRef]
- Zhou, X.; Hu, Y.; Liang, W.; Ma, J.; Jin, Q. Variational LSTM enhanced anomaly detection for industrial big data. IEEE Trans. Ind. Inform. 2020, 17, 3469–3477. [Google Scholar] [CrossRef]
- Moldovan, D.; Anghel, I.; Cioara, T.; Salomie, I. Particle Swarm Optimization Based Deep Learning Ensemble for Manufacturing Processes. In Proceedings of the 2020 IEEE 16th International Conference on Intelligent Computer Communication and Processing (ICCP), Cluj-Napoca, Romania, 3–5 September 2020; IEEE: Piscataway, NJ, USA, 2020; pp. 563–570. [Google Scholar]

Disclaimer/Publisher’s Note: The statements, opinions and data contained in all publications are solely those of the individual author(s) and contributor(s) and not of MDPI and/or the editor(s). MDPI and/or the editor(s) disclaim responsibility for any injury to people or property resulting from any ideas, methods, instructions or products referred to in the content. |
© 2023 by the authors. Licensee MDPI, Basel, Switzerland. This article is an open access article distributed under the terms and conditions of the Creative Commons Attribution (CC BY) license (https://creativecommons.org/licenses/by/4.0/).