Article

RayBench: An Advanced NVIDIA-Centric GPU Rendering Benchmark Suite for Optimal Performance Analysis

1
Shenzhen Institute of Advanced Technology, Chinese Academy of Sciences, Shenzhen 518055, China
2
Shenzhen College of Advanced Technology, University of Chinese Academy of Sciences, Shenzhen 518055, China
*
Author to whom correspondence should be addressed.
Electronics 2023, 12(19), 4124; https://doi.org/10.3390/electronics12194124
Submission received: 26 August 2023 / Revised: 25 September 2023 / Accepted: 27 September 2023 / Published: 2 October 2023

Abstract

:
This study aims to collect GPU rendering programs and analyze their characteristics to construct a benchmark dataset that reflects the characteristics of GPU rendering programs, providing a reference basis for designing the next generation of graphics processors. The research framework includes four parts: GPU rendering program integration, data collection, program analysis, and similarity analysis. In the program integration and data collection phase, 1000 GPU rendering programs were collected from open-source repositories, and 100 representative programs were selected as the initial benchmark dataset. The program analysis phase involves instruction-level, thread-level, and memory-level analysis, as well as five machine learning algorithms for importance ranking. Finally, through Pearson similarity analysis, rendering programs with high similarity were eliminated, and the final GPU rendering program benchmark dataset was selected based on the benchmark’s comprehensiveness and representativeness. The experimental results of this study show that, due to the need to load and process texture and geometry data in rendering programs, the average global memory access efficiency is generally lower compared to the averages of the Rodinia and Parboil benchmarks. The GPU occupancy rate is related to the computationally intensive tasks of rendering programs. The efficiency of stream processor execution and thread bundle execution is influenced by branch statements and conditional judgments. Common operations such as lighting calculations and texture sampling in rendering programs require branch judgments, which reduce the execution efficiency. Bandwidth utilization is improved because rendering programs reduce frequent memory access and data transfer to the main memory through data caching and reuse. Furthermore, this study used multiple machine learning methods to rank the importance of 160 characteristics of 100 rendering programs on four different NVIDIA GPUs. Different methods demonstrate robustness and stability when facing different data distributions and characteristic relationships. By comparing the results of multiple methods, biases inherent to individual methods can be reduced, thus enhancing the reliability of the results. The contribution of this study lies in the analysis of workload characteristics of rendering programs, enabling targeted performance optimization to improve the efficiency and quality of rendering programs. By comprehensively collecting GPU rendering program data and performing characteristic analysis and importance ranking using machine learning methods, reliable reference guidelines are provided for GPU design. This is of significant importance in driving the development of rendering technology.

1. Introduction

Computer graphics rendering plays a crucial role in various fields in today’s digital era, including game development, movie special effects, virtual reality, and architectural design [1,2,3,4]. With the continuous advancement of graphics rendering and the increasing demand, optimizing the performance of graphics processing units (GPUs) has become essential. By optimizing GPU performance, faster rendering speeds, higher image quality, and smoother interactive experiences can be achieved, driving development and innovation across industries [5,6].
This article aims to conduct in-depth analysis and research on GPU performance optimization based on a benchmark suite for GPU rendering programs. The goal is to identify key performance factors and provide targeted optimization strategies and guidance. GPUs, as processors specifically designed for graphics computation, possess powerful parallel computing capabilities and high-bandwidth memory access, making them the core components of graphics rendering [7]. However, modern GPUs face increasing computational demands and performance challenges due to the complexity of rendering algorithms and the pursuit of image quality. To fully unleash the potential of GPUs and enhance rendering performance and efficiency, a deep understanding of GPU operation principles, performance characteristics, and influencing factors is required.
Significant research in recent years has focused on GPU performance optimization [8,9]. However, due to the diversity and complexity of rendering algorithms, as well as differences in GPU architectures, there is no universal optimization strategy applicable to all cases. Therefore, this article will begin by constructing an initial GPU rendering benchmark suite, selecting samples from a wide range of representative rendering programs. The selection of representative programs will encompass common characteristics of algorithm frameworks and models across various domains, including ray-tracing frameworks, path tracing frameworks, photon mapping frameworks, fractal frameworks, and more. The benchmark suite will be designed to ensure diversity and inclusivity of mainstream algorithms in the rendering domain. Comprehensive data collection and optimization analysis will be conducted to obtain characteristics and metrics closely related to GPU performance.
First, the article will gather the current mainstream rendering algorithms and establish the necessary environments for program compilation and execution. This will lay the foundation for constructing the GPU rendering benchmark suite, ensuring its diversity and representativeness. The constructed GPU rendering benchmark suite will cover current mainstream rendering algorithms, including rasterization algorithms, path tracing algorithms, ray-tracing algorithms, offline rendering, texture rendering, fractal rendering, voxel rendering, and point cloud rendering.
Next, the GPU characteristic profiling tool NVprof version 11.2 will be used to explore the constructed GPU rendering benchmark suite. Through the analysis of these characteristics, 160 GPU architecture independent characteristics will be obtained, covering aspects such as GPU computational capabilities, memory access patterns, cache utilization, stream processor utilization, and more. The correlation between these characteristics and rendering performance will be evaluated using the Pearson correlation analysis method. Rendering programs with wide-ranging representation and a significant correlation with performance will be selected. Additionally, principal component analysis will be employed, using the characteristic with the highest comprehensive score among the 160 GPU characteristics as the dependent variable and the remaining 159 characteristics as independent variables. Subsequently, five machine learning methods, namely Random Forest importance ranking, XGBoost importance ranking, Adaboost importance ranking, ExtraTrees importance ranking, and GBDT importance ranking, will be utilized to rank the importance of these characteristics. This will help determine which independent variables have a greater impact on GPU performance and provide guidance for further optimization.
Finally, a comparison between the constructed GPU rendering benchmark suite and the Rodinia and Parboil benchmark suites will be conducted. This analysis will help identify the differences in the impact of independent variables on the dependent variable in rendering and non-rendering benchmarks. By doing so, users can gain a deeper understanding of the performance characteristics of and differences between GPUs in rendering and non-rendering tasks [10,11]. The main objective of this research is to reveal the key factors influencing GPU performance and provide optimization guidance for rendering GPU designs. Through a comprehensive understanding of GPU operation principles, rendering algorithm characteristics, and the relationship between GPU characteristics and performance, this article aims to provide valuable references for the development and performance optimization of rendering applications. Furthermore, through comparative analysis with other benchmark suites, this article will explore the applicability and limitations of GPUs in different tasks, thereby providing insights for future improvements in GPU architectures and designs.

2. Introduction to the GPU Rendering Benchmark Suite

Computer graphics rendering is a significant research area within the field of computer graphics, with wide-ranging applications in gaming, animation, virtual reality, and architectural design. As computer graphics technology advances and application demands increase, optimizing GPU performance has emerged as a critical research focus. To enhance rendering efficiency and image quality, researchers have extensively conducted analysis and optimization of GPU performance using GPU rendering benchmark suites, both domestically and internationally. This chapter presents a comprehensive overview of the current research landscape in GPU performance optimization analysis based on GPU rendering benchmark suites, encompassing both academic and industrial perspectives.
In 2001, SPECviewperf was introduced by the SPEC organization as a benchmark test to evaluate the performance of professional graphics applications. Its primary objective was to assess GPU performance under professional graphics workloads. Optimization recommendations were specifically targeted at improving GPU performance for specific professional applications [12]. Also, in 2001, Futuremark/UL released 3DMark 2001, a benchmark test designed to evaluate 3D gaming performance. Its purpose was to enhance the quality and performance of graphics effects by optimizing rendering techniques for improved gaming performance [13]. In 2010, Unigine Corporation introduced Unigine Heaven, a graphics benchmark test based on the Unigine engine, which aimed to evaluate GPU performance. Optimization recommendations included utilizing suitable rendering techniques such as deferred shading and geometry shaders to optimize rendering performance, particularly for large-scale scenes [14] In 2011, Futuremark/UL launched 3DMark 2011, focusing on evaluating 3D gaming performance. Optimization recommendations emphasized optimizing graphics rendering and computational processes to minimize resource waste and enhance gaming performance [15]. In 2013, Unigine Corporation released Unigine Valley, another graphics benchmark test based on the Unigine engine, primarily used for evaluating GPU performance. Optimization recommendations were similar to Unigine Heaven, highlighting the importance of utilizing appropriate rendering techniques like deferred shading and geometry shaders to optimize rendering performance for large-scale scenes [16]. LuxCoreRender team introduced LuxMark in 2014, a benchmark test specifically developed to evaluate ray-tracing rendering performance. Additionally, in 2016, Futuremark/UL released VRMark, a benchmark test focused on evaluating virtual reality performance [17]. In the same year, Kishonti Ltd. (Budapest, Hungary) developed GFXBench, a benchmark test tailored for evaluating mobile device GPU performance [18].
In 2014, Otoy introduced OctaneBench, a benchmark test for evaluating GPU rendering performance in Octane Render. Octane Render is a GPU-based rendering engine, and OctaneBench serves as a tool to assess GPU performance and stability under Octane Render, particularly for complex scenes and ray-tracing rendering tasks. Optimization recommendations included selecting appropriate rendering settings, adjusting GPU driver and operating system settings, and optimizing GPU workload and resource allocation [19]. In 2017, Futuremark/UL launched 3DMark Fire Strike, another benchmark test dedicated to evaluating 3D gaming performance. Unigine Corporation introduced the Superposition Benchmark, a graphics benchmark test designed to evaluate GPU rendering performance. It provided various graphics effects and scenes to test rendering performance and stability under high loads. Optimization recommendations emphasized the utilization of appropriate rendering settings and optimization techniques to enhance rendering speed and graphic quality, particularly in complex scenes [20]. In 2018, the Blender Foundation introduced the Blender Benchmark, a benchmark test specifically developed to evaluate rendering performance in Blender software verson 3.5. Optimization recommendations included employing suitable rendering settings and optimization techniques to enhance rendering speed and quality in Blender [21]. In 2019, Solid Angle introduced the Arnold Render Benchmark, a benchmark test for evaluating Arnold renderer performance. Optimization recommendations included using appropriate rendering settings and optimization techniques to improve the performance and efficiency of the Arnold renderer. Additionally, Chaos Group developed the V-Ray Benchmark, a benchmark test tailored for evaluating V-Ray renderer performance. Optimization recommendations included utilizing suitable rendering settings and optimization techniques to enhance V-Ray renderer performance and efficiency [22]. In 2020, Futuremark/UL released 3DMark Port Royal, a benchmark test aimed at evaluating real-time ray-tracing performance. Optimization recommendations primarily focused on optimizing ray-tracing techniques and hardware acceleration to enhance real-time ray-tracing performance and achieve higher quality results [23]. In the same year, Redshift Rendering Technologies introduced the Redshift Benchmark, a benchmark test designed to evaluate Redshift renderer performance. Optimization recommendations included optimizing renderer settings and rendering techniques to improve Redshift renderer performance and efficiency [24]. In 2021, NVIDIA developed the NVIDIA DLSS Benchmark, a benchmark test specifically created to evaluate the performance and effectiveness of the deep learning super sampling (DLSS) technology. Optimization recommendations emphasized the usage of appropriate rendering and supersampling settings to optimize DLSS performance and achieve superior image quality [25].
Through the utilization of these tools, developers can assess and examine the performance of computer systems and graphics cards across a multitude of graphics rendering and computational tasks. These tools encompass a broad spectrum of benchmark test scenarios and metrics, encompassing performance evaluation in diverse domains including graphics rendering, physics simulation, ray tracing, virtual reality, and more. Furthermore, they provide a plethora of rendering scenes and optimization capabilities, empowering developers to unleash the full potential of GPUs with greater efficacy.

3. GPU Rendering Benchmark Suite Building

In this study, we employ a GPU characteristic profiling tool to collect, inspect, and analyze data. The analysis results greatly assist in identifying potential opportunities for program optimization. The primary objective of this study is to compile a comprehensive collection of GPU rendering programs and, through acquisition and profiling of their characteristics, develop a set of cloud render benchmarks. These crafted benchmarks accurately reflect the distinctive characteristics of GPU rendering programs and serve as invaluable reference points for the design of next-generation graphics processors.
The overall quantification framework of this study is illustrated in Figure 1. The quantification framework consists of four main components: (1) GPU rendering program integration, (2) GPU rendering program data collection, (3) GPU rendering program analysis, and (4) GPU rendering program similarity analysis. Firstly, GPU rendering program integration (1) involves the collection of 1000 GPU rendering programs from open-source repositories on the internet. Firstly, we conduct Pearson similarity analysis among the 1000 GPU rendering programs to identify programs that exhibited high similarity in terms of their workload characteristics. This step is crucial to eliminating redundancy and ensuring that the selected programs would cover a wide spectrum of rendering tasks. The objective is to create a benchmark dataset that comprehensively represents the varied characteristics of GPU rendering programs. Therefore, we deliberately exclude rendering programs that demonstrate a strong similarity to others in the dataset. This approach helps avoid over-representation of certain workload patterns. The final selection of 100 programs aims to strike a balance between comprehensiveness and representativeness. We want to ensure that the chosen programs collectively captured the diverse demands and computational requirements commonly encountered in GPU rendering. (2) We employ the NVProf GPU characteristic profiling tool to gather GPU characteristics of the selected 100 representative rendering programs on four different GPUs: NVIDIA P100, A100, T4, and 2080Ti. Each rendering program yields 160 GPU characteristics, and we utilize principal component analysis to identify the most influential characteristics that significantly impact GPU rendering programs. In the GPU rendering program analysis stage (3), we employ five machine learning algorithms to rank the importance of GPU characteristics, with the most influential characteristic as the dependent variable and the other 159 characteristics as independent variables. This analysis helps us select the GPU characteristics that best reflect the essence of GPU rendering programs. Additionally, we apply the same importance ranking process to the Rodinia and Parboil GPU benchmark suites to observe the differences and connections between GPU rendering program benchmark suites and non-rendering program benchmark suites. Furthermore, we classify the 160 GPU characteristics into instruction-level, thread-level, and memory-level categories to examine program characteristics from different perspectives. Comparative analysis with the Rodinia and Parboil GPU benchmark suites provides insights for the design of GPU integer computation units, floating-point computation units, high-speed cache design units, and rendering pipelines. Lastly, in the GPU rendering program similarity analysis (4), we employ Pearson similarity analysis to measure the similarity among the 100 GPU rendering programs. We eliminate highly similar rendering programs and, based on the benchmark’s wide usage and representativeness, scientifically select the final GPU rendering program benchmark suite.

3.1. Program Integration and Data Collection

In accordance with the principles of broad diversity and representativeness in benchmarks, this study collects and develops a curated set of 1000 GPU rendering programs from open-source repositories available on the internet. To facilitate a comprehensive evaluation of their performance, certain rendering algorithms undergo modifications. Following the program acquisition phase, a configured GPU environment is established to ensure seamless execution and optimize performance. This encompasses the installation and configuration of suitable drivers, runtime libraries, and other requisite dependencies. Additionally, specific rendering libraries are integrated into each program, bolstering their graphics rendering capabilities. Employing carefully selected compilers and compilation options, each program is compiled and executed to guarantee successful GPU compilation and harness the hardware’s performance potential. Subsequently, rigorous testing and performance assessments are conducted to acquire precise performance metrics across diverse rendering tasks.
During the evaluation process, select rendering algorithms are modified to explore the performance discrepancies arising from different algorithm implementations, thereby providing a deeper understanding of their behavior during rendering operations. Through the evaluation and comparison of the aforementioned 1000 GPU rendering programs, a curated subset of 100 representative programs is chosen as the primary GPU rendering benchmark dataset, as illustrated in Table 1. These selected programs comprehensively cover a broad spectrum of rendering tasks and algorithms, thereby ensuring their representativeness and facilitating a robust evaluation and comparison of distinct GPU performance characteristics. The proposed test dataset framework, coupled with its detailed description, establishes a reliable and comprehensive foundation for the performance evaluation and comparison of GPU rendering programs in this study.
This study conducts experiments on GPU rendering programs and non-rendering programs using four GPU models: NVIDIA Pascal P100, A100, T4, and 2080Ti. Table 2 presents the configuration parameters for these GPUs. Different GPU architectures may possess distinct rendering characteristics and performance. The number of streaming multiprocessors (SMs) determines the GPU’s parallel computing capability. For rendering programs, more SMs can provide additional computational resources, thereby accelerating the rendering process. The FP32 Cores/SM represents the number of 32-bit floating-point cores per SM. Rendering programs often require extensive floating-point calculations, and a higher number of floating-point cores can deliver faster computation speed. The memory interface characteristic pertains to the GPU’s ability to efficiently read from and write to the video memory. A fast memory interface enhances data transfer speed and reduces rendering latency. Memory size refers to the capacity of video memory. Complex rendering scenes may demand significant video memory, and a larger memory capacity can minimize data swapping and improve rendering efficiency. These characteristics can influence the optimization of rendering programs in terms of parallel computing, thread scheduling, resource utilization, and data transfer. However, rendering program optimization also encompasses other factors such as algorithm optimization, texture compression, and shader program optimization. By considering these characteristics alongside other optimization strategies, GPU rendering program performance and efficiency can be enhanced.
In this study, the collected GPU rendering programs underwent characteristic profiling using the NVIDIA NVProf tool. NVProf is a command-line profiler that can be used on Linux, Windows, and OS X. Running the application with ‘nvprof./myApp’ allows for a quick overview of all the kernels and memory copies utilized by the application. The summary combines all the calls to the same kernel, presenting the total time and percentage of the application’s overall time for each kernel. NVProf also offers GPU characteristic analysis mode, which can be accessed with ‘nvprof—metrics’, providing insights into the application’s characteristics at the instruction level, thread level, and memory level. For NVIDIA GPUs, this study collected 160 GPU characteristics, as depicted in Table 3. Due to space limitations, only 20 GPU characteristics are presented here, while the remaining 140 GPU characteristics are available in nvprof document [72].

3.2. Program Analysis

This section introduces instruction-level, thread-level, and memory-level analysis of GPU programs, as well as five important machine learning characteristic importance ranking algorithms. Computer architecture and performance analysis are used to gain a deeper understanding and evaluate the execution behavior and performance characteristics of computer programs at different levels. In the field of machine learning, characteristic selection is a critical task aimed at choosing characteristics from a large set that contributes significantly to program optimization. By reducing characteristic dimensions and eliminating redundant information, characteristic selection can improve potential program optimization opportunities, reduce the risk of overfit, and enhance model interpretability. Characteristic importance ranking algorithms can help determine the most relevant characteristics in a given problem, enabling characteristic selection and dimensional reduction. By excluding irrelevant or redundant characteristics, model performance and interpretability can be improved while reducing computational and storage costs.

3.2.1. Instruction-Level, Thread-Level and Memory-Level Analysis

Instruction-level, thread-level, and memory-level analysis are widely used techniques in the fields of computer architecture and performance optimization. These techniques are primarily employed to analyze and optimize the execution efficiency and memory access efficiency of programs at different levels of computer architecture. Firstly, this article introduces instruction-level workload characteristics, namely global memory access efficiency (gld_efficiency) and global memory store efficiency (gst_efficiency). gld_efficiency measures the efficiency of global memory read instructions. Global memory is a storage area located between host memory and device memory, used for data transfer between the host and the device. When a program performs a read operation, data needs to be retrieved from global memory. gld_efficiency indicates the efficiency of read instruction execution, i.e., the speed of fetching data from global memory. A higher gld_efficiency value indicates faster execution of read instructions, allowing the program to effectively utilize global memory. On the other hand, gst_efficiency measures the efficiency of global memory write instructions. Global memory writes involve storing data in global memory. Unlike reads, write operations require transferring data from the processor or other storage locations to global memory. gst_efficiency indicates the efficiency of write instruction execution, i.e., the speed of writing data to global memory. A higher gst_efficiency value indicates faster execution of write instructions, enabling efficient data storage in global memory.
Secondly, this article discusses thread-level characteristics, including achieved occupancy, SM efficiency, warp execution efficiency, and warp non-predicated execution efficiency. Achieved occupancy reflects the utilization of GPU cores. Higher achieved occupancy indicates a greater number of threads in GPU cores, allowing the program to fully utilize the computational resources of the GPU, thereby enhancing parallel computing efficiency. SM efficiency indicates the utilization of stream processors within SMs, which represents the ratio between the number of stream processors actually executing computational tasks and the total available stream processors within an SM. A higher sm_efficiency value indicates better utilization of stream processors within SMs, enabling optimal utilization of the GPU’s computational resources. Warp execution efficiency measures the ratio between the actual executed instructions per warp and the maximum possible instructions that could be executed. A warp is the smallest unit for scheduling and executing threads in a GPU, typically containing 32 threads. Higher warp execution efficiency signifies better instruction utilization within a warp, allowing the program to make efficient use of the GPU’s computational resources. Warp non-predicated execution efficiency measures the ratio between the number of non-predicated instructions executed within a warp and the total executed instructions within the warp. Non-predicated instructions are those that can be executed without condition checks, as they are not affected by branching conditions. Higher warp non-predicated execution efficiency indicates better utilization of non-predicated instructions within a warp, meaning the program can effectively harness the computational capabilities of the GPU.
Lastly, this article introduces memory-level workload characteristics, specifically bandwidth utilization. Bandwidth utilization is used to gauge the program’s effective utilization of available bandwidth during memory access. In a computer system, memory bandwidth refers to the data transfer rate between the memory subsystem and the processor. Bandwidth utilization measures the efficiency of a program in utilizing the available memory bandwidth for data transfers, thus enhancing the system’s memory access performance. In summary, by analyzing instruction-level, thread-level, and memory-level workload characteristics, developers can gain insights into the execution efficiency and instruction utilization of programs at different levels. They can identify potential causes of performance degradation. These metrics can guide optimization strategies to improve researchers’ understanding of computer system behavior and enhance program execution efficiency on GPUs.

3.2.2. Ranking of Machine Learning Importance

This paper regards the 160 GPU characteristics contained in each GPU rendering program as a vector. The calculation formula is as follows:
V e c t o r = { m 1 , . . . , m j , . . . , m k }
where, the independent variable m 1 to m k represent 160 GPU characteristics, V e c t o r characterizes a GPU rendering program in this study. Each GPU rendering program in this paper is represented by a vector of 160 GPU characteristics. Consequently, a GPU program can be perceived as a row vector. By extension, a matrix with 100 rows and 160 columns is formed by the vectors of 100 GPU programs.
This paper employs the principal component analysis (PCA) method to identify the GPU features that have the most significant impact on GPU rendering programs as the dependent variable. The other 159 GPU features are considered as independent variables. The aim is to determine the GPU features that have a substantial influence on GPU rendering programs and rank them based on their importance. The calculation formula is as follows:
I M P v = { m 1 , m 2 . . . , m p }
where, when it comes to the independent variables m k and m p , ‘p’ is found to be smaller than ‘k’. The five machine learning importance ranking algorithms selected for this study include the Random Forest importance ranking algorithm, the XGBoost importance ranking algorithm, the GBDT importance ranking algorithm, the ExtraTree importance ranking algorithm, and the AdaBoost importance ranking algorithm.
These importance ranking algorithms are all ensemble learning methods that leverage the collective power of multiple weak learners to construct robust predictive models. Random Forest, for instance, is an ensemble of decision trees trained using bootstrap sampling and random characteristic selection. XGBoost and GBDT, on the other hand, are gradient boosting methods that rely on decision trees, iteratively optimizing the loss function to train weak learners. ExtraTree, a variant of random decision trees, introduces more randomness in characteristic selection and node splitting techniques. AdaBoost, in contrast, trains multiple weak learners by iteratively adjusting sample weights. All of these algorithms can evaluate the importance of characteristics by analyzing the contributions of the weak learners. Characteristic importance is calculated based on factors such as the frequency of characteristic usage within the model, the information gain, or the reduction in impurity observed at split nodes. These algorithms provide insightful characteristic ranking results based on their respective methodologies.
These five machine learning methods exhibit both differences and connections when it comes to ranking the importance of characteristics (Table 4). Firstly, they distinguish themselves through their fundamental algorithms and principles. Random Forest, ExtraTrees, and GBDT are all part of the ensemble learning methods based on decision trees. Random Forest and ExtraTrees aim to enhance model performance by constructing multiple decision trees and aggregating their predictions. To increase model diversity, these methods introduce randomness into the construction of decision trees. On the other hand, XGBoost and Adaboost belong to gradient boosting tree-based ensemble learning methods. They iteratively fit residuals to progressively improve model performance and construct a robust classifier through a weighted combination of multiple weak classifiers.
Secondly, these methods employ distinct approaches to calculate characteristic importance. Random Forest, ExtraTrees, and GBDT determine characteristic importance by assessing the contributions of characteristics during the model construction phase. In Random Forest, characteristic importance ranking is determined based on the frequency of characteristic selection as a splitting characteristic and its impact on the effectiveness of the splits. XGBoost and GBDT rank characteristic importance based on the number of times a characteristic is selected as a splitting characteristic or the relative importance of the characteristic when constructing tree nodes. Adaboost, on the other hand, measures characteristic importance by evaluating the influence of characteristics on the model’s error rate, which is calculated using the weights assigned to characteristics during the training process. By understanding these differences and similarities in the algorithms and characteristic importance computation methods, researchers gain insights into the distinct characteristics and applications of these machine learning techniques.

4. Experimental Analysis of GPU Rendering Benchmark Suite

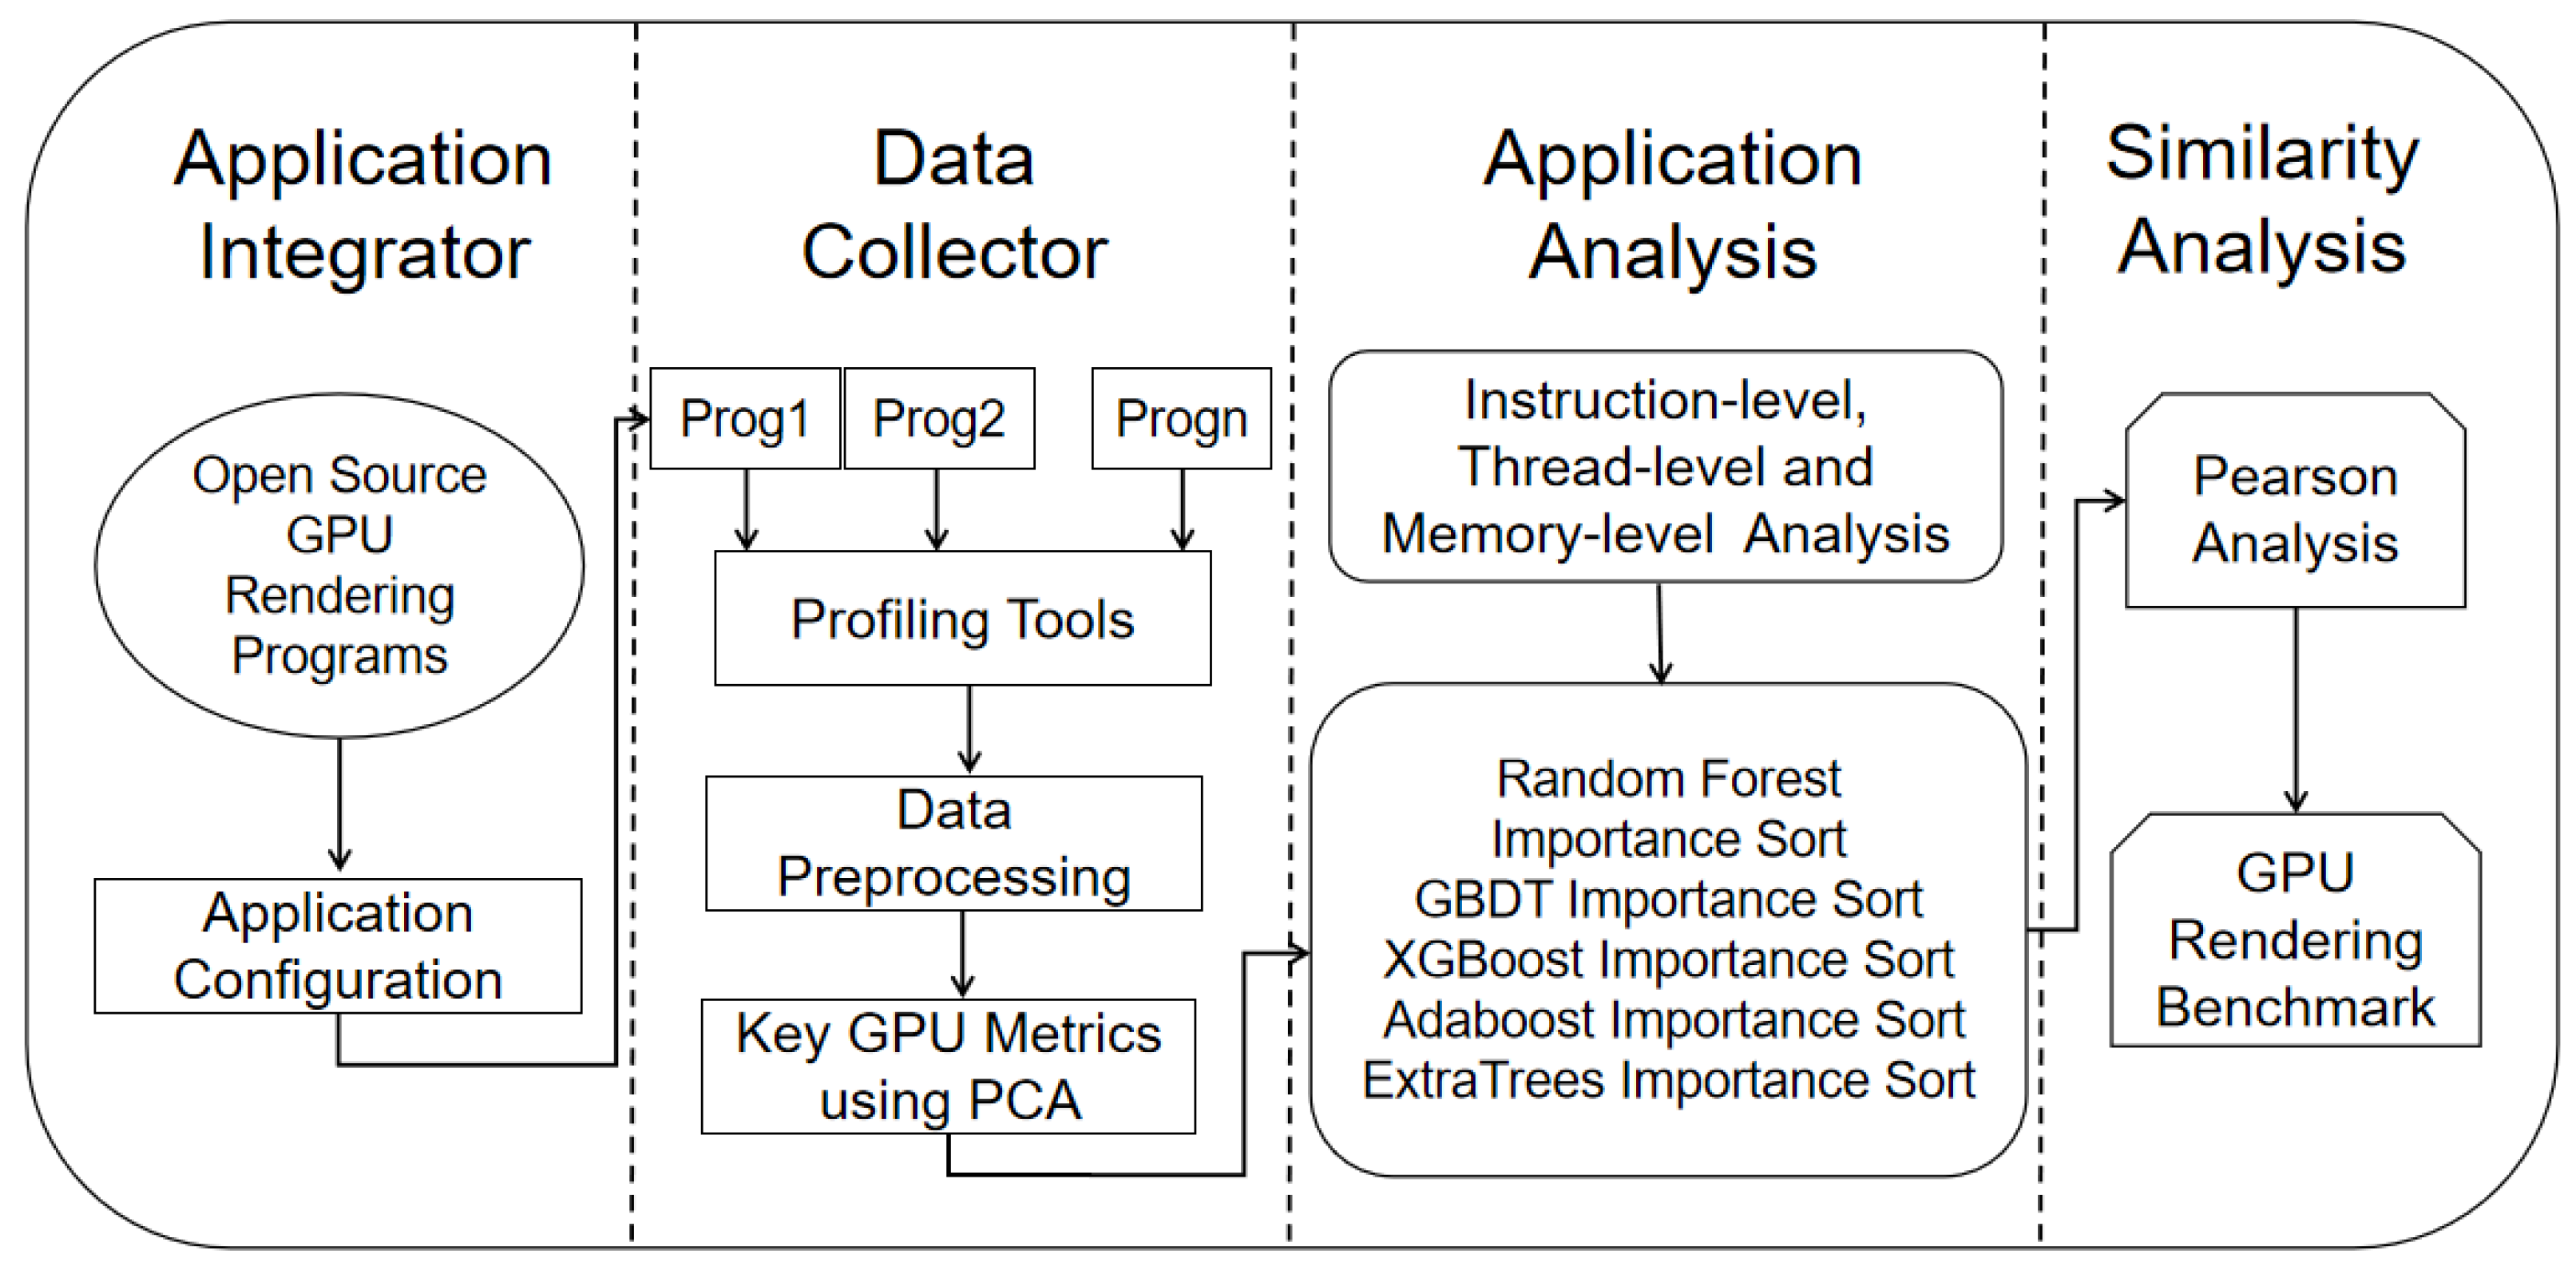
In the field of computer graphics, the optimization of GPU rendering performance has been one of the hot research topics. Through the analysis of workload characteristics at the instruction, thread, and memory levels, this paper is able to understand the impact of different levels of GPU workload on the performance of rendering programs. The comprehensive application of machine learning methods allows for a thorough evaluation of the contributions of various characteristics to rendering performance, thereby offering specific recommendations for optimizing the design of rendering GPUs. Moreover, a comparative analysis with the Rodinia and Parboil benchmark datasets can reveal differences between the rendering benchmark dataset and other non-rendering benchmark datasets, which helps further optimize GPU designs and promote the development of rendering technology.

4.1. Performance Analysis of Workload Characteristics

In this study, NVProf was utilized to collect workload characteristic data for the initial set of 100 GPU rendering benchmark programs, as well as the CUDA evaluation programs Rodinia and Parboil. The experiments were conducted on a Supermicro SYS-7048GR-TR tower server equipped with an Intel Xeon E5-2650 CPU and NVIDIA Pascal P100, A100, T4, and 2080Ti GPUs. The experimental environments for the different GPUs consisted of the following components: For the P100 GPU, we utilized Ubuntu 20.04, CUDA version 11.2, CUDA Driver version 495.29.05, Python version 3.6, and scikit-learn version 0.19. For the A100 GPU, our experimental setup included Ubuntu 20.04, CUDA version 11.6, and CUDA Driver version 510.73.08. The NVIDIA T4 GPU was operated in an environment with CUDA version 11.4 and CUDA Driver version 470.42.01, while the NVIDIA 2080Ti GPU was evaluated in an environment with CUDA version 11.4 and CUDA Driver version 510.47.03. These configurations were employed to ensure a consistent and reliable experimental setup across different GPU models.
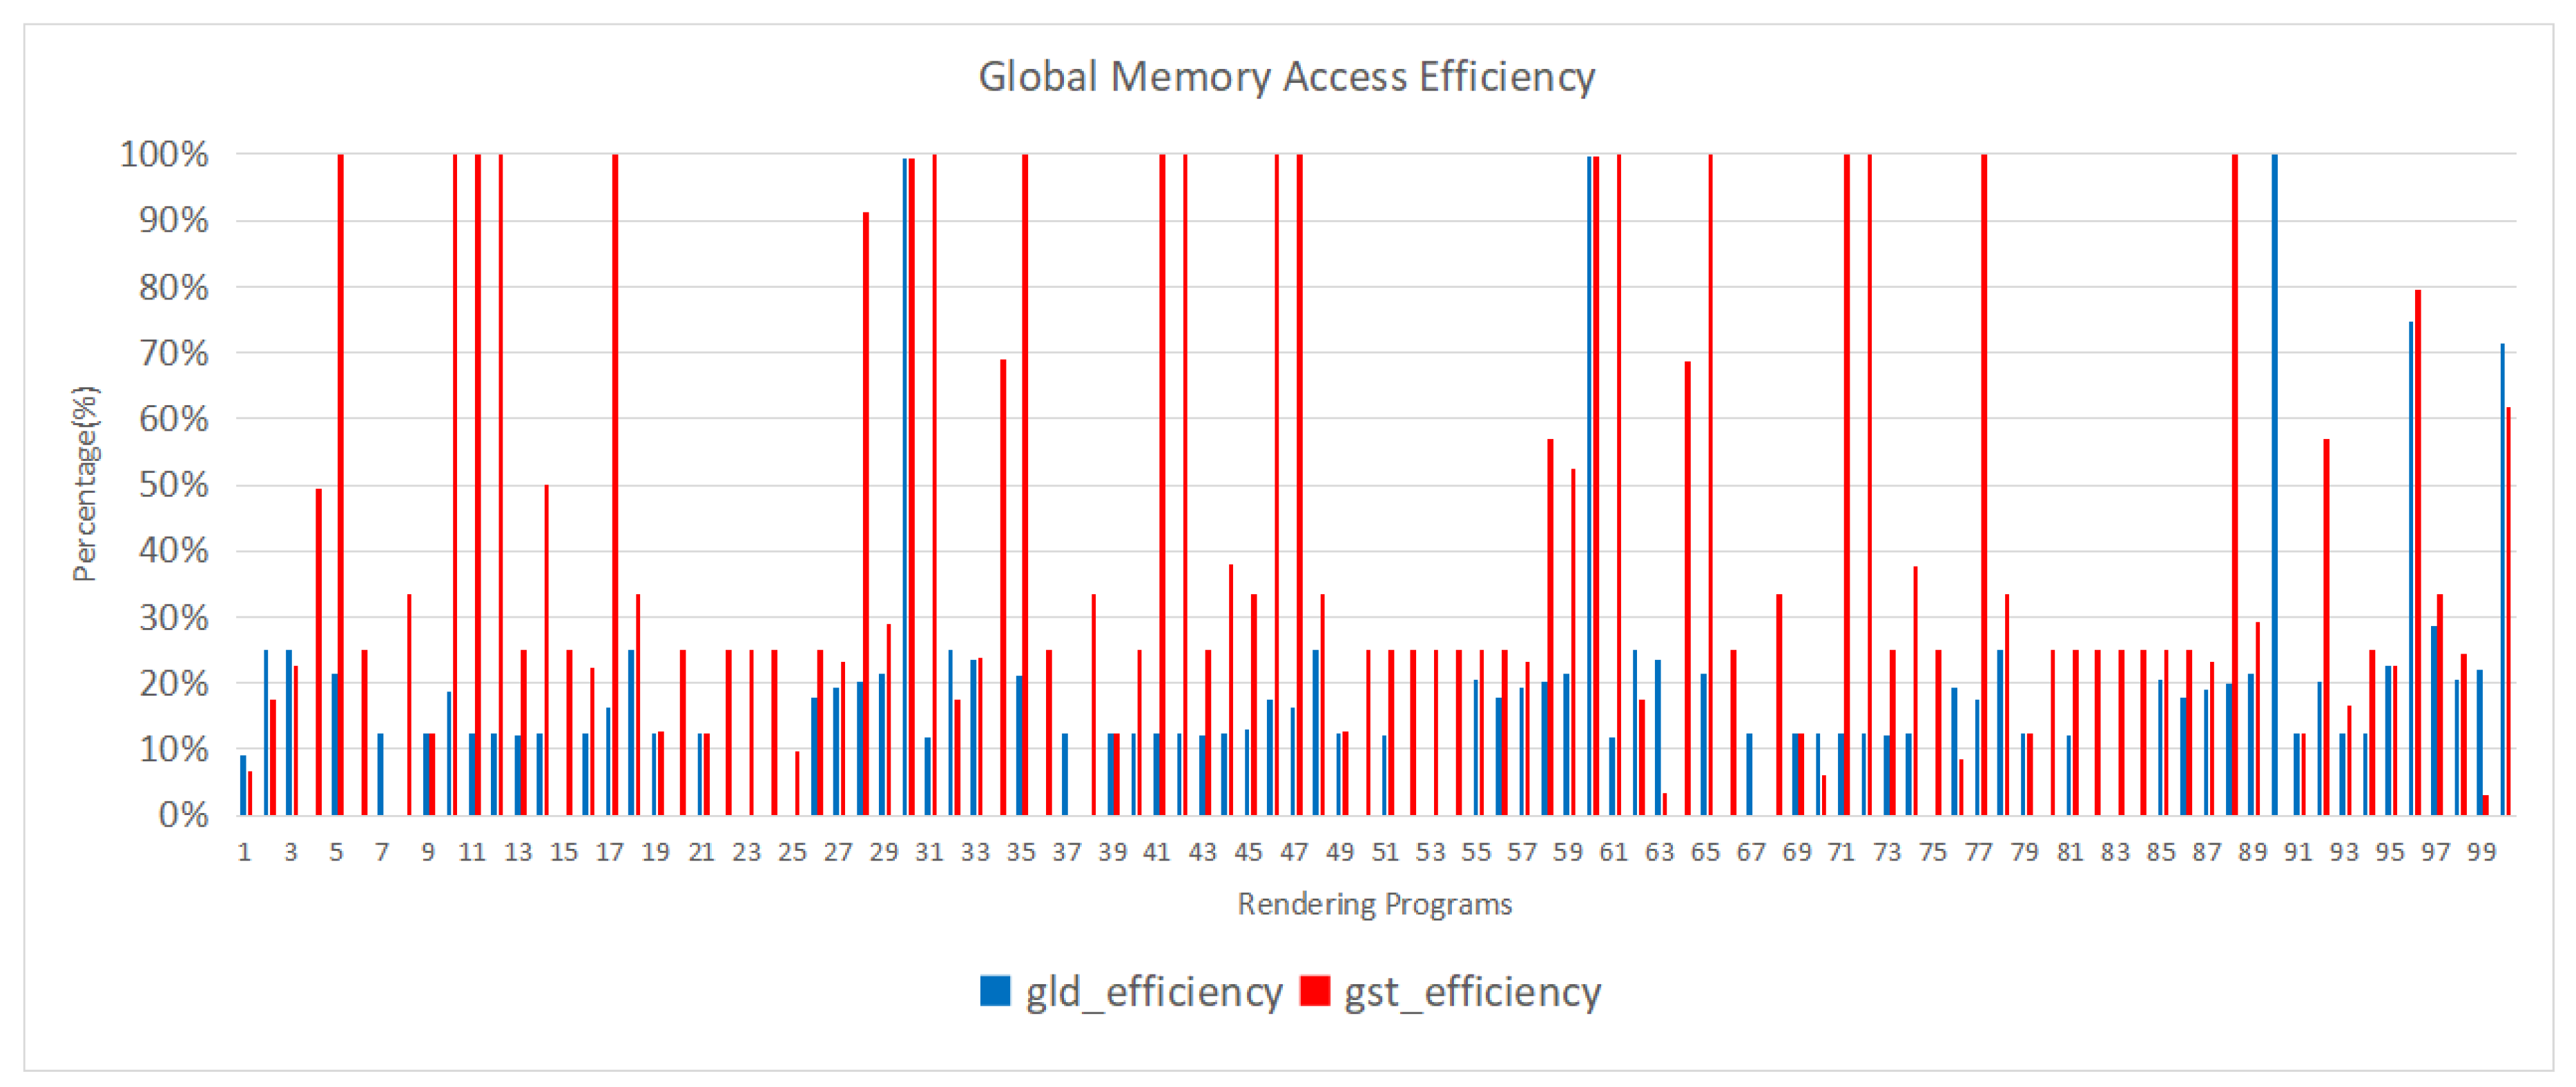
Figure 2 illustrates the global memory access efficiency of the 100 GPU rendering programs. Out of these programs, only six achieved an efficiency of 28% or higher for global memory load throughput, with an average of 16.45% and a median of 12.50%. In contrast, among the 21 Rodinia programs and 11 Parboil programs, 16 and 10 programs, respectively, achieved an efficiency of 28% or higher for global memory load throughput. They exhibited average values of 56.16% and 74.20%, with median values of 56.23% and 81.87%. This analysis reveals that both the Rodinia and Parboil programs have a significant number of programs with high global memory access efficiency, with the majority of them surpassing the 28% threshold. The average and median efficiencies for both sets of programs are notably higher compared to the GPU rendering programs, indicating their effectiveness in utilizing global memory resources efficiently. Backprop is one of the programs included in the Rodinia benchmark suite. It implements the backpropagation algorithm, which is a key component of training artificial neural networks. The backpropagation algorithm computes gradients to update the weights of a neural network during the training process. The program involves a series of matrix operations, including matrix multiplications and element-wise operations. The BFS (Breadth-First Search) program from the Parboil suite is an implementation of the breadth-first search algorithm, commonly used in graph traversal. The BFS algorithm explores a graph data structure, starting from a specified source node and visiting all its neighbors before moving on to their neighbors. This program typically consists of data structures like adjacency lists or matrices and involves memory-intensive operations for managing the queue of nodes to visit. The relatively low efficiency in global memory load throughput for rendering programs can be attributed to their substantial requirements for loading and processing texture and geometry data. These data often exhibit large-scale and continuous characteristics and are distributed across different memory regions. When rendering programs need to access multiple textures, vertex data, and frame buffer data simultaneously, frequent data switching and jumping can introduce memory access latency and overhead, thereby reducing loading efficiency.
At the same time, out of the 100 GPU rendering programs, only 41 achieved an efficiency of 28% or higher for global memory storage throughput, with an average of 40.52% and a median of 25.00%. Among the 21 Rodinia programs and 14 Parboil programs, 16 and 8 programs, respectively, achieved an efficiency of 28% or higher for global memory storage throughput. They displayed average values of 60.00% and 68.31%, with median values of 69.57% and 93.84%. During the rendering process, spatial and temporal locality are commonly observed in the data. Spatial locality refers to the frequent access of neighboring pixels or vertices by the rendering algorithm, while temporal locality denotes the repeated access to the same pixel or vertex. The low efficiency in global memory storage throughput for GPU rendering programs can be attributed to the data dependencies that arise. In image rendering, the computation results from the previous frame are required for subsequent frames or, when calculating the value of a pixel, it relies on the values of surrounding pixels. This data dependency necessitates computational tasks to wait for data readiness in global memory before proceeding to the next step.
The GPU utilization and stream processor efficiency of the 100 GPU rendering programs are depicted in Figure 3. The average and median values of GPU utilization for the 100 GPU rendering programs are 0.482 and 0.478, respectively. For the Rodinia programs and Parboil, the average GPU utilization values are 0.408 and 0.498, with corresponding median values of 0.425 and 0.553. This indicates that 50 rendering programs have a GPU utilization higher than 0.478, suggesting a relatively high overall GPU utilization for rendering programs. This is attributed to the presence of complex lighting computation algorithms in ray tracing-based rendering programs, which require extensive floating-point operations and vector manipulations. Such computationally intensive tasks lead to higher GPU utilization.
The coefficient of variation for GPU utilization among the 100 GPU rendering programs is 0.605, while for the Rodinia and Parboil programs, it is 0.773 and 0.540, respectively. The coefficient of variation is a statistical measure that indicates the degree of fluctuation in a dataset, with higher values indicating greater variability. The GPU utilization of the 100 GPU rendering programs exhibits relatively high variation, signifying significant differences in utilization rates. A coefficient of variation of 0.605 suggests a high degree of dispersion in utilization rates, which may be attributed to different task characteristics, algorithm implementations, or data access patterns among these rendering programs.
The average and median stream processor efficiency values for the 100 GPU rendering programs are 0.793 and 0.940, respectively. For the Rodinia programs and Parboil programs, the average stream processor efficiency values are 0.566 and 0.720, with corresponding median values of 0.747 and 0.888. This discrepancy in sm_efficiency indicates that the Rodinia and Parboil programs tend to utilize stream processors less efficiently on average than the GPU rendering programs. Lower sm_efficiency values indicate that stream processors in the Rodinia and Parboil programs experience underutilization or idle time more frequently, potentially due to differences in computational characteristics and memory access patterns. Rodinia benchmark programs are designed to represent various real-world scientific and engineering applications. These programs often involve complex data access patterns, including irregular memory access and data dependencies. Such patterns can lead to less efficient use of stream processors, resulting in lower sm_efficiency values. Through an analysis of the source code of rendering programs with low stream processor efficiency, this study revealed that certain ray-tracing rendering programs emit rays in a serial manner. This serial emission of rays introduces latency, as each ray has to wait for the intersection and computation of the previous ray to be completed. Consequently, the increase in latency diminishes image rendering performance. GPUs are purposefully designed for highly parallel computations and typically incorporate multiple stream processors to concurrently execute various computing tasks. Each stream processor is capable of handling intersection tests and lighting calculations for a ray, thereby enabling the simultaneous processing of multiple rays. However, in scenarios where only one ray is executing computations, the remaining stream processors remain idle, failing to fully exploit the parallel computing capabilities of the GPU and resulting in inefficient resource utilization.
The efficiency of stream processors in 100 GPU rendering programs is shown in Figure 4. The average and median values of thread warp execution efficiency for the 100 GPU rendering programs are 72.79% and 91.91%, respectively. For the Rodinia programs and Parboil programs, the average thread warp execution efficiency values are 80.48% and 91.68%, with corresponding median values of 92.80% and 94.83%. The high thread warp execution efficiency values in both the Rodinia and Parboil programs reflect the efficient utilization of GPU parallelism, well-optimized GPU code, and the suitability of these applications for GPU acceleration. The specific programs within these suites may exhibit variations in efficiency, but the overall trend highlights the effectiveness of GPU programming in harnessing parallelism for a wide range of computational tasks. For instance, the K-Means program in Rodinia inherently involves a significant amount of repetitive and independent calculations. It operates by iteratively assigning data points to clusters and recalculating the cluster centroids. Each data point’s assignment and centroid recalculation can be performed independently, making it highly amenable to parallelization. When threads within a warp encounter branching statements and conditional evaluations during execution, each thread follows a different execution path based on the conditions. This leads to divergence among the threads within the warp, where some threads enter one branch while others enter another. This divergence significantly impacts the execution efficiency of the thread warp as the instruction streams of the different threads are no longer completely identical.
Rendering programs involve numerous branching statements due to the inherent irregularities in materials, lighting calculations, and geometry. These programs often require performing computations for different materials and lighting models, which necessitates the use of different branching logic. For instance, based on the material properties of an object, specific lighting computation methods or shading models must be selected. Moreover, rendering scenes may encompass various shapes, sizes, and complexities in terms of geometry, thereby demanding the handling of diverse branching scenarios during intersection tests between rays and objects. For instance, different algorithms or processing approaches may be employed to test intersections between surfaces and polygons.
Meanwhile, the average and median values of thread warp non-conditional execution efficiency for the 100 GPU rendering programs are 67.31% and 81.31%, respectively. For the Rodinia and Parboil programs, the average thread warp non-conditional execution efficiency values are 76.56% and 85.35%, with corresponding median values of 87.17% and 86.27%. Many programs within the Rodinia and Parboil suites rely on parallel execution patterns that do not involve complex conditional branching. This is especially true for applications like scientific simulations, image processing, and data analytics, where computations often involve straightforward, data-parallel operations. The benchmarks in these suites often deal with regular and predictable workloads, where the same operations are applied to multiple data elements in a uniform manner. This regularity enables efficient pipelining and execution of instructions across threads and warps. The thread warp non-conditional execution efficiency of the 100 GPU rendering programs is relatively low. This is primarily attributed to the prevalence of branching and conditional evaluations required in common lighting calculations and texture sampling operations during the rendering process. Branching operations involve selecting different code branches for execution based on specific conditions. For instance, in lighting calculations, the intensity and color of light are determined based on the relationship between the light source and objects. This necessitates conditional evaluations to choose different lighting models or computation methods. Similarly, texture sampling may involve different filtering techniques and boundary handling, requiring conditional evaluations to select appropriate sampling methods.
The complexity of branching operations depends on the number and complexity of conditions involved. If the branching conditions are intricate or numerous, threads within the warp may diverge during execution. Consequently, some threads within the warp have to wait for the results of other threads executing different branches, thereby reducing non-conditional execution efficiency. The underlying reason behind this situation lies in the dependency and data correlation in parallel computations. Within a thread warp, all threads must execute along the same code path to ensure result consistency. However, when branching operations are present, threads within the warp choose different branches to execute based on the conditions, but only a subset of threads actually satisfy the conditions while others remain in a waiting state. Due to the inherent nature of GPUs, threads within a warp must synchronize their execution, meaning that all threads need to wait for the slowest thread to complete. Consequently, when threads within the thread warp need to wait for the execution results of other threads after branching evaluations, it leads to performance bottlenecks and diminishes non-conditional execution efficiency.
The utilization of bandwidth and shared memory in the 100 GPU rendering programs is depicted in Figure 5. The average and median values of bandwidth utilization for the 100 GPU rendering programs are 17.94% and 4.19%, respectively. For the Rodinia programs and Parboil programs, the average bandwidth utilization values are 13.54% and 13.11%, respectively. The lower bandwidth utilization in Rodinia programs could be attributed to the nature of their workloads. Many Rodinia benchmarks involve scientific simulations and computations that primarily rely on computations performed in registers and shared memory, resulting in fewer memory accesses. Parboil benchmarks encompass a variety of data-intensive workloads, including image processing and data compression, which involve memory accesses for large datasets. However, the optimizations in these programs seem to mitigate excessive memory bandwidth usage. Rendering programs demonstrate relatively high bandwidth utilization primarily due to the implementation of data caching and reuse techniques, which minimize frequent memory accesses and data transfers to the main memory, thereby enhancing bandwidth utilization. Textures serve as frequently used image data in rendering programs, such as textures for mapping or surface patterns. Transferring texture data typically requires substantial bandwidth and time. To minimize the frequency of data transfers, texture data is stored in the texture cache of the GPU and reused when necessary. The texture cache, located within the GPU, offers high bandwidth and low latency access, facilitating swift delivery of texture data to the rendering pipeline. Caching texture data on the GPU device helps avoid unnecessary data transfers and frequent accesses to the main memory, thus enhancing bandwidth utilization and overall rendering performance.
In rendering programs, vertex data describes the geometric structure and attributes of objects. Vertex data is often reused multiple times during the rendering process, for operations such as transformations, lighting calculations, and clipping. Storing vertex data in the vertex cache of the GPU and reusing it when needed reduces memory accesses and data transfers to the main memory. The vertex cache possesses high bandwidth and low latency characteristics, enabling rapid provision of vertex data to the rendering pipeline, thereby enhancing bandwidth utilization and rendering performance. By utilizing the vertex cache, rendering programs can prevent unnecessary transfers of vertex data, reduce frequent accesses to the main memory, and improve efficiency.
Among the 100 GPU rendering programs, only two exhibit non-zero values for shared memory utilization. For the Rodinia programs and Parboil programs, 13 and 8 programs, respectively, show non-zero values for shared memory utilization. The average values for shared memory utilization in these programs are 31.69% and 24.29%, respectively. Shared memory is commonly used in Rodinia benchmarks to facilitate inter-thread communication and data sharing. For instance, the “BFS” (Breadth-First Search) benchmark frequently accesses shared memory to coordinate parallel traversal of graph structures. Shared memory utilization in Parboil programs is often related to optimizing data access patterns and facilitating communication among parallel threads. For example, the “mri-gridding” benchmark involves shared memory utilization to manage data for image reconstruction tasks. In the rendering process, most operations involve independent calculations for different pixels or vertices. This implies that the data required by each thread is typically not shared with other threads, making the use of shared memory for data sharing unnecessary. Rendering programs often prioritize parallel computation over data sharing, leading to relatively low utilization of shared memory. Modern GPU devices are generally characterized by multi-level memory hierarchies, including global memory, shared memory, and registers. Shared memory represents a relatively small but fast memory in the GPU, whereas global memory usually offers larger capacity. Due to the limited capacity of shared memory, rendering programs tend to store data in global memory rather than shared memory. Additionally, rendering programs employ optimization strategies such as texture caching, vertex caching, and parallel computation to enhance performance. These optimization techniques can improve rendering program performance without heavily relying on shared memory, thereby resulting in lower utilization of shared memory.
Figure 6 illustrates the Pearson correlation analysis of the GPU rendering program benchmark dataset. The dataset comprises 100 GPU rendering programs, with 160 GPU characteristics that were standardized before conducting the correlation analysis. To ensure the dataset’s comprehensiveness and diversity, rendering programs with non-significant correlation coefficients and those exhibiting correlation coefficients above 0.85 were excluded. Ultimately, a representative GPU rendering benchmark dataset consisting of 16 programs was selected (Table 5).

4.2. Workload Characteristics Ranking Analysis

A rendering program typically comprises multiple tasks or threads, such as rendering threads, physics simulation threads, lighting calculation threads, and others. Conducting workload characteristic ranking analysis provides valuable insights into the relative importance and priority of each task, facilitating effective task scheduling and parallel processing to maximize computational resource utilization. Moreover, workload characteristic ranking analysis of a rendering program helps identify potential performance bottlenecks and their underlying causes. By comprehending computational workloads, memory bandwidth requirements, and other task-specific characteristics, potential bottlenecks can be accurately identified. For instance, if a particular task exhibits significant computational demands but low memory bandwidth requirements, the bottleneck is likely to stem from computational resources rather than memory bandwidth limitations. This understanding of workload characteristics enables targeted optimization and adjustment of rendering algorithms and hardware configurations, ultimately enhancing performance.
Additionally, workload characteristic ranking aids in analyzing the utilization of various resources by a rendering program. By understanding the program’s demands for bandwidth, memory, storage, and other resources, one can assess resource utilization and perform corresponding resource management and optimization to enhance overall resource efficiency. In this study, principal component analysis was applied to 160 GPU workload characteristics of 100 rendering programs running on four GPUs. The analysis revealed that “sm_efficiency” was the most significant characteristic across all four GPUs, serving as the dependent variable, while the remaining 159 GPU characteristics were treated as independent variables for Random Forest importance ranking. The Random Forest importance ranking results of the 100 GPU rendering programs on the four GPUs are depicted in Figure 7, where higher-ranked characteristics indicate greater importance across different rendering programs, exerting a more significant impact on performance. Conversely, lower-ranked characteristics may have a lesser impact on performance or could even be negligible. By delving into the underlying principles, this study provides a deeper understanding of the relationship between rendering performance and various metrics, including thread execution efficiency, instruction execution counts, GPU utilization, and memory usage. Ranking the characteristics by their importance enables the identification of metrics that contribute significantly to performance.
Table 6 presents the comprehensive ranking of 10 Random Forest characteristic importance measures across four GPUs. Firstly, consideration is given to characteristic frequency, indicating the occurrence of a particular characteristic in the ranking across all four GPUs, which suggests its suitability as a performance indicator for rendering programs. Secondly, relative characteristic ranking scores are considered, where characteristics appearing in the ranking across four or three GPUs with higher relative scores are given higher positions in the comprehensive ranking. Lastly, average characteristic scores are considered, based on characteristics appearing in the ranking across two or three GPUs, and with closely aligned relative characteristic rankings. Characteristics with higher average scores are given higher positions in the comprehensive ranking. The Random Rorest importance ranking aids in optimizing the rendering process. Researchers can focus on key indicators that significantly impact performance, allowing for the optimization of corresponding algorithms or resource allocation strategies, thereby enhancing overall rendering performance.
Table 7 presents the comprehensive ranking of 10 characteristic importance measures obtained from the XGBoost, Adaboost, GBDT, and ExtraTrees algorithms. Rendering programs involve complex computations and data processing, as they transform three-dimensional scenes into two-dimensional images. When optimizing the performance and quality of rendering programs, understanding the importance of characteristics is crucial for identifying the most influential factors during the rendering process. Each machine learning method has unique advantages and characteristics. By employing multiple methods for characteristic ranking, we can obtain a comprehensive evaluation of characteristic importance from different perspectives and dimensions. This holistic assessment helps reveal the relationship between characteristics and rendering performance more comprehensively. Different machine learning methods employ distinct strategies and algorithms for characteristic ranking, providing robustness and stability when confronted with diverse data distributions and characteristic relationships. By comparing the results of multiple methods, potential biases or errors inherent to a single method can be reduced, thereby enhancing the reliability of the results. In rendering programs, the importance of different characteristics may vary depending on the scene, model, or rendering settings. Therefore, employing multiple machine learning methods for characteristic ranking enables a better capture of the overall importance of characteristics while mitigating potential biases introduced by specific methods, thus enhancing the robustness of the results.
Table 8 presents the final ranking of characteristic importance in rendering programs by integrating the results from the aforementioned five algorithms. This ranking takes into account evaluations from different algorithms to provide a more comprehensive assessment of characteristic importance. Considerations for each characteristic include characteristic frequency, relative ranking results, and the average rank across different rankings. These criteria are combined to generate the final comprehensive ranking of characteristic importance. The benefit of this integrated ranking is the reduction in biases introduced by individual algorithms, resulting in a more objective evaluation of characteristic importance. The GPU, as a core component in rendering, significantly influences the execution speed and quality of rendering programs. For example, GPU utilization represents the extent to which GPU cores utilize thread bundles during computation tasks. Higher utilization implies that GPU cores can make more efficient use of thread bundles and maintain a greater number of active thread bundles per computing cycle. This enhances the GPU’s parallel computing capabilities, thereby accelerating rendering program execution. During the rendering process, higher thread bundle utilization can better handle rendering tasks such as geometric computations and lighting calculations, leading to improved rendering speed and quality.
The characteristic “single-precision floating-point instruction execution count” indicates the number of single-precision floating-point multiply–accumulate operations executed by GPU cores. In rendering, single-precision floating-point operations are commonly used for lighting calculations, texture sampling, and geometric transformations, which are computationally intensive operations. A higher count indicates that GPU cores perform more floating-point computations, enhancing the accuracy and realism of rendering programs. However, it is important to consider the trade-off between computation precision and performance, as excessive floating-point computations may exhaust computational resources.
The characteristic “integer instruction execution count” represents the number of integer instructions executed by GPU cores. In rendering programs, integer instructions are used for geometric computations, texture indexing, and other operations. A higher count may indicate complex geometric computations and texture indexing operations, which are crucial for handling complex scenes and large-scale textures. Efficient execution of integer instructions can improve the performance and quality of rendering programs.
The characteristic “global memory request execution count” represents the total number of global memory requests issued by multiprocessors, excluding atomic requests. In the rendering process, global memory requests are used to write computation results back to global memory, including render target buffers and texture caches, among others. A higher count may indicate frequent reads and writes to global memory, which can lead to memory access bottlenecks and latency. Therefore, when optimizing rendering programs, it is essential to consider reducing the number of global memory requests and optimizing memory access patterns to improve rendering performance.
In conclusion, these GPU characteristics have diverse impacts on rendering programs. Higher GPU utilization and thread bundle utilization can enhance parallel computing capabilities and rendering speed. Higher counts of single-precision floating-point operations and integer instructions may improve the precision and realism of rendering programs. However, a high count of global memory requests may lead to memory access bottlenecks and latency, necessitating optimization. Therefore, during the optimization process of rendering programs, it is necessary to comprehensively consider these characteristics and make appropriate adjustments and trade-offs to achieve the best rendering performance and quality.

5. Conclusions

During analysis of the performance characteristics of the workload, this study developed a GPU rendering program benchmark suite called RayBench. By integrating and analyzing 100 representative GPU rendering programs, a collection of 160 GPU characteristics was obtained, and the workload characteristics were analyzed for performance evaluation. The analysis revealed that GPU rendering programs exhibit low efficiency in global memory access, primarily due to the need for loading and processing large-scale and contiguous texture and geometry data, thereby increasing memory access latency and overhead. Furthermore, GPU rendering programs demonstrate relatively high utilization, especially in ray-tracing rendering programs, which involve complex lighting calculation algorithms and require a substantial quantity of floating-point operations and vector operations. Analyzing these workload characteristics enables the evaluation of GPU rendering program performance. Additionally, comparing the benchmark suite with the Rodinia and Parboil benchmark suites reveals the differences between rendering benchmark suites and other non-rendering benchmark suites.
For the ranking and analysis of workload characteristics, this study employed various machine learning methods to assess the importance of characteristics. By integrating the results from different methods, a more comprehensive and objective ranking of characteristic importance was obtained. The importance of characteristics may vary depending on the scenario, model, or rendering settings. Therefore, using multiple methods for ranking allows for a better capture of the overall importance of characteristics and reduces biases introduced by a single method. Through the ranking and analysis of workload characteristics, this study gains deeper insights into the key factors influencing rendering program performance and adopts corresponding optimization measures to enhance the execution efficiency and rendering quality of rendering programs. This analysis approach not only assists developers in optimizing rendering algorithms and resource allocation strategies but also provides guidance and decision support for improving rendering program performance.

Author Contributions

Conceptualization, P.W.; methodology, P.W. and Z.Y.; experiments, P.W.; formal analysis, P.W.; original draft preparation, P.W.; review and editing, P.W. and Z.Y.; All authors have read and agreed to the published version of the manuscript.

Funding

This research was funded in part by the Shenzhen Science and Technology Program under Grant JCYJ20220818101607015, and in part by the Basic and Applied Basic Research Foundation of Guangdong Province under Grant 2020B1515120044.

Data Availability Statement

RayBench is now open source and can be accessed at the GitLab repository: https://gitlab.com/williamwp/gpu-renderbench.git (accessed on 26 September 2023).

Acknowledgments

The authors thank the editor and the anonymous reviewers for their constructive feedback and valuable advice. And we would like to express our heartfelt gratitude to Xiaoliu, Huawei Technologies Co., Ltd. (Shenzhen, China) for his invaluable guidance and unwavering support throughout this research project. His expertise, insights, and dedication have greatly contributed to the success and depth of our study.

Conflicts of Interest

The authors declare no conflict of interest.

References

  1. Dargan, S.; Bansal, S.; Kumar, M.; Mittal, A.; Kumar, K. Augmented Reality: A Comprehensive Review. Arch. Comput. Methods Eng. 2023, 30, 1057–1080. [Google Scholar] [CrossRef]
  2. Guan, X.; Wang, K. Visual communication design using machine vision and digital media communication technology. Wirel. Commun. Mob. Comput. 2022, 2022, 6235913. [Google Scholar] [CrossRef]
  3. Liu, M. Past Imagination, Present Creation and the Reality of Tomorrow-Explore the Impact of Augmented Reality (AR), Virtual Reality (VR), and Mixed Reality (MR) Design; University of Southern California: Los Angeles, CA, USA, 2022. [Google Scholar]
  4. Abdelaal, M.; Amtsberg, F.; Becher, M.; Estrada, R.D.; Kannenberg, F.; Calepso, A.S.; Weiskopf, D. Visualization for architecture, engineering, and construction: Shaping the future of our built world. IEEE Comput. Graph. Appl. 2022, 42, 10–20. [Google Scholar] [CrossRef] [PubMed]
  5. Bhattacharya, P.; Saraswat, D.; Savaliya, D.; Sanghavi, S.; Verma, A.; Sakariya, V.; Manea, D.L. Towards future internet: The metaverse perspective for diverse industrial applications. Mathematics 2023, 11, 941. [Google Scholar] [CrossRef]
  6. González, E.R.; Ausió, J.R.C.; Pérez, S.C. Application of real-time rendering technology to archaeological heritage virtual reconstruction: The example of Casas del Turuñuelo (Guareña, Badajoz, Spain). Virtual Archaeol. Rev. 2023, 14, 38–53. [Google Scholar] [CrossRef]
  7. Wu, D.; Yang, Z.; Zhang, P.; Wang, R.; Yang, B.; Ma, X. Virtual-Reality Inter-Promotion Technology for Metaverse: A Survey. IEEE Internet Things J. 2023, 10, 15788–15809. [Google Scholar] [CrossRef]
  8. Khurge, D. Strategic Infrastructural Developments to Reinforce Reconfigurable Computing for Indigenous AI Applications. In Artificial Intelligence Applications and Reconfigurable Architectures; Wiley: Hoboken, NJ, USA, 2023; pp. 1–24. [Google Scholar]
  9. Chitkara, Y. A Review on Statistical Power Modelling for a Graphics Processing Unit (GPU). In Proceedings of the 2022 Sixth International Conference on I-SMAC (IoT in Social, Mobile, Analytics and Cloud)(I-SMAC), Dharan, Nepal, 10–12 November 2022; IEEE: Piscataway, NJ, USA; pp. 327–330. [Google Scholar]
  10. Che, S.; Boyer, M.; Meng, J.; Tarjan, D.; Sheaffer, J.W.; Lee, S.H.; Skadron, K. Rodinia: A benchmark suite for heterogeneous computing. In Proceedings of the 2010 IEEE International Symposium on Workload Characterization, Austin, TX, USA, 4–6 October 2010; pp. 44–54. [Google Scholar]
  11. Stratton, J.A.; Rodrigues, C.; Sung, I.J.; Obeid, N.; Chang, L.W.; Anssari, N.; Hwu, W.M.W. Parboil: A revised benchmark suite for scientific and commercial throughput computing. Cent. Reliab. High-Perform. Comput. 2012, 127, 27. [Google Scholar]
  12. Standard Performance Evaluation Corporation (SPEC). SPECviewperf. Available online: http://www.spec.org/gwpg/gpc.static/vp10info.html (accessed on 3 September 2023).
  13. Futuremark/UL. 3DMark. Available online: http://www.futuremark.com/pressroom/companypdfs/3DMark06_Whitepaper_v1_0_2.pdf (accessed on 3 September 2023).
  14. Unigine. Unigine Heaven. Available online: https://unigine.com/ (accessed on 5 September 2023).
  15. Futuremark/UL. 3DMark 2011. Available online: https://benchmarks.ul.com/zh-hans/3dmark11 (accessed on 1 September 2023).
  16. Unigine. Unigine Valley. Available online: https://benchmark.unigine.com/valley (accessed on 5 September 2023).
  17. LuxCoreRender. LuxMark. Available online: https://github.com/LuxCoreRender/LuxMark (accessed on 1 September 2023).
  18. Kishonti Ltd. GFXBench. Available online: https://kishonti.net/graphics-benchmarking.jsp (accessed on 2 September 2023).
  19. Otoy. OctaneBench. Available online: https://render.otoy.com/octanebench/ (accessed on 1 September 2023).
  20. Futuremark/UL. 3DMark Fire Strike. Available online: https://store.steampowered.com/app/402290/3DMark_Fire_Strike_benchmarks/ (accessed on 24 August 2023).
  21. Blender Foundation. Blender Benchmark. Available online: https://www.blender.org/news/introducing-blender-benchmark/ (accessed on 25 August 2023).
  22. Solid Angle. Arnold Render Benchmark. Available online: https://www.antoniobosi.com/maya-render-tests-reviews-comparisons/arnold-render-cpu-gpu-speed-benchmark/ (accessed on 26 August 2023).
  23. Futuremark/UL. 3DMark Port Royal. Available online: https://www.3dmark.com/hall-of-fame-2/port+royal+3dmark+score+performance+preset/version+1.0 (accessed on 27 August 2023).
  24. Redshift Rendering Technologies. Redshift Benchmark. Available online: https://help.maxon.net/r3d/maya/en-us/Content/html/The+redshiftBenchmark+tool.html (accessed on 24 August 2023).
  25. NVIDIA. NVIDIA DLSS Benchmark. Available online: https://www.nvidia.com/en-us/geforce/news/final-fantasy-xv-windows-edition-geforce-rtx-dlss-benchmark/ (accessed on 27 August 2023).
  26. Slim, L. Raytracing_Renderer_Cuda. 2019. Available online: https://github.com/slimem/raytracing_renderer_cuda (accessed on 3 September 2023).
  27. Benchislett Graphics. Available online: https://github.com/benchislett/Graphics (accessed on 2 September 2023).
  28. Akçay, A.A. cudaPPM. 2019. Available online: https://github.com/akcayalperen/cudaPPM (accessed on 3 September 2023).
  29. Alasdairnewson. Film_Grain_Rendering. Available online: https://github.com/alasdairnewson/film_grain_rendering (accessed on 3 September 2023).
  30. EnjiRouz RayTracing. Available online: https://github.com/EnjiRouz/RayTracing (accessed on 24 August 2023).
  31. Ancientkingg Cuda-Raytracer. Available online: https://github.com/Ancientkingg/cuda-raytracer (accessed on 27 August 2023).
  32. Barkovsky, A. Games101. Available online: https://github.com/swarmer/cudademo (accessed on 25 August 2023).
  33. Engel, B. Mandelbrot-Renderer. Available online: https://github.com/Baseng0815/mandelbrot-renderer (accessed on 28 August 2023).
  34. Khaotik. Cuda-Mandel3d. Available online: https://github.com/khaotik/cuda-mandel3d (accessed on 5 September 2023).
  35. Kuczala, A. Mandelbulb. Available online: https://github.com/akuczala/mandelbulb (accessed on 2 September 2023).
  36. Wells, L. CUDA-MBSet. Available online: https://github.com/ladycarbonfiber/CUDA-MBSet (accessed on 6 September 2023).
  37. EricSimonetti Mandelbrot-OpenGL. Available online: https://github.com/EricSimonetti/Mandelbrot-OpenGL (accessed on 2 September 2023).
  38. Borziak, A. LiteTracer. Available online: https://github.com/AndrewB330/LiteTracer (accessed on 7 September 2023).
  39. Alonso, D. Evert-Cuda. Available online: https://github.com/etale-cohomology/evert-cuda (accessed on 8 September 2023).
  40. Medeiros, L.P. GPU_RayTracing. Available online: https://github.com/Leostayner/GPU_RayTracing (accessed on 1 September 2023).
  41. Csiz Space-Chess. Available online: https://github.com/csiz/Space-Chess (accessed on 5 September 2023).
  42. Yuxin. CUDARaytracer. Available online: https://github.com/YuxinxinChen/CUDARaytracer (accessed on 24 August 2023).
  43. Marczych Ray-Tracer-Texture RayTracer. Available online: https://github.com/marczych/RayTracer (accessed on 29 August 2023).
  44. Teja, C.S. Ray-Tracing. Available online: https://github.com/turrentrock/Ray-Tracing (accessed on 28 August 2023).
  45. Masotrix. CudaRayTracer. Available online: https://github.com/masotrix/CudaRayTracer (accessed on 24 August 2023).
  46. Belval, E. Raytracing. Available online: https://github.com/Belval/raytracing (accessed on 3 September 2023).
  47. Josso, A. Cuda_Raytracer. Available online: https://github.com/TetraSomia/cuda_raytracer (accessed on 7 September 2023).
  48. Khelkar, P. Basic-Ray-Tracing. Available online: https://github.com/PrithvirajKhelkar/Basic-Ray-Tracing (accessed on 3 September 2023).
  49. Pereira, B. Raytraceroptimized. Available online: https://github.com/bpereira5/raytraceroptimized (accessed on 28 August 2023).
  50. Kfish. CUDA-RayTracing. Available online: https://github.com/nixekgnaw/CUDA-RayTracing (accessed on 29 August 2023).
  51. Gush, V. Raytracing. Available online: https://github.com/VadimGush/raytracing (accessed on 28 August 2023).
  52. William. Accelerated-Ray-Tracing-Cuda. Available online: https://devblogs.nvidia.com/accelerated-ray-tracing-cuda (accessed on 22 August 2023).
  53. Yi, X. CS217-RayTracing. Available online: https://github.com/willyii/CS217-RayTracing (accessed on 29 August 2023).
  54. Shelly, P. Ray Tracing in One Weekend. Available online: https://raytracing.github.io/books/RayTracingInOneWeekend.html (accessed on 5 September 2023).
  55. ShadowWarden. GRPathTracer. Available online: https://github.com/ShadowWarden/GRPathTracer (accessed on 6 September 2023).
  56. Chicio Ray-Tracing. Available online: https://github.com/chicio/Ray-tracing (accessed on 23 August 2023).
  57. Kctess5.Voxelizer. Available online: https://github.com/kctess5/voxelizer (accessed on 7 September 2023).
  58. Codesavory Very-Own-Path-Tracer. Available online: https://github.com/codesavory/very-own-path-tracer (accessed on 5 September 2023).
  59. Mckennapsean Ray-Tracer. Available online: https://github.com/mckennapsean/ray-tracer (accessed on 5 September 2023).
  60. GPU-Rendering-Programs. Available online: https://gitlab.com/williamwp/backup6/GPU-rendering-programs?ref_type=heads (accessed on 7 September 2023).
  61. He, G.; Crosby, R.; Patton, C. Cuda Rasterizer. Available online: https://github.com/robmcrosby/Cuda-Rasterizer (accessed on 8 September 2023).
  62. Zeng, A.; Song, S.; Nießner, M.; Fisher, M.; Xiao, J.; Funkhouser, T. 3DMatch: Learning Local Geometric Descriptors from RGB-D Reconstructions. In Proceedings of the IEEE Conference on Computer Vision and Pattern Recognition (CVPR), Honolulu, HI, USA, 21–26 July 2017. [Google Scholar]
  63. Forceflow. Cuda_Voxelizer. Available online: https://github.com/Forceflow/cuda_voxelizer (accessed on 2 September 2023).
  64. Tarkowski, J. Sphere-Raycasting. Available online: https://github.com/jtarkowski27/sphere-raycasting (accessed on 8 September 2023).
  65. Dybisz, B. CudaRT. Available online: https://github.com/dybiszb/CudaRT (accessed on 5 September 2023).
  66. Yalue. Cudabrot. Available online: https://github.com/yalue/cudabrot (accessed on 9 September 2023).
  67. Vimarsh6739. Gameoflife. Available online: https://github.com/vimarsh6739/gameoflife (accessed on 9 September 2023).
  68. PWhiddy. Fat-Clouds. Available online: https://github.com/PWhiddy/Fat-Clouds (accessed on 5 September 2023).
  69. KevinMcGin. Simulation. Available online: https://github.com/KevinMcGin/Simulation (accessed on 7 September 2023).
  70. Sephirot47. CUDAFaceDetection. Available online: https://github.com/sephirot47/CUDAFaceDetection (accessed on 7 September 2023).
  71. Cao, F. HPCCUDA. Available online: https://github.com/caofengnian/HPCCUD (accessed on 9 September 2023).
  72. NVIDIA. Nvprof Profiler User Guide. Available online: https://docs.nvidia.com/cuda/profiler-users-guide/index.html (accessed on 7 September 2023).
  73. Min, C.; Xiong, S.; Shi, Y.; Liu, Z.; Lu, X. Early-age compressive strength prediction of cemented phosphogypsum backfill using lab experiments and ensemble learning models. Case Stud. Constr. Mater. 2023, 18, e02107. [Google Scholar] [CrossRef]
Figure 1. Quantitative framework diagram for GPU rendering benchmark suite.
Electronics 12 04124 g001
Figure 2. The global memory access efficiency of GPU rendering programs.
Electronics 12 04124 g002
Figure 3. GPU occupancy and stream processor execution efficiency of GPU rendering programs.
Electronics 12 04124 g003
Figure 4. Warp execution and non-predicated execution efficiency of GPU rendering programs.
Electronics 12 04124 g004
Figure 5. Bandwidth utilization and shared memory utilization of GPU rendering program.
Electronics 12 04124 g005
Figure 6. Pearson correlation analysis of GPU rendering benchmark.
Electronics 12 04124 g006
Figure 7. Random Forest importance ranking comparison diagram of four GPUs. (a) 2080Ti metrics importance ranking; (b) A100 metrics importance ranking; (c) P100 metrics importance ranking; (d) T4 metrics importance ranking.
Electronics 12 04124 g007
Table 1. 100 GPU rendering programs.
Rendering ProgramsRendering ProgramsRendering ProgramsRendering Programs
1-Ray-tracing-perlin-noise [26]2-cuda-PathTracer-cornell-box [27]3-Progressive-photon-map [28]4-Film_grain_rendering_gpu [29]
5-Ray-tracing-with-materials [30]6-CUDA-OpenGL-ray-trace [31]7-N-body-rendering [32]8-Mandelbrot-rendering [33]
9-Cuda-mandel3d [34]10-Cuda-ray-shadows [35]11-Mandelbulb-ray-marching [36]12-Mandelbrot-with-OpenGL [37]
13-LiteTracer [38]14-Evert-cuda [39]15-3D-stanford-bunny [40]16-Sphere-chessboard-grid [41]
17-Ray-tracing-SDL [42]18-Ray-tracer-texture [43]19-Ray-tracing-optimized [44]20-Ray-tracing-OpenGL [45]
21-Luminous-sphere-render [46]22-Render-background-vec3 [47]23-Rays-rendering [48]24-Spheres-rendering [49]
25-Surface normals [50]26-Antialiasing [51]27-Diffuse-materials [52]28-Metal-reflection [53]
29-Dielectrics-defocus-blur [54]30-Newtonian-rasterization [55]31-Ray-bounces-perlin-noise [56]32-PathTracer-500-samples [57]
33-photon-map-ray-direction [58]34-grain-size-film-grain-render [29]35-Ray-tracing-with-2k-image [30]36-ray-tracer-OpenGL-depth [31]
37-N-body-renering-2k-image [32]38-Mandelbrot-render-iteration [33]39-mandel3d-camera-position [34]40-bunny-voxelizer [59]
41-Mandelbulb-ray-march [60]42-Mandelbrot-window-dim [37]43-LiteTracer-2k-image [38]44-Evert-cuda-field-of-view [39]
45-3D-stanford-bunny-scene4 [40]46-Sphere-chessboard-grid [41]47-Ray-tracing-SDL-sphere [42]48-Raytrace-texture-2k-image [43]
49-Ray-optimize-1k-spheres [44]50-Ray-trace-OpenGL-sphere [45]51-Luminous-sphere-ray-count [46]52-Raytracing-2k-image [47]
53-Rays-render-direction [48]54-render-2k-image-spheres [49]55-Surface-unit-direction [50]56-antialiasing-with-2k-image [51]
57-Diffuse-materials-2k-image [52]58-Metal-reflection-50-samples [53]59-Defocus-blur-50samples [54]60-Rasterization-2k-image [55]
61-Raytrace-perlinnoise-seed [56]62-PathTracer-10ray-bounces [57]63-photon-mapping-ray-origin [58]64-Film-coarse-grain-size [29]
65-Ray-tracing-image-material [30]66-OpenGL-max-ray-depth [31]67-N-body-rendering-4k-image [32]68-Mandelbrot-rendering [33]
69-Cuda-mandel3d-iteration [38]70-cuda-rasterizer [61]71-Mandelbulb-raymarch-frame [60]72-Mandelbrot-with-OpenGL [37]
73-LiteTrace-openGLwindow [38]74-Evert-cuda-30fov [39]75-3D-stanford-bunny-scene9 [40]76-Spherechessboard-100spp [41]
77-Ray-trace-SDL-meta-light [42]78-Ray-texture-ambientlight [43]79-Ray-optimized-50spheres [44]80-Raytrace-OpenGL-griddim [45]
81-Luminous-300ray-sphere [46]82-Render-4k-background-vec3 [47]83-Rays-rendering-ray-vector [48]84-Spheres-4k-image-render [49]
85-Surface-ray-color [50]86-Antialiasing-4k-image [51]87-Diffuse-materials-2k-image [52]88-Metal-reflection-200spp [53]
89-Dielectrics-100spp-defocus [54]90-Newtonian-black-hole [55]91-tsdf-voxel-grid-fusion [62]92-voxelizer-spheres [63]
93-raycast-with-phong-shade [64]94-animation-for-some-spheres [65]95-buddhabrot-fractal [66]96-game-of-life [67]
97-fluid-smokee-simulation [68]98-Simulation-particles-motion [69]99-Face-Detection [70]100-blur-pictures [71]
Table 2. Four GPU parameter configurations.
CharacteristicsP100A100T42080Ti
GPU ArchitectureNVIDIA PascalNVIDIA AmpereNVIDIA TuringNVIDIA Turing
Compute Capability687.57.5
SMs561084068
FP32 Cores/SM646425664
Memory Interface4096-bit HBM25120-bit HBM2256-bit GDDR6352-bit GDDR6
Memory Size16 GB40 GB16 GB GDDR611 GB GDDR6
Memory Data Rate732 Gbps1.6 Tbps320 Gbps14 Gbps
Register File Size/SM256 KB256 KB64 KB256 KB
Max Thread Blocks/SM32321616
Shared Memory Size/SM64 KB164 KB64 KB96 KB
Table 3. 20 GPU architectural characteristics.
CharacteristicsDescription
inst_per_warpAverage number of instructions executed by each warp
branch_efficiencyRatio of non-divergent branches to total branches expressed as percentage
inst_replay_overheadAverage number of replays for each instruction executed
shared_load_transactions_per_requestAverage number of shared memory load transactions performed for each shared memory load.
shared_store_transactions_per_requestAverage number of shared memory store transactions performed for each shared memory store
local_load_transactions_per_requestAverage number of local memory load transactions performed for each local memory load
local_store_transactions_per_requestAverage number of local memory store transactions performed for each local memory store
gld_transactions_per_requestAverage number of global memory load transactions performed for each global memory load.
gst_transactions_per_requestAverage number of global memory store transactions performed for each global memory store.
shared_store_transactionsNumber of shared memory store transactions.
shared_load_transactionsNumber of shared memory load transactions
local_load_transactionsNumber of local memory load transactions
local_store_transactionsNumber of local memory store transactions
gld_transactionsNumber of global memory load transactions
achieved_occupancyRatio of average active warps per active cycle to the maximum number of warps on a multiprocessor.
shared_efficiencyRatio of requested shared memory throughput to required shared memory throughput (percentage).
gld_efficiencyRatio of requested global memory load throughput to required global memory load throughput expressed as percentage
gst_efficiencyRatio of requested global memory store throughput to required global memory store throughput expressed as percentage.
warp_execution_efficiencyRatio of the average active threads per warp to the maximum number of threads per warp supported on a multiprocessor
warp_nonpred_execution_efficiencyRatio of the average active threads per warp executing non-predicated instructions to the maximum number of threads per warp supported on a multiprocessor
Table 4. Comparison of Five Machine Learning Ranking Algorithms [73].
CharacteristicsRandom ForestXGBoostGBDTExtraTreeAdaBoost
AlgorithmDecision trees ensembleGradient boostingGradient boostingRandom decision treesIterative weighted voting
Ensemble StrategyVotingWeighted summationWeightedRandom selectionWeighted voting
Iteration ProcessConstruct parallel trees Iterative tuningIterative tuningConstruct parallel trees Iterative weighted voting
PredictionModerateHighHighModerateModerate
Training SpeedFastRelatively slowRelatively slowFastRelatively fast
RobustGoodModerateModerateGood Moderate
Overfit ResistanceResistant to overfitProne to overfitProne to overfitProne to overfitProne to overfit
Parameter Adjustmentsimplecomplexcomplexsimplesimple
InterpretHighModerateModerateModerateModerate
ScalabilityHighModerateModerateHighHigh
Table 5. RayBench: An Advanced NVIDIA-Centric GPU Rendering Benchmark Suite.
NameDescription
3-Progressive-photon-mapThe program utilizes CUDA for a partial photon mapping algorithm in computer graphics, enhancing lighting realism. It features key data structures and functions for 3D vectors, bounding boxes, photons, and linked list-based storage. The code employs spatial hash functions for hit points, supports ray–sphere intersections, photon generation, and camera-based ray tracing. Additional work may be required for complete GPU parallelization.
4-Film_grain_rendering_gpuThe program focuses on the ‘grain rendering’ algorithm, utilizing CUDA for efficiency and incorporating a pseudo-random number generator (PRNG) and a ‘kernel’ function to achieve grain simulation during pixel rendering.
7-N-body-renderingThe program simulates N-body dynamics, offering software and CUDA rendering modes through the NBodyRenderer class. It handles particles, frame buffer memory, and updates. update_software calculates pixel brightness, update_cuda employs CUDA kernels for parallel processing.
8-Mandelbrot-renderingThe program uses CUDA for accelerated Mandelbrot set image generation. It performs complex number operations, pixel mapping, and color conversion to produce images. The plot_pixel kernel manages parallelism, computing iterations and coloring pixels efficiently.
10-Cuda-ray-shadowsThe program harnesses GPU parallel computing for efficient ray tracing. It defines parameters, allocates memory, sets up threads and random numbers, and creates GPU scene objects and a camera. In the main loop, it initializes camera settings, performs ray tracing for pixel colors, and stores results. This code showcases CUDA’s role in accelerating ray tracing and is extendable for advanced rendering tasks.
13-LiteTracerThe program employs CUDA for accelerated path tracing, creating lifelike images. It manages parameters, memory, scene construction, and executes the core render_kernel algorithm, calculating ray interactions with objects, including reflections and refractions, to accumulate pixel colors efficiently.
30-Newtonian-rasterizationThe Newtonian rasterization algorithm employed in this program simplifies rendering by assuming non-relativistic conditions, enabling fast visualization by neglecting relativistic effects such as time dilation and length contraction.
47-Ray-tracing-SDL-sphereThe program utilizes the SDL library to create a graphical window and render graphics. The ‘render’ function locks the screen surface if necessary, invokes the ‘launch_kernel’ function for CUDA-based rendering, and updates the screen. The ‘main’ function initializes SDL, sets up the screen, handles user input, and measures program execution time.
70-cuda-rasterizerThe program implements a rasterizer, a common technique in computer graphics, to convert geometric shapes into pixel-based representations for screen display. It includes CUDA for GPU parallel processing and features functions for barycentric coordinate computation, polygon drawing, and mesh rasterization.
74-Evert-cuda-30fovThe program snippet serves as a foundation for ray-tracing algorithms by defining essential constants and data structures, offering vector and quaternion operations, and providing various helper functions for computations and data processing in ray tracing.
91-tsdf-voxel-grid-fusionThe program efficiently fuses multiple depth maps into a projective truncated signed distance function (TSDF) voxel volume, enabling the generation of high-quality 3D surface meshes and point clouds with GPU acceleration via CUDA and using OpenCV for image handling. The provided demo demonstrates the fusion of 50 depth maps into a TSDF voxel volume, facilitating the creation of a 3D surface point cloud for visualization in software like Meshlab version 2022.02.
92-voxelizer-spheresThe program voxelization engine converts .obj meshes into voxel grids (.obj or binvox). While it rapidly generates large files, caution is needed for potential output size. Core functionality involves voxelization, adjustable resolution, and optional vertex sampling. Parallel processing is pivotal for efficient voxelization.
93-raycast-with-phong-shadeThe program is a 3D ray caster which renders scenes with spheres using the Phong reflection model, inspired by the ‘Ray Tracing in One Weekend’ series and NVIDIA’s ‘Accelerated Ray Tracing in One Weekend in CUDA’ blog post. Key features include parallel ray casting for scenes with customizable spheres and light sources. Dependencies include CUDA SDK 10.1, OpenGL 4.6.0, and GNU Make 4.2.1, with scene complexity adjustable through command-line arguments.
94-animation-for-some-spheresThe program is an advanced animation rendering technique that employs ray tracing for highly realistic animated scenes, delivering lifelike lighting, shadows, reflections, and refractions. It excels in various scene types, offering customization options and finding applications in film, gaming, advertising, and animation production, providing immersive visual effects through advanced rendering capabilities.
95-buddhabrot-fractalThe program utilizes CUDA and GPU resources to efficiently render the Buddhabrot fractal with customizable parameters. It supports grayscale image generation, resolution adjustment, and iteration parameter tuning, saving images in .pgm format. Buddhabrot colorization is post-processed by combining single-channel images rendered with different settings. This versatile tool excels at generating intricate and high-quality fractal visuals.
97-fluid-smokee-simulationThe program efficiently simulates fluid dynamics and renders volumetric data. Leveraging GPU parallelism, it adheres to computational fluid dynamics principles for fluid simulation and employs ray marching techniques for volumetric rendering. The program offers a streamlined user experience and optimal GPU utilization, making it suitable for both learning and customization.
Table 6. The Comprehensive Characteristic Importance Ranking of Random Forest.
Random Forest Characteristic RankingProportion
achieved_occupancy31.25%
global_store_requests14.80%
inst_integer8.33%
inst_fp_327.98%
flop_count_sp_fma3.60%
inst_misc3.48%
inst_compute_ld_st2.82%
l2_write_transactions1.73%
warp_execution_efficiency1.33%
flop_count_sp1.27%
Table 7. Comprehensive Characteristic Importance Ranking of Four Machine Learning Algorithms.
XGBoost%Adaboost%GBDT%ExtraTrees%
flop_count_sp_fma38%achieved_occupancy20%inst_integer29%achieved_occupancy22%
flop_count_sp15%global_store_requests16%achieved_occupancy27%inst_replay_overhead11%
inst_compute_ld_st12% inst_fp_326%inst_fp_3215%stall_constant_memory_dependency8%
achieved_occupancy11%tex_sm_utilization5%global_store_requests5%warp_execution_efficiency7%
inst_control11%l2_tex_write_hit_rate3%l2_utilization3%warp_nonpred_execution_efficiency7%
inst_misc10%warp_nonpred_execution_efficiency3%l2_read_throughput2%global_reduction_requests6%
global_store_requests6%inst_integer2%inst_replay_overhead2%inst_inter_thread_communication3%
gld_throughput5%inst_misc2%tex_sm_utilization1%issued_ipc3%
ldst_fu_utilization4%inst_control2%warp_execution_efficiency1%issue_slot_utilization2%
tex_sm_utilization3%inst_issued2%warp_nonpred_execution_efficiency1%tex_sm_utilization2%
Table 8. The Final Characteristic Importance Ranking of Rendering Programs.
Final Characteristic RankingProportion
achieved_occupancy0.22
flop_count_sp_fma0.21
inst_integer0.13
global_store_requests0.10
inst_fp_320.10
inst_compute_ld_st0.07
inst_misc0.05
warp_nonpred_execution_efficiency0.04
warp_execution_efficiency0.03
tex_sm_utilization0.03
Disclaimer/Publisher’s Note: The statements, opinions and data contained in all publications are solely those of the individual author(s) and contributor(s) and not of MDPI and/or the editor(s). MDPI and/or the editor(s) disclaim responsibility for any injury to people or property resulting from any ideas, methods, instructions or products referred to in the content.

