1. Introduction
The implementation of the representative papers’ evaluation system, and the transformation of the evaluation of scientific research institutions, from quantity to quality, plays a vital role in developing a scientific research institution [
1]. Paying attention to the quality, contribution, and influence of research results can continuously promote the healthy development of researchers and scientific research institutions, promote scientific progress, and improve researchers’ academic levels. The current electronic journals, online conferences, and other channels have extensively promoted the publication of academic papers. According to the STM Global Brief 2021 [
2], there were more than 48,000 active academic peer-reviewed journals worldwide in 2020, and the number of papers continues to grow. In the face of so many publications and academic papers, it is natural to ask the following questions:
How can one objectively measure the importance of a paper? How can one evaluate the performance of a research institution in a specific research field?
At present, the evaluation methods of representative papers based on quantitative data are mainly divided into three categories: external characteristic indicators, citation analysis methods, and artificial intelligence combination methods. The external feature index method and the citation analysis method are relatively mature and widely used to evaluate achievements in scientific research, while the method of combining artificial intelligence is in its infancy.
The external characteristic index method directly uses the external attributes of the research results [
3], and evaluates the quality and influence of the research results using these external indicators, for example, the attributes of the journals in which the papers are published, including journal impact factors, key journal, retrieval databases, journal organizers’ level, etc. The external feature indicators have the advantages of being simple, open, and efficient. Meeting specific external feature indicators means that the scientific research achievements have reached specific standard requirements and have a certain quality level. However, this method has the disadvantages of “evaluating articles according to journals” and “only SCI” and cannot be used as the only standard when evaluating representative works.
Citation analysis is the focus of representative papers’ evaluation research. In 1955, Garfield [
4] first used citation frequency to evaluate papers’ importance. In 1965, Price [
5] proposed the citation network, which opened up a new way to analyze the relative value of research results in their research field. In 1977, Virgo [
6] verified the correlation between the frequency of citations and the importance of papers, laying a theoretical foundation for the evaluation of citations. Based on this method, researchers have continuously extended the direct citation counting method, the relative citation frequency method [
7], and the high citation frequency method [
8], H-index method [
9], SP index [
10], etc. Based on the citation network, researchers are gradually exploring the network characteristics’ impact on the evaluation of research results. The PageRank method [
11], and other social network theories have been widely used in the analysis of representative works, such as the self-avoiding optimal diffusion method [
12], the two-step value assignment method [
13], the Hi-index [
14], etc. The above method is based on an analysis of the citation network structure. To better judge the intrinsic value of the citation, the researchers mined the citation from the perspectives of citation strength [
15], citation position [
16], and citation sentiment [
17], to further obtain a more detailed academic evaluation.
Artificial intelligence, especially natural language processing technology, provides a technical tool for analyzing the content of papers. Combined with the citation network, by analyzing the citation, a representative work evaluation model can be established. In 2018, the academic influence evaluation method [
17], combined with supervised learning and the paper scoring method using a convolutional network [
18], was applied. In 2020, an academic evaluation method for fine-grained sentiment quantification of citations based on naive Bayesian classification [
19] was further proposed. The existing evaluation methods for representative works, combined with artificial intelligence, mainly focus on content analysis. How to combine the characteristics of the paper network structure of scientific research institutions, give full play to the advantages of artificial intelligence in processing big data, and analyze aspects such as content and influence from multiple perspectives requires further exploration by researchers.
The above methods cannot simultaneously analyze the semantic information of paper, institutions, etc., and the network structure characteristics between them, and then obtain the fused paper feature information. Semantic information contains a degree of similarity between papers, which can distinguish the citation strength between papers to a certain extent. Structural information can present the importance of the paper in this field at an intuitive level, thus reflecting the representativeness of the paper. Therefore, an effective fusion of the two kinds of information can more reasonably measure the influence of the paper in a specific field. We need to build a representative measurement model that can fuse the two kinds of information at the same time.
However, the graph neural network model can naturally integrate the semantic information of the node text and the structural information of the connection and relationship between nodes in the network. To overcome the above problem, the main goal of this paper is to build a heterogeneous network that can integrate papers, journals, conferences, and scientific research institutions. Moreover, on this heterogeneous network, the graph autoencoder [
20] technology can be applied to further obtain the ranking of the influence of academic papers.
The original graph convolution network (GCN) mainly deals with homogeneous graphs. In 2016, Kipf et al. [
21] proposed GCN and classified the graph nodes using the semi-supervised method. Due to the simplicity and efficiency of GCN, graph neural network methods are a research hotspot in many fields. Researchers have gradually developed multiple versions of graph convolution network that can handle recommendation systems [
22], drug association prediction [
23], traffic flow prediction [
24], etc. To automatically handle multi-type edge information in heterogeneous networks, graph transformer networks [
20] were created. Moreover, this network has achieved an excellent performance in text representation [
25], multi-behavior recommendation [
26], image classification [
27], and other fields. In this paper, based on the graph convolution networks and graph transformer networks, the measurement methods of representative papers are studied, which further expands the application scope of graph neural networks.
This paper studies the measurement methods of representative papers, and the main contributions of this work are as follows.
We propose the GAEPIM framework, a node representation method based on a graph auto-encoder, to identify influential papers in heterogeneous citation networks.
Semantic information and network structure information are comprehensively processed in terms of paper impact measurement. This paper uses the RoBERTa embedding method to obtain the semantic information of the network vertices. Then two GAEPIM models are designed based on graph convolutional networks and graph transformer networks to aggregate the semantic and structural information of homogeneous or heterogeneous networks.
The comprehensive experiment was conducted on two academic citation networks in two academic research fields: biological computing and membrane computing. Compared with six baseline algorithms, the proposed GAEPIM framework has a superior performance.
Structure of the paper:
Section 2 introduces preliminaries, including heterogeneous network concepts and the graph auto-encoder model. In
Section 3, we study the GAEPIM framework in depth. We then conducted extensive experiments on the paper datasets of the two research fields and compared them using different advanced models in
Section 4. In the last section, we summarize our results and provide suggestions for future work.
2. Preliminaries
Before introducing the specific models proposed in this paper, we provide some prerequisite information. We first introduce the concept of heterogeneous networks and compare heterogeneous and homogeneous networks. Then, we introduce the auto-encoder framework based on the graph convolutional networks. Finally, we briefly describe the core of graph transformer networks.
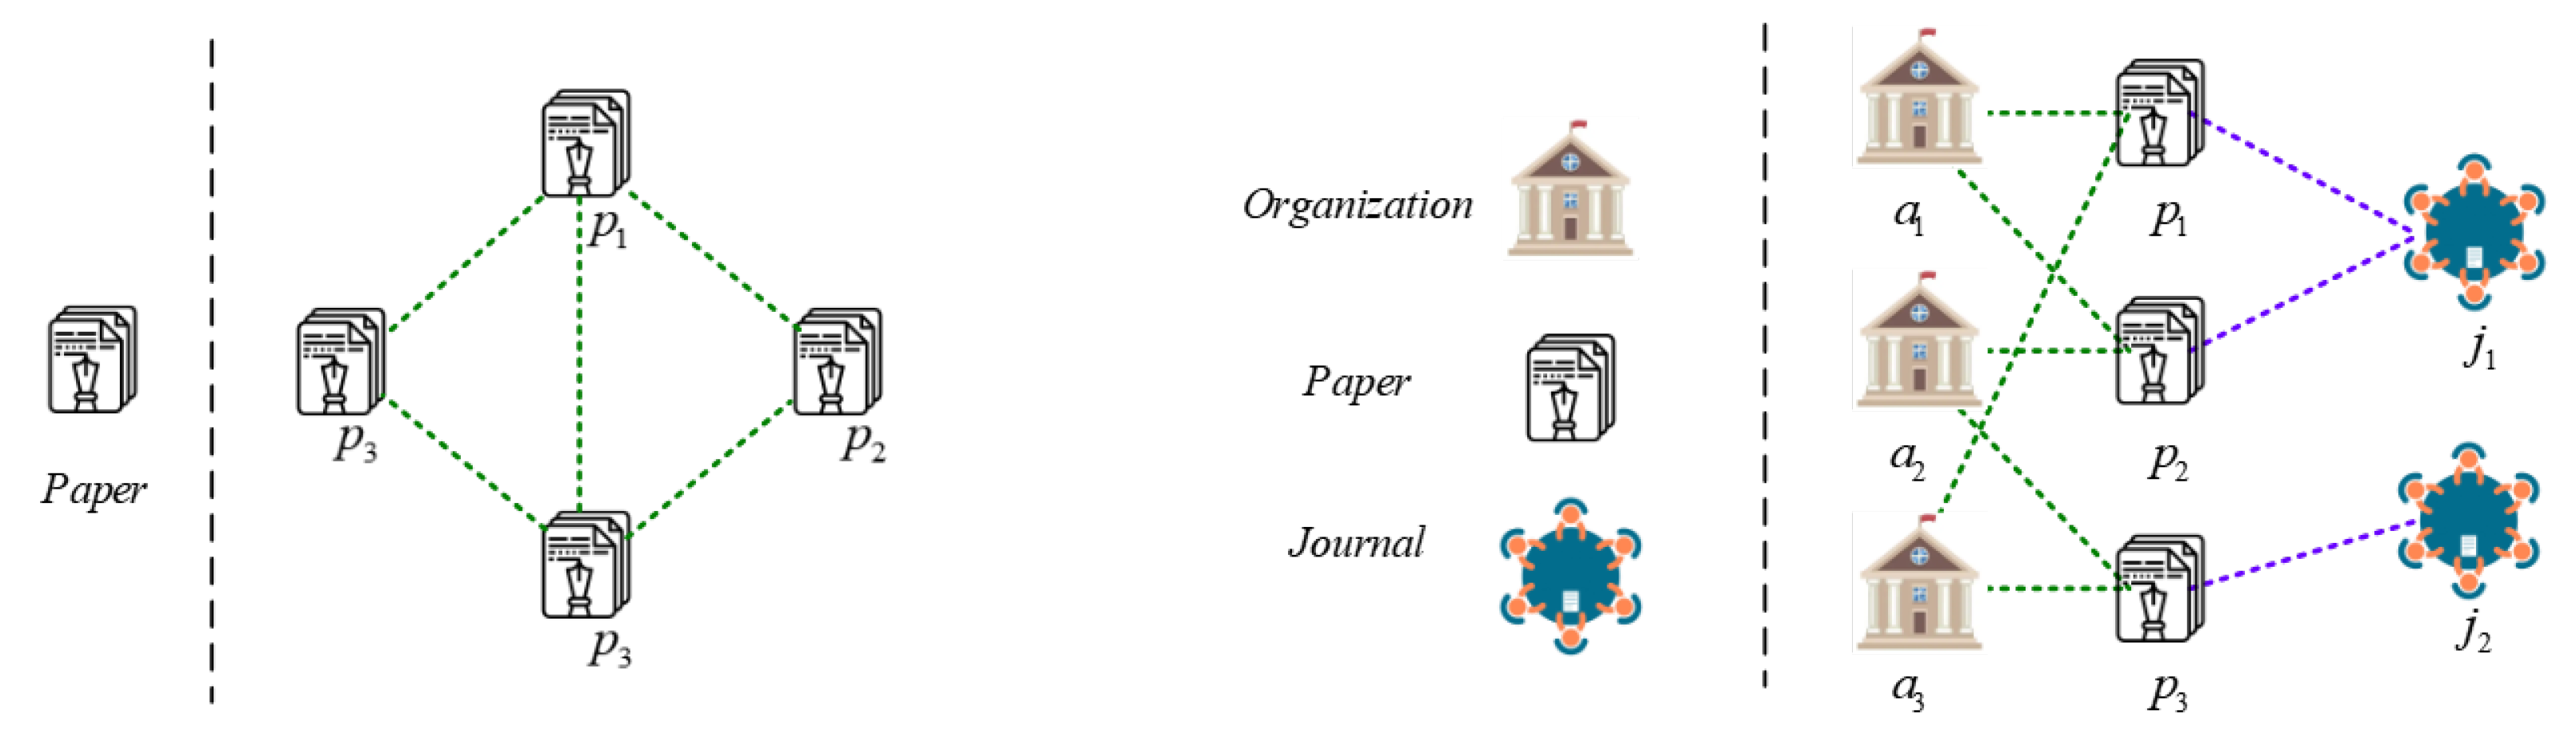
Networks are widespread in daily life [
28]. We can divide networks into homogeneous and heterogeneous networks according to the number of node types and edge types in the network. If a network has only one type of node and one type of edge, then we call it a homogeneous network; otherwise, we call it a heterogeneous network [
20]. The networks are shown in
Figure 1.
We provide a formal definition of heterogeneous networks below.
Definition 1. (Heterogeneous Network). Let be a network where is the nodes set and E is the edges set. There are two types of mapping function: node-type mapping function and edge-type mapping function where represents the non-empty node-type set and edge-type set. If , then network G is called a heterogeneous network.
In a homogeneous network, we can describe the relationship between nodes in the network through the adjacency matrix A, where if there is an edge between node i and node j. From the above definition, it can be concluded that heterogeneous networks have more structural characteristics than homogeneous networks, and the relationship between different types of nodes and edges can often reflect different network attributes. Next, we provide the concept of the heterogeneous network adjacency matrix set according to the characteristics of the heterogeneous network.
Definition 2. A heterogeneous network with the number of nodes as , and being the types set of edges. Let be the set of adjacency matrices of the heterogeneous network, where . If there is an edge of type k between node i and node j in the heterogeneous network G, then ; otherwise, .
Here, we provide a brief overview of graph convolutional networks [
29]. Graph convolutional networks (GCN) are computed on homogeneous networks. Here, we suppose
is the adjacency matrix of
G and
is the feature matrix of nodes on homogeneous network
G. GCN fuses the information in the network by performing the following calculations:
where
is a nonlinear activation function, and
is the trainable weight matrix with
.
is the feature representation matrix of the
l-th hidden layer; each row of
corresponds to the embedding of each node in the network in the hidden layer
l. The matrix
is the adjacency matrix of the network with self-loop, and
is the degree matrix of
, with
. Moreover, the matrix
comes from applying the normalization trick. However, the citation relationship between papers is directional, and we use another normalization trick in the proposed model.
In the article, we propose a new evaluation model for representative papers based on the auto-encoder framework. We introduced the graph auto-encoder to homogeneous networks. The graph auto-encoder model (GAE) uses the graph convolutional network as the encoder model and uses inner product operation to implement the decoder model. The target of the decoder is to reconstruct the adjacency matrix
A of the homogeneous networks. To simplify this, we used
to represent the GCN model with input feature matrix
X and adjacency matrix
A.
As mentioned above, the original GCN is processed for homogeneous networks. In this paper, we built a paper-organization-venues heterogeneous network for computing, and we also introduced a graph transformer network (GAT) that can automatically fuse heterogeneous edge information, and then proposed a representative paper measurement model of the heterogeneous network version based on GAT. The core of GAT is to linearly combine different types of edges through learnable weights. This mechanism is outlined here.
For the heterogeneous network
G, let
be the set of adjacency matrices for the heterogeneous network. Then, the linear combination of adjacency matrices in
was used to generate multiple pairs of new networks. Next, each pair of matrices was multiplied so that each entry obtained by multiplication in the new matrix corresponds to a meta-path. Specifically, a pair of new networks was generated by the following formula:
where
are coefficients of the linearly combination of adjacency matrices in
,
.
are trainable weights. Given a pair
can be regarded as the weighted adjacency matrix of length 2 meta-path. The GAT can then use this newly generated adjacency matrix to implement the next steps of the original GCN.
3. Methodology
This section describes our proposed model. The aim of this paper is to construct heterogeneous networks and achieve the representation learning of network nodes. We propose two models based on the GAEPIM framework: a graph convolution network paper impact measurement model (GCNPIM) and graph transformer network paper impact measurement model (GTNPIM). We first provide a sketch of the models, then introduce each step in detail.
Sketch of GAEPIM: As described above, a citation network can be formed between papers, a network can be formed between papers and institutions, and a publishing network can be formed between papers and journals and conferences. We built the GAEPIM model based on the three networks of papers in a specific research field. As shown in
Figure 2, we divided the model proposed in this paper into four steps: the first step is to construct a heterogeneous network, the second step is to learn vector representations for each node in the network, the third step is to calculate the similarity of network nodes through cosine similarity, and the fourth step is to calculate the score of papers to obtain the ranking of representative papers.
3.1. Step 1: Heterogeneous Network Construction
To take full advantage of the associations between papers, organizations, and journals, we constructed a heterogeneous network. The nodes of this heterogeneous network consisted of papers, organizations, conferences and journals for the publication and citation data for papers in a specific field. Based on this network, we can further mine paper citations’ structural characteristics and measure papers’ impact in a specific field. We used the public dataset DBLP Culture network V13, which includes 5,354,309 papers and 482,227,950 papers in many research fields. Each paper includes the title, author, institution, published journal, keywords, and other attributes.
Given this dataset, we constructed the paper–organization–venue heterogeneous network as follows. We considered three types of nodes—organization, paper, and venue—and four types of edges: paper–paper, paper–venue, paper–organization, venue–organization, and organization–organization. We denoted these using and respectively. Then, the heterogeneous network G was given by , where . The elements of E were tuples, with and being two corresponding nodes.
We assigned the weight of edges according to their different types in the heterogeneous networks. As the number of papers published in different journals varies greatly, to reduce the impact of this difference on the evaluation of representative papers, the weight of edge was assigned based on the venue nodes’ degree. For edge and , with , the weights of and were . Similarly, we calculated the degree of each organization node, and set the weight at for type edge. Lastly, we set the weights as 1 for the edge.
Unlike the existing heterogeneous network, the heterogeneous network we built included the paper citations, the subordination of papers and journals, the nodes of scientific research institutions and their relationships. This paper aims to evaluate representative papers within a specific research field and to further obtain papers that are representative of scientific research institutions. The introduction of research institution nodes in the heterogeneity network is more suitable for the task of evaluating representative papers of research institutions.
3.2. Step 2: Network Node Representation Learning
In step 2, we constructed the feature representation of network nodes. Here, the initial features of each node used the pre-training embedding obtained by the RoBERTa method [
30] and then obtained the feature representation of each network node using the graph auto-encoder. We designed two kinds of auto-encoder models based on the original graph convolution network model acting on homogeneous networks and the graph transformer network model oriented to heterogeneous networks.
Before designing the graph auto-encoder model, it was necessary to perform an initial feature assignment for each node in the network. In the dataset, each article has a title, and each institution and venue has a name. Here, we introduced the RoBERTa pre-training model so that the text of each node has semantic information. To reduce the calculation costs, we used the principal component analysis method to compress the embedding into a 10-dimensional vector. Next, we will introduce the auto-encoder model in detail.
First, we introduced the model based on the homogeneous network. We ignored the heterogeneity of the network and regarded all nodes in the heterogeneous network as equivalent. Then, the graph convolution network model was applied. We used a two-layer graph convolution network to describe the model as follows:
Given the heterogeneous network
, we treated this as a homogeneous network. Supposing
is the adjacency matrix of
G,
is the feature matrix. Following Equation (
1), the two-layer GCN-based auto-encoder takes the following formula:
Here,
,
are trainable weight matrices for GAE,
is Sigma function, and
is applied entry-wise. Based on the output
, the auto-encoder error for adjacency matrix reconstruction is defined by the cross-entropy loss:
The proposed GCN-based auto-encoder architecture is shown in
Figure 3. We should point out that a two-layer GCN performs the reconstruction task in our framework, and there are two hidden embeddings (
) in each node. We used
as the node feature representation. Following the same main idea, we considered the heterogeneous network to modify the graph auto-encoder model based on Graph Transformer Networks [
20]. For the heterogeneous network
G, we let
be the feature matrix, and
be the set of adjacency matrices of the heterogeneous network.
We generated multiple pairs of new networks using the linear combination of adjacency matrices in
. Then, we multiplied each pair of matrices so that each entry in the new matrix obtained by multiplication corresponds to a meta-path. In our GAE-based model, we generated
M pairs of networks from
by
where
are coefficients of the linear combination of adjacency matrices in
,
.
are trainable weights. Given a pair
can be regarded as the weighted adjacency matrix of the length 2 meta-path. Then, we aggregated the features by graph convolutional layer:
where
,
represents the degree matrix of
, and
is trainable.
To further apply global network information and graph neural networks, we let
ve the single adjacency matrix of heterogeneous network. Furthermore, we used the same method as a homogeneous network to learn the feature representations.
Here,
represents the degree matrix of
,
is the trainable weight matrix of GAE,
is the Rectified Linear Unit and applied entry-wise, and
is Sigma function. Based on the output
, the reconstruction error was defined as the same as the homogeneous network version by the cross-entropy loss:
We illustrate the heterogeneous case in
Figure 4.
3.3. Step 3: Similarity Calculation
In the previous subsection, we learned the feature representation of all nodes through two version graph neural network methods, and obtained the hidden layer vectors
. When we described the model in this section, we used
H to represent the feature representation of nodes. We obtained the node feature representation matrix
of the heterogeneous network
, and further used the cosine similarity [
31] to obtain the similarity matrix
S between nodes. We can calculate the similarity between nodes in the heterogeneous network using the following formula.
where
and
are the
i-th and
j-th row of
H, representing the vector representation of node
i and node
j.
3.4. Step 4: Paper Ranking
To further obtain influential papers in the field, we calculated the score and rank of papers according to the similarity matrix shown above. Specifically, for node
i,
Finally, we ranked the papers according to the score. The higher the score for scientific research achievements in a specific field, the greater the influence of the achievements.
4. Experiments
In this section, we test the proposed GAEPIM framework’s effectiveness to measure the paper’s impact. In
Section 4.1, we first introduced the paper datasets of two specific research fields.
Section 4.2 and
Section 4.3 introduce two metrics and six baseline models to evaluate the model’s performance. The experimental results of the two research paper datasets are presented and compared with other baseline models in
Section 4.4. To further illustrate the advantages of the framework proposed in this paper, we conduct ablation experiments in
Section 4.5, and test the effect of different numbers of representative papers on information diffusion in
Section 4.6.
4.1. Dataset Description
We conducted experiments on Citation Network Dataset: DBLP-Citation-network V13 (CNv13) [
32]. The dataset extracted the citation data from DBLP, ACM, MAG, etc. Since the first version, this dataset has been updated many times. We used the latest version, version 13. CNv13 contains more than five million papers and nearly fifty million citation relationships. Each paper includes several attributes, such as id, title, author affiliation, paper venue name, year, keywords, etc.
This article aims to study the paper’s impact measurement method in a specific field and provide representative papers of scientific research institutions. We obtained papers from two research directions, using the keywords to create our two evaluation datasets: biological computing and membrane computing. For brevity, we abbreviate the paper datasets of biological computing and membrane computing as BCP and MCP, respectively. The following
Table 1 and
Table 2 show the basic statistics of the two datasets.
4.2. Evaluation Metrics
We ranked the papers in a specific field using the proposed method and obtained an orderly representative paper set
. The top
were taken as influential papers, which was about 50 papers in the two datasets. We used two measurement methods that are widely used to measure node importance and maximize their influence. One is robustness
R [
33], which was used to measure the importance of nodes. We removed one node within a particular network each time and then calculated the number of nodes in the maximum connected branch of the remaining network. The formula for this is as follows.
where
G is the original network;
is the subgraph after removing
nodes.
is the number of nodes in the largest component divided by the number of nodes of the original network
G. The above definition shows that the smaller the
R is, the faster the network connectivity is destroyed, which reflects the importance of the selected nodes.
Another measurement method is the independent cascade (IC) model based on information diffusion, which can capture the dynamic process of information transmission [
34]. The independent cascade model transmits the information of the active nodes to the associated nodes based on probability. Specifically, given a network
, except for the initial active node set, the initial state of other nodes in
V is inactive, and the edges in
E have a diffusion probability
p. This paper uses the nodes obtained by the proposed model as the initial active node set. The following describes an information diffusion process at time
t + 1. Node
u is a newly activated node at time
t. At time
t + 1,
u tries to activate the adjacent node
v with a probability of success of
p. If
u activates node
v, node
v becomes a newly activated node at time
t + 1. The state of node
v becomes active (at time
t + 2, node
v will try to activate adjacent inactive nodes); otherwise, node
v remains inactive. To verify the effectiveness of the paper ranking, we used the ordered representative paper collection
as the seed set and judged the total number of activated nodes when the diffusion process terminates. The more activated nodes there are, the greater the impact of the seed set.
4.3. Baseline Model
To comprehensively evaluate the performance of the GAEPIM framework, we compared it with the common complex network indicators that measure the importance of nodes, including k-shell, closeness, betweenness, and H-Index. At the same time, we introduced two graph representation learning methods, DeepWalk and node2vev, to replace the two graph convolution network algorithms proposed in this paper and obtain new measurement methods. A total of six baseline methods were compared and are listed in
Table 3.
There are four rule-based models for paper ranking: closeness centrality, betweenness centrality, H-index and k-shell.
Closeness centrality of a node denotes how easy it is for this vertex to reach other vertices. When the centrality of a node is significant, the probability of its information being transmitted to another node is also high, suggesting that its influence is also greater. For node
on
G, the closeness centrality is calculated by the following formula.
where
represents the shortest distance between nodes
i and
j.
Betweenness centrality is another indicator used to measure the importance of nodes. For node
on
G, the following equation was used to calculate the betweenness centrality.
where
is the number of shortest paths through node
i from node
s to
t, and
represents the number of shortest paths from node
s to
t.
H-index is a widely used author-influence measurement method, which means that the person has published h papers with more citations than h. We borrowed ideas from the reference and extended them to the measurement of network node influence; that is, the measurement of paper influence. For node i, its H-index was expressed as if it has, at most, h neighboring nodes with no fewer than h degrees; then, H-indexi = h. We finally sorted nodes by their H-index. The larger the H-index is, the greater the node influence.
K-shell is another widely used node-influence ranking model. Its specific calculation steps are as follows: first, find the nodes with degree 1, delete these vertices, and then repeat the above operation in the newly generated network until the degree of nodes in the network is greater than 1. Record the nodes that were deleted above as 1-shell. Further perform the above operations on the nodes with degree k () to obtain the node set k-shell until all nodes are deleted. The greater the k, the greater the node influence. The nodes of the same k-shell set are sorted by degrees.
DeepWalk is a widely used network node-representation learning method. It assumes that the more similar the two nodes are, the closer the vector representation of the two nodes. Based on the learning principle of word vector representation, DeepWalk combines random walk and word2vec methods for graph vertices. Firstly, the random walk algorithm obtains the sequence of vertices containing structural information in the network. Then, it uses the SkipGram and Hierarchical Softmax algorithm to learn the embedding of each node.
Node2vec is an improved version of the DeepWalk. It further optimizes the generation process of graph vertex sequence by introducing depth-first search and breadth-first search algorithms. As with DeepWalk, the model uses the SkipGram method to learn node embeddings.
DeepWalk and node2vec automatically learn the features of each node from the perspective of graph structure and then rank the impact of papers. The model based on two kinds of graph neural networks proposed in this paper contains the network’s structural features and reflects the paper’s semantic features to a certain extent. In the above methods, H-index and k-shell can directly obtain a importance ranking of papers. Other methods were used to obtain the embeddings of the paper nodes. Then, according to the third step in
Section 4.1, the paper’s ranking is obtained by calculating the similarity score.
4.4. Comparison with Baseline Models
As described in
Section 4.1, we generated two datasets in biological computing and membrane computing using keywords and built two heterogeneous paper–organization–venue networks, respectively. Based on the two networks, we conducted experiments on the above six baseline models and the two graph neural network models proposed in this paper. In our model, hyperparameter
. We selected the top
papers as representative papers in both fields.
We first compared GAEPIM with six baseline models using the independent cascade model in terms of the information diffusion of seeds. Here, we regarded the selected representative papers as the seed set, and the final number of activated nodes reflects the impact of representative papers. The maximum number of iterations for the activation process of the independent cascade model is 5; that is, there are up to five rounds of the diffusion process. In the information transmission process, each edge’s activation probability was randomly set. If the probability is greater than the diffusion probability of the edge, the active node activates the adjacent inactive node. This section conducted tests for edge diffusion probabilities of 0.1, 0.2,..., and 1, respectively. Moreover, the final number of activated nodes of different models on the dataset BCP and MCP under different diffusion probabilities is shown in
Figure 5.
Based on the
Figure 5, the proposed two GAEPIM-based models efficiently obtain network node correlations and capture influential papers. Among these algorithms, the rule-based paper ranking algorithm has the worst performance. These algorithms have the lowest number of active nodes in the case of different diffusion probabilities, which is related to the fact that these algorithms cannot independently obtain multiple types of structural information in the network. The DeepWalk and node2vec methods based on the random walk have significantly less influence than the algorithm proposed in this paper. This may be because the graph neural network model can obtain both structural and semantic information.
At the same time, we used another metric for testing, as shown in
Table 4. We selected a total of 50 papers (nearly 5%) as representative papers in a research field. We removed these representative paper nodes from the network in order of influence, from high to low. The value of robustness, R, was then calculated according to Equation (
13). The observation results show that the model based on the GAEPIM framework can obtain the minimum robustness R-value in the BCP dataset and almost the minimum robustness R-value on the MCP dataset. This result also reflects that the articles identified by the model proposed in this paper have in an important position in the network and are representative papers in their fields. Observing
Table 4 further, the heterogeneous encoder model GATPIM outperforms the homogeneous encoder GCNPIM on the biological computing data set. However, in the field of membrane computing, the results of GCNPIM are smaller. Observing
Table 2 in
Section 4.1, we can find that the proportion of each type of edge in the biological computing data set is similar. In contrast, in the field of membrane computing, the proportion of PP-type edges is more concentrated; that is, the heterogeneity of the biological computing network is higher. Then we can conclude that the heterogeneous encoder can perform better than the homogeneous encoder on the network with higher heterogeneity.
4.5. Results of Ablation Studies
As described in
Section 4.2, after introducing RoBERTa embeddings, we used the principal component analysis method to reduce the dimensions. To illustrate that the word embedding after dimension reductions in principal component analysis has no significant impact on the model’s performance, we conducted the same independent cascade information diffusion comparison experiments in this section, in
Section 4.4. As shown in
Figure 6, the word embedding results after dimension reduction using PCA (RoBERTa_PCA) are almost consistent with the original word embedding results (RoBERTa) under different information diffusion probabilities or, even better, under certain probabilities. Based on the above experimental results, we can conclude that the dimension of the original word embedding can be reduced by principal component analysis, thereby reducing the computational cost.
We further verified the role of heterogeneous networks in promoting the model’s performance. Three subnetworks were constructed based on the original heterogeneous network: the network
with only
edges, network
including
and
edges, and network
, including
,
and
edges. The comparative experiments were conducted based on these three networks; the results are shown in
Figure 7. The observation shows that the heterogeneous network constructed based on this paper can achieve the best performance.
4.6. Effect of Seed Set Size
Then, we tested the model’s performance with different numbers of representative papers, which is also the number of seed sets for the IC model. We calculated the IC model diffusion results with a number of seeds ranging from 1 to 50 under the conditions that the diffusion probabilities were 0.1, 0.3, and 0.5, respectively. That is, we use the representative paper sets with 1, 2,..., and 50 papers as the initial active node set of the independent cascade model. Then, we conduct experiments under the conditions of diffusion probabilities of 0.1, 0.3, and 0.5 to obtain the corresponding information diffusion result (at the end of the diffusion process, the number of nodes affected by the initial active node).
Figure 8 and
Figure 9 shows the results. For different diffusion probabilities and the number of seed nodes, GAEPIM framework can obtain the maximum number of active nodes at the end of diffusion. The figures show that the proposed models have high performance under different initial seed numbers. We can conclude that the proposed model can effectively obtain the most representative papers in a specific field.
4.7. Paper Ranking Results
In this subsection, we show the top five representative papers measured by the proposed model in
Table 5 and
Table 6. The tables show the latest paper citations. The paper citations were all high, but the order of papers and the order of the number of citations were different. The results show that the articles obtained by the method proposed in this paper are representative of their field.


