
Research of Islanding Operation and Fault Recovery Strategies of Distribution Network Considering Uncertainty of New Energy


Abstract
:1. Introduction
2. Island Division and Operation Model of Distribution Network
2.1. Objective Function
- (1)
- The principle of prioritizing important loads: In order to ensure the stability and reliability of the power grid, it is necessary to classify the loads according to their importance and give them different weights. When a fault occurs, the power supply of important loads should be ensured first to ensure the normal operation of the power grid.
- (2)
- The principle of maximum load: When allocating load to each isolated island, ensure that the total load matches the power supply capacity of the DG in the island in order to fully utilize the capacity of the DG and reduce the loss of power load. At the same time, it is also necessary to avoid the occurrence of DG overload.
- (3)
- The principle of minimum network loss: in order to ensure the economic operation of isolated islands and provide power to the load as much as possible, the active power loss of isolated islands should be minimized when formulating island plans.
2.2. Constraint Condition
3. Distribution Network Fault Recovery Model
3.1. Objective Function
3.2. Constraint Condition
4. Modeling and Solving Methods for Uncertainty in Distribution Networks
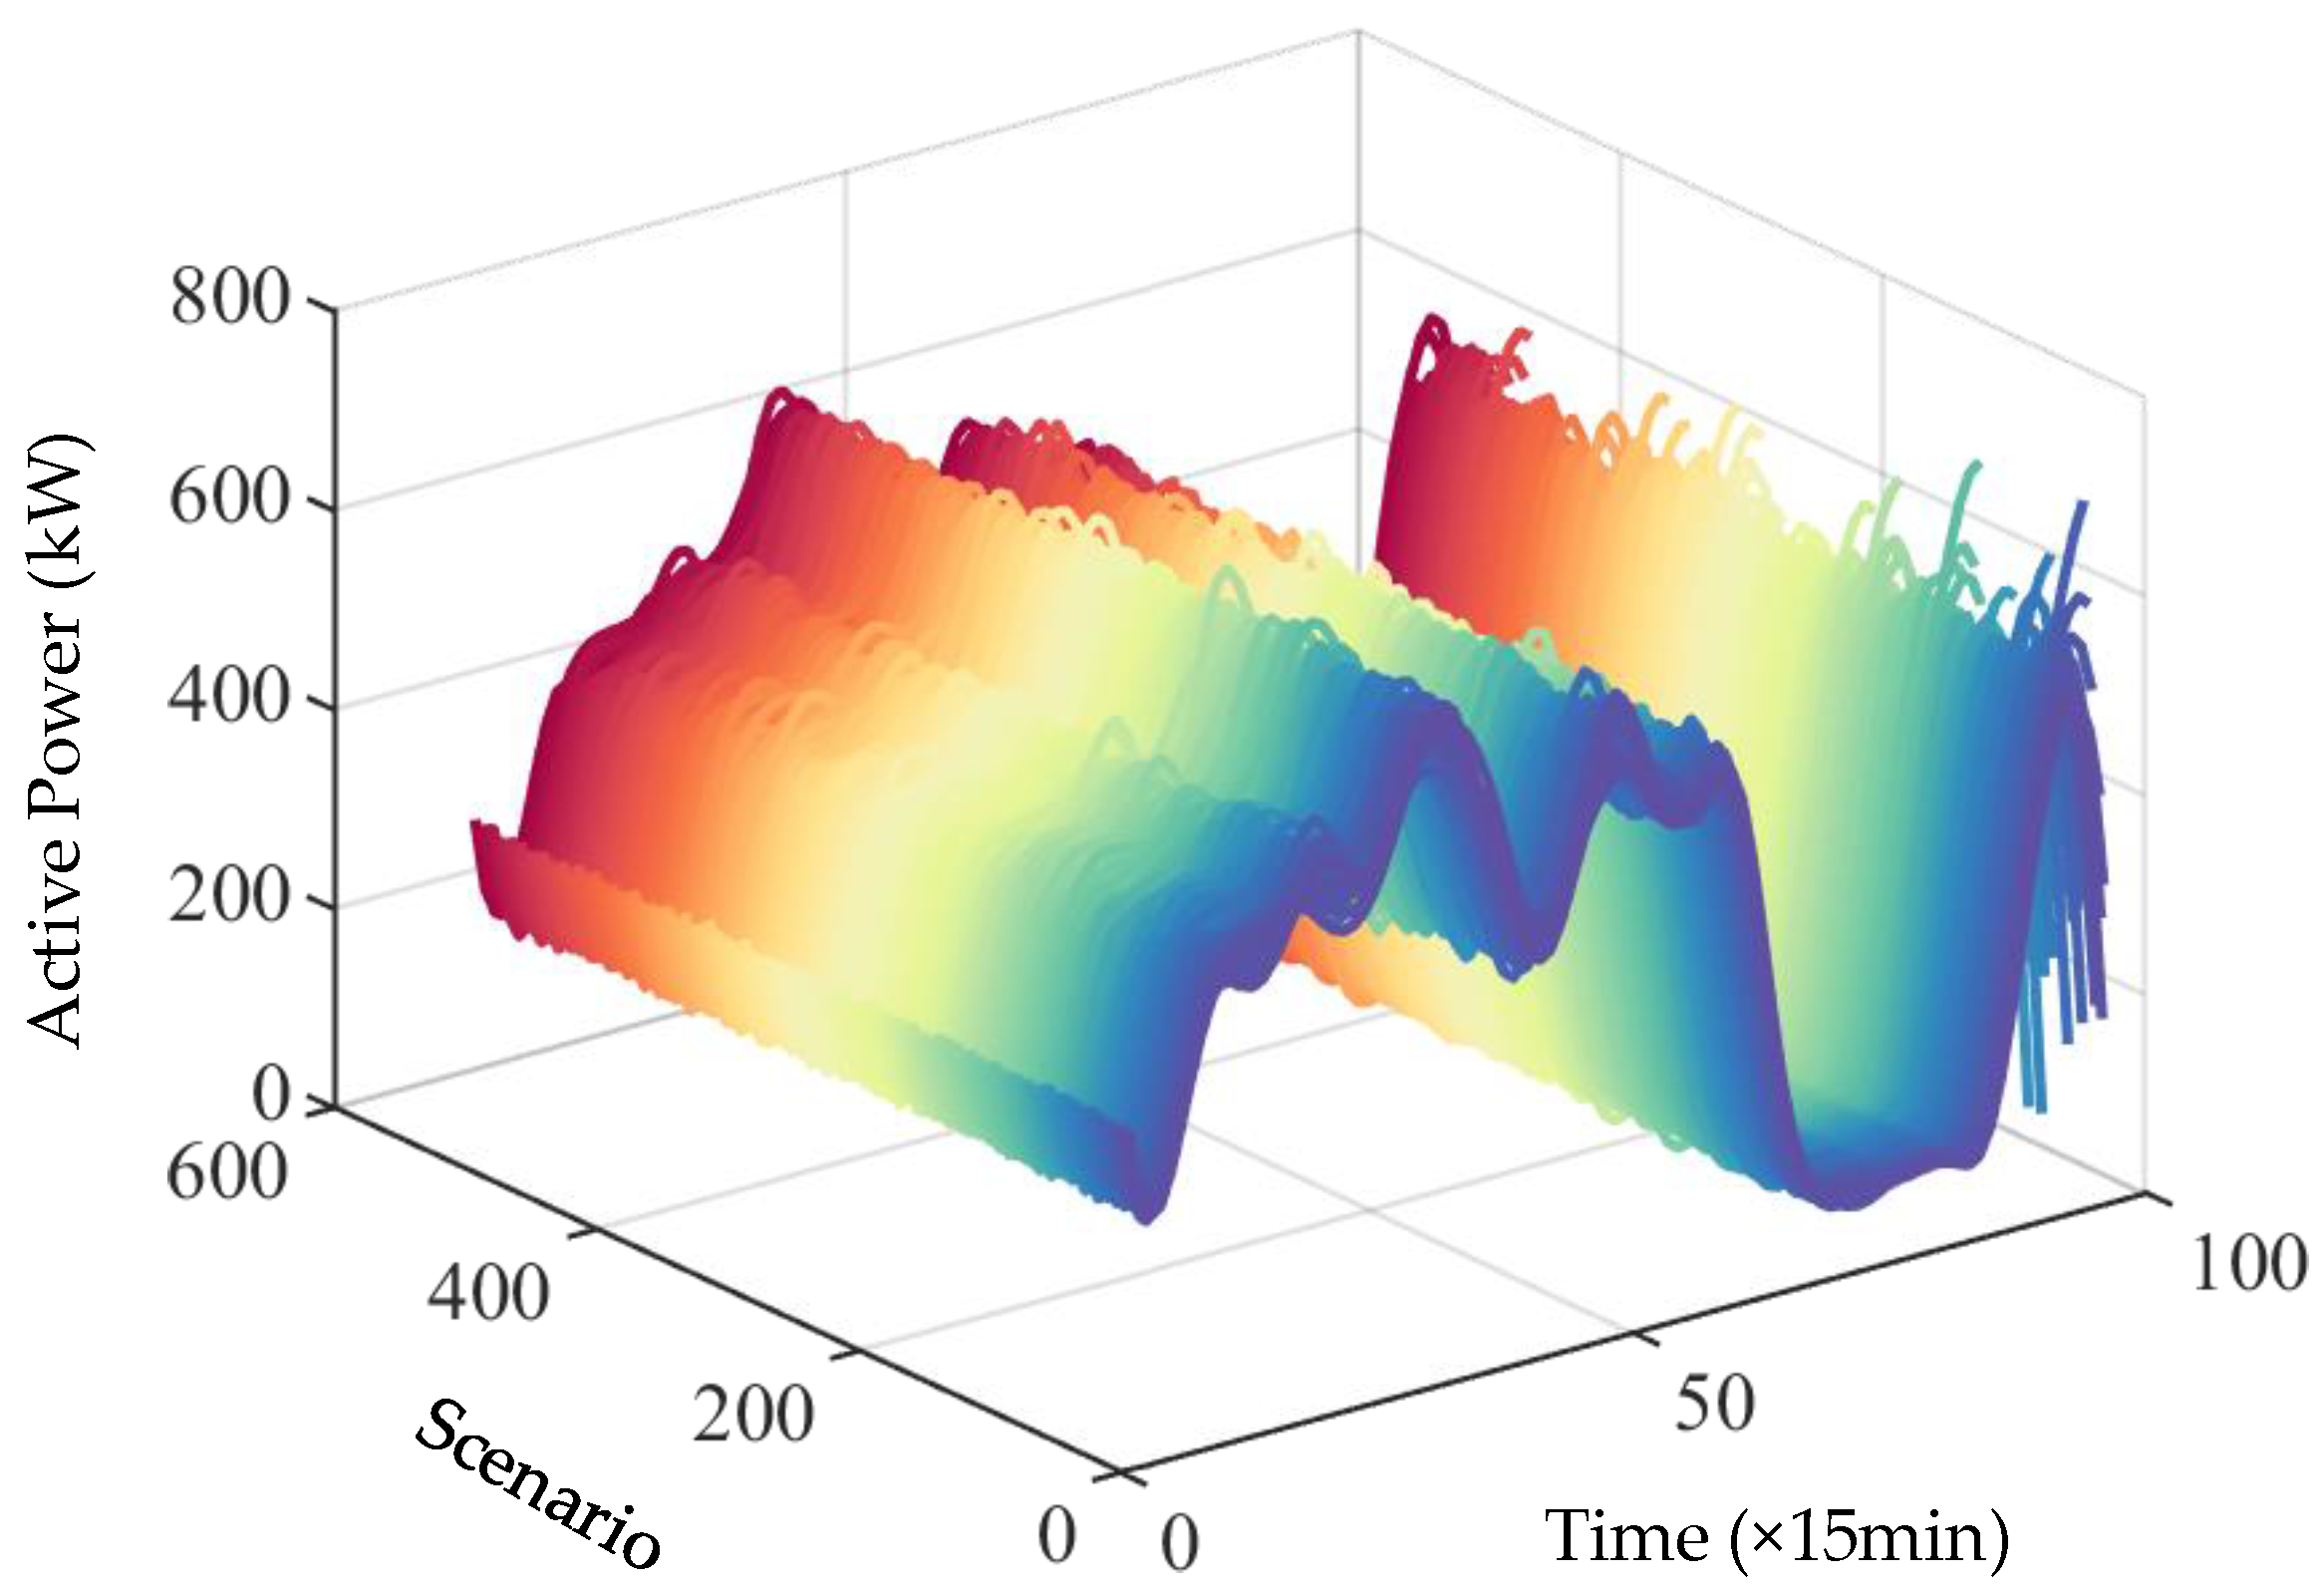
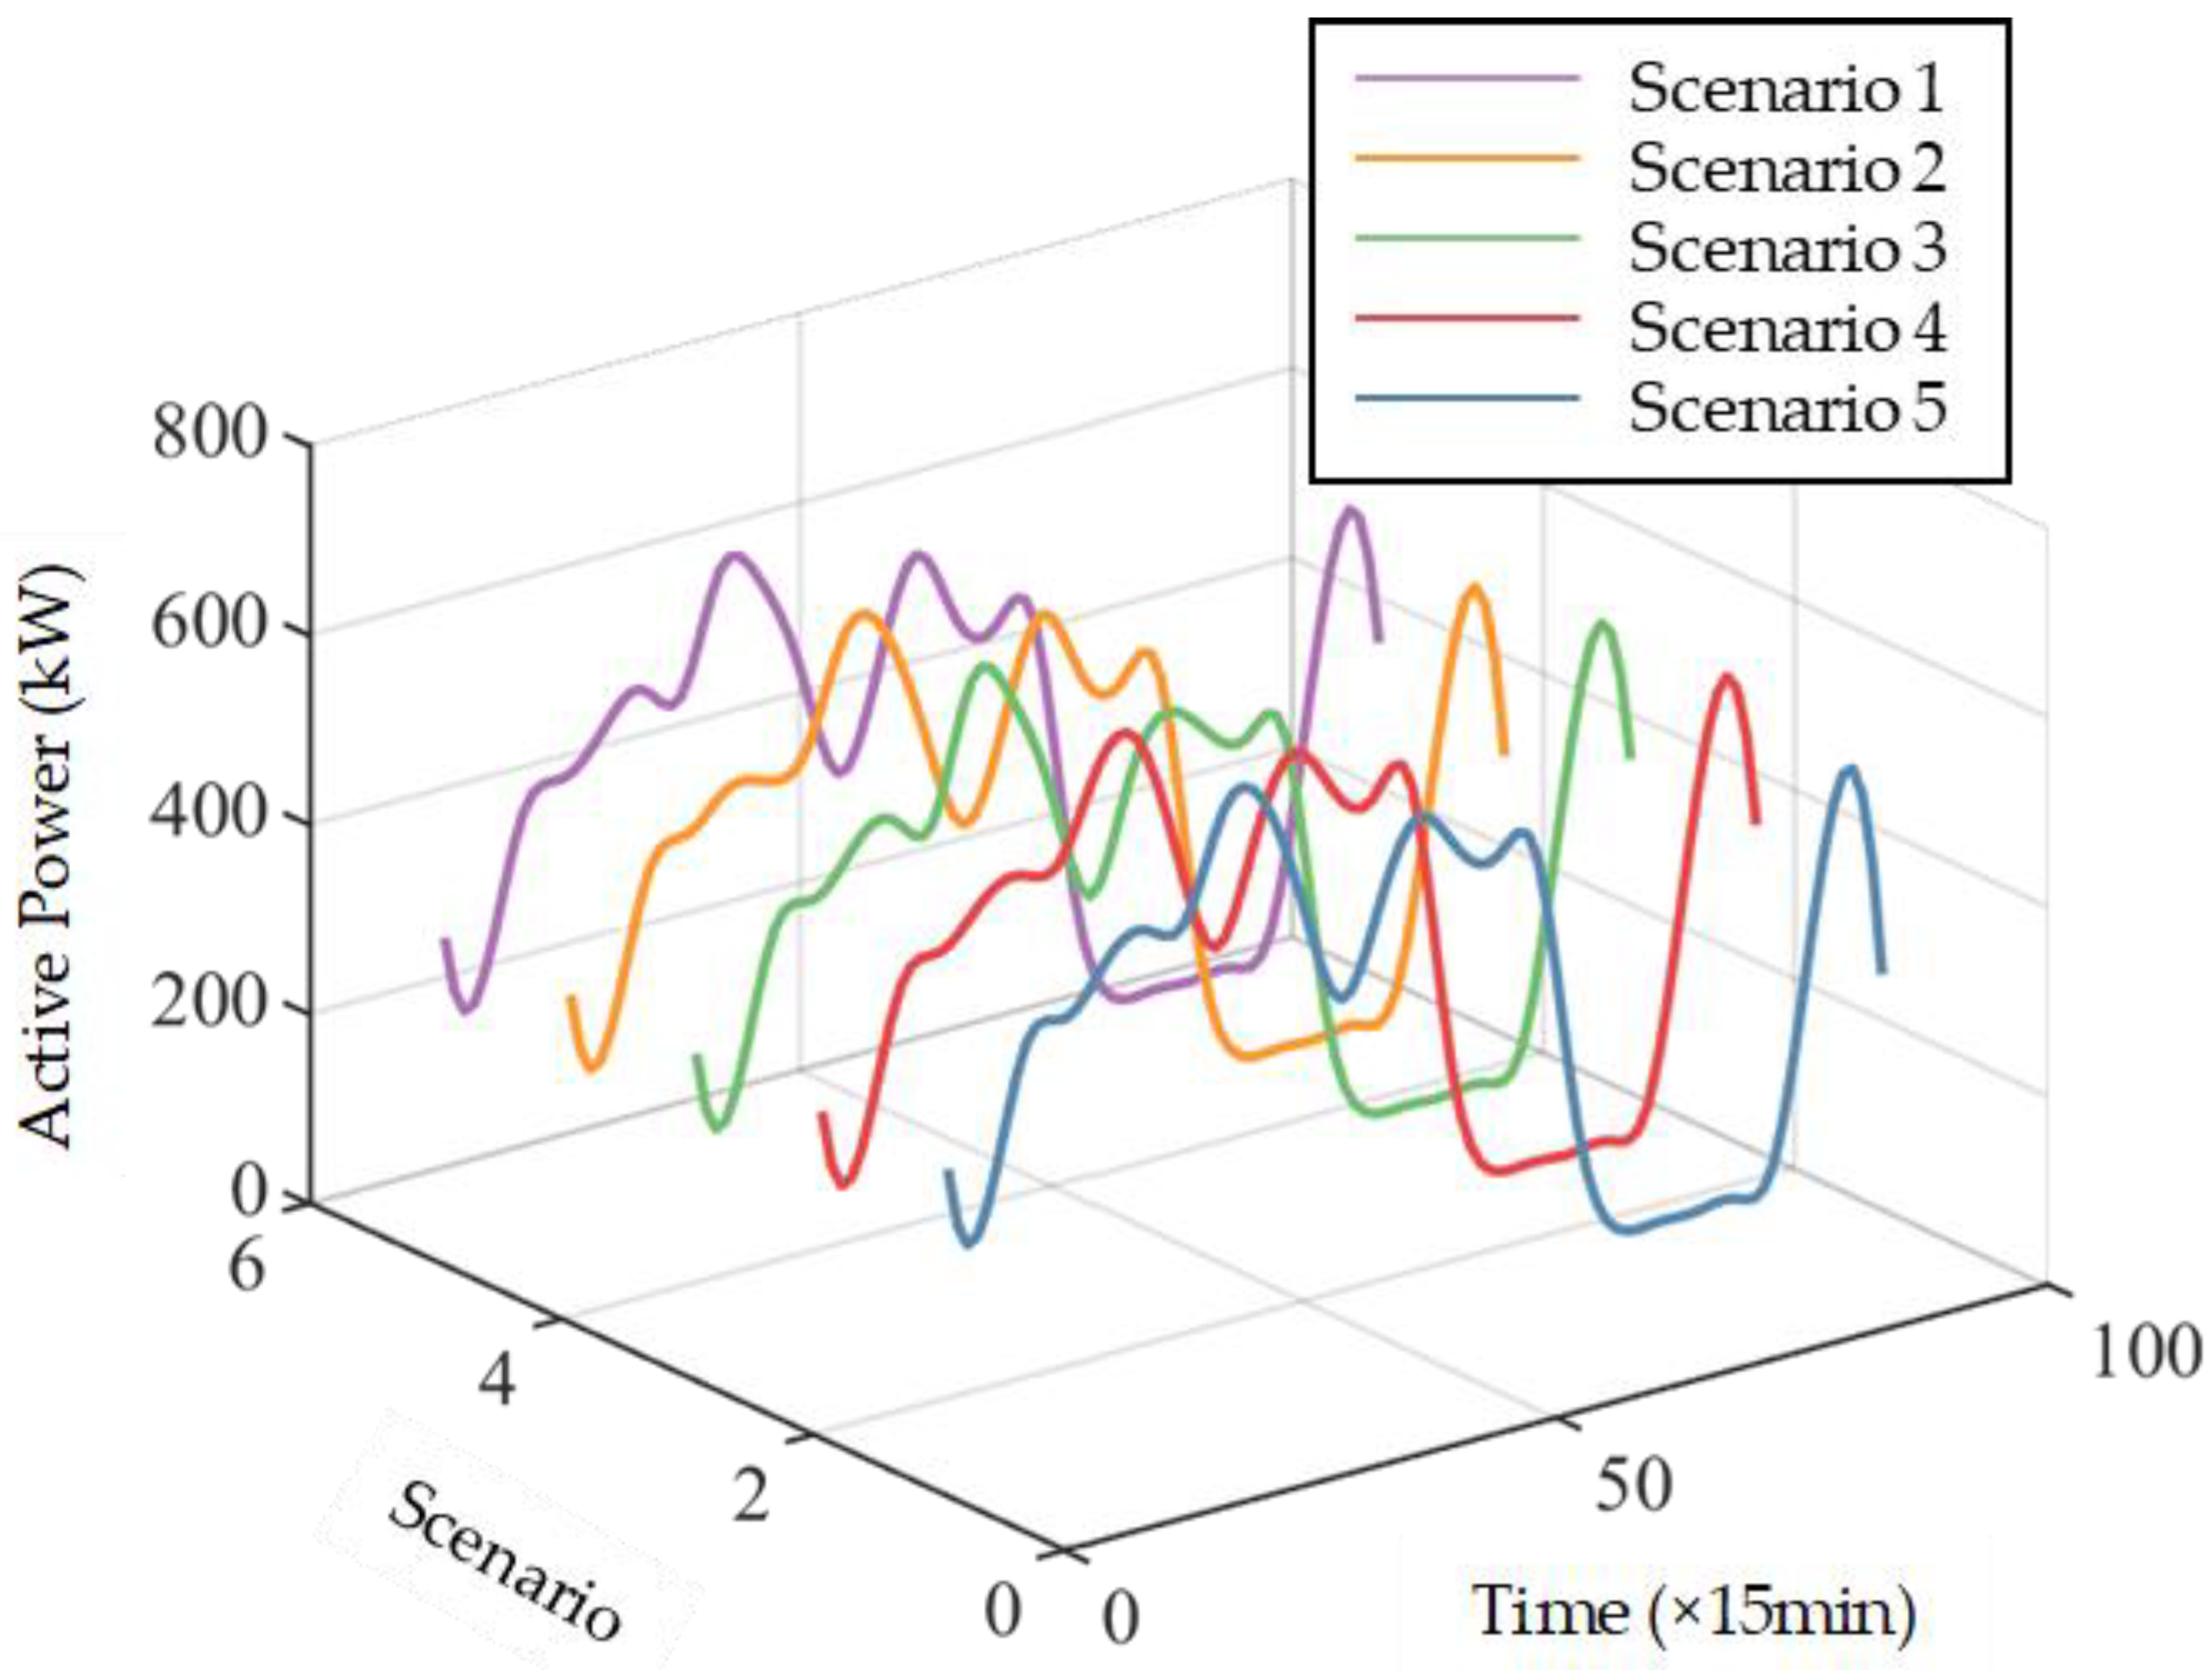
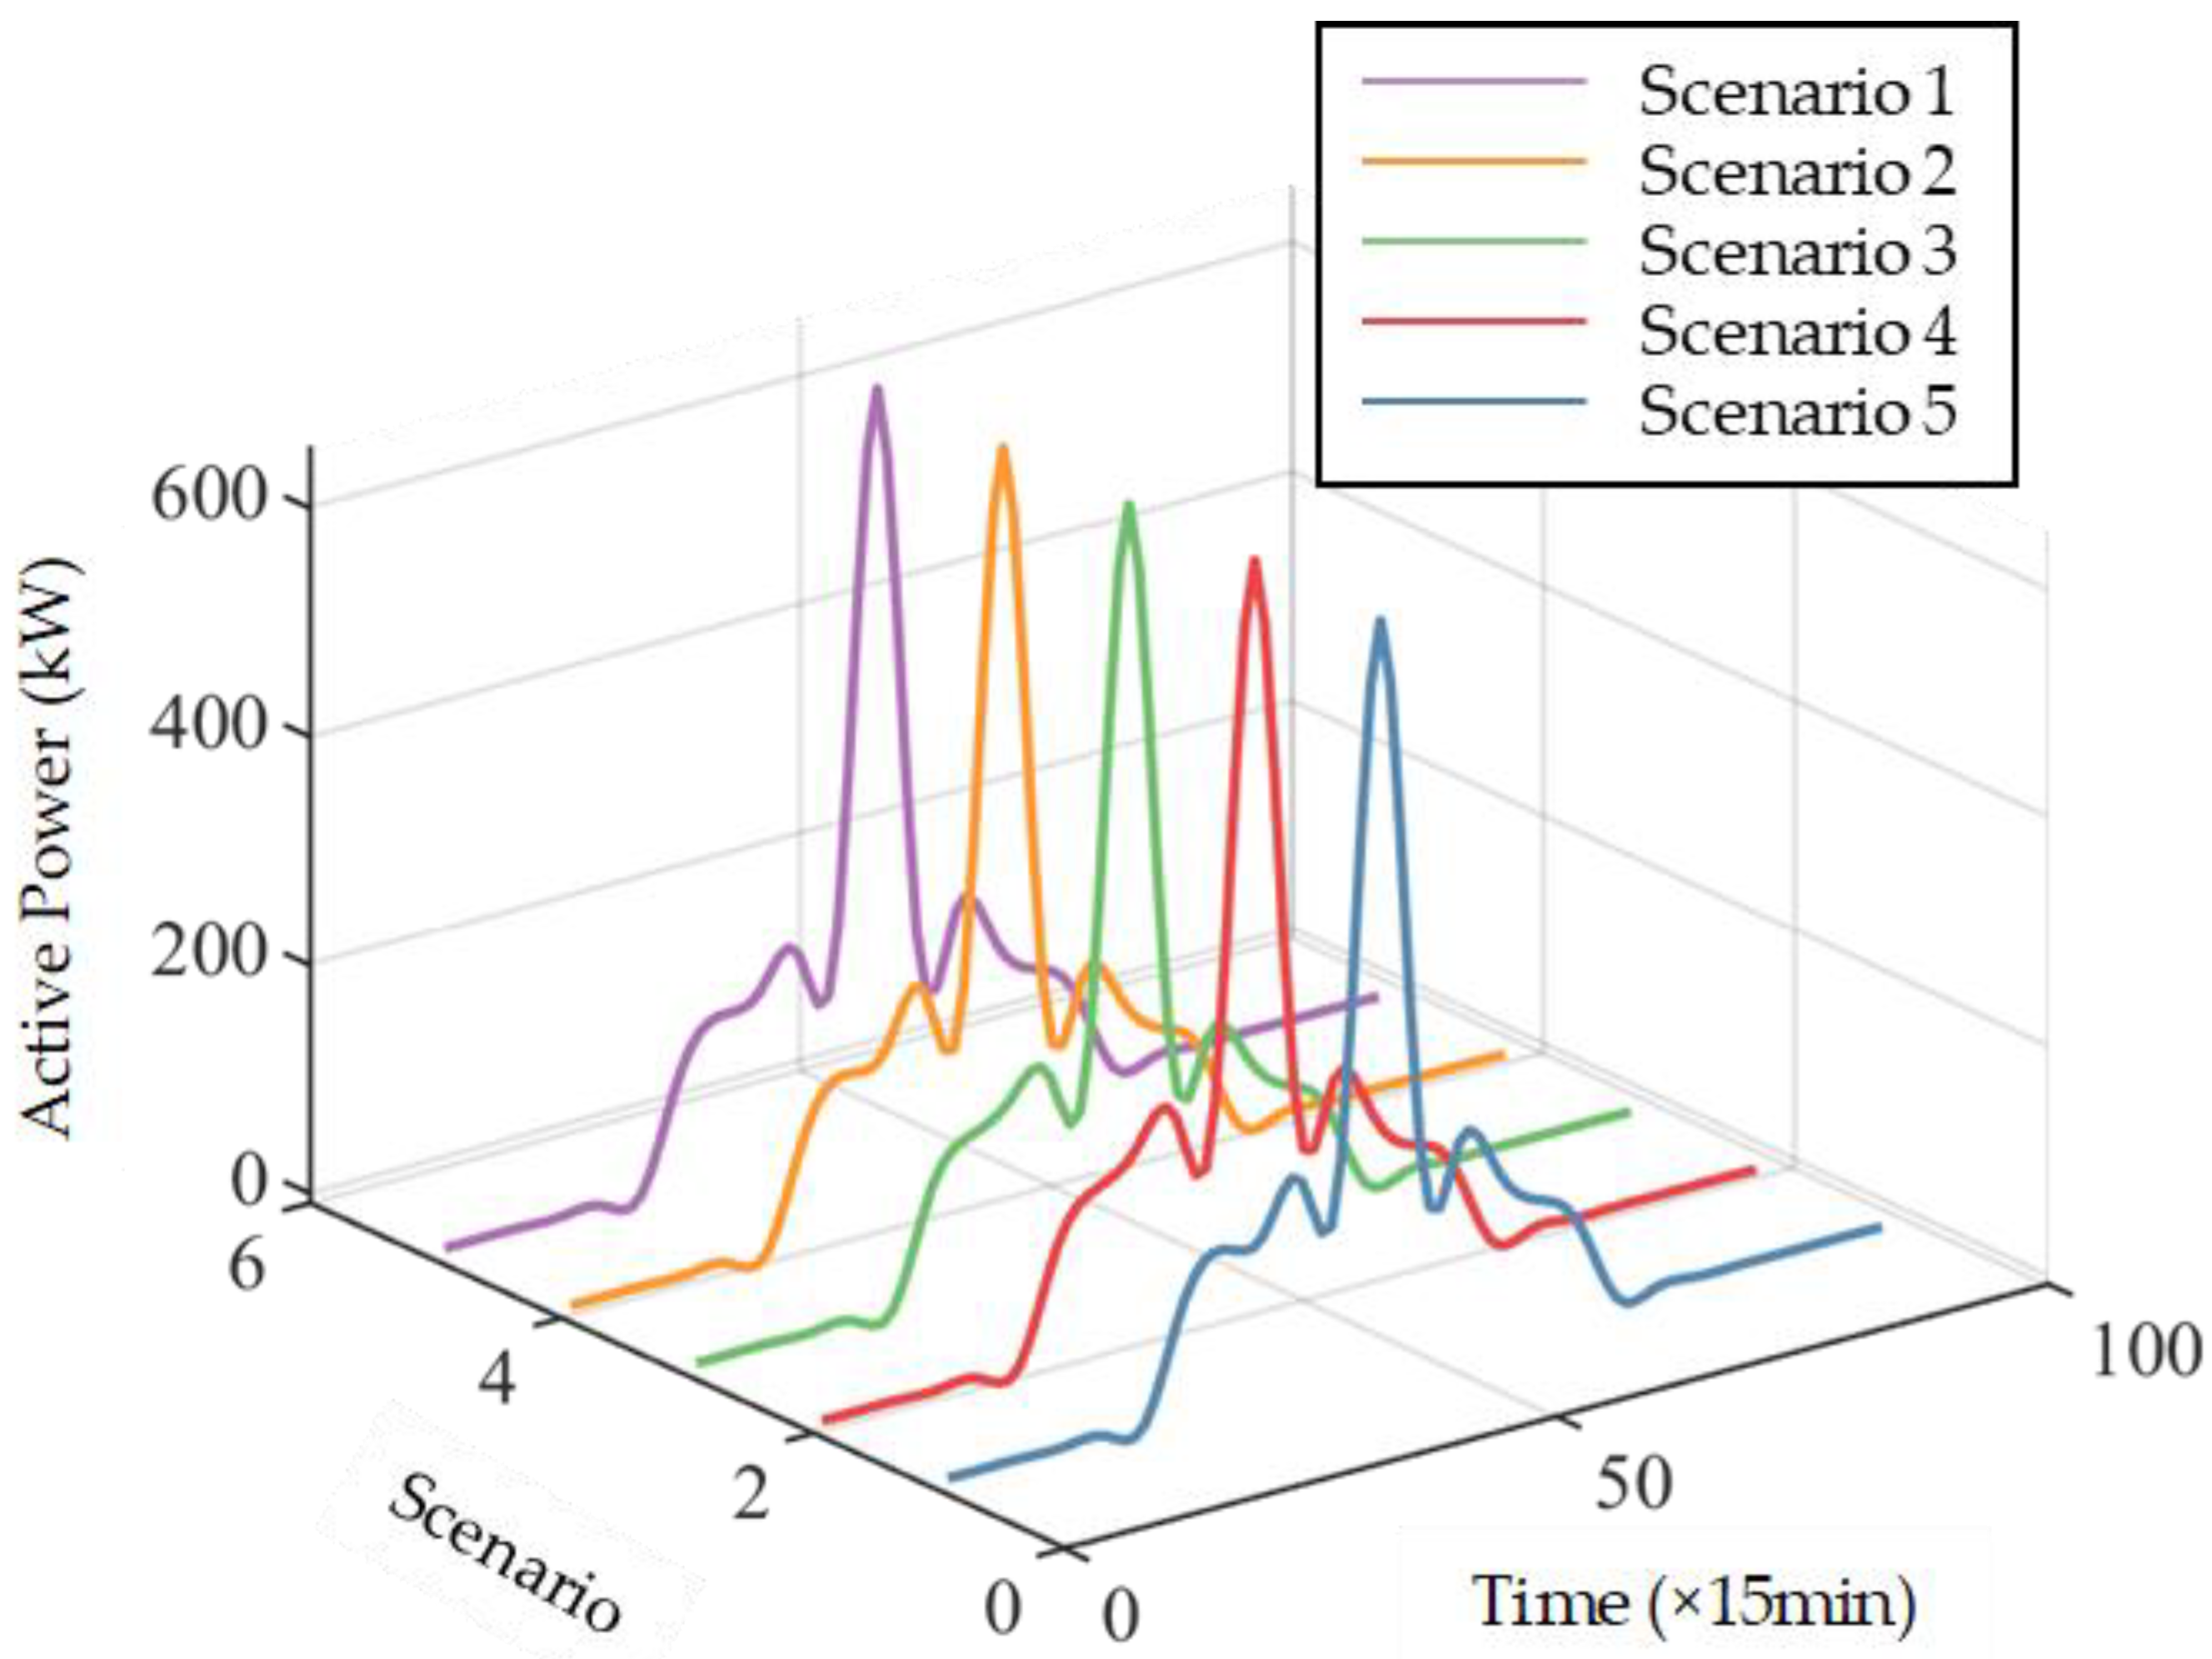
4.1. Uncertainty Modeling of Wind and Solar Power Plants
4.2. Model Solving Methods
- (1)
- Based on the generated output scenarios of N wind and solar power plants, set the clustering number to K and randomly select K clustering centers . Using the Formula (46), calculate the Euclidean distance between each pair of scenarios and the cluster center.
- (2)
- Divide each scenario into the nearest cluster center.
- (3)
- Calculate the average value of each cluster center data as the new cluster center and proceed to the next iteration.
- (4)
- Repeat steps 2–3, and when the set number of iterations is reached or the clustering center no longer changes, the clustering is completed and the scenario is restored to K.
- (5)
- Count the number of scenarios in each cluster center as its weight value .
5. Example Analysis
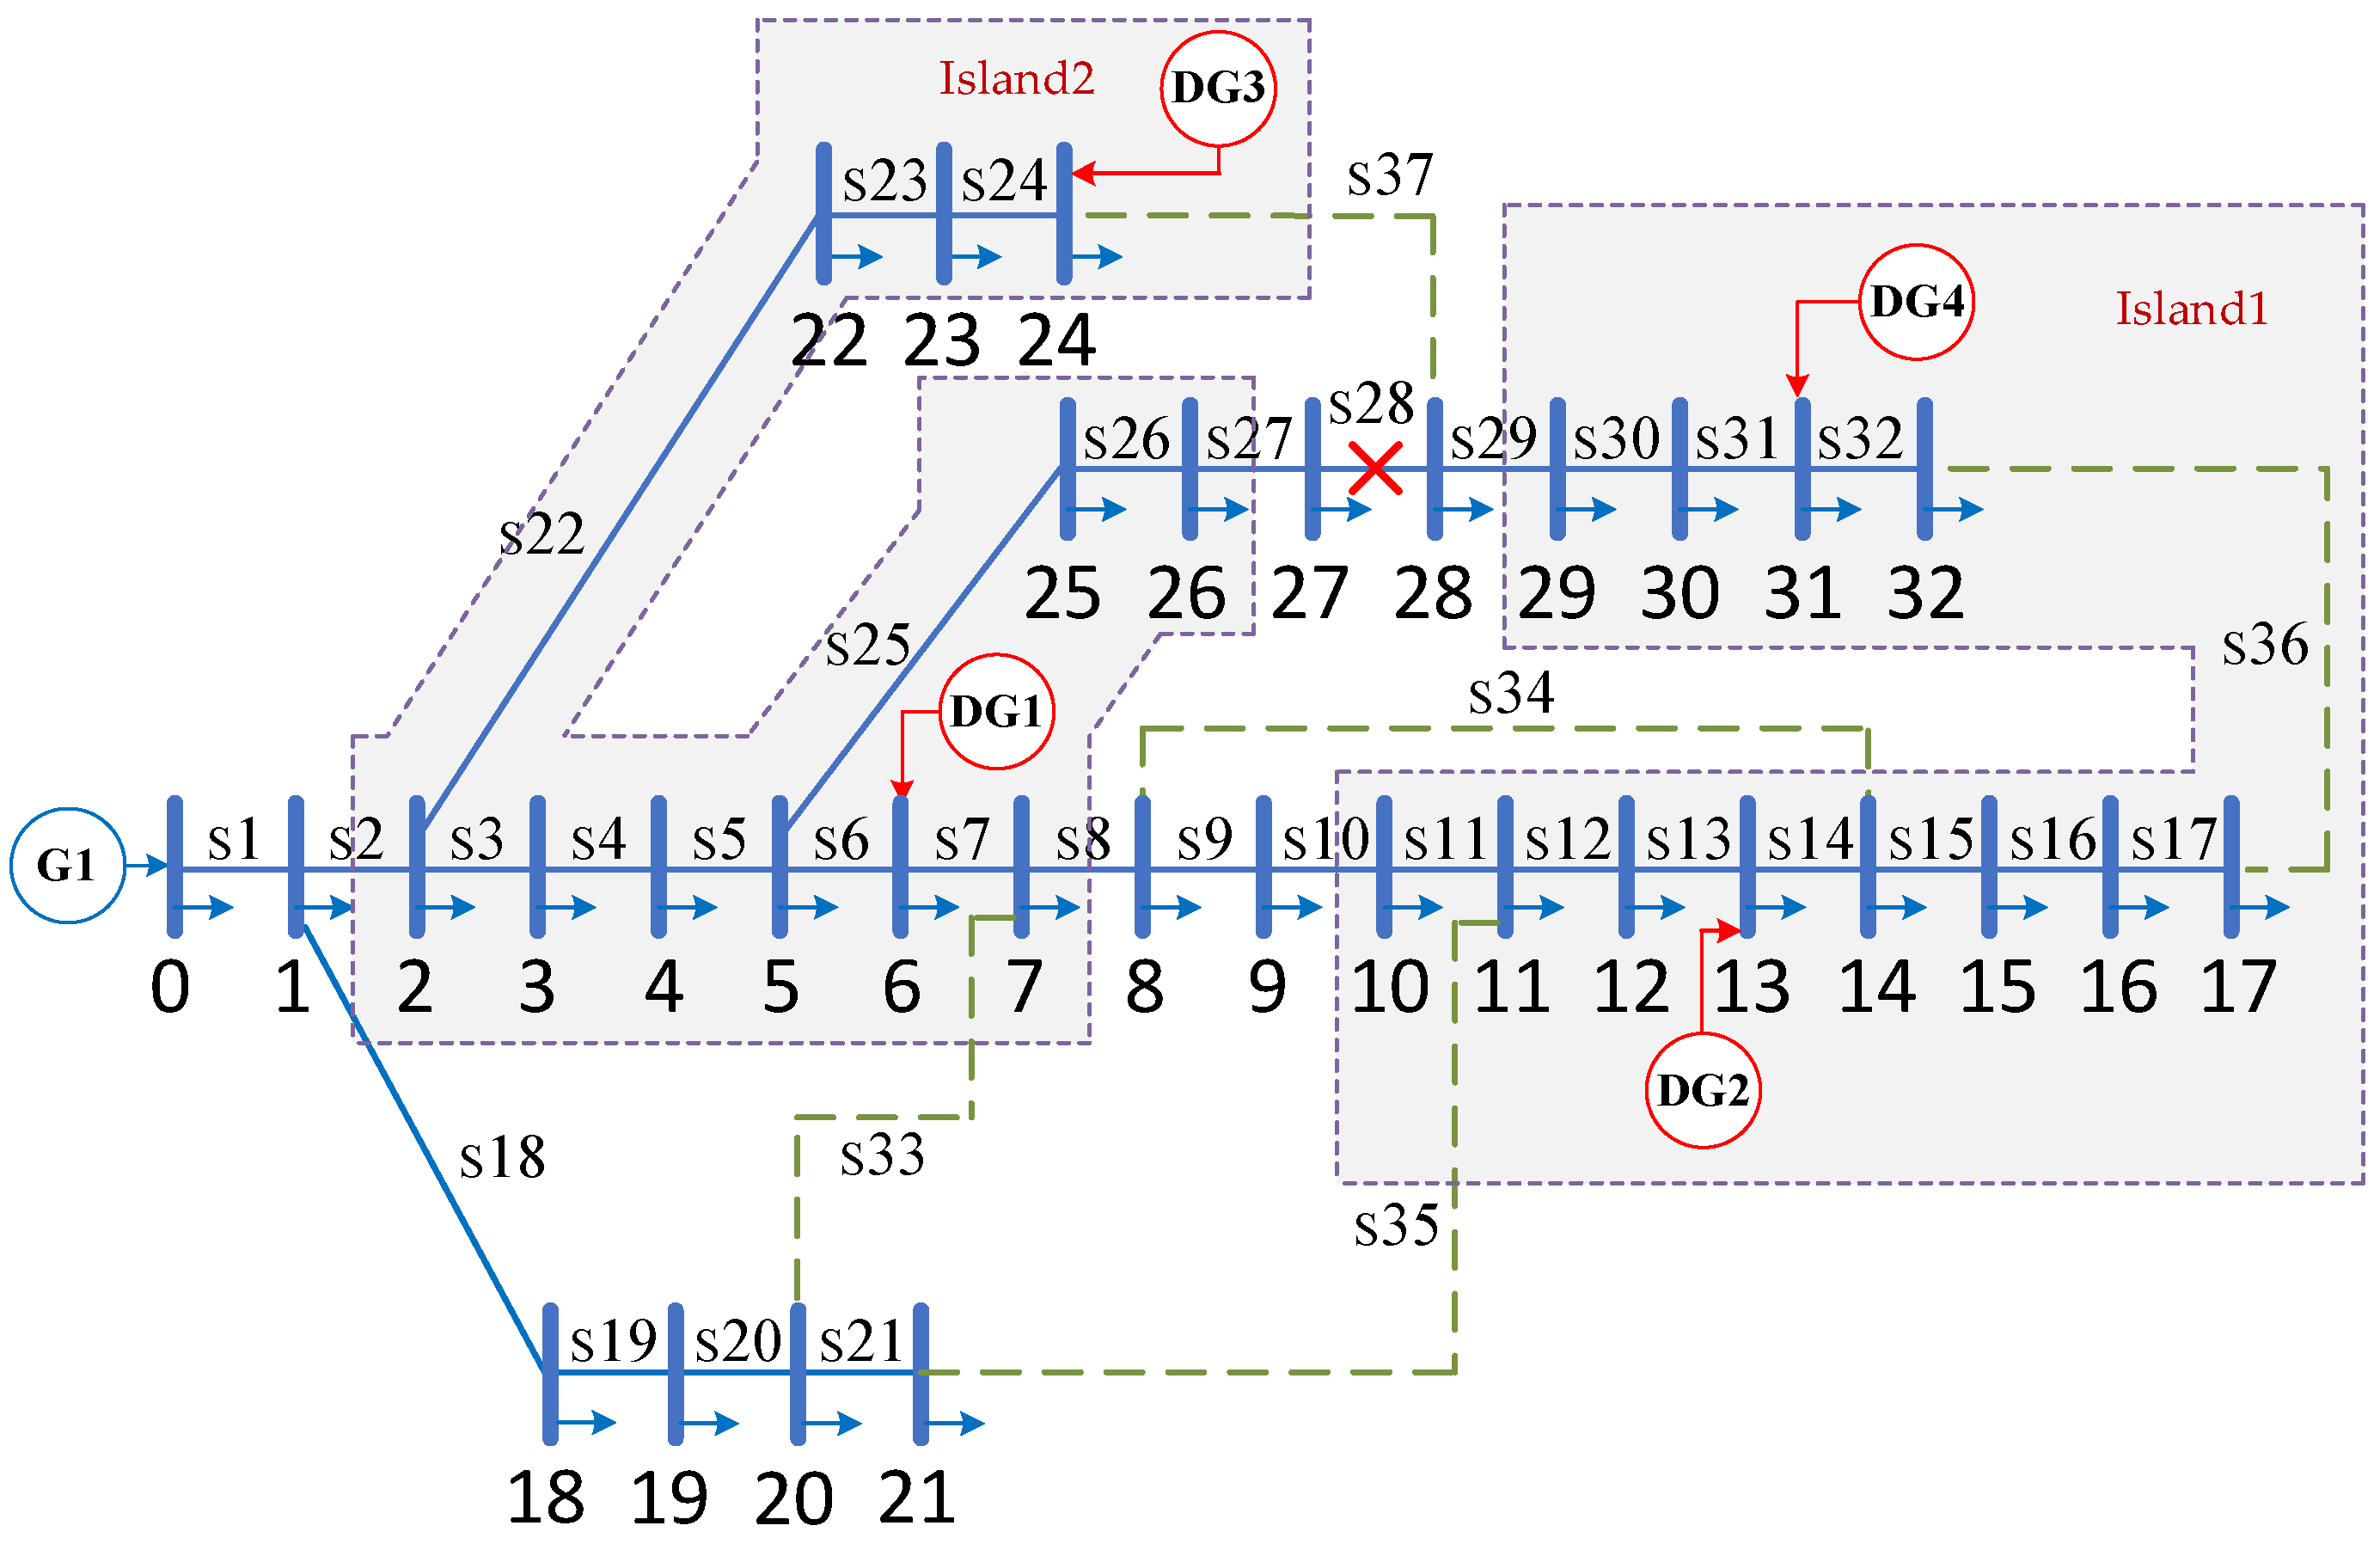
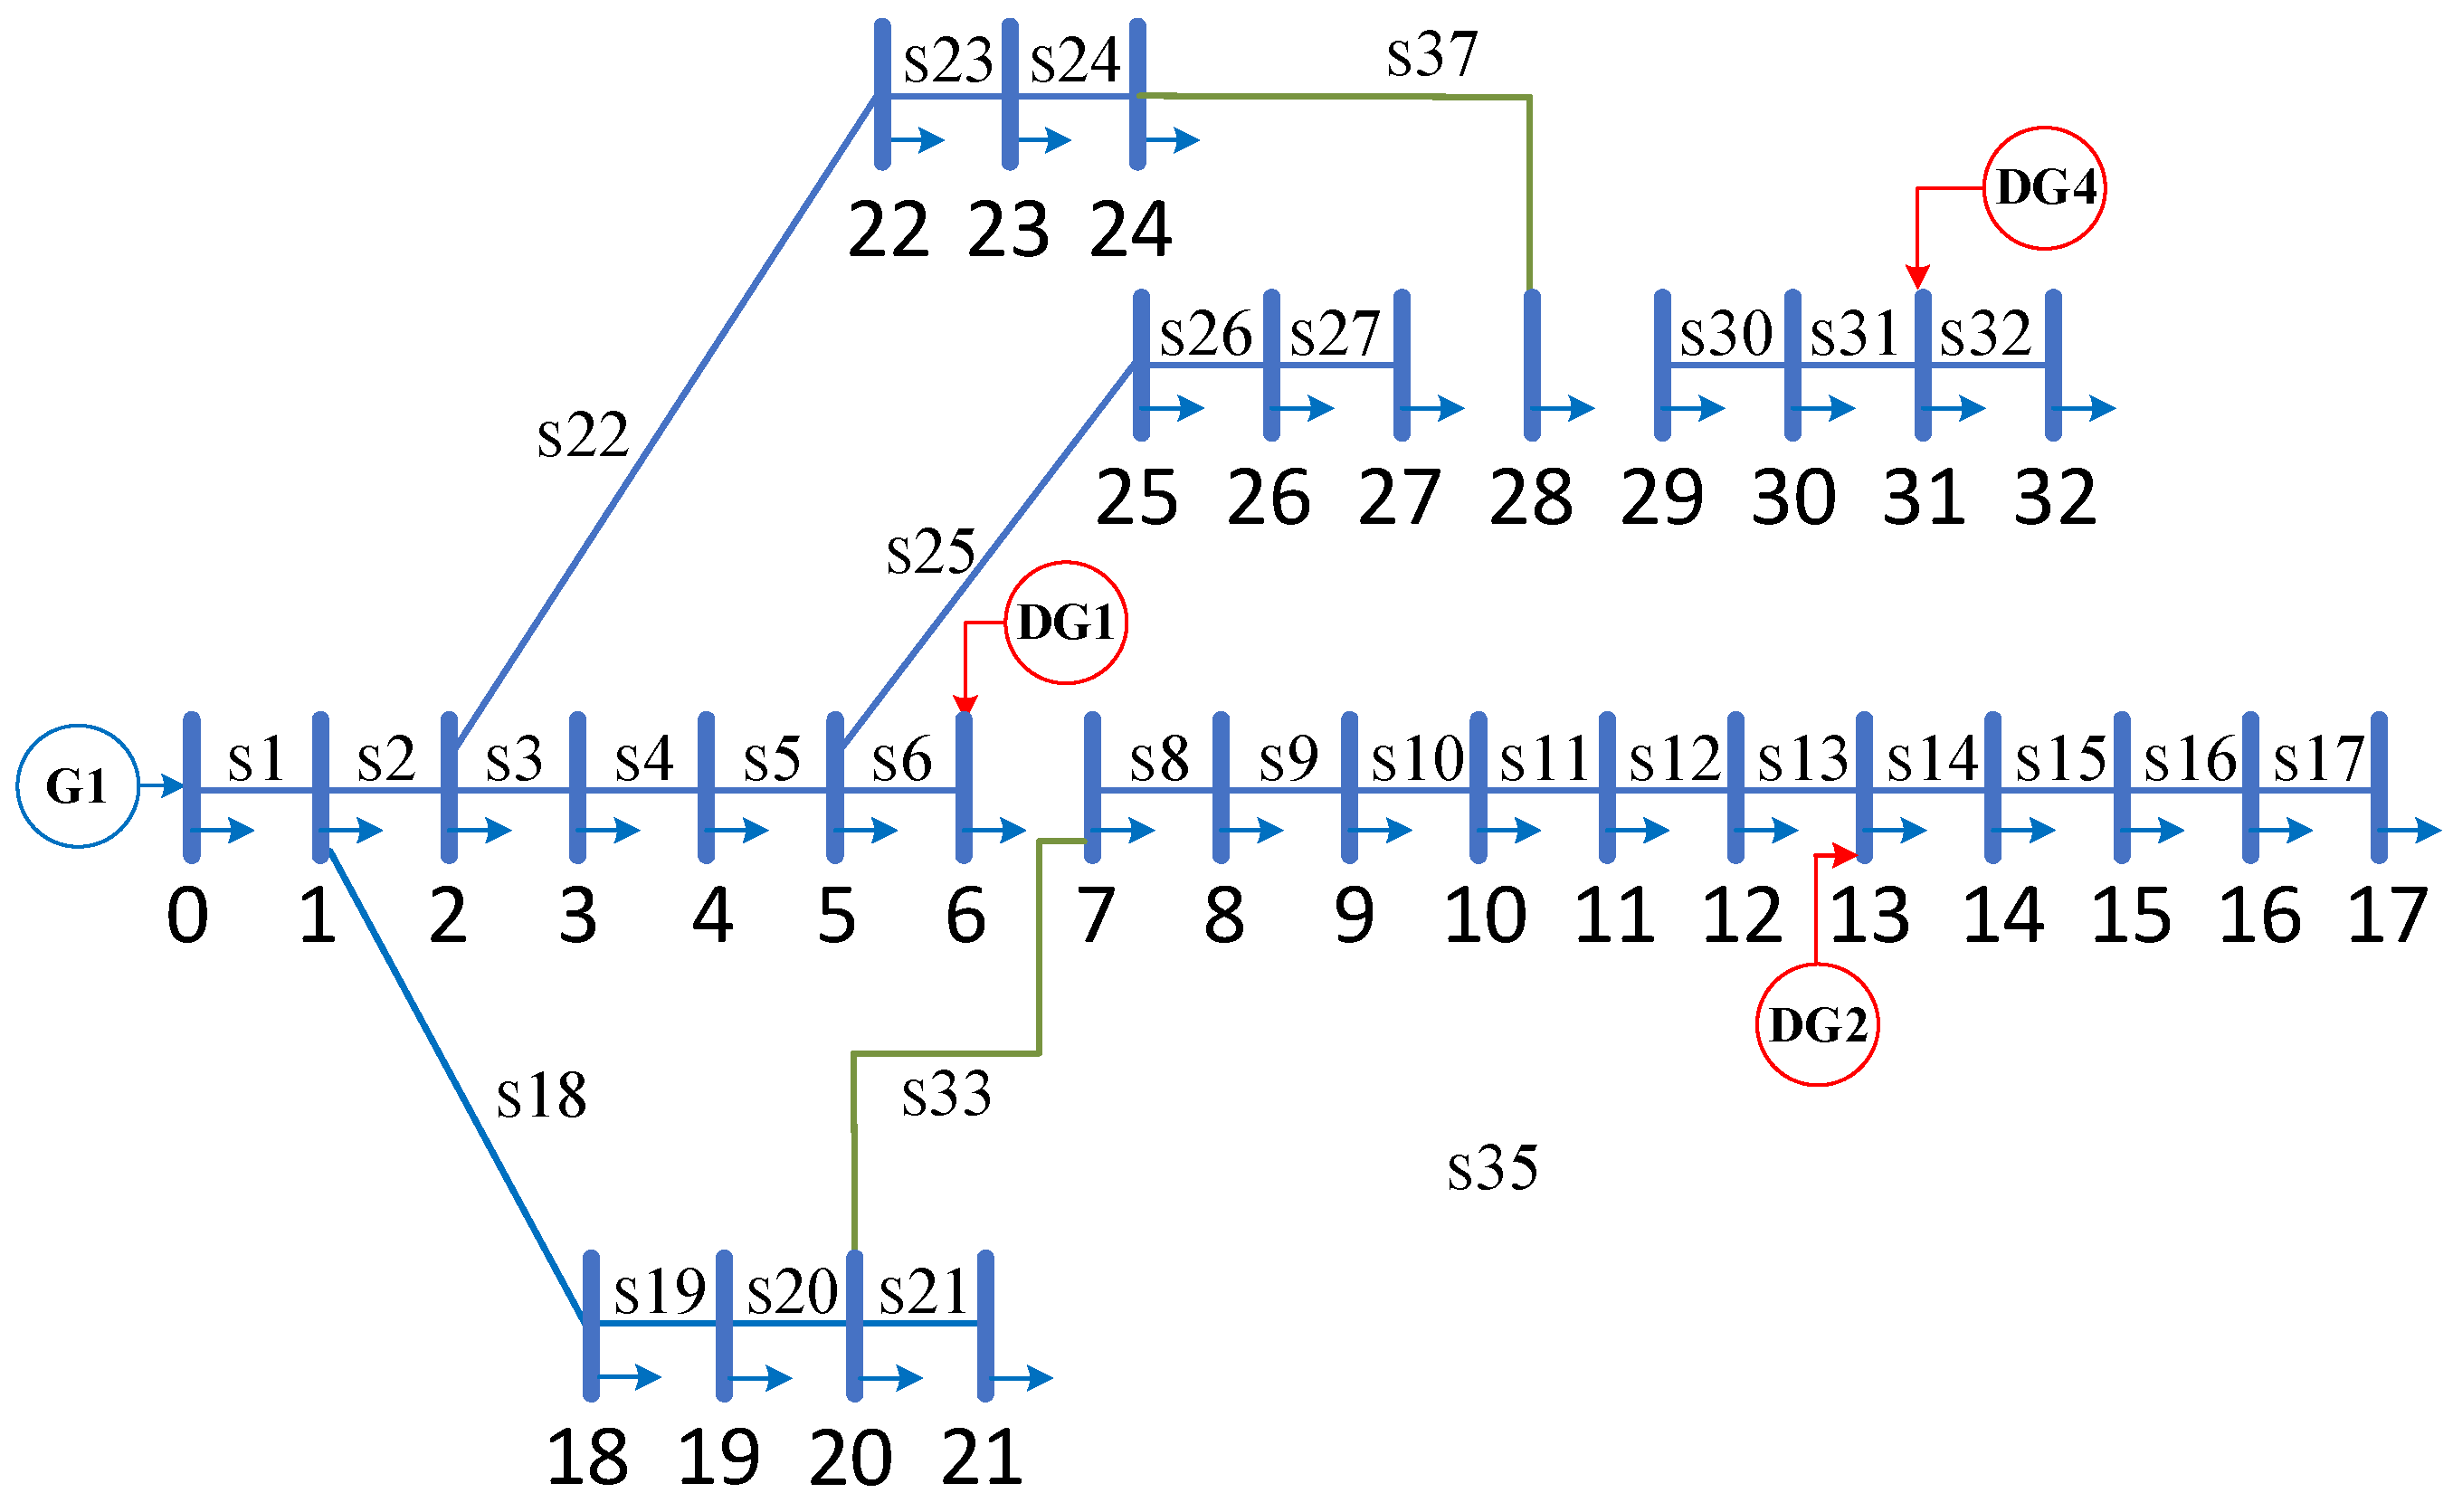
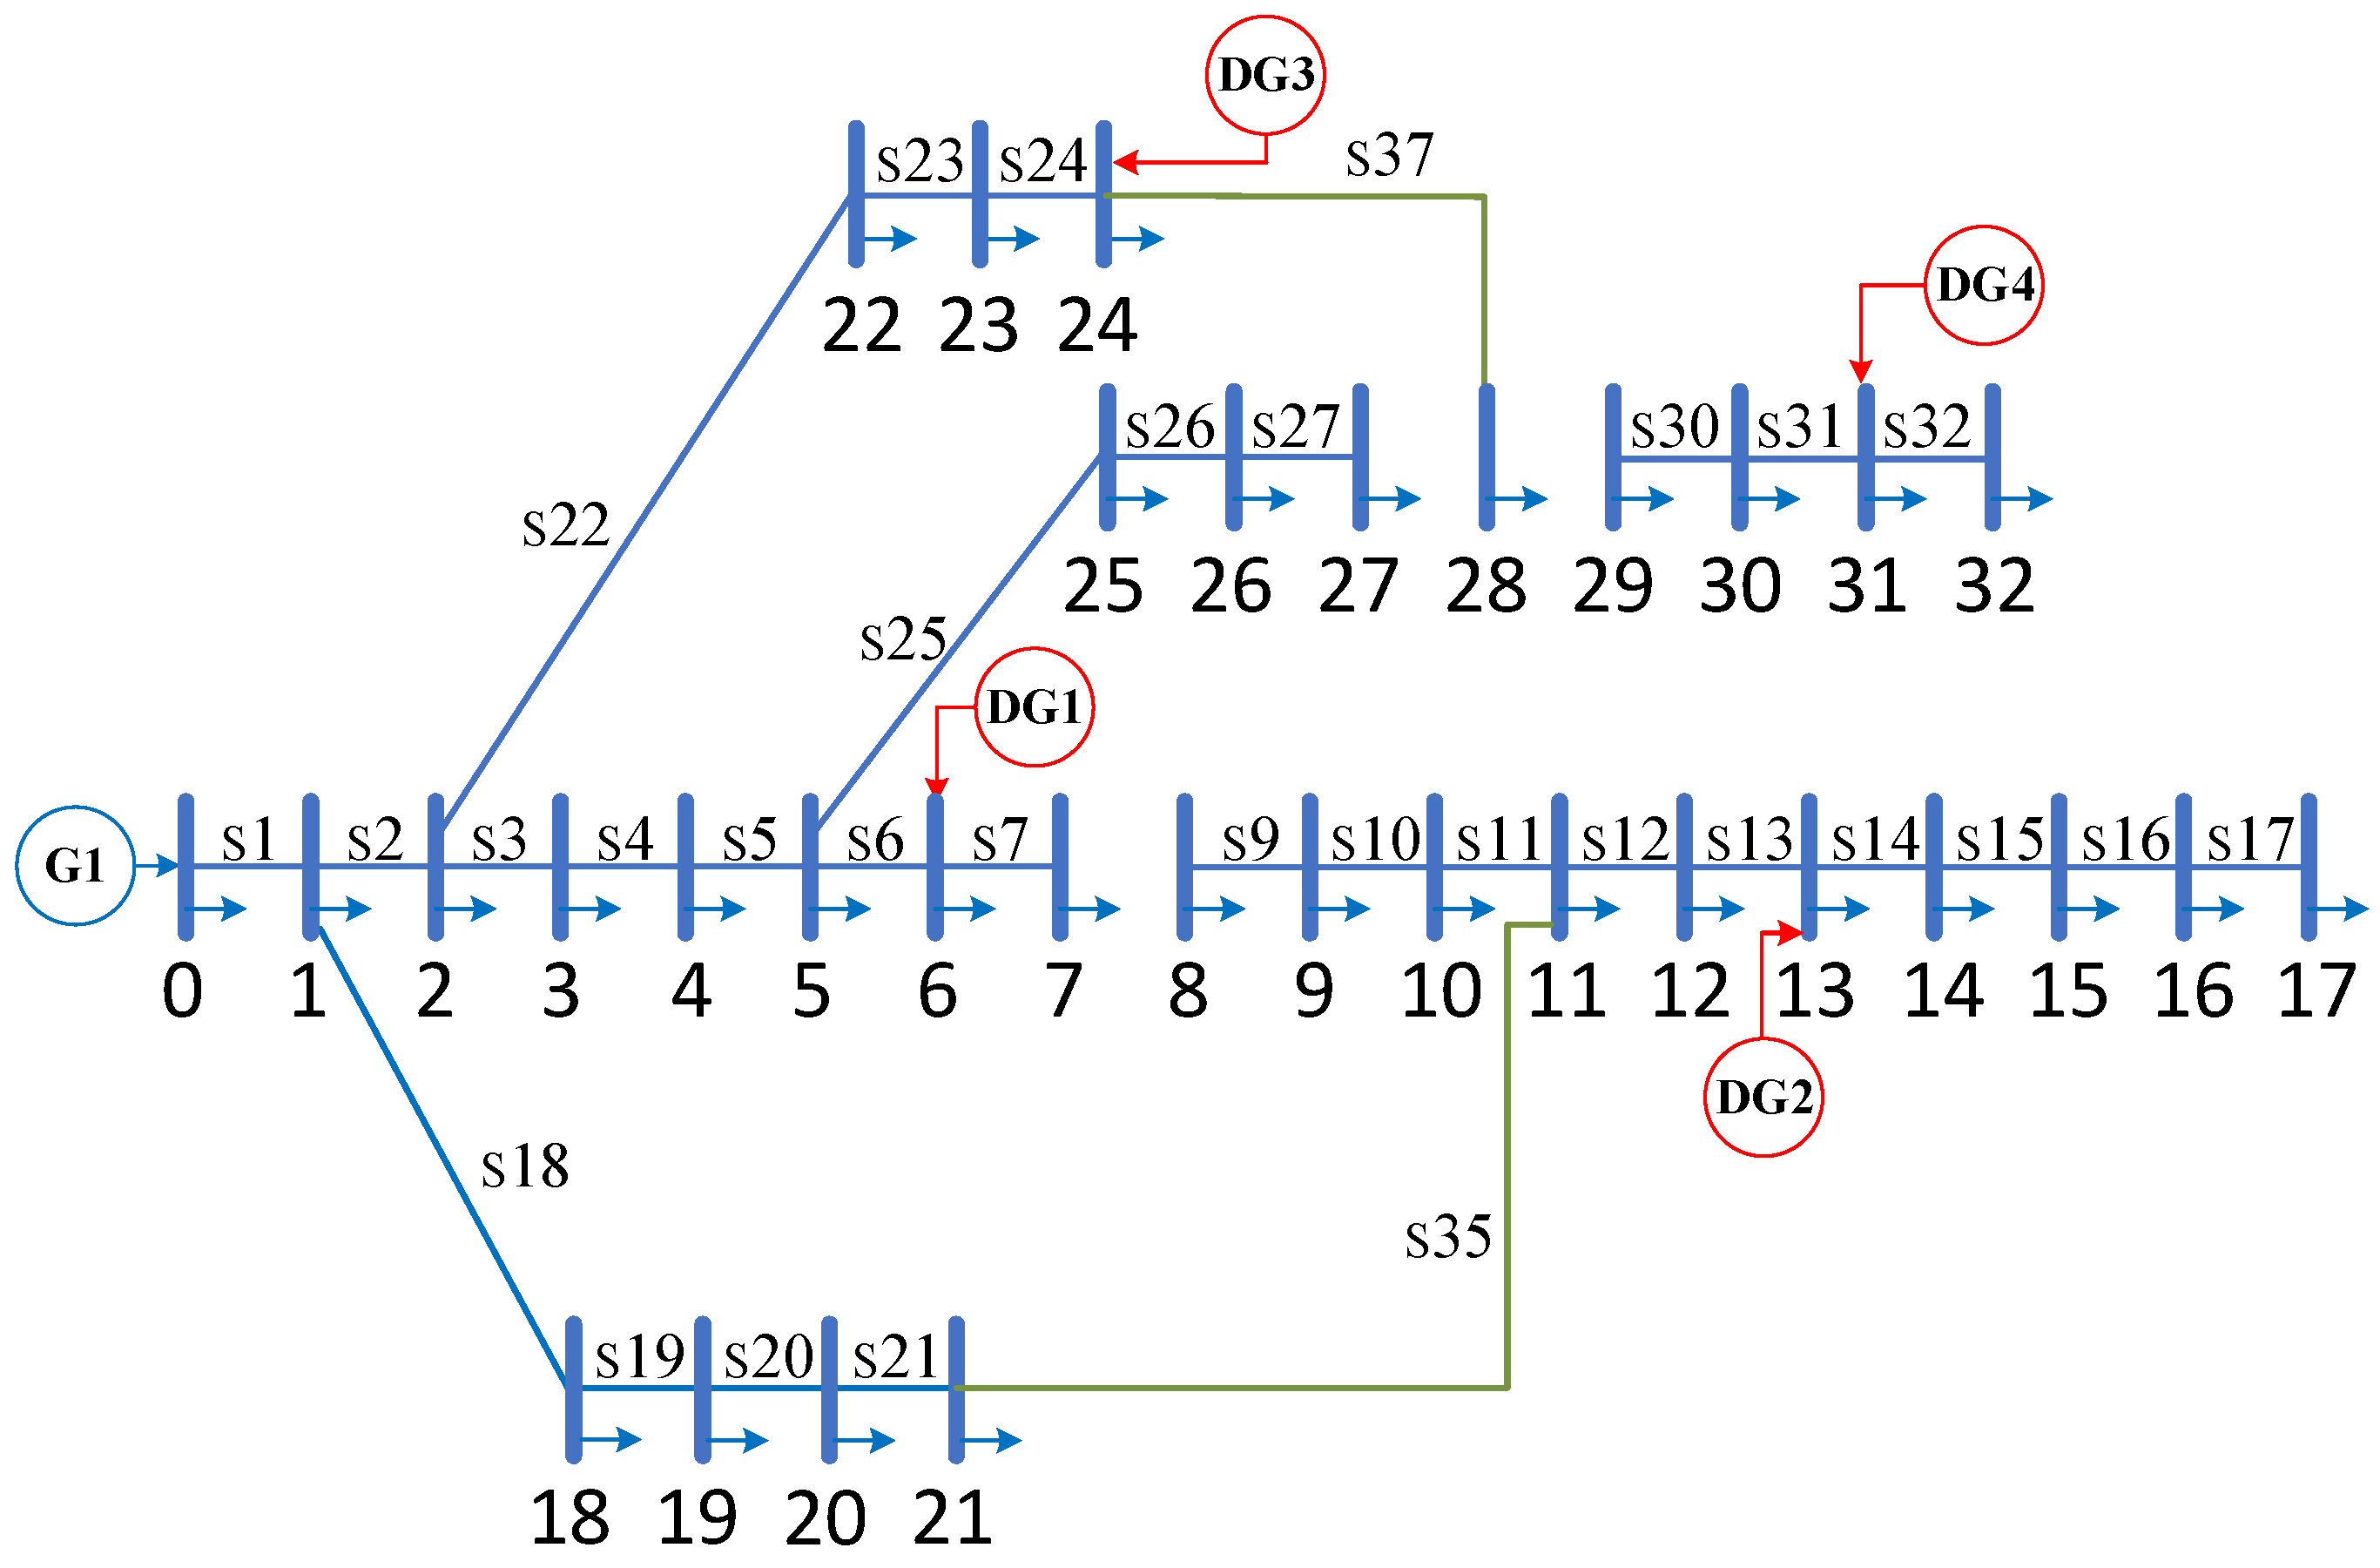
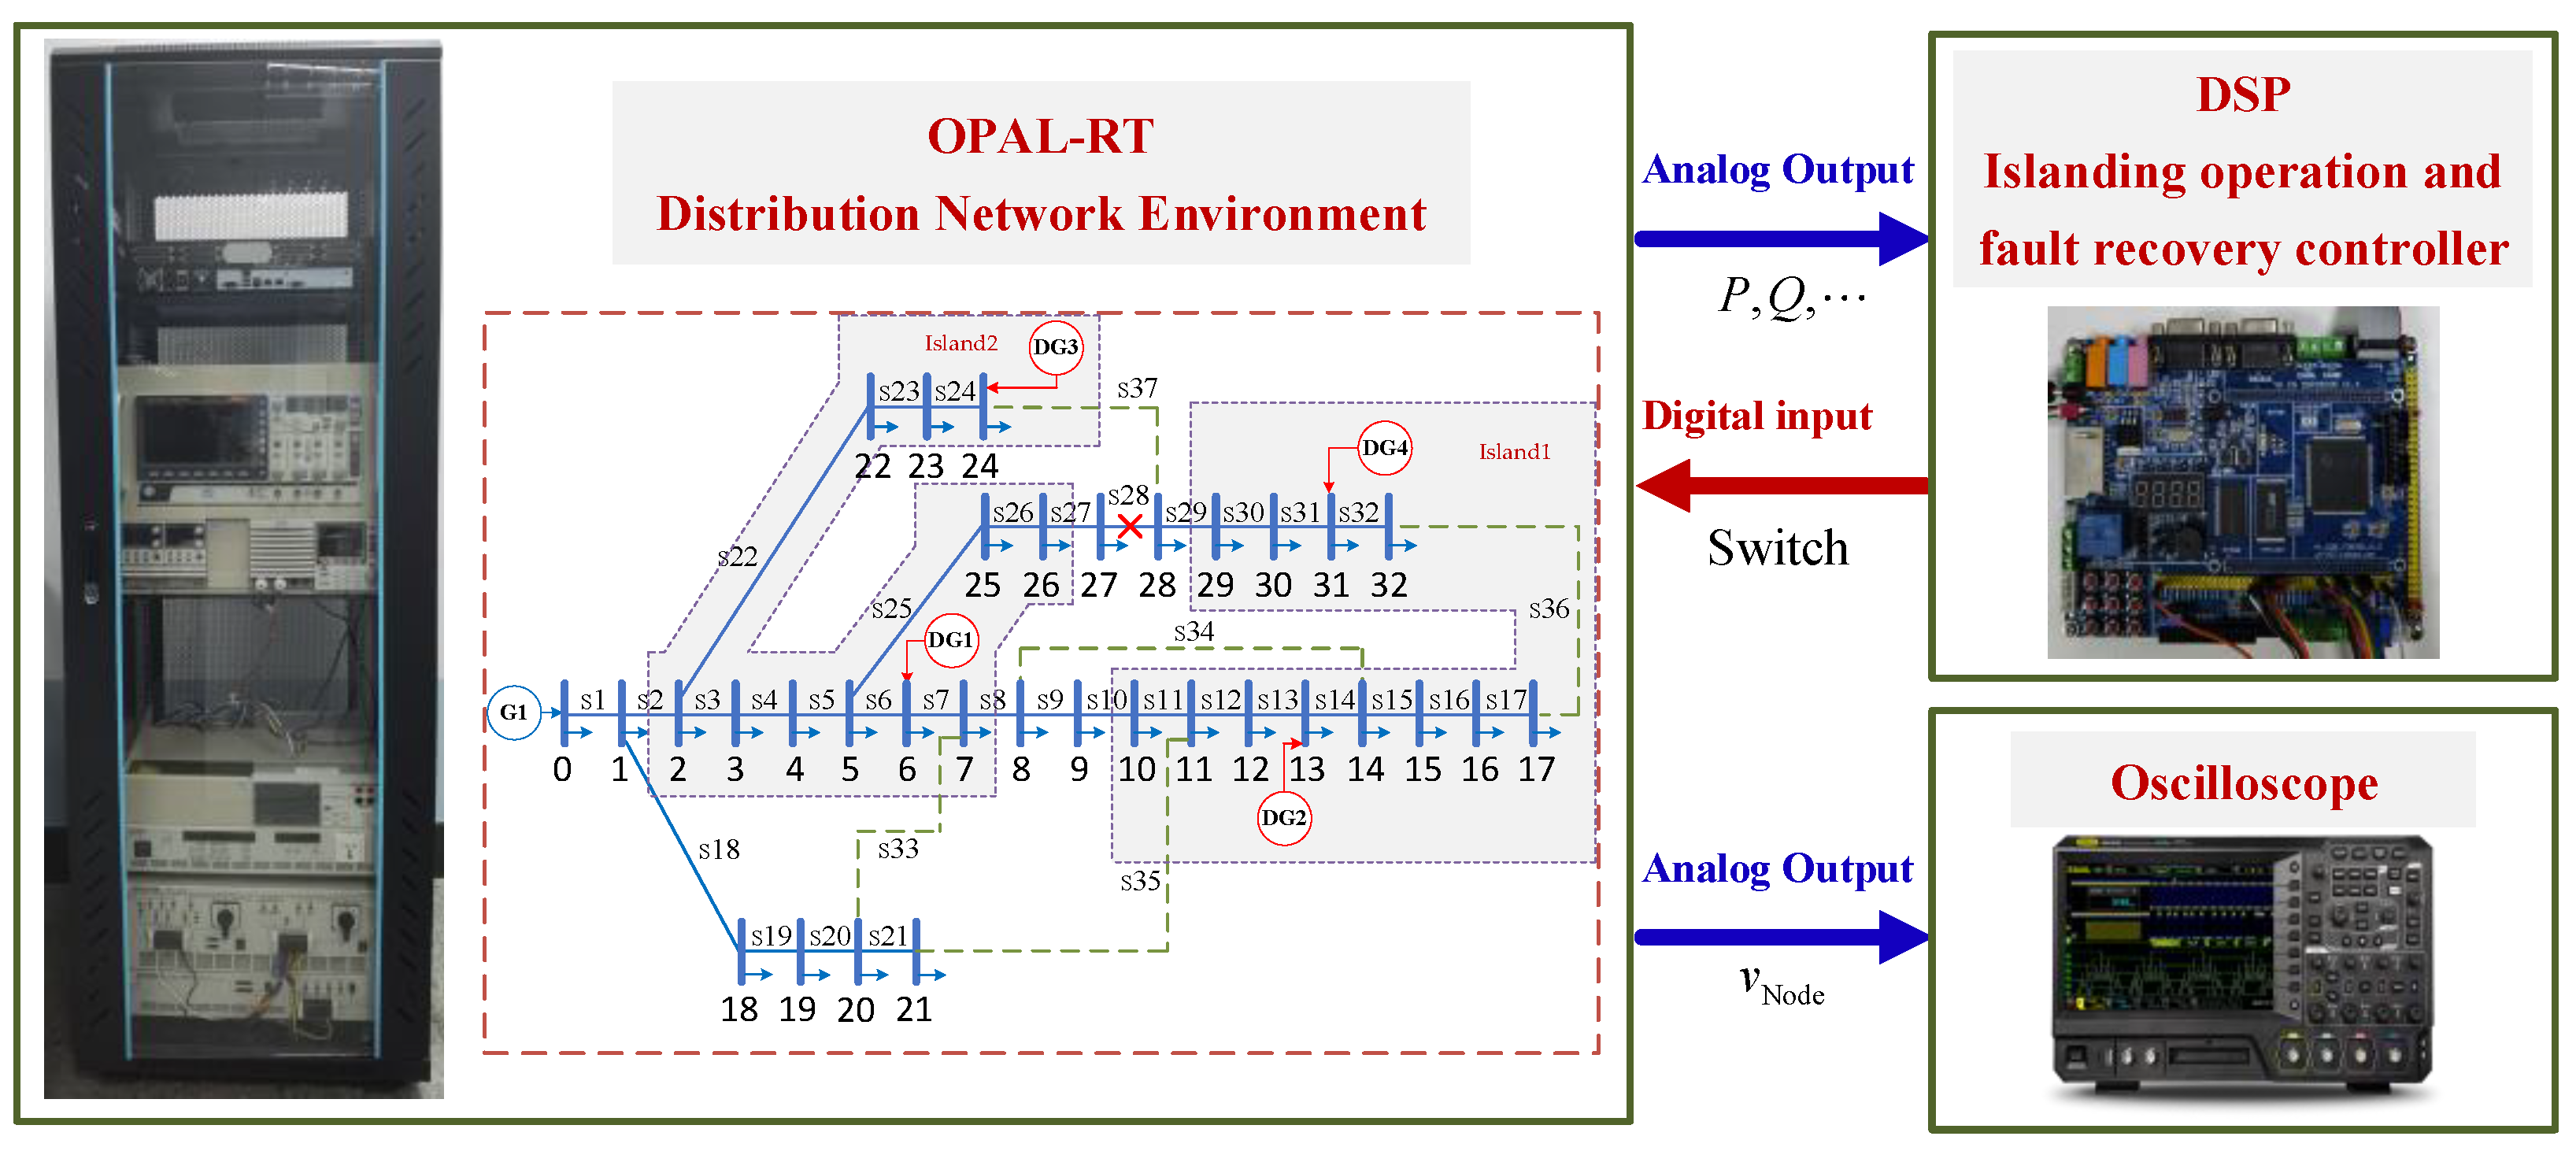
5.1. Example System
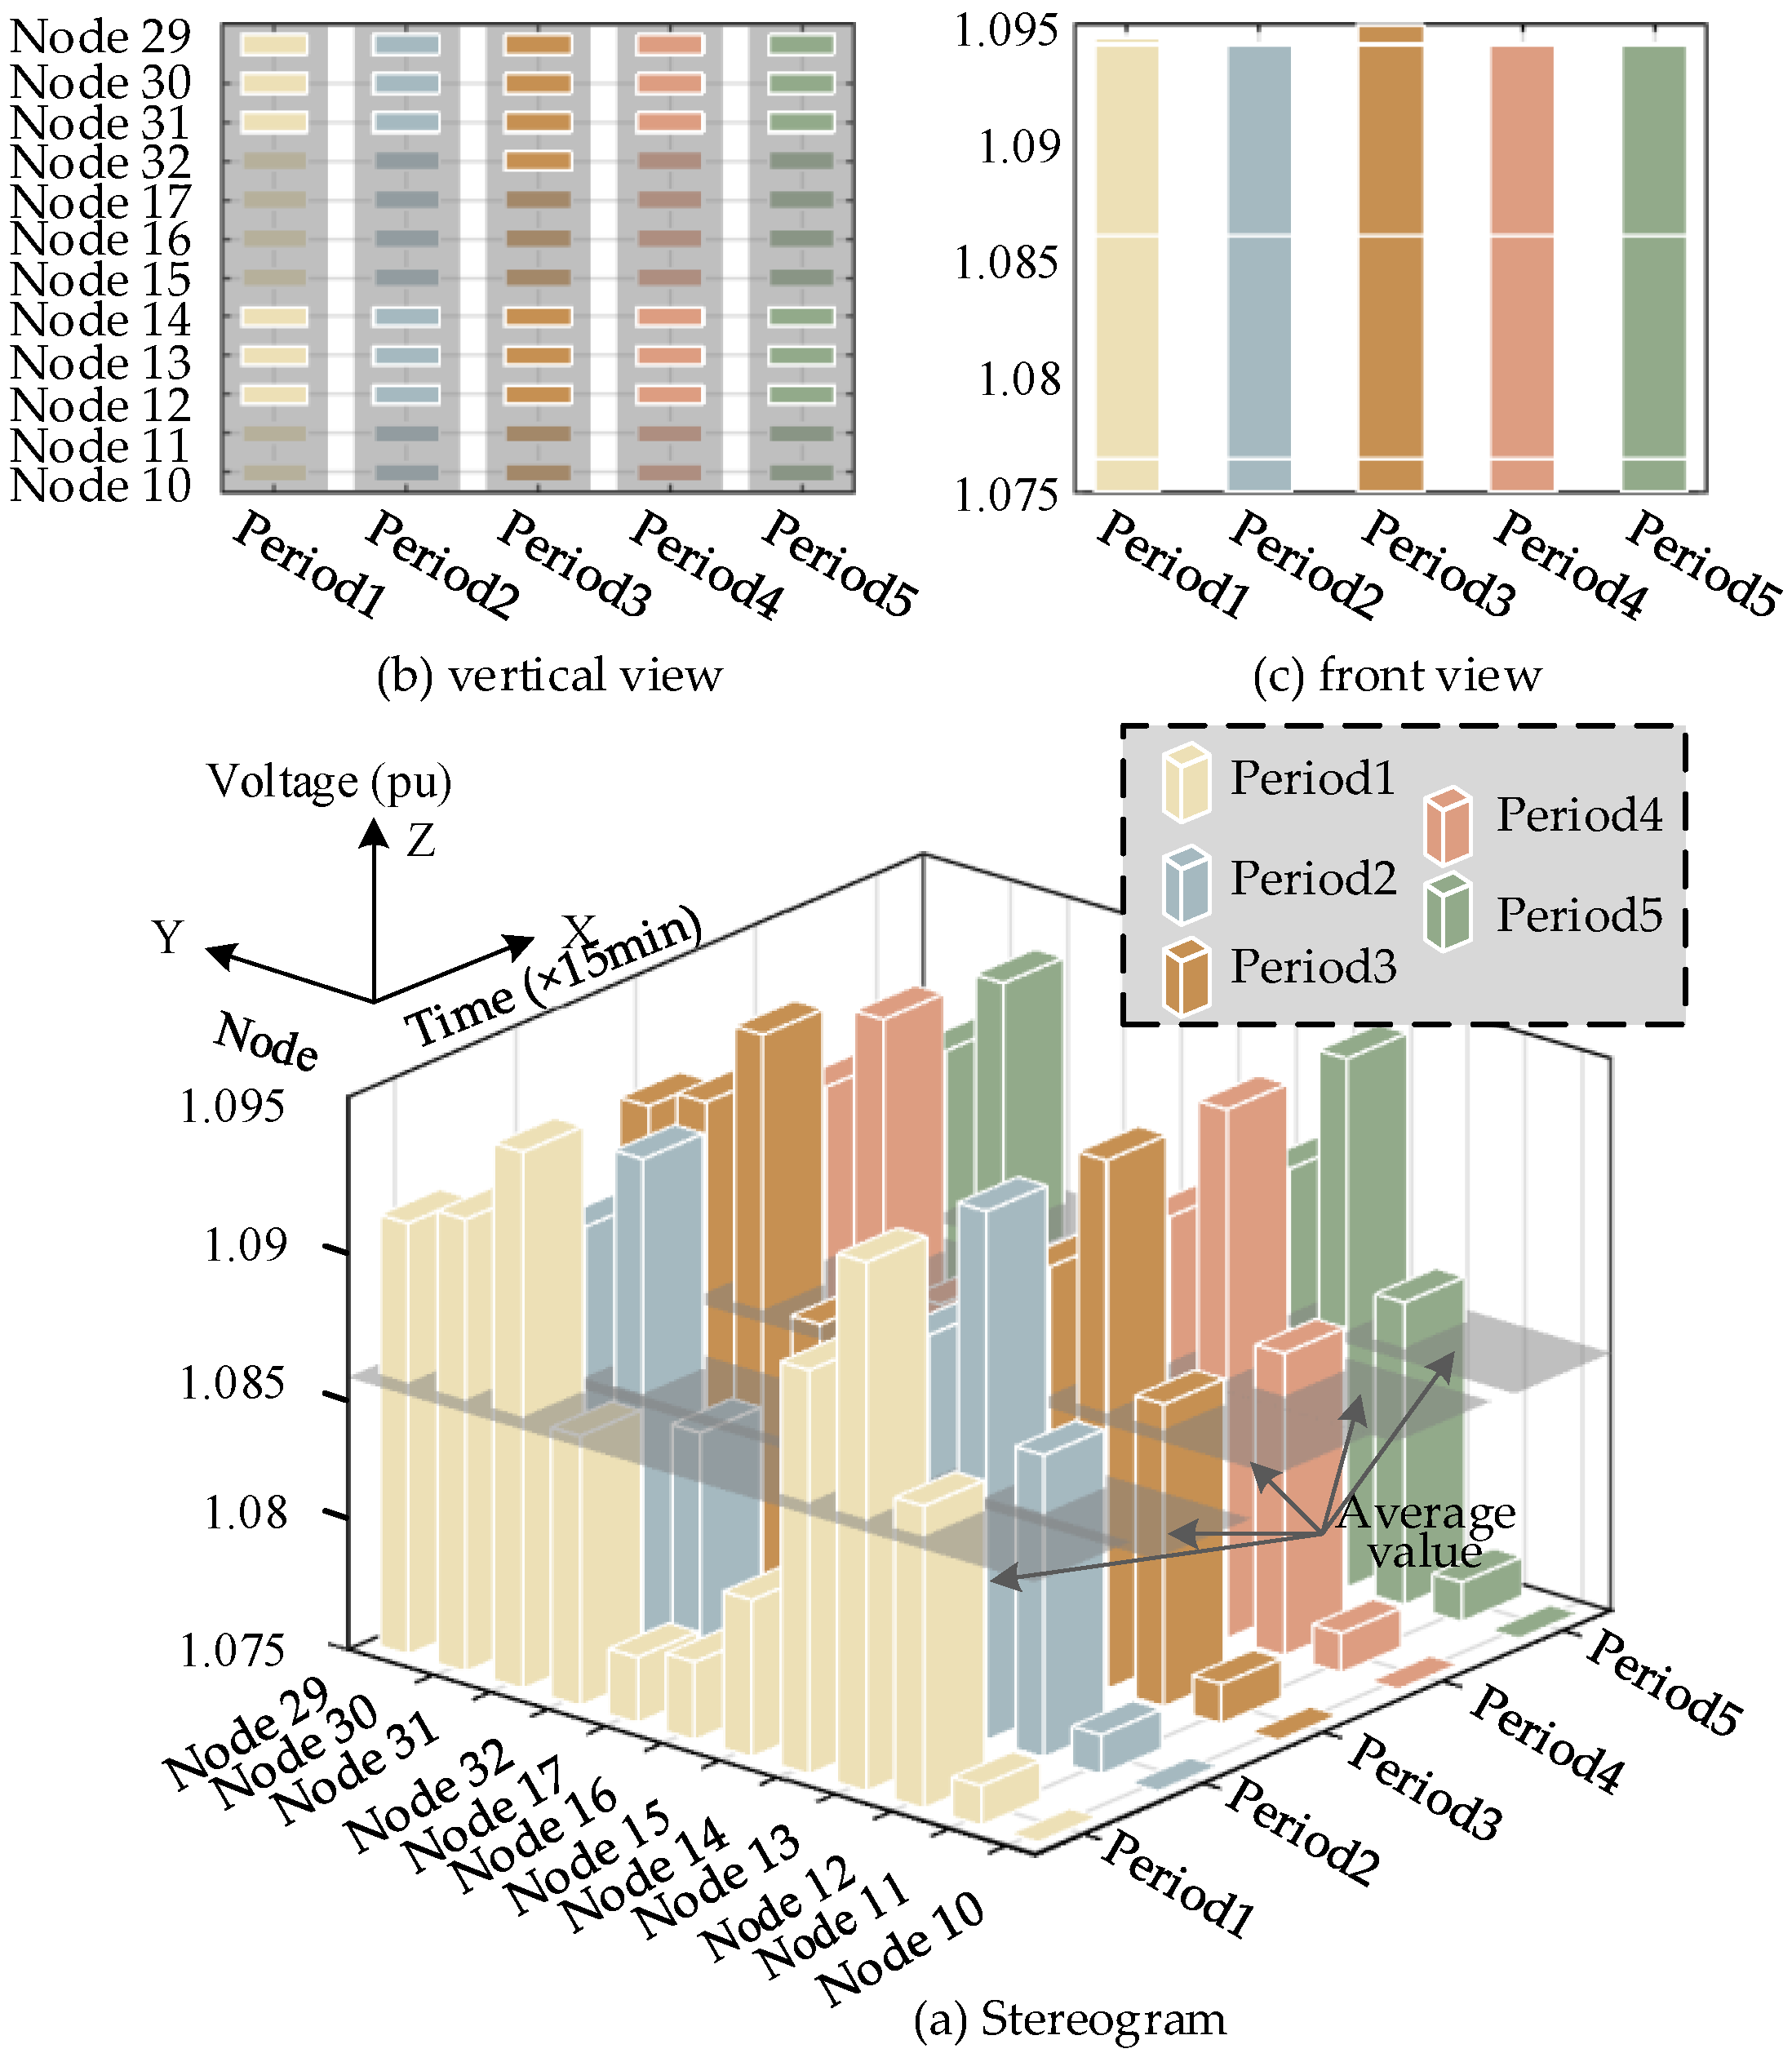
5.2. Analysis of Islanding Division and Operation in Distribution Networks
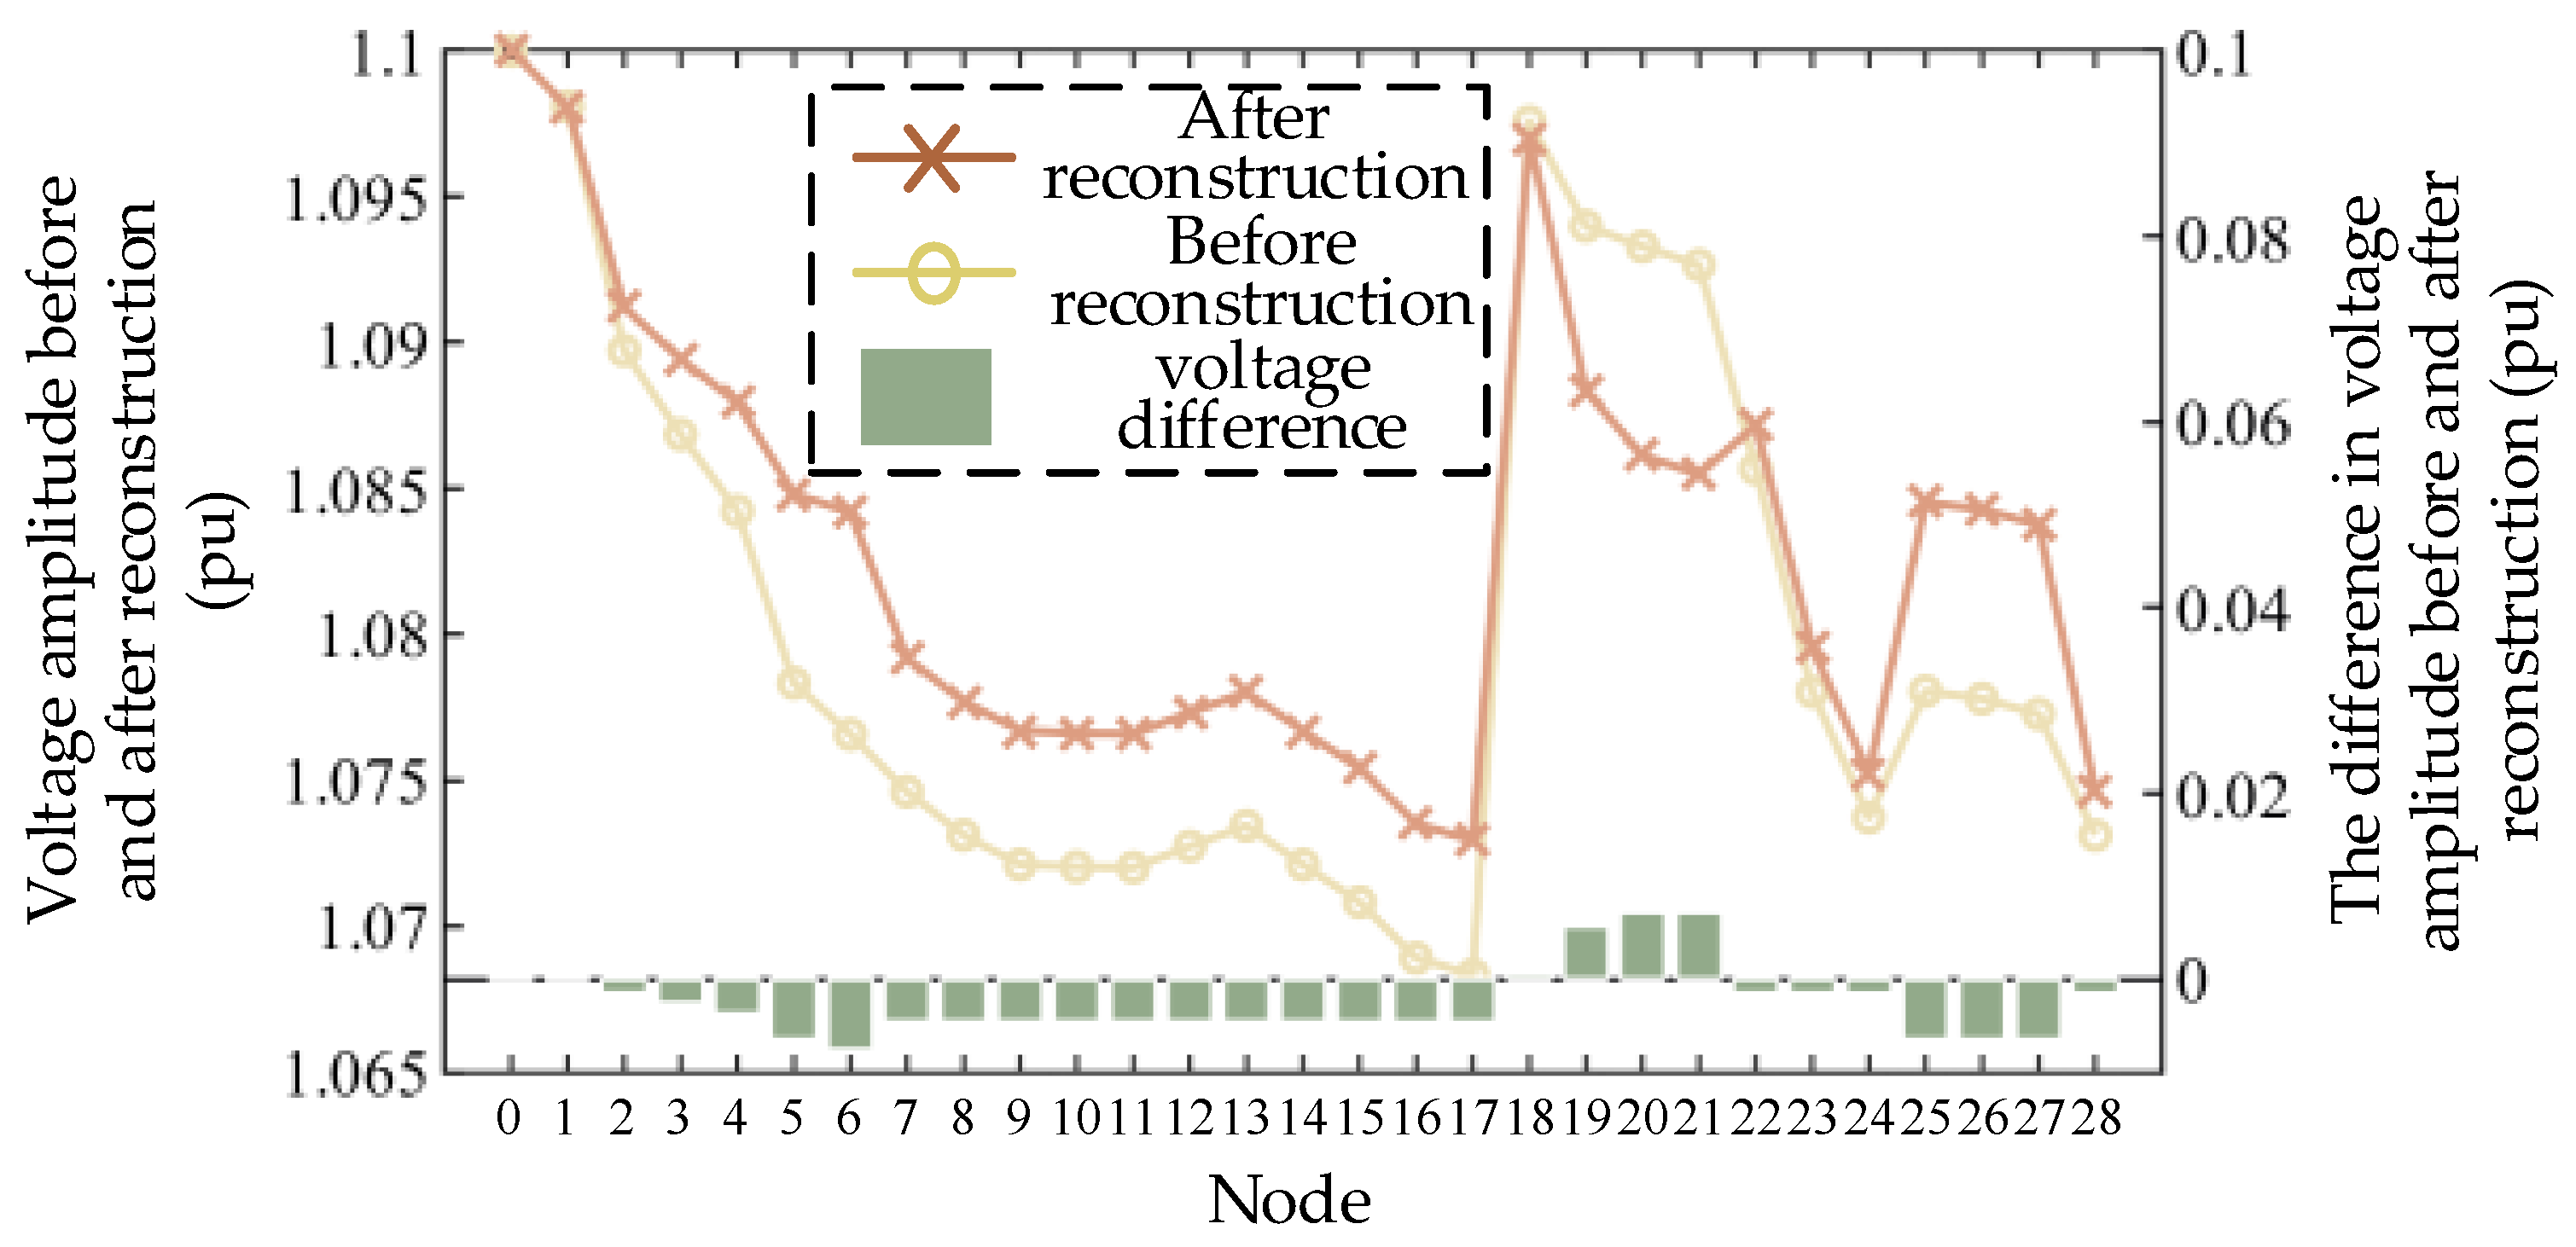
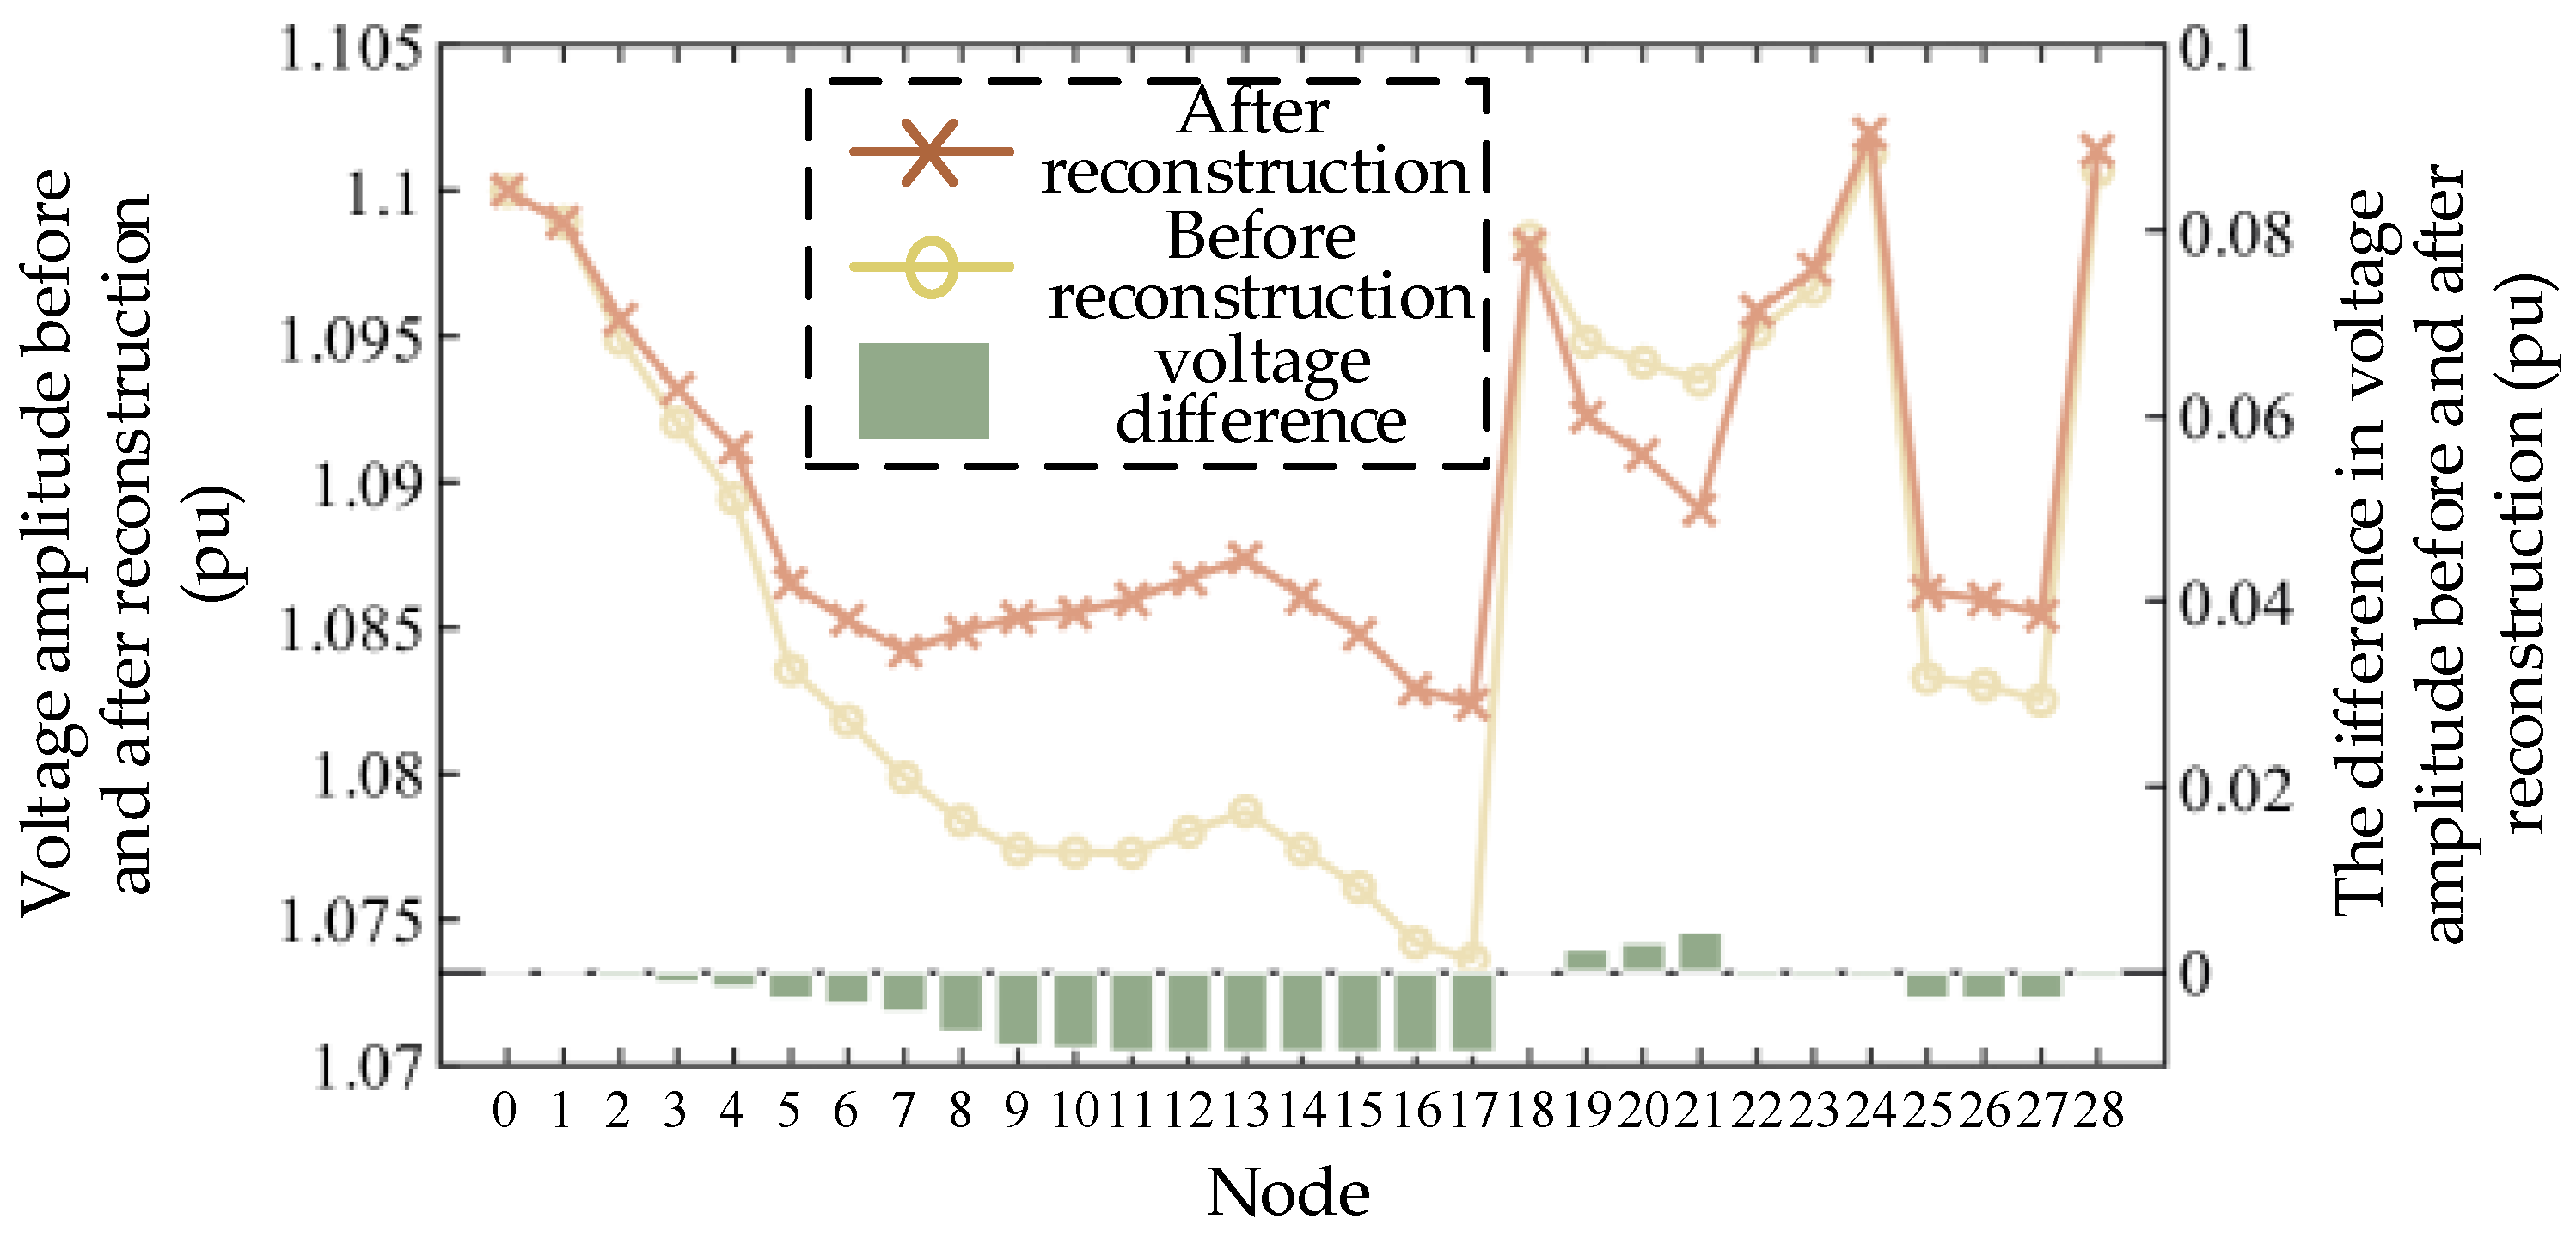
5.3. Analysis of Distribution Network Fault Recovery
5.3.1. The Fault Occurred in S28 and DG3
5.3.2. The Fault Occurred in S28
5.3.3. The Fault Occurred in S9 and S22
5.3.4. The Impact of Island Operation on Fault Recovery
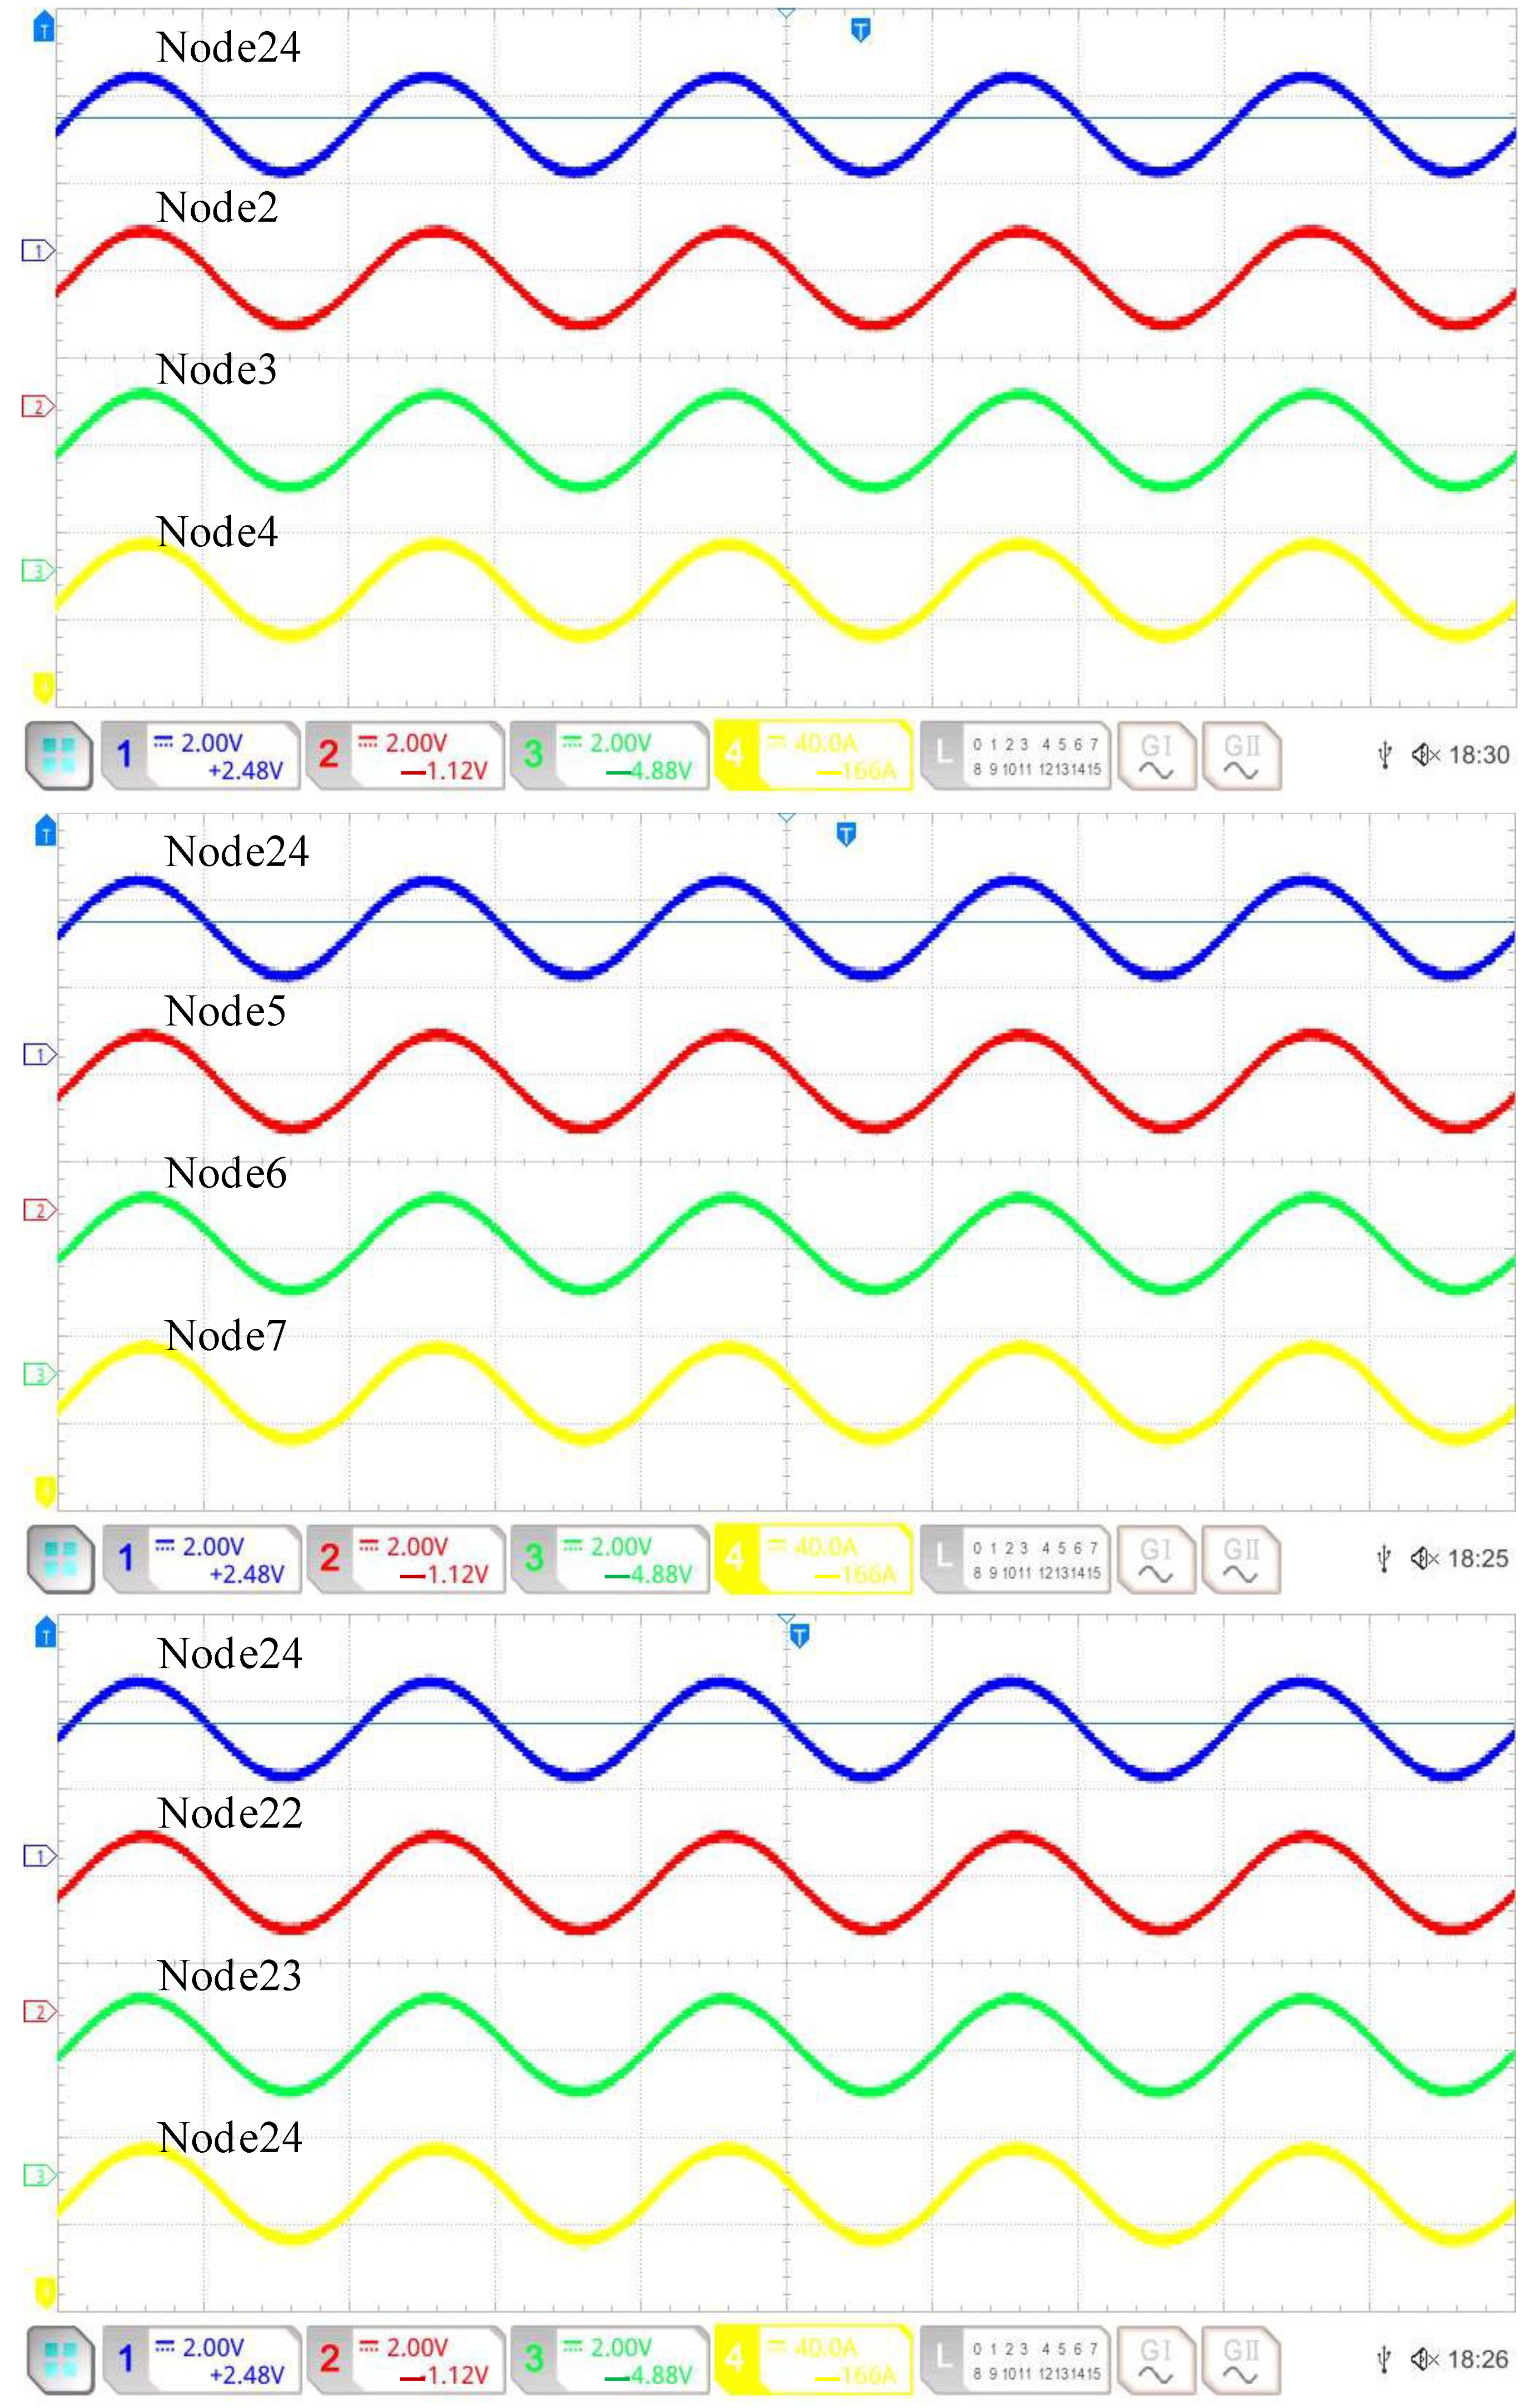
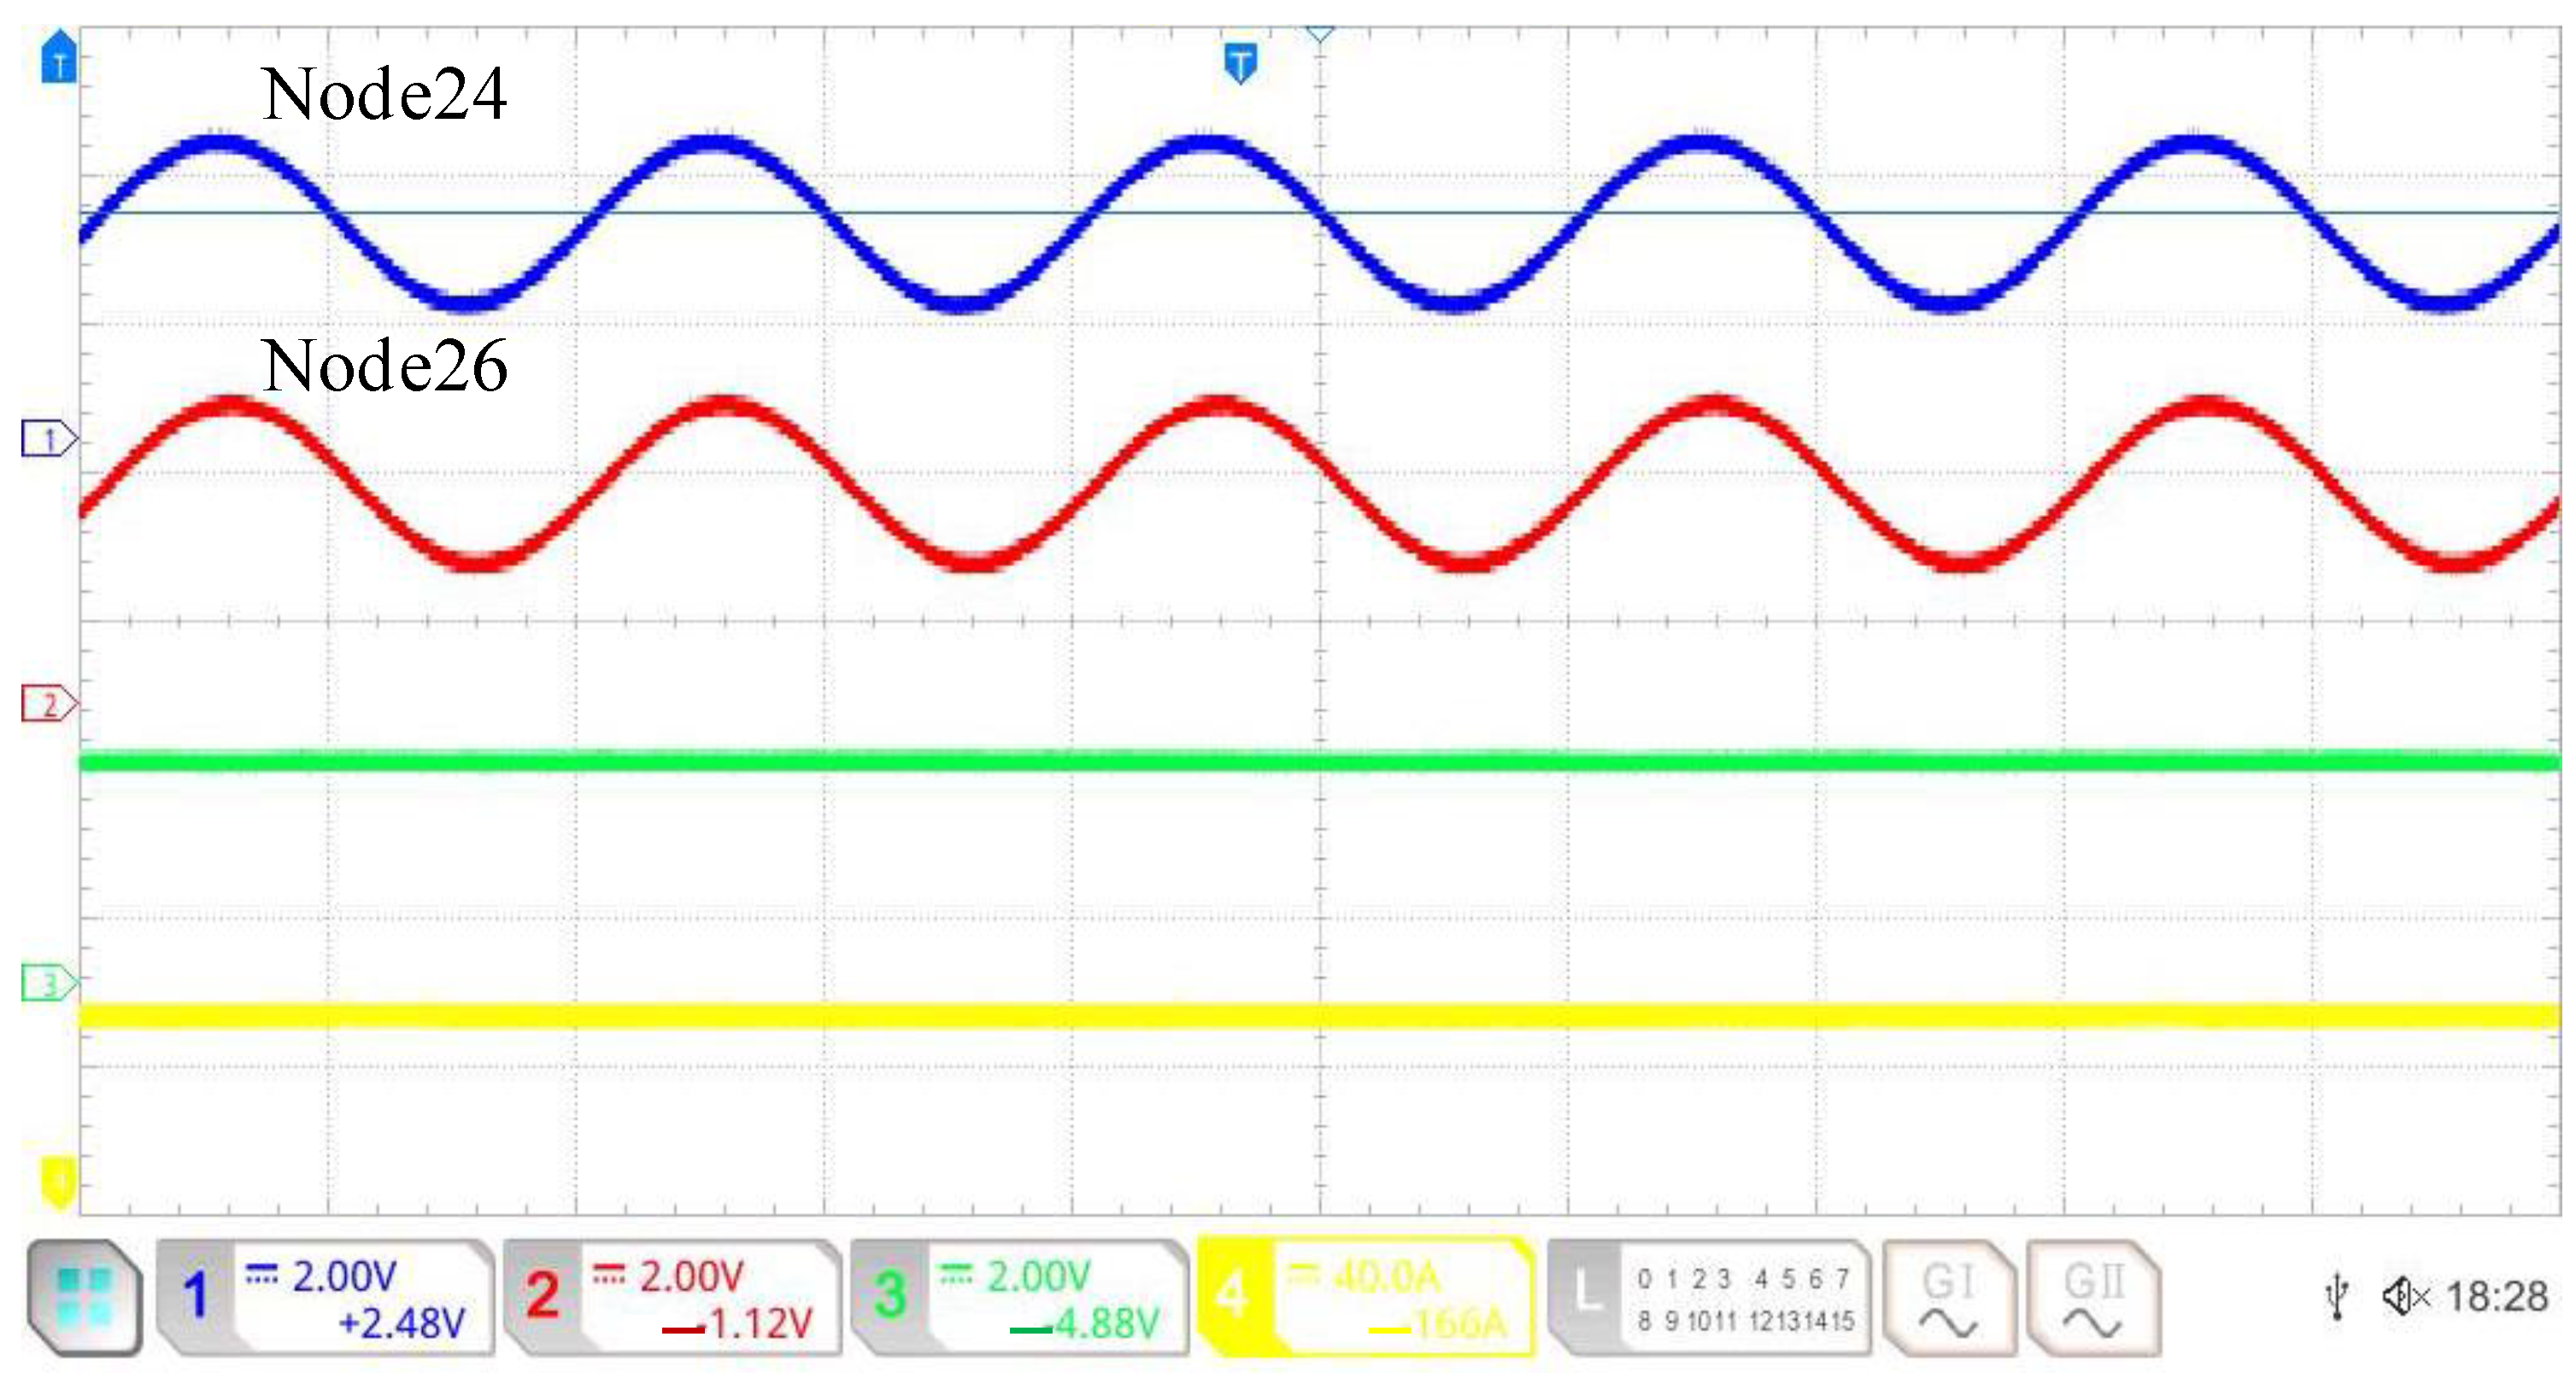
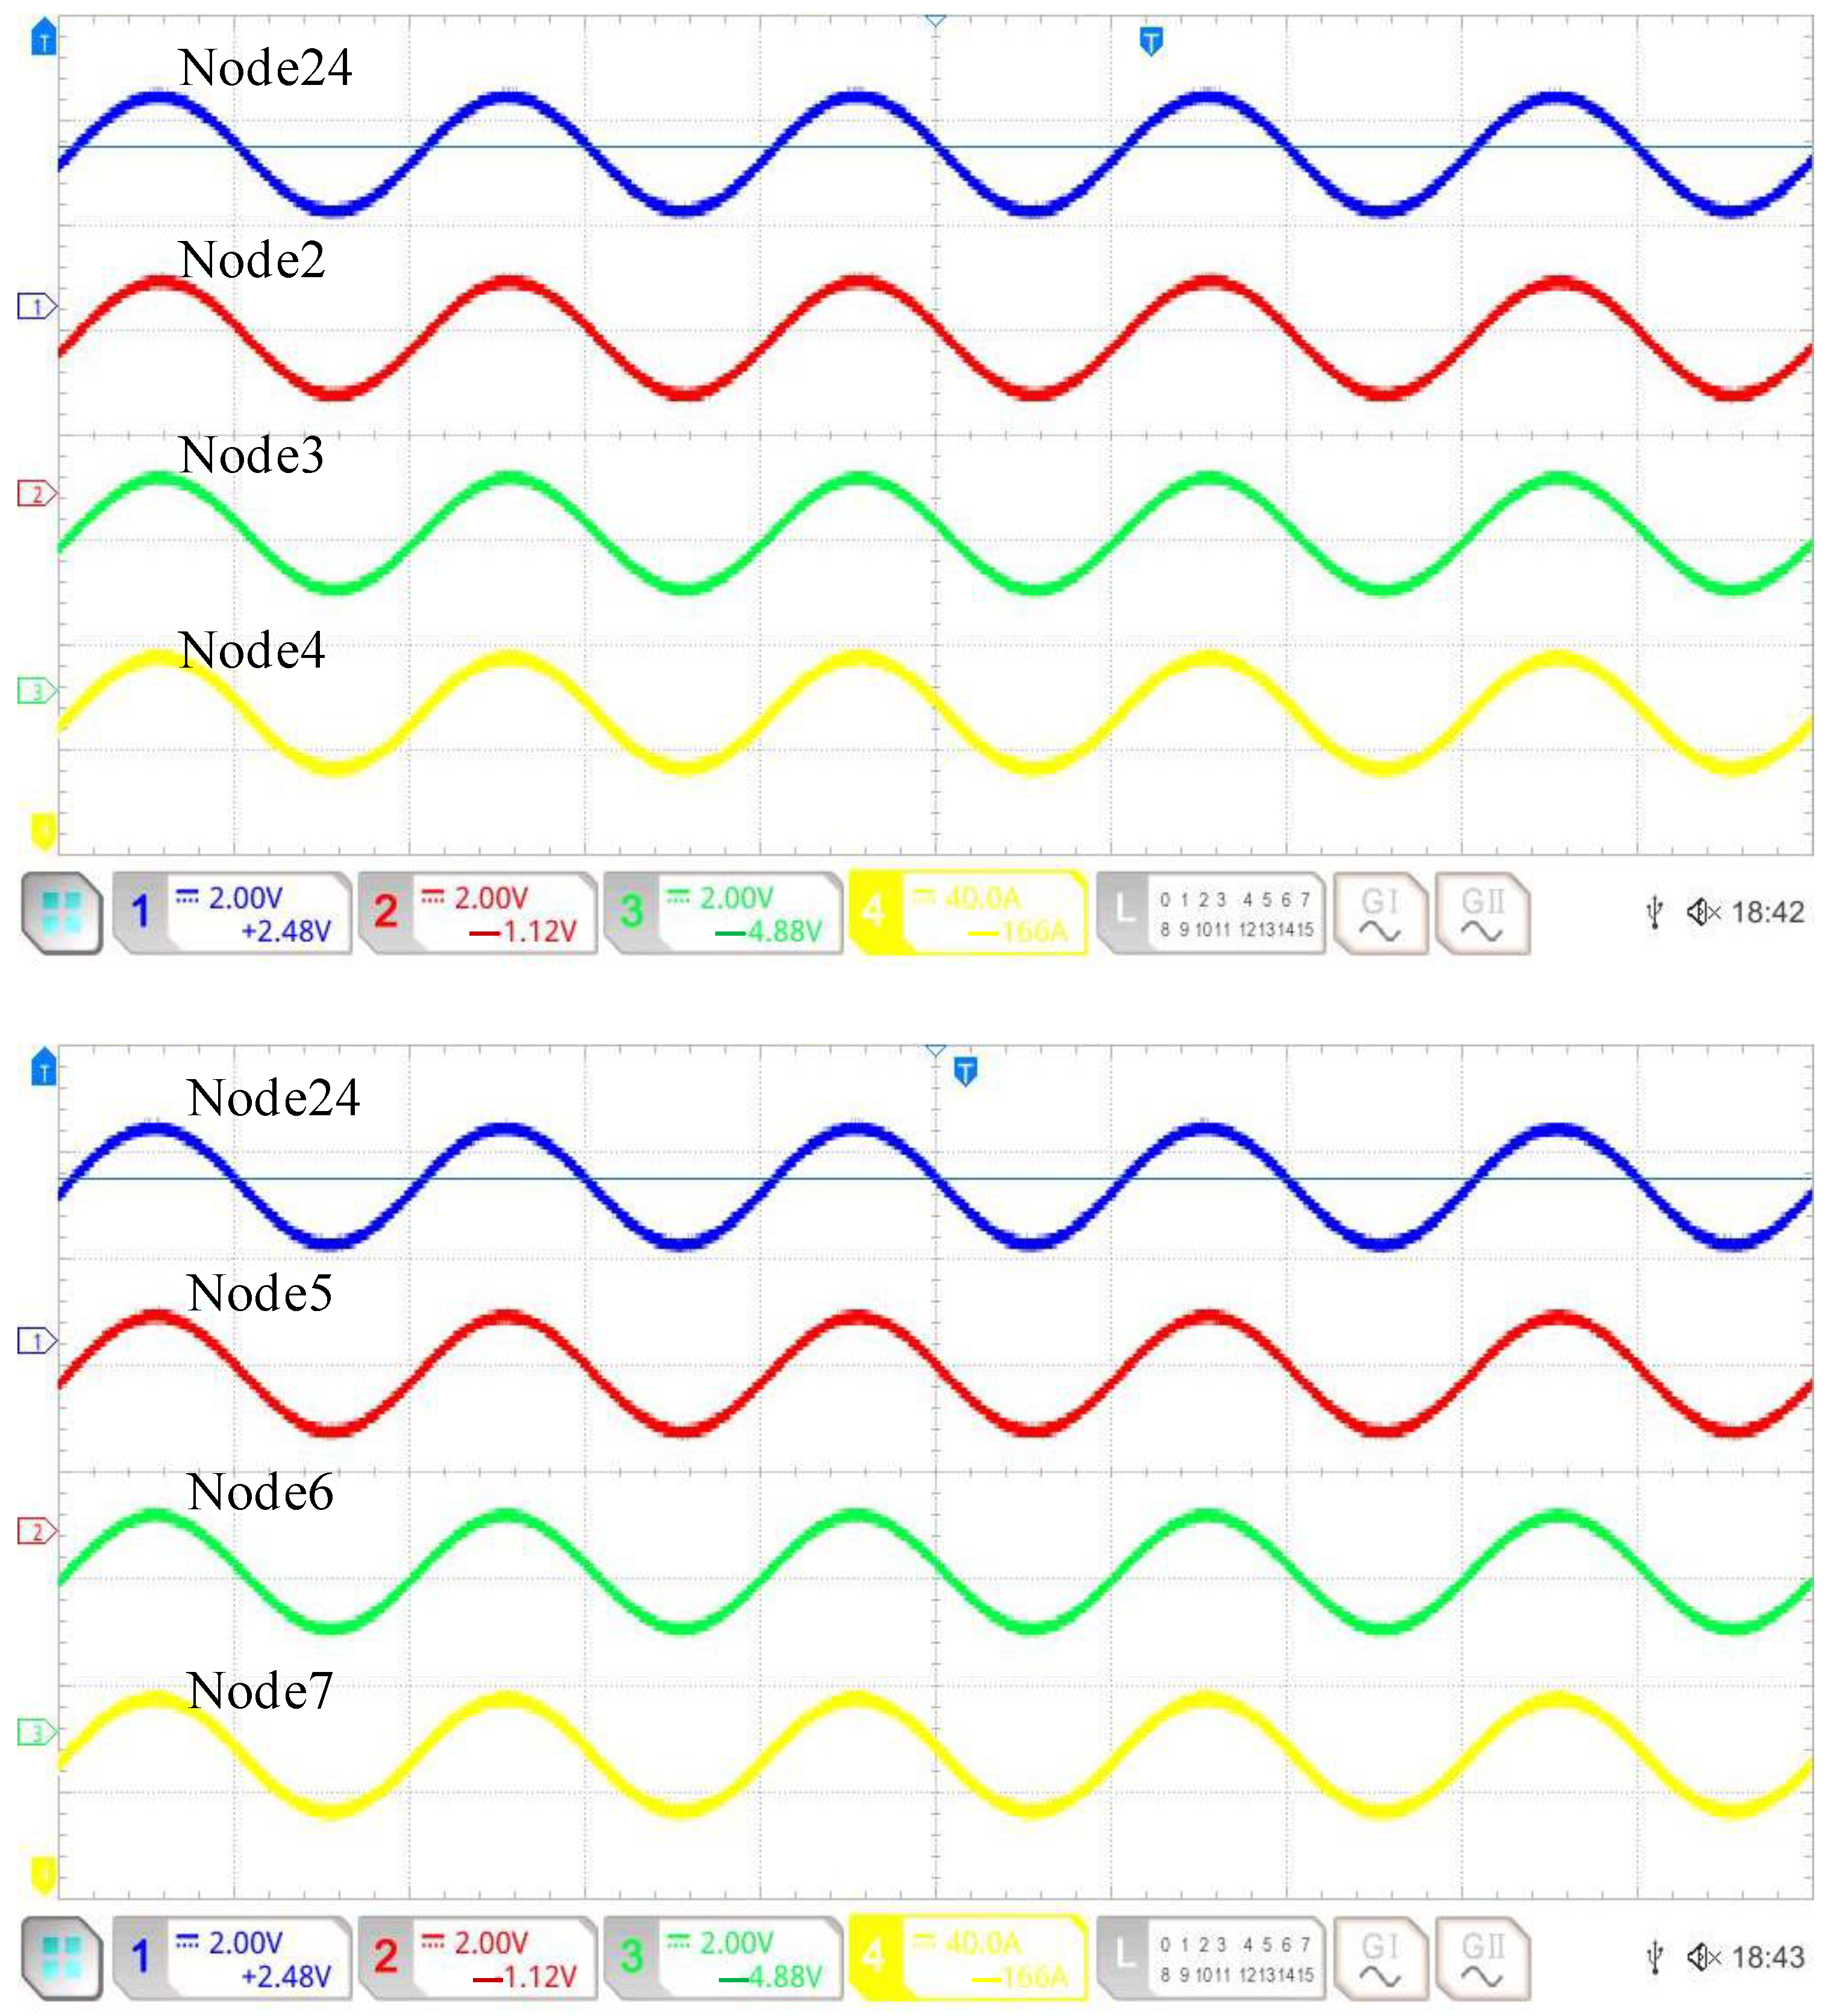
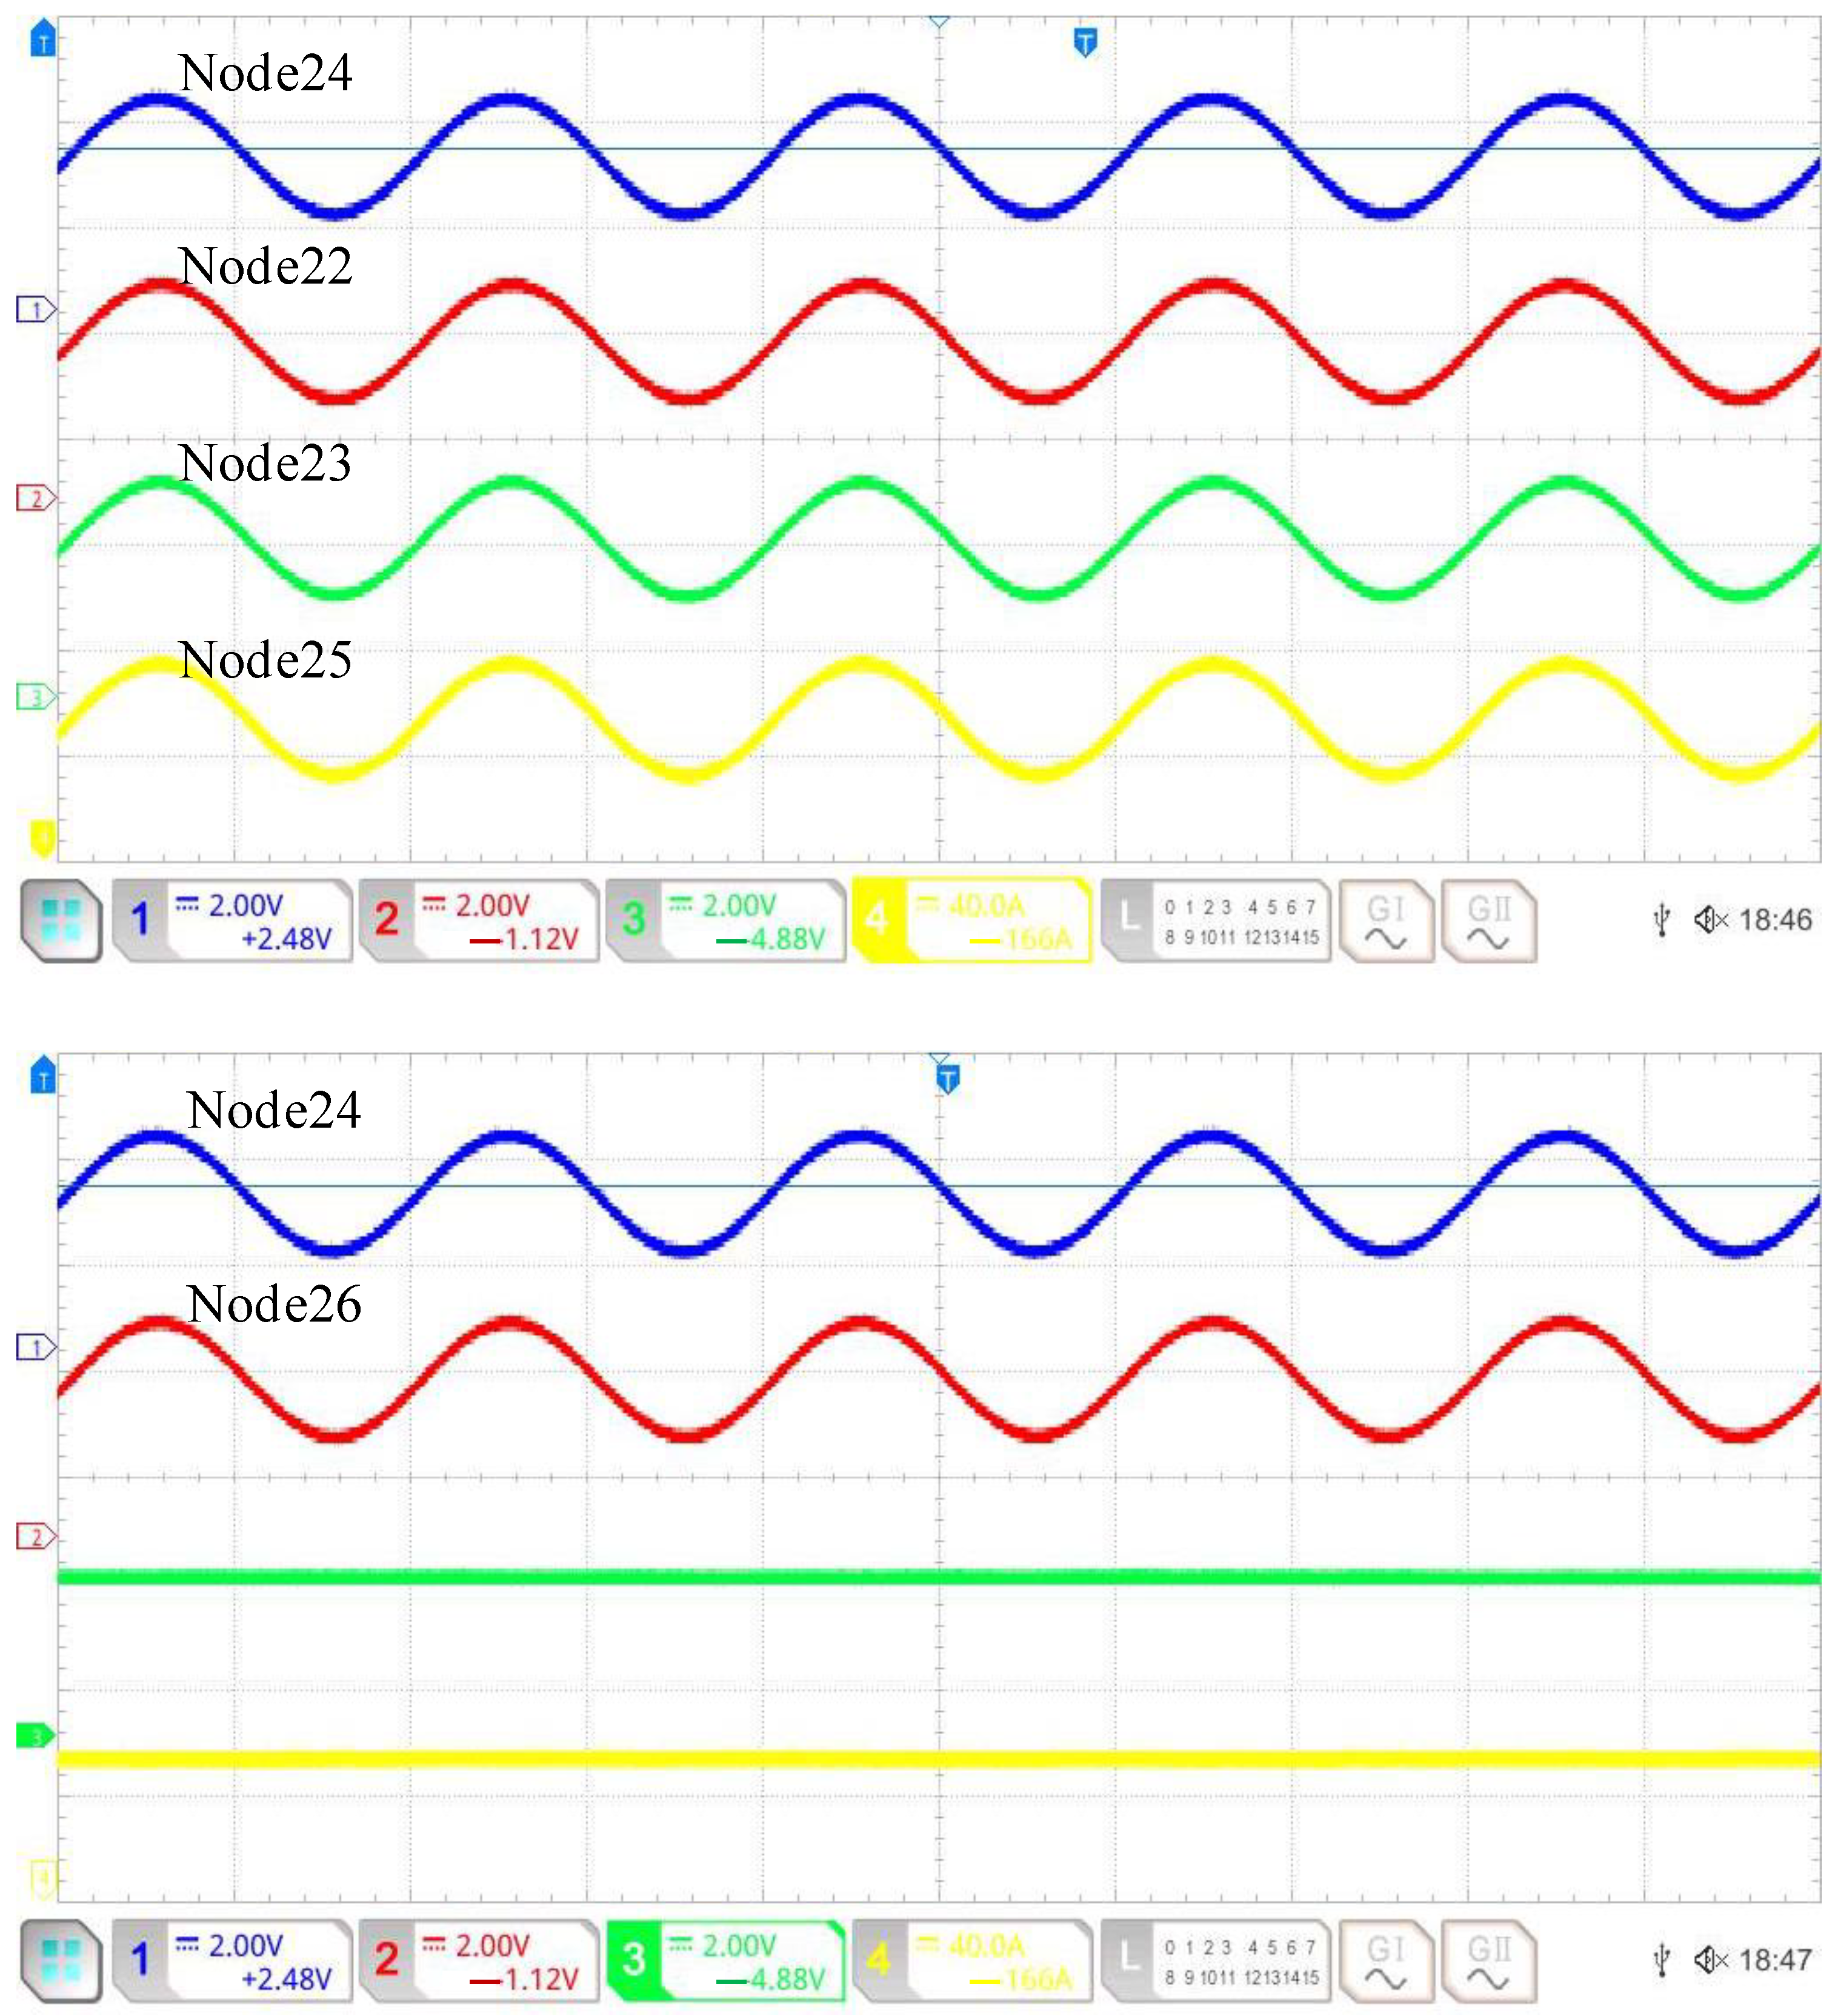
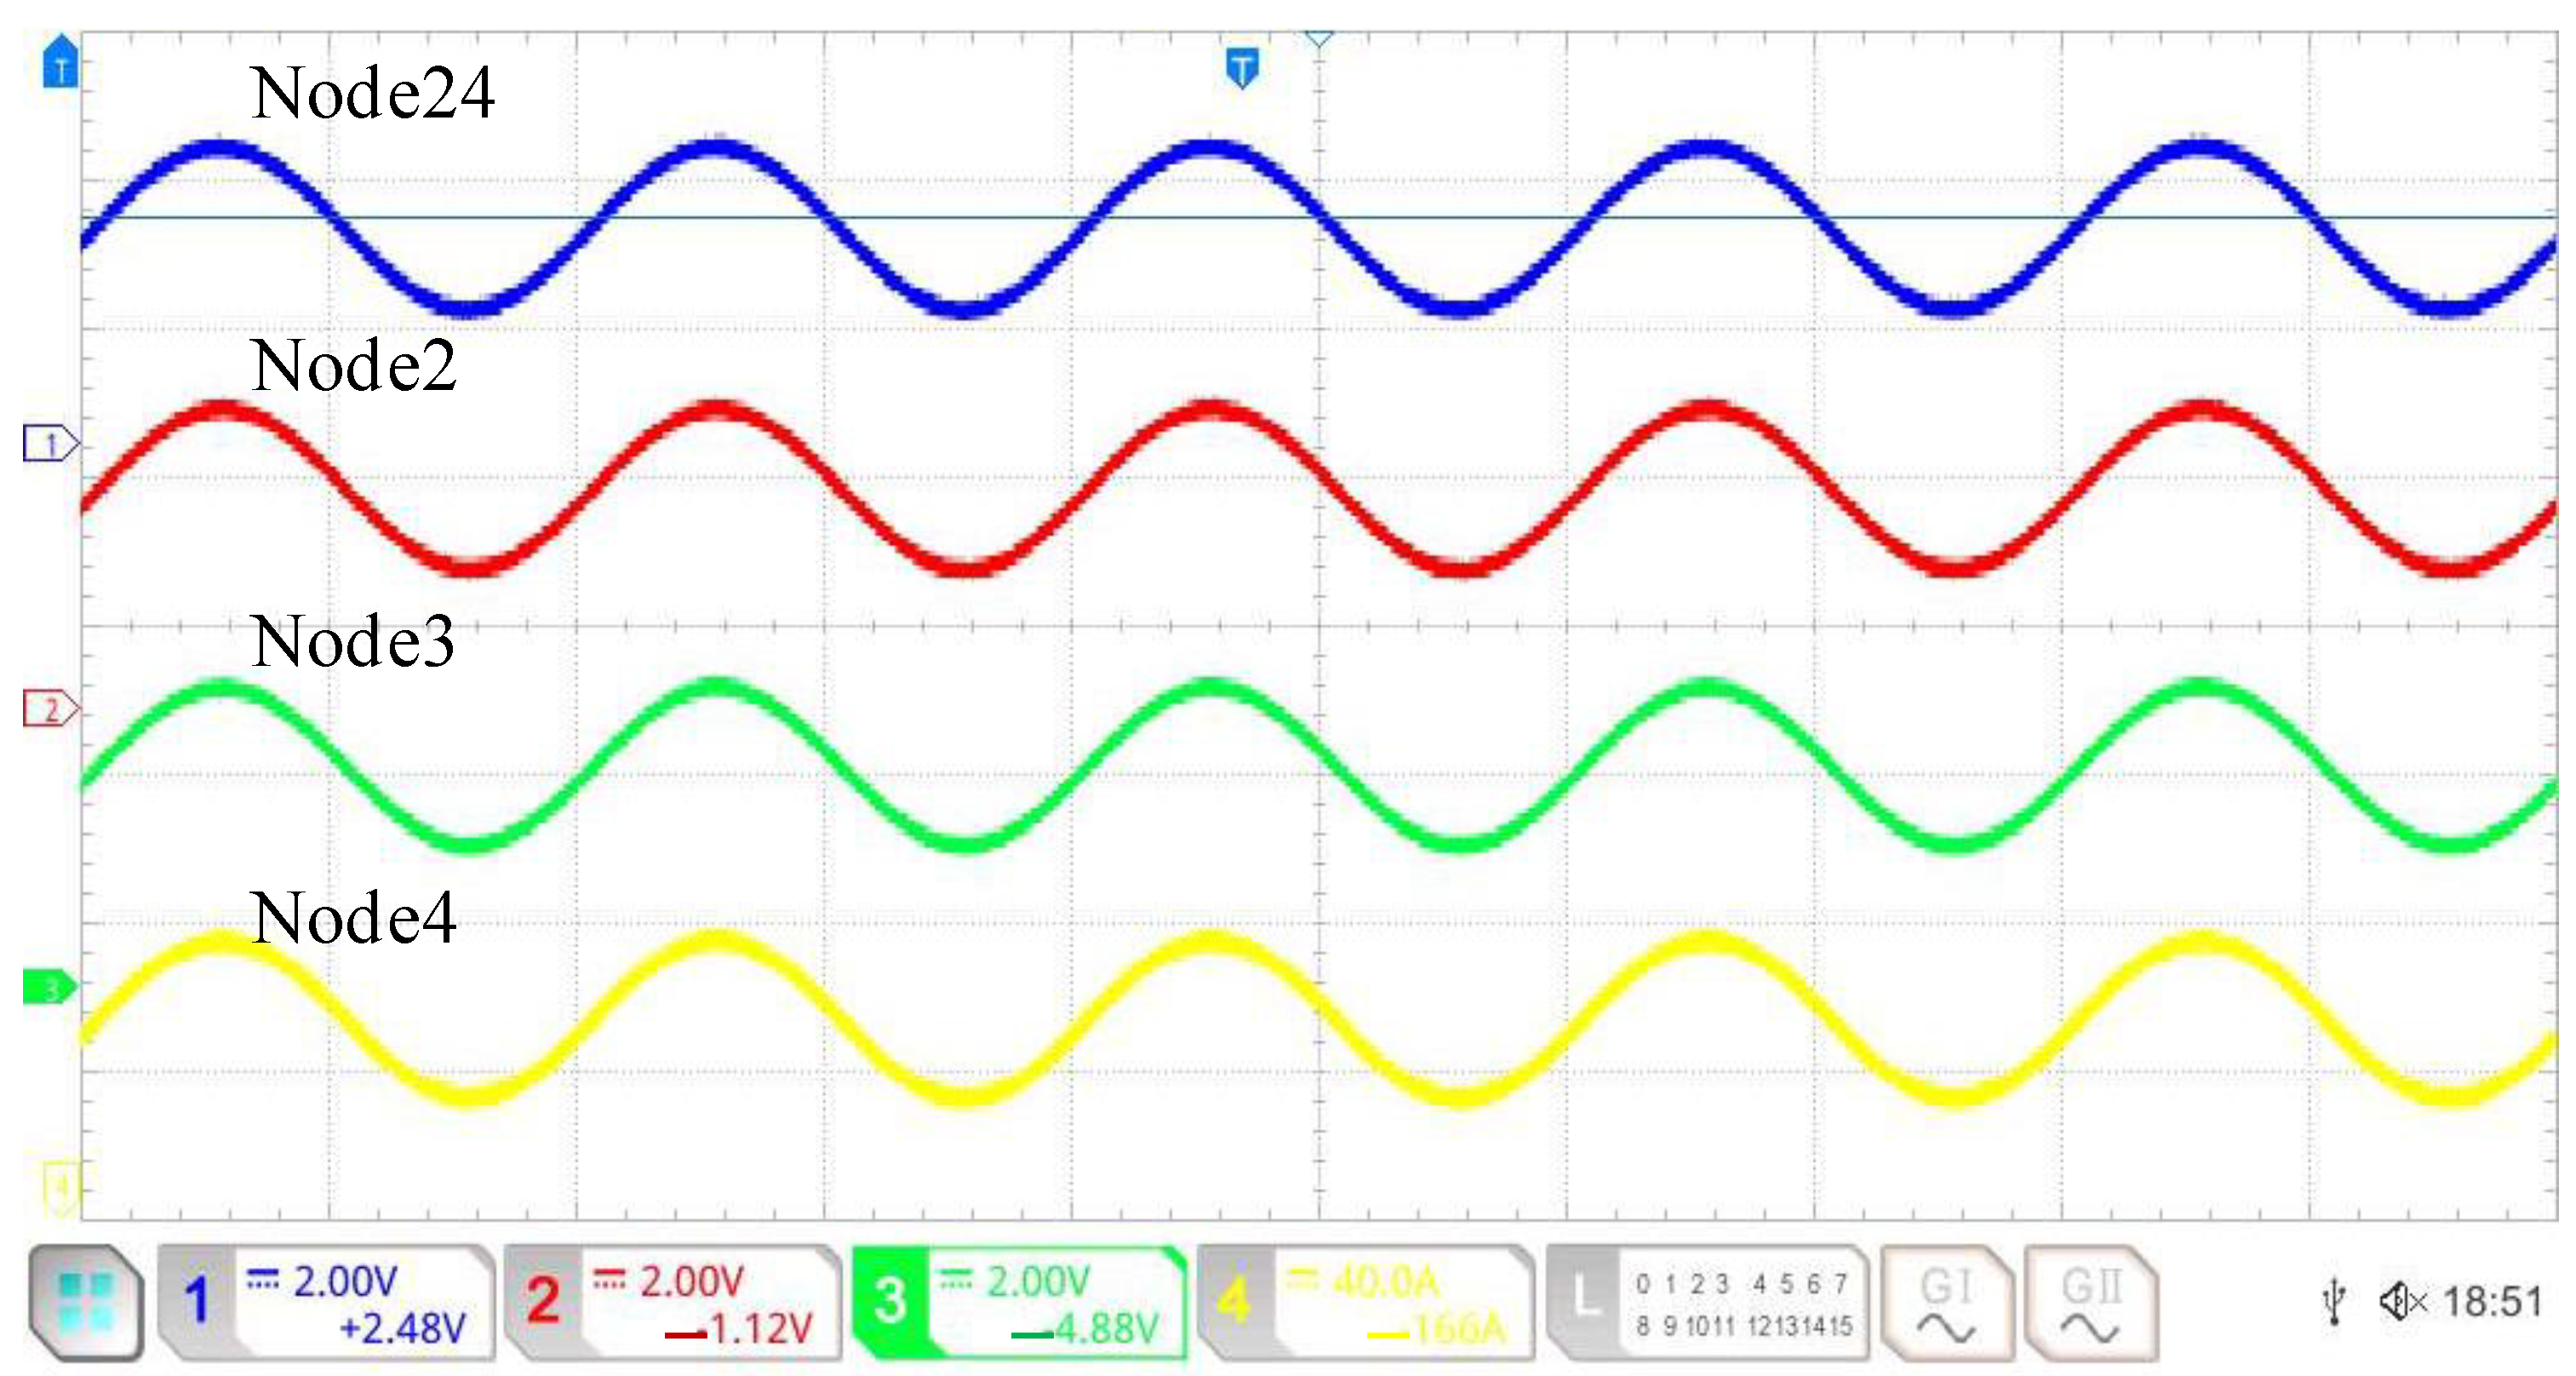
6. Experiment
7. Conclusions
Author Contributions
Funding
Institutional Review Board Statement
Informed Consent Statement
Data Availability Statement
Conflicts of Interest
Nomenclature
| the set of islands divided | the reactive power of time period node i when cutting off the load at time t | ||
| the set of nodes in island k | the load active demand of time period node i at time t | ||
| the set of the node connected to the main network | the load reactive demand of time period node i at time t | ||
| the set of DG nodes in the distribution network | the set of diesel generator nodes | ||
| the set of DG nodes in the distribution network | the reactive output of diesel generator i | ||
| the set of lines in island k | the active output of diesel generator i | ||
| the set of the connection line between the distribution network and the main network. | the minimum values of the active output of diesel generator i | ||
| the set of the faulty line | the maximum values of the reactive output of diesel generator i | ||
| the set of distribution lines | the minimum values of the reactive output of diesel generator i | ||
| the solution period for rolling optimization | the maximum values of the reactive output of diesel generator i | ||
| scheduling period for a new isolated island scheme | the active ramp rates of diesel generator i. | ||
| the step size of rolling optimization | the reactive ramp rates of diesel generator i. | ||
| the scheduling time window | the set of energy storage systems | ||
| the weight value assigned to node i load in island k | the discharge active power of energy storage system i at time t | ||
| the active load that node i in island k needs to cut off at time t | the charge active power of energy storage system i at time t | ||
| the weight of the network loss term | the minimum discharging active power of the energy storage system i | ||
| the maximum apparent power allowed to flow through line ij | the maximum discharging active power of the energy storage system i | ||
| the resistance of line ij | the minimum charging active power of the energy storage system i | ||
| the reactance of line ij | the maximum charging active power of the energy storage system i | ||
| the current flowing through line ij | the discharge reactive power of energy storage system i at time t | ||
| the load active power of node i in island k at time t | the charge reactive power of energy storage system i at time t | ||
| the wind power active power of node i in island k at time t | the discharge states of the energy storage system i at time t | ||
| the photovoltaic active power of node i in island k at time t | the charge states of the energy storage system i at time t | ||
| the states of node i in island k | the charging efficiency of the energy storage system i | ||
| the states of line ij in island k | the set of segmented switches | ||
| the potential root node of island k | the set of contact switches | ||
| a sufficiently large parameter | the weight value assigned to node i’s load | ||
| the flow direction of power from node i to node j at time t | the state of load at node i | ||
| the active power generation capacity of DG in island k at time t | the load recovery power of node i at time t | ||
| the reactive power generation capacity of DG in island k at time t | the opening and closing status of switch d | ||
| the load active power of node i in island k at time t | the weight values of the network loss term | ||
| the active power flowing through the line ij at time t | the switching frequency term | ||
| the reactive power flowing through the line ij at time t | the scheduling period experienced by the operation of isolated islands | ||
| the voltage of node i at time t | positive constant | ||
| the allowable minimum voltage amplitude of the node | positive constant | ||
| the allowable maximum voltage amplitude of the node | the data object | ||
| specified threshold for load | M | the dimension of the data object | |
| specified threshold for photovoltaic power | the j-th attribute value of | ||
| specified threshold for wind power | the i-th clustering center | ||
| the active output of node i’s wind turbine at time t | the j-th attribute value of and | ||
| the rated output power of node i’s fan at time t | the typical output scenarios of K wind and solar power plants obtained by the scene generation and restoration | ||
| the wind speed at node i | the expanded scenario set | ||
| the cut-in wind speed of node i’s fan | the wind speed shape coefficient of node i | ||
| the rated wind speed of the fan at node i | the maximum apparent power allowed to flow through the line ij | ||
| the cut-out wind speed of node ’’s fan | the active power of time period node i when cutting off the load at time t | ||
| the active output of node i’s photovoltaic system at time t | the standard deviation of photovoltaic active output at time t | ||
| the expected output of photovoltaic active power at time t |
References
- Han, J.; Lyu, W.; Song, H.; Qu, Y.; Wu, Z.; Zhang, X.; Li, Y.; Chen, Z. Optimization of Communication Network for Distributed Control of Wind Farm Equipped with Energy Storages. IEEE Trans. Sustain. Energy 2023, 14, 1933–1949. [Google Scholar] [CrossRef]
- Li, Y.; Wei, G.; Ma, Y.; Li, M.; He, W.; Li, G. Dynamic reconfiguration of active distribution network considering electric vehicles and distributed generations. Autom. Electr. Power Syst. 2018, 42, 102–110. [Google Scholar]
- Wang, H.; Chen, Z.; Zhao, H.; Yue, Y. Reconstruction Strategies for Fault Recovery of Active Distribution Network With Distributed Generation Uncertainties. Power Syst. Technol. 2022, 46, 4356–4364. [Google Scholar]
- Liang, Y.; Wang, Y.; Liu, K. CPS Fault Simulation of Distribution Network Considering Network Information Security. Power Syst. Technol. 2021, 45, 235–242. [Google Scholar]
- Ye, X.; Shang, L.; Dong, X.; Liu, C.; Tian, Y.; Fang, H. Knowledge Graph for Distribution Network Fault Handling. Power Syst. Technol. 2022, 46, 3739–3749. [Google Scholar]
- Osama Reham, A.; Zobaa Ahmed, F.; Abdelaziz Almoataz, Y. A Planning Framework for Optimal Partitioning of Distribution Networks into Microgrids. IEEE Syst. J. 2020, 14, 916–926. [Google Scholar] [CrossRef]
- Zhang, L.; Dou, X.; Zhao, W.; Hu, M. Islanding detection for active distribution network considering demand response. Electr. Meas. Instrum. 2019, 56, 63–68+75. [Google Scholar]
- Ying, Y.; Wang, C.; Dong, Q. Island division strategy of distribution network based on load comprehensive weight. Power Syst. Clean Energy 2021, 37, 91–97. [Google Scholar]
- El-Sayed, W.T.; Farag, H.E.; Zeineldin, H.H.; El-Saadany, E.F. Formation of Islanded Droop-Based Microgrids With Optimum Loadability. IEEE Trans. Power Syst. 2022, 37, 1564–1576. [Google Scholar] [CrossRef]
- Wang, X.; Sheng, X.; Qiu, W.; He, W.; Xu, J.; Xin, Y.; Jv, J. Fault Reconfiguration Strategies of Active Distribution Network With Uncertain Factors for Maximum Supply Capacity Enhancement. IEEE Access 2022, 10, 72373–72380. [Google Scholar] [CrossRef]
- Zhu, J.; Gu, W.; Jiang, P.; Wu, Z.; Yuan, X.; Nie, Y. Integrated approach for optimal island partition and power dispatch. J. Mod. Power Syst. Clean Energy 2018, 6, 449–462. [Google Scholar] [CrossRef]
- Yang, S.; Xia, M.; Chen, Q. Real-time dynamic islanding detection strategy for active distribution network considering interactive influence among source, network and load. Smart Grid 2019, 47, 1–8. [Google Scholar]
- Wu, Z.; Bian, X.; Zhou, B.; Xu, B.; Lin, Y.; Lin, W. Islanding detection method for active distribution network after disasters considering important nodes of information-energy coupling. Electr. Power Autom. Equip. 2023, 43, 74–81. [Google Scholar]
- Pang, K.; Wang, C.; Wen, F.; Xue, Y. Active distribution network flexible islanding partition and real-time scheduling strategy. Power Syst. Autom. 2022, 46, 13–24. [Google Scholar]
- Wang, Z.; Shen, C.; Xu, Y.; Liu, F.; Wu, X.; Liu, C.C. Risk-Limiting Load Restoration for Resilience Enhancement With Intermittent Energy Resources. IEEE Trans. Smart Grid 2019, 10, 2507–2522. [Google Scholar] [CrossRef]
- Bian, D.; Wei, Z.; Sun, G.; Huang, L.; Xu, X.; Sun, Y. Distribution network uncertainty reconfiguration model in demand response perspective. Autom. Electr. Power Syst. 2013, 37, 31–36. [Google Scholar]
- Zheng, N.; Hu, R.; Ding, X.; Miu, H.; Guan, Z. Reactive power optimization of distribution network considering multiple types of distributed generations and network reconfiguration. Smart Power 2019, 47, 90–96. [Google Scholar]
- Liu, S.; Zhou, B.; Song, J.; Hao, T. Multi-objective fault restoration considering the randomness of the output of distributed generator. Electr. Meas. Instrum. 2018, 55, 123–128. [Google Scholar]
- Liu, X.; Cui, S. Fault recovery strategy for distribution network with isolated island and reconfiguration. Huadian Technol. 2020, 42, 29–34. [Google Scholar]
- Huang, M.; Zhang, Q.; Zhang, S.; Yan, Z.; Gao, B.; Li, X. Distribution network reconfiguration considering demand-side response with high penetration of clean energy. Power Syst. Prot. Control 2022, 50, 116–123. [Google Scholar]
- Yan, H.; Wang, J.; Fan, X.; Wang, N. Post-disaster power supply restoration model of active distribution network based on user power outage loss assessment. Autom. Electr. Power Syst. 2022, 46, 31–42. [Google Scholar]
- Tang, Y.; Wu, Z.; Gu, W.; Yu, P.; Du, J.; Luo, X. Unified model for reconstruction and islanding of active distribution network during fault recovery. Power Syst. Technol. 2020, 44, 2731–2740. [Google Scholar]
- Ma, T.X.; Cheng, X.; Jia, Y.B. Service restoration method for active distribution network based on uncertain bi-level programming model. Power Syst. Prot. Control 2019, 47, 48–57. [Google Scholar]
- Chen, P.; Cheng, H.; Lv, J.; Zhang, H. Fault recovery of active distribution network considering active management based on second-order cone programming. Electr. Meas. Instrum. 2019, 56, 46–51. [Google Scholar]
- Yun, J.; Yan, Z.; Zhou, Y.; Zhang, P.; Hu, W. Multi-time collaborative restoration for integrated electrical-gas distribution system based on rolling optimization. CSEE J. Power Energy Syst. 2020, 1–13. [Google Scholar] [CrossRef]
- Wang, T.; Miao, S.; Yao, F.; Liu, Z.; Zhang, S. Day-ahead and Intra-day Joint Dispatch Strategy of High Proportion Wind Power System Considering Dynamic Frequency Response Constraints. Proc. CSEE 2023, 45, 1–19. [Google Scholar]
- Xu, Y.; Zhang, H.; Ma, T.; Yao, J. Coordinated optimization strategy of emergency fault recovery and restoration for distributed generation integrated distribution network. Autom. Electr. Power Syst. 2021, 45, 38–46. [Google Scholar]
- Baran, M.E.; Wu, F.F. Network reconfiguration in distribution systems for loss reduction and load balancing. IEEE Trans. Power Deliv. 1989, 4, 1401–1407. [Google Scholar] [CrossRef]
- Fang, J.; Lin, X.; Wang, H.; Yin, K.; Zhang, M.; Fang, M.; Li, S. Calculation method of outage probability of distribution network based on real-time failure rate of equipment. Electr. Meas. Instrum. 2023, 60, 26–32. [Google Scholar]
- Li, H.; Ma, C.; Sun, J.; Qiu, C.; Zhu, J.C.; Liao, Y. Research on distribution network fault recovery method with micro-grid based on improved BPSO algorithm. Electr. Meas. Instrum. 2022, 59, 100–105. [Google Scholar]
- Wei, X.; Liang, Y.; Guo, L.; Zhang, D.; Jia, Y. Research on fault location method of distribution network based on Lambda algorithm. Electr. Meas. Instrum. 2022, 59, 71–76. [Google Scholar]


| Node | DG Type | Capacity (kW) | Power Factor |
|---|---|---|---|
| 6 | Wind or photovoltaic power | 500 | 0.85 |
| 13 | Energy storage | 700 | 0.9 |
| 24 | Diesel generator | 1000 | 0.8 |
| 31 | Diesel generator | 1000 | 0.9 |
| Load Type | Weight Coefficient | Node |
|---|---|---|
| Level 1 | 100 | 5, 6, 12, 13, 23, 24, 29, 31 |
| Level 2 | 10 | 7, 11, 15, 22, 26, 30, 32 |
| Level 3 | 1 | 1, 2, 3, 4, 8, 9, 10, 14, 16, 17, 18, 19, 20, 21, 25, 27, 28 |
| Algorithm Category | Active Power Loss | Minimum Voltage | Maximum Voltage |
|---|---|---|---|
| Before reconstruction | 49.3339 | 1.0683 | 1.1 |
| After GA reconstruction | 43.4675 | 1.0729 | 1.1 |
| Algorithm Category | Active power Loss | Minimum Voltage | Maximum Voltage |
|---|---|---|---|
| Before reconstruction | 22.2987 | 0.9736 | 1.1 |
| After GA reconstruction | 19.2725 | 0.9824 | 1.1 |
| Algorithm Category | Active Power Loss | Minimum Voltage | Maximum Voltage |
|---|---|---|---|
| Before reconstruction | 39.5470 | 0.9650 | 1.1 |
| After GA reconstruction | 33.9117 | 0.9696 | 1.1 |
Disclaimer/Publisher’s Note: The statements, opinions and data contained in all publications are solely those of the individual author(s) and contributor(s) and not of MDPI and/or the editor(s). MDPI and/or the editor(s) disclaim responsibility for any injury to people or property resulting from any ideas, methods, instructions or products referred to in the content. |
© 2023 by the authors. Licensee MDPI, Basel, Switzerland. This article is an open access article distributed under the terms and conditions of the Creative Commons Attribution (CC BY) license (https://creativecommons.org/licenses/by/4.0/).
Share and Cite
Yang, Z.; Han, J.; Li, L.; Deng, Y.; Yang, F.; Lei, Y.; Min, H.; Hu, W.; Su, L. Research of Islanding Operation and Fault Recovery Strategies of Distribution Network Considering Uncertainty of New Energy. Electronics 2023, 12, 4230. https://doi.org/10.3390/electronics12204230
Yang Z, Han J, Li L, Deng Y, Yang F, Lei Y, Min H, Hu W, Su L. Research of Islanding Operation and Fault Recovery Strategies of Distribution Network Considering Uncertainty of New Energy. Electronics. 2023; 12(20):4230. https://doi.org/10.3390/electronics12204230
Chicago/Turabian StyleYang, Zhichun, Ji Han, Li Li, Yuting Deng, Fan Yang, Yang Lei, Huaidong Min, Wei Hu, and Lei Su. 2023. "Research of Islanding Operation and Fault Recovery Strategies of Distribution Network Considering Uncertainty of New Energy" Electronics 12, no. 20: 4230. https://doi.org/10.3390/electronics12204230
APA StyleYang, Z., Han, J., Li, L., Deng, Y., Yang, F., Lei, Y., Min, H., Hu, W., & Su, L. (2023). Research of Islanding Operation and Fault Recovery Strategies of Distribution Network Considering Uncertainty of New Energy. Electronics, 12(20), 4230. https://doi.org/10.3390/electronics12204230