

A Network Traffic Intrusion Detection Method for Industrial Control Systems Based on Deep Learning
Abstract
:1. Introduction
1.1. Background
1.2. Related Work
1.3. Main Contributions
- This research develops an efficient detection model named MS1DCNN-ECA-BiLSTM, which is mainly used to identify the attack network traffic in an ICS.
- We designed the MS1DCNN module to extract features with different granularity, and used the ECA module to assign weights to the features, which enhanced the perception ability of the model.
- This study utilized the DBO algorithm to optimize the main parameters of the model and find the best position, and the optimized model has higher accuracy.
- To improve the local detection ability, we used SMOTE to fill in unbalanced data, which improves the robustness of the model.
2. Materials and Methods
2.1. Applicability of the Method
2.2. One-Dimensional Convolutional Neural Networks
2.3. Bidirectional Long Short-Term Memory
2.4. Efficient Channel Attention Module
2.5. Dung Beetle Optimizer
2.6. Data Preprocessing Method
- A.
- Normalized
- B.
- Synthetic Minority Over-Sampling Technique
3. The Proposed Methodology
3.1. Algorithm Overview
3.2. Model Structure
3.3. Parameter Optimization
- (1)
- First is the preprocessing of raw data. To achieve better training results and avoid the problem of gradient explosion during training, one must first preprocess the original data, fill in the null values in the original data, and then encode non-numeric features using label encoding. To prevent the existence of singular samples from affecting the convergence effect of the model, one must normalize and standardize the data, and use min–max normalization to keep all data between 0 and 1.
- (2)
- Set the object. Select the optimized function. The optimized function refers to the target that needs to be optimized, which was our model. Then, select the parameters to be optimized; we optimized the learning rate, dropout, and the number of neurons in the hidden layer. The learning rate controls the magnitude of each parameter update, and its size determines how quickly the network learns. The dropout rate is used to solve the overfitting problem of neural networks. An appropriate dropout rate can improve the generalization ability of the model. The hidden layer unit refers to the memory unit or memory cell in BiLSTM. It determines the capacity and expressiveness of the BiLSTM network, as well as the model’s ability to model complex patterns and dependencies of the input sequence.
- (3)
- Initialize the relevant parameters of the DBO optimization algorithm. These include population size P, the maximum number of iterations T, the number of parameters to be optimized, the upper and lower limits of parameters, and the optimized function. Where P represents the size of the collection of dung beetle individuals in the algorithm, T represents the number of iterations of optimization.
- (4)
- Start training. First, initialize the population position. Position refers to the value of each parameter, which is randomly assigned within the constraints. Then, add the position parameters at this time into the algorithm model, and take the accuracy rate of the intrusion detection model as the evaluation standard of the current position. Update the dung beetle location, spawning location, foraging dung beetle location, and thief dung beetle location.
- (5)
- After each round of iteration, find out the current optimal position and compare it with the historical optimal position to determine whether to update the historical optimal position and then enter the next round of iteration.
- (6)
- After T iterations, input the parameters of the historical optimal position, namely the learning rate, dropout, and the number of neurons in the hidden layer, into the intrusion detection model as the final parameters of the model.
4. Experiments and Results
4.1. Experimental Environment
4.2. Evaluation Standard
4.3. Experimental Datasets and Preprocessing
4.4. Experimental Results and Analysis
5. Conclusions
Author Contributions
Funding
Data Availability Statement
Conflicts of Interest
References
- Zhao, X.; Zhang, L.; Cao, Y.; Jin, K.; Hou, Y. Anomaly Detection Approach in Industrial Control Systems Based on Measurement Data. Information 2022, 13, 450. [Google Scholar] [CrossRef]
- Ngambeki, I.; Spafford, E.; Ansari, S.; Alhasan, I.; Basil-Camino, M.; Rapp, D. Creating a concept map for ICS security—A Delphi study. In Proceedings of the 2021 IEEE Frontiers in Education Conference (FIE), Lincoln, NE, USA, 13–16 October 2021; pp. 1–7. [Google Scholar]
- Wang, J.; Cao, S.J.; Yu, C.W. Development trend and challenges of sustainable urban design in the digital age. Indoor Built Environ. 2021, 30, 3–6. [Google Scholar] [CrossRef]
- Ghobakhloo, M.; Fathi, M.; Iranmanesh, M. Industry 4.0 ten years on: A bibliometric and systematic review of concepts, sustainability value drivers, and success determinants. J. Clean. Prod. 2021, 302, 127052. [Google Scholar] [CrossRef]
- Abosata, N.; Al-Rubaye, S.; Inalhan, G.; Emmanouilidis, C. Internet of Things for System Integrity: A Comprehensive Survey on Security, Attacks and Countermeasures for Industrial Applications. Sensors 2021, 21, 3654. [Google Scholar] [CrossRef] [PubMed]
- Ahmadian, M.M.; Shajari, M.; Shafiee, M.A. Industrial control system security taxonomic framework with application to a comprehensive incidents survey. Int. J. Crit. Infrastruct. Prot. 2020, 29, 100356. [Google Scholar] [CrossRef]
- Khan, M.A. HCRNNIDS: Hybrid Convolutional Recurrent Neural Network-Based Network Intrusion Detection System. Processes 2021, 9, 834. [Google Scholar] [CrossRef]
- Lee, E.; Rupapara, V.; Rustam, F.; Ashraf, I. Malicious traffic detection in iot and local networks using stacked ensemble classifier. Comput. Mater. Contin. 2022, 71, 489–515. [Google Scholar]
- Rustam, F.; Mushtaq, M.F.; Hamza, A.; Farooq, M.S.; Jurcut, A.D.; Ashraf, I. Denial of Service Attack Classification Using Machine Learning with Multi-Features. Electronics 2022, 11, 3817. [Google Scholar] [CrossRef]
- Thakkar, A.; Lohiya, R. Fusion of statistical importance for feature selection in Deep Neural Network-based Intrusion Detection System. Inf. Fusion 2023, 90, 353–363. [Google Scholar] [CrossRef]
- Kasongo, S.M. A deep learning technique for intrusion detection system using a Recurrent Neural Networks based framework. Comput. Commun. 2023, 199, 113–125. [Google Scholar] [CrossRef]
- Mushtaq, E.; Zameer, A.; Umer, M.; Abbasi, A.A. A two-stage intrusion detection system with auto-encoder and LSTMs. Appl. Soft Comput. 2022, 121, 108768. [Google Scholar] [CrossRef]
- Rustam, F.; Raza, A.; Ashraf, I.; Jurcut, A.D. Deep ensemble-based efficient framework for network attack detection. In Proceedings of the 2023 21st Mediterranean Communication and Computer Networking Conference (MedComNet), Island of Ponza, Italy, 13–15 June 2023; IEEE: New York, NY, USA, 2023; pp. 1–10. [Google Scholar]
- Ling, J.; Zhu, Z.; Luo, Y.; Wang, H. An intrusion detection method for industrial control systems based on bidirectional simple recurrent unit. Comput. Electr. Eng. 2021, 91, 107049. [Google Scholar] [CrossRef]
- Hnamte, V.; Hussain, J. DCNNBiLSTM: An efficient hybrid deep learning-based intrusion detection system. Telemat. Inform. Rep. 2023, 10, 100053. [Google Scholar] [CrossRef]
- Cao, B.; Li, C.; Song, Y.; Qin, Y.; Chen, C. Network Intrusion Detection Model Based on CNN and GRU. Appl. Sci. 2022, 12, 4184. [Google Scholar] [CrossRef]
- Wahid, A.; Breslin, J.G.; Intizar, M.A. Prediction of Machine Failure in Industry 4.0: A Hybrid CNN-LSTM Framework. Appl. Sci. 2022, 12, 4221. [Google Scholar] [CrossRef]
- Luo, N.; Li, Y.; Yang, B.; Liu, B.; Dai, Q. Prediction Model for Tea Polyphenol Content with Deep Features Extracted Using 1D and 2D Convolutional Neural Network. Agriculture 2022, 12, 1299. [Google Scholar] [CrossRef]
- Israel, I.M.; Israel, S.A.; Irvine, J.M. Factors Influencing CNN Performance. In Proceedings of the 2021 IEEE Applied Imagery Pattern Recognition Workshop (AIPR), Washington, DC, USA, 12–14 October 2021; IEEE: New York, NY, USA, 2021; Volume 10, pp. 1–4. [Google Scholar]
- Li, S.; Yang, J.; Wu, F.; Rashed, G.I. Combined prediction of photovoltaic power based on sparrow search algorithm optimized convolution long and short-term memory hybrid neural network. Electronics 2022, 11, 1654. [Google Scholar] [CrossRef]
- Jogin, M.; Mohana, M.S.; Divya, G.D.; Meghana, R.K.; Apoorva, S. Feature Extraction using Convolution Neural Networks (CNN) and Deep Learning. In Proceedings of the 2018 3rd IEEE International Conference on Recent Trends in Electronics, Information & Communication Technology (RTEICT), Bangalore, India, 18–19 May 2018; IEEE: New York, NY, USA, 2018; Volume 5, pp. 2319–2323. [Google Scholar]
- Kiranyaz, S.; Avci, O.; Abdeljaber, O.; Ince, T.; Gabbouj, M.; Inman, D.J. 1D convolutional neural networks and applications: A survey. Mech. Syst. Signal Process. 2021, 151, 107398. [Google Scholar] [CrossRef]
- Smagulova, K.; James, A.P. Overview of long short-term memory neural networks. In Deep Learning Classifiers with Memristive Networks: Theory and Applications; Springer: Berlin/Heidelberg, Germany, 2020; pp. 139–153. [Google Scholar]
- Wang, Q.; Wu, B.; Zhu, P.; Li, P.; Zuo, W.; Hu, Q. ECA-Net: Efficient channel attention for deep convolutional neural networks. In Proceedings of the IEEE/CVF Conference on Computer Vision and Pattern Recognition, New Orleans, LA, USA, 18–22 June 2020; pp. 11534–11542. [Google Scholar]
- Xue, J.; Shen, B. Dung beetle optimizer: A new meta-heuristic algorithm for global optimization. J. Supercomput. 2023, 79, 7305–7336. [Google Scholar] [CrossRef]
- Wu, Y.; He, K. Group normalization. In Proceedings of the European Conference on Computer Vision (ECCV), Munich, Germany, 8–14 September 2018; pp. 3–19. [Google Scholar]
- Fernández, A.; Garcia, S.; Herrera, F.; Chawla, N.V. SMOTE for learning from imbalanced data: Progress and challenges, marking the 15-year anniversary. J. Artif. Intell. Res. 2018, 61, 863–905. [Google Scholar] [CrossRef]


| Reference | Method | Dataset | Score | Limitation |
|---|---|---|---|---|
| [8] | PCA, EBF | UNSW-NB15, IoTID20 | 98.4% | It mainly studies the importance of features, but does not pay attention to the correlation between features. |
| [9] | PCA, SVD | DoS dataset | 100% | It only detects DDoS attacks, not multiple attacks. |
| [10] | DNN | NSL-KDD, UNSW_NB-15, CIC-IDS 2017 | 99.84%, 89.03%, 99.80% | It designs many feature selection functions, but does not pay attention to the learning ability of the model to learn features. |
| [11] | XGboost, LSTM, GRU, sample RNN | NSL-KDD, UNSW-NB15 | 86.93%, 78.40% | LSTM, GRU, and simple RNN have different performances in different tasks. It does not consider a synthesis method that performs well in multiple tasks. |
| [12] | AE, LSTM | NSL-KDD | 89% | Without considering the two-way variant of LSTM, it cannot learn the time correlation of features from the front and back simultaneously. |
| [13] | BiSRU | gas pipeline dataset | 96.23% | It does not perform well in some minority samples. |
| [14] | DCNNBiLSTM | CICIDS2018, Edge_IIoT | 100%, 99.64% | This mixed model has a large number of parameters, and the author does not consider parameter optimization. |
| Name | Category | Amount | Label |
|---|---|---|---|
| normal traffic | normal | 57,693 | 0 |
| spoofing attack | abnormal | 10,008 | 1 |
| detection attack A | abnormal | 4427 | 2 |
| detection attack B | abnormal | 512 | 3 |
| socket attack | abnormal | 19,632 | 4 |
| DDoS | abnormal | 10,000 | 5 |
| Parameter | Lower Bounds | Upper Bounds | Optimal Position |
|---|---|---|---|
| Dropout rate | 0.1 | 0.8 | 0.5 |
| Learning rate | 0.0001 | 0.1 | 0.001 |
| Hidden layer parameter 1 | 30 | 300 | 272 |
| Hidden layer parameter 2 | 30 | 300 | 256 |
| Method | Accuracy | Precision | Recall | F1 Score |
|---|---|---|---|---|
| 1DCNN | 0.8759 | 0.8845 | 0.8759 | 0.8713 |
| MS1DCNN | 0.9001 | 0.9058 | 0.9001 | 0.8859 |
| BiLSTM | 0.9099 | 0.9084 | 0.9100 | 0.9071 |
| MS1DCNN-ECA | 0.9205 | 0.9208 | 0.9205 | 0.9215 |
| MS1DCNN-ECA-BiLSTM | 0.9550 | 0.9570 | 0.9550 | 0.9540 |
| DBO-MS1DCNN-ECA-BiLSTM | 0.9704 | 0.9717 | 0.9705 | 0.9703 |
| Method | Accuracy | Precision | Recall | F1 Score |
|---|---|---|---|---|
| Decision Tree | 0.9099 | 0.9084 | 0.9100 | 0.9071 |
| SVM | 0.9001 | 0.9058 | 0.9001 | 0.8859 |
| Random Forest | 0.8759 | 0.8845 | 0.8759 | 0.8713 |
| Logistic Regression | 0.9205 | 0.9208 | 0.9205 | 0.9215 |
| DBO-MS1DCNN-ECA-BiLSTM | 0.9704 | 0.9717 | 0.9705 | 0.9703 |
| Method | Accuracy | Precision | Recall | F1 Score |
|---|---|---|---|---|
| normal traffic | 0.9904 | 0.9976 | 0.9904 | 0.9940 |
| spoofing attack | 0.9990 | 0.9857 | 0.9990 | 0.9923 |
| detection attack A | 0.7980 | 0.9475 | 0.7981 | 0.8664 |
| detection attack B | 0.9517 | 0.8830 | 0.9517 | 0.9161 |
| socket attack | 0.9786 | 0.8802 | 0.9786 | 0.9268 |
| DDOS | 1.0000 | 0.9990 | 1.0000 | 0.9995 |
| Method | Accuracy | Precision | Recall | F1 Score |
|---|---|---|---|---|
| normal traffic | 0.9978 | 0.9861 | 0.9978 | 0.9919 |
| spoofing attack | 0.8954 | 0.9961 | 0.8954 | 0.9431 |
| detection attack A | 0.6363 | 0.6958 | 0.6363 | 0.6647 |
| detection attack B | 0.0455 | 0.4167 | 0.0455 | 0.0820 |
| socket attack | 0.9813 | 0.8700 | 0.9813 | 0.9223 |
| DDOS | 1.0000 | 0.9995 | 1.0000 | 0.9997 |
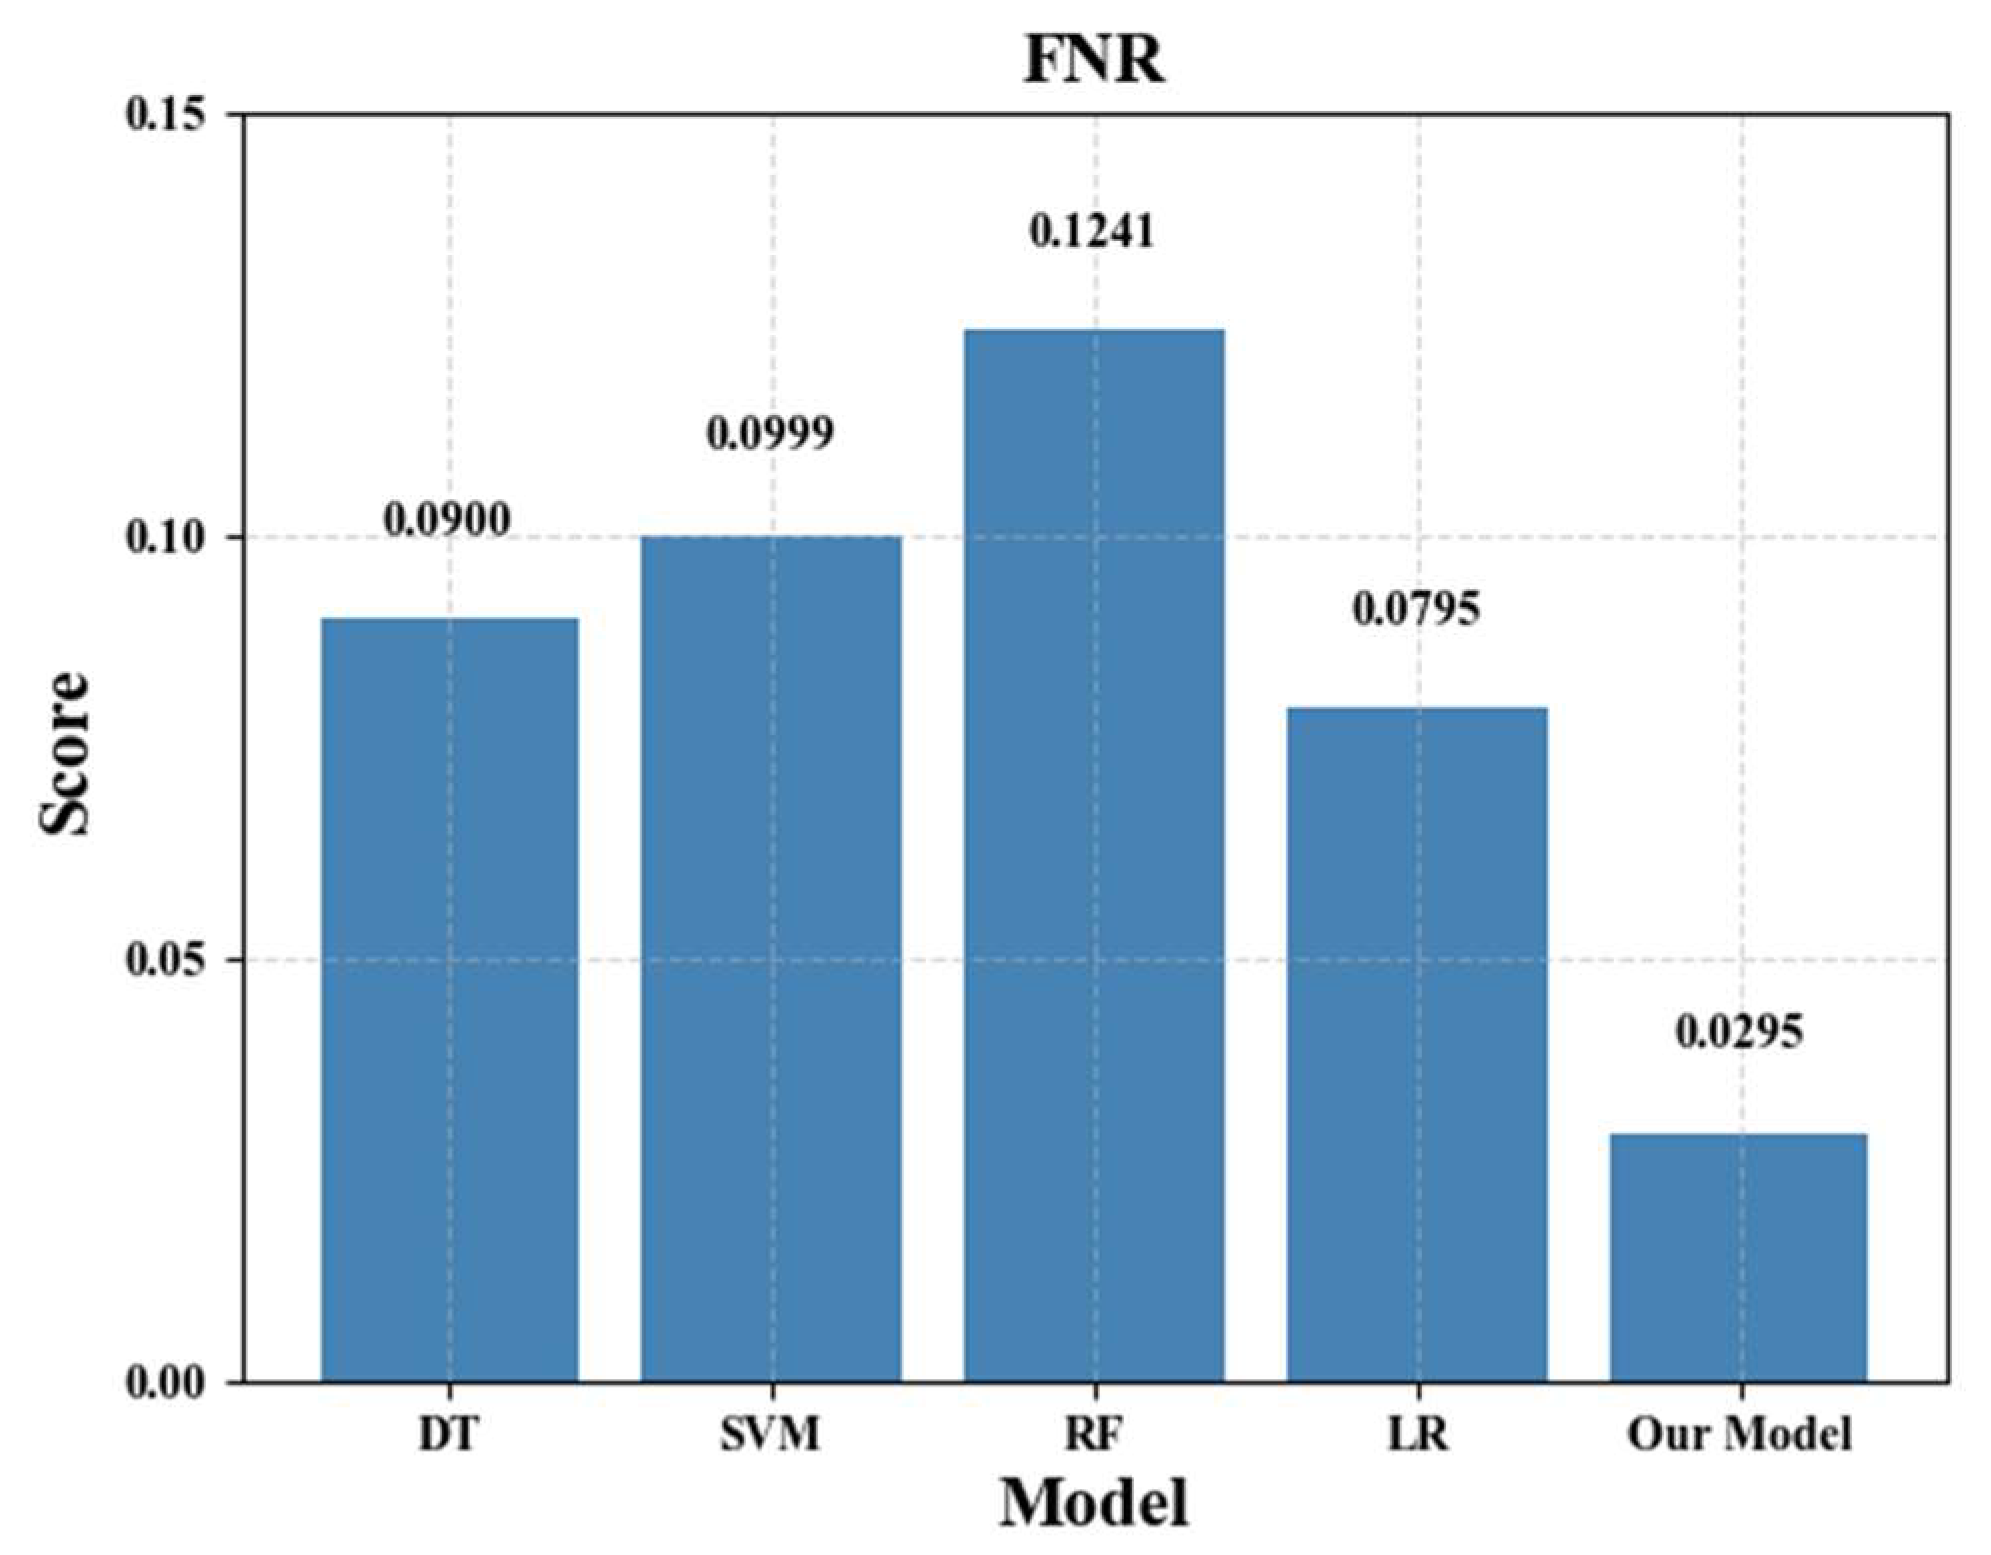
| Type | Accuracy | Precision | Recall | F1 Score | FNR |
|---|---|---|---|---|---|
| Our Model | 0.9930 | 0.9930 | 0.9930 | 0.9930 | 0.0070 |
| SVM | 0.9389 | 0.9270 | 0.9389 | 0.9270 | 0.0611 |
| Decision Tree | 0.9543 | 0.9444 | 0.9543 | 0.9439 | 0.0457 |
| Logistic Regression | 0.9542 | 0.9437 | 0.9542 | 0.9433 | 0.0458 |
| Random Forest | 0.9514 | 0.9498 | 0.9514 | 0.9397 | 0.0486 |
Disclaimer/Publisher’s Note: The statements, opinions and data contained in all publications are solely those of the individual author(s) and contributor(s) and not of MDPI and/or the editor(s). MDPI and/or the editor(s) disclaim responsibility for any injury to people or property resulting from any ideas, methods, instructions or products referred to in the content. |
© 2023 by the authors. Licensee MDPI, Basel, Switzerland. This article is an open access article distributed under the terms and conditions of the Creative Commons Attribution (CC BY) license (https://creativecommons.org/licenses/by/4.0/).
Share and Cite
Jin, K.; Zhang, L.; Zhang, Y.; Sun, D.; Zheng, X. A Network Traffic Intrusion Detection Method for Industrial Control Systems Based on Deep Learning. Electronics 2023, 12, 4329. https://doi.org/10.3390/electronics12204329
Jin K, Zhang L, Zhang Y, Sun D, Zheng X. A Network Traffic Intrusion Detection Method for Industrial Control Systems Based on Deep Learning. Electronics. 2023; 12(20):4329. https://doi.org/10.3390/electronics12204329
Chicago/Turabian StyleJin, Kai, Lei Zhang, Yujie Zhang, Duo Sun, and Xiaoyuan Zheng. 2023. "A Network Traffic Intrusion Detection Method for Industrial Control Systems Based on Deep Learning" Electronics 12, no. 20: 4329. https://doi.org/10.3390/electronics12204329