1. Introduction
The radio environment map (REM), which is a digital map that offers details on the radio frequency (RF) environment in a certain area, is made by employing RF sensors to find and examine signals from wireless devices, like Wi-Fi networks and cell towers. Along with information on interference and noise levels, it displays the location and strength of RF signals. This information is crucial for optimal performance, dependability, and interference-free operation of wireless equipment. The REM is crucial to many wireless systems, including Internet of Things (IoT) gadgets and autonomously driven automobiles. However, since the number of devices and data volumes continue to dramatically increase, the quick commercialization of fifth-generation (5G) technology poses substantial problems to current communication networks. Therefore, increasing the data rate remains a major requirement in cellular networks [
1]. Offering location-based services has received a lot of attention recently since they are believed to be the next step in contextual awareness, network management, customized information delivery, and healthcare monitoring [
2,
3,
4,
5,
6].
Reliable and optimized service coverage is crucial for accessing the RF spectrum, and accurate estimation of propagation path loss (PL) plays a vital role in achieving this. Various propagation models based on theory or experimentation have been reported in the literature to estimate the PL of signal coverage [
7]. Indoor and outdoor REMs are the two main divisions. An outdoor REM covers an outdoor area [
8], whereas an indoor REM is a digital map that offers details about the RF environment inside a building or structure [
9]. An indoor coverage map is used to help with indoor wireless communication system planning, design, and optimization in malls, hospitals, or office buildings. Network designers can create wireless networks that are more effective and efficient, arrange wireless devices optimally, and solve signal coverage and interference issues by using the indoor coverage map [
10].
One way to improve the utilization of radio resources is to use REMs for insights into the propagation environment and to help understand its characteristics [
11]. The REM can optimize wireless network deployment by identifying strong/weak signal coverage and interference, improving network efficiency and effectiveness [
12]. Meanwhile, the REM aids RF spectrum management by identifying high- and low-RF activity, leading to efficient spectrum resource allocation and interference avoidance [
13]. Furthermore, the REM can detect and locate unauthorized RF activity for security and emergency responses, and can be used for many things by detecting and evaluating the distribution of RF signals in a specific area, especially with the importance of localizing objects or devices in a particular context in today’s technological environment. According to measurements of the signal strength or other aspects of wireless signals, localization in the context of wireless communication systems often entails calculating the location of a mobile device or other wireless devices.
The localization process requires calculating an object’s coordinates inside a predetermined reference frame, such as its latitude, longitude, and height. In order to determine an object’s precise position, the localization process often gathers and interprets data from numerous sources. These sources may include wireless signals, such as a global positioning system (GPS) [
14], sensors [
15], Bluetooth [
16], Wi-Fi [
17], landmarks, or infrastructure. GPS-based localization is commonly used for outdoor positioning and relies on signals from satellites. By receiving signals from multiple satellites, a GPS can triangulate its position with high accuracy [
14]. For indoor environments, Wi-Fi-based localization is commonly used. It leverages Wi-Fi signals and access points (APs) strategically placed within the building to estimate the position of devices [
17]. By measuring the signal strength or utilizing fingerprinting techniques, a device’s indoor location can be determined. Bluetooth-based localization uses signals and beacons to determine the proximity and position of devices within a limited range. Bluetooth beacons are small devices that transmit signals, allowing other devices to detect their presence and estimate their location [
16]. RF identification (RFID)-based localization relies on tags and readers. RFID tags are attached to objects, and readers detect the tags to track and locate objects within a specific area [
18]. Sensor-based localization encompasses a range of sensors that are utilized by mobile robots and other devices to gather data, including motion. The primary objective is to determine the user’s location by analyzing motion, orientation, and visual surroundings [
15].
Vendors and companies have been inspired to create solutions that support the rising number of location-based services (LBSs). Indoor localization has applicability across several IoT sectors, whether as a core service or a complementary one. It is possible to aggregate and evaluate the locations of several users or objects by using ML algorithms and crowdsourcing data. Such expertise can improve the overall user experience, forecast human behavior for future planning, and avoid problems. The great potential of LBSs in IoT applications, including smart cities, healthcare, commerce, and security, is confirmed by market surveys. Incorporating an IPS into IoT settings makes it possible to develop creative, context-aware services that meet the various demands of users and promote IoT technology [
19].
IoT adoption is significantly challenged by cascade failures. To better understand these cascades, a new measure called IoT-oriented router betweenness has been created. The creation and testing of two models for global and local routing modalities were conducted. The results demonstrated that local routing is more reliable. Additionally, it was observed that longer router recovery periods increase cascade fluctuations, more gateways improve IoT reliability, and high-degree nodes as gateways increase network resilience [
20]. For instance, in a smart building IoT system, indoor positioning is vital for various services. A cascade failure scenario occurs when a critical router node responsible for managing location data fails, leading to disruptions in the indoor positioning system and affecting services, like climate control and security. This degradation can trigger failures in other building services, highlighting the need for robust network design and redundancy mechanisms. To improve device localization accuracy, a radio environment map (REM) can be used, comparing received signal strength with the stored signal strength map to estimate device locations accurately.
Indoor localization estimates the coordinates or relative positions of objects within a defined space and poses unique challenges and requirements [
21]. In industry, for indoor localization, Ekahau can be used. The Ekahau real-time location system (ERTLS) is used for indoor asset tracking via wireless networks. Overall, localization technologies play a crucial role in improving efficiency, enhancing user experiences, and enabling a wide range of location-based applications across various industries [
22].
Our main aim is to propose a new and improved method for indoor coverage map localization. We utilize received signal strength indicator (RSSI) values and an ML algorithm, leveraging real data collected from field strength measurements. The data were obtained using a robot named TurtleBot3 Burger in a room at the University of Ulsan, South Korea. We developed a methodology for constructing the REM, which is utilized to obtain a dataset for our ML-based approach to indoor localization. To achieve localization using the indoor coverage map’s synthetic data, we developed an ML-based scheme. By employing this framework, we create accurate indoor localization for the coverage map, and determine user locations in the area of interest.
The novelty of our approach is summarized as follows.
We propose an ML-based approach to obtain the indoor coverage map and accurately localize users by harnessing the potential of RSSI signals.
Construction of the REM is based on an ML scheme using a single AP to collect RSSI measurements from a mobile robot. This strategic approach enables operators to gain clear visibility into coverage prediction and identify potential shadow areas on the indoor REM. In our study, we focus on localization by leveraging a coverage prediction map specifically considering RSSI signals within an indoor environment of the University of Ulsan.
To construct the dataset used to train our ML algorithm for localization, the selection of each step is primarily based on a nearest neighbor search. Within each sample, we choose the first point randomly and then obtain eight nearest neighbors to determine the next step. This iterative process continues for K steps. By diligently following this procedure, we construct a single sample. This process is repeated until we reach the defined number of samples for the dataset.
We meticulously analyzed several prominent ML algorithms, namely the random forest regression [
23], decision tree regression [
24], extra-trees regression (ETR) [
21], AdaBoost regression [
25], etc. Through the rigorous application of the 10-fold cross-validation technique, we aim to identify the optimal regressor algorithm for our proposed approach by considering the localization error.
2. Related Work
Different models for locating a user in an indoor environment are available in the localization field, implementing methods such as the REM [
9]. First, we explore major research based on conventional statistical methods. Using RSSI parameters and neural network technology, Gadhgadhi et al. [
26] presented localization strategies. Two methods—the artificial neural network (ANN) and the decision tree—were used to compare the outcomes of the resulting location estimate. In the beginning, three inputs along with the ANN were used to estimate the position for each RSSI triplet and calculate the mean error value of overall positions acquired. Using a four-input ANN architecture, the same process estimated the location for each set of four inputs and determined the mean error value for the estimated position. In the study, they used neural networks to perform localization based on RSSI parameters. They compared the ANN and decision tree using an RSSI dataset from a previous study. The ANN with four inputs showed better accuracy and reduced computation, proving that increasing the number of sensors improves accuracy.
Low-precision indoor localization (LIL) and high-precision indoor localization (HIL), two Bluetooth-based techniques introduced by Wang et al. [
27] used RSSI data to define a limited region that corresponds to a specific position of the Bluetooth-enabled device. They discovered via their tests that HIL performs better than LIL in terms of accuracy in the majority of instances, mostly because of an additional data training phase. In conclusion, HIL provided better performance than LIL when implementing the extra data training phase was possible.
Based on the most recent research findings, Billa et al. [
28] presented a review paper with a thorough overview of many commonly used IPSs. The report goes into detail about their uses, accuracy, benefits, and drawbacks. It found that as system complexity and implementation costs grow, so does the accuracy. The performance of an IPS has been improved by researchers merging various systems, which resulted in the creation of hybrid models that provide effective IPS solutions. One survey examined several algorithms put forth for the online phase of fingerprinting technologies, including the most advanced Bluetooth version (Bluetooth Low Energy (BLE)), an ultrasonic indoor positioning system (UIPS), and indoor localization using ultra-wideband (UWB) technology. The merits and disadvantages of each algorithm are covered in detail, along with examples of how they could be used in different situations. The authors suggested that to obtain efficient outcomes, the algorithm that will be used must be well thought out.
Huang et al. [
29] proposed a self-training indoor localization system with non-line-of-sight (NLOS) mitigation. To infer pedestrian paths, the system makes use of data from maps, inertial sensors, and UWB transceivers. This technique enabled automated data collection, categorization, and learning by merging multisensory information. Weak labels for UWB data are created and repeatedly improved via self-training, which dramatically lowers the labor cost compared to conventional supervised learning techniques. Experimental results showed significant improvements in localization accuracy, NLOS range error reduction, and multi-base station localization under mixed LOS/NLOS circumstances. The work emphasized how self-training techniques may provide indoor localization and tracking with high precision at a cheap cost. In order to tackle larger-scale issues, the authors stated that future work requires enhancing experimental settings and gathering massive amounts of data through crowdsourcing. Moreover, to improve feature representation and model performance, the authors suggested that more investigation is required into advanced ML techniques like the gradient boosting decision tree, the convolutional neural network, and the minimax risk classifier. To further improve the localization system, the authors investigated the fusion of other RF signals like 5G, Wi-Fi, and Bluetooth as well as the inclusion of signal metrics like intensity, phase, and fingerprint.
Dargie et al. [
30] investigated the use of recursive estimation, which deals with the interior localization of mobile robots. The study explored several kinds of errors and explained the presumptions that underpin the estimating assignment. The two objectives of the estimation assignment are to: (1) align the mean of the estimated random component with the robot’s real position, and (2) reduce the variance (uncertainty) in the estimated random variable. The study emphasized that both prediction and measurement components are involved in recursive estimation strategies. The prediction component is stated abstractly in a Kalman filter, whereas it is expressed explicitly as a transition probability,
, in Bayesian estimation and particle filters. It was stressed that faults in the robot’s driving configuration, which are recorded as process defects in Kalman filter formulation, frequently impact the transition probability. It is important for an estimation assignment to note the importance of model parameters and the suitability of the statistics used to describe them. The research also shows how process, measurement, and prediction statistics may be established for two different sensing systems: the inertial measurement unit (IMU) and UWB.
Sadowski et al. [
31] investigated k-nearest neighbors (KNN) and naive Bayes, two memoryless methods coupled with trilateration, for their possible application in an indoor localization system. The methods were classified for accuracy, precision, and complexity in three rooms with varied amounts of interference during the tests. Three wireless technologies (Zigbee, BLE, and Wi-Fi) were used throughout the trials to verify the findings. According to the results, KNN with k = 4 outperformed all other localization algorithms in terms of accuracy and precision. Naive Bayes also performed well, but it needed more time to execute because it uses a database for its computations, giving it an
O(mn) complexity. Despite being the least efficient technique overall, trilateration had the best
O(1) complexity and needed the least amount of running time for position computations.
In the Android Pie mobile operating system, Han et al. [
32] proposed a LOS detection technique that focuses on Wi-Fi fine timing measurement (FTM). The support vector machine FTM algorithm (SVM-FTM) was created primarily to use multilateration techniques for indoor localization. A hypothesis test framework and the SVM are used to identify LOS signals, and multipath error is considered to distinguish between low and high-quality signals. In a sample size of 99, the average identification rate of high-quality signals was 92.4%, whereas in a sample size of 29, it was 78.3%. Localization performance significantly improved by a factor of 24.4 when using only high-quality signals in comparison to the ideal LOS detector. When compared to SVM-RSS, the suggested SVM-FTM LOS identification method showed an average gain in identification accuracy of 8.33% and a drop in localization root mean square error (RMSE) of 20.3%.
Fifth-generation commercial networks are currently being installed in large numbers in the mid-band, mostly in the Band n78 frequency range between 3.3 and 3.8 GHz. Garcia et al. [
33] proposed the extremely randomized trees regressor (ERTR) algorithm for forecasting the coverage of outdoor-to-indoor propagation in 5G mid-band operational networks. Following that, a REM is created to make it simpler to view the outcomes and find coverage gaps and traffic hotspots. This is accomplished using a collection of channel measurements from a Sapienza University building in Rome, Italy. Additionally, the ERTR-based strategy was evaluated using three error metrics: relative error, mean absolute error (MAE), and RMSE. The efficacy of five more ML regression algorithms was assessed for comparison, and the ERTR-based method outperformed the baseline schemes in all cases. Furthermore, the authors constructed a REM based on ERTR for outdoor environments [
33]. Specifically, the authors utilized actual measurement data from Ikoyi, Lagos, and Victoria Island, Nigeria.
Garcia et al. [
34] proposed the construction of a REM and coverage prediction for 5G networks in band n78. They proposed a novel approach using the ERTR algorithm to predict outdoor-to-indoor coverage for 5G mid-band networks. The results showed that the proposed ERTR technique outperformed other machine learning regression algorithms, enhancing the accuracy of coverage prediction in various scenarios. Additionally, the performance of five ML-based schemes (RF, KNN, Ridge, DT, and Bagging) was studied to evaluate the proposed ERTR system model. Their proposed scheme outperformed the benchmark methods in terms of relative error, MAE, and RMSE with 10-fold cross-validation. Moreover, the constructed REM validated the superiority of the ERTR algorithm in identifying favorable propagation conditions and potential shadow areas. The authors concluded that the proposed ERTR method outperformed the baseline schemes in all error metrics and with lower computational complexity.
In [
35], the authors used Wi-Fi and GPS by Samsung Galaxy Grand Prime smartphones for a hybrid outdoor localization scheme at Harbin Institute of Technology, Shenzhen Graduate School, China, which is comparatively more complex than our system model. In [
36], the authors considered two experimental areas: one is a 45-m by 37-m area where the grid size is 4 × 20, and another is a 75-m by 3-m area where the grid size is 2 × 60, for collecting data by a Samsung Galaxy Note 8 smartphone. In [
37], the authors considered an environment, which is the Science Building 701 room and a 7th-floor corridor at National Chung Hsing University, and a Bluetooth signal has been used and collected by a smartphone named ASUS Zenfone 5 T00F A500CG. In [
38], the authors considered the use of machine learning approaches, including k-nearest neighbor (k-NN), a rules-based classifier, and random forest, to estimate indoor location using an RSSI-based fingerprinting method in the area of the second floor of the CEI building of UWindsor in Canada and collected data through the RN-131-EK Wi-Fi board. Refs. [
36,
37,
38] considered multiple access points, which is the main cause of the high complexity compared to our system model. Moreover, Refs. [
36,
37] used the Kalman filter, which has considerably higher computational complexity [
39]. In [
38], the random forest classifier has been used, which is a complex model suited for scenarios where accuracy is critical, particularly in indoor environments with 86 access points. The computational complexity is higher than the extra-trees regressor, which will be discussed in the Computational Complexity Analysis subsection in
Section 6. We used an extra-trees regressor for our system model with a mobile robot for data collection in the area of a third building at the University of Ulsan, South Korea. Our system model operates effectively with just one access point, making it suitable for scenarios with limited resources or simpler Wi-Fi setups. With 600 samples, extra-trees regression provides accurate predictions for indoor localization while requiring fewer computational resources.
Table 1 summarizes a comparative analysis of our proposed ETR-based scheme against state-of-the-art methods.
As per our understanding, there is no research paper regarding the specific approach of utilizing the user’s steps for localization based on REM construction that has been mentioned previously. To evaluate REM construction, three error matrices are used: RMSE,
, and MAE. Moreover, motivated by the benefits of the ETR in providing high accuracy when predicting coverage for both outdoor [
33] and indoor environments [
34]. This paper proposes a novel approach based on the ETR and nearest neighbors techniques for indoor localization. Furthermore, for this purpose, we construct a REM of the area of interest by applying the ETR algorithm. In addition, we focus on studying ML regression algorithms like decision tree regression and the support vector regressor to compute the coverage map and evaluate the localization techniques by using 10-fold cross-validation with a distance evaluation metric.
The rest of the paper is structured as follows.
Section 3 contains a description of the measurement and proposed methodology. In
Section 4, we included a broad description of several regression techniques. The error matrices with appropriate graphical explanations regarding the hyperparameter tuning are presented in the numerical results and also include some graphical results of REM building in
Section 5.
Section 6 narrates the conclusions of our paper.
3. Measurement and Proposed Methodology
3.1. Measurement Methodology
This section provides a detailed explanation of the experimental data collection and configuration process used to acquire measured data for indoor localization and constructing a REM. The focus is on discussing the mobile robot utilized in the study and the methods employed for data collection.
A mobile robot is a versatile system utilized in various industries to enhance productivity and perform tasks efficiently. It is highly functional, with a sensor that is very accurate, navigational systems, and decision-making algorithms, along with its feature of free movement and completion of tasks in an accurate manner.
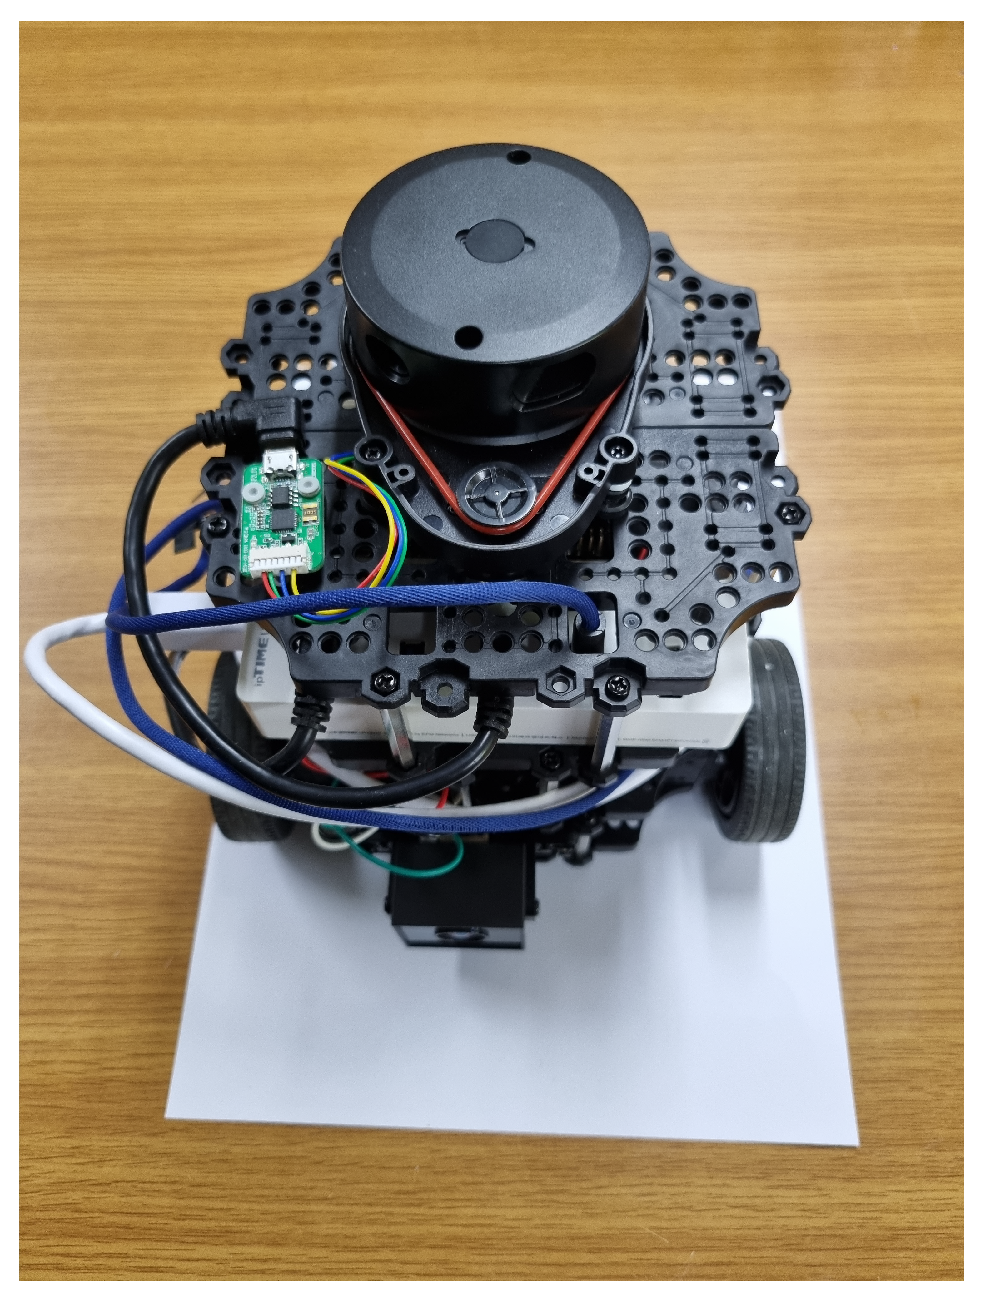
In our experiment, we employed TurtleBot3 Burger [
40] as the mobile robot, which is shown in
Figure 1. This robot consists of several essential components, including a single-board computer (SBC), an embedded controller, the LDS-02 360 laser distance sensor, an IMU sensor, an encoder, and the robot operating system (ROS). The SBC, powered by Raspberry Pi, allows for algorithm configuration within a Linux environment. ROS, an open-source meta-operating system for robots, facilitates seamless communication between different processes. The embedded controller, utilizing OpenCR, takes on the primary responsibility of controlling the robot’s movement and utilizing the array of sensors. The LDS-02 accurately measures the time it takes to reflect the laser pulses emitted, enabling precise position estimation by calculating the position of the reflector. Additionally, the DYNAMIXEL encoder provides electrical signals that offer position and speed information for both rotary and linear motion.
These integrated components empower the mobile robot to navigate its surroundings, make informed calculations, and efficiently execute tasks. With the help of the mobile robot, around 7000 data points were collected to create a simple view of the room under study at the University of Ulsan, where the length, width, and height are approximately 11 m, 7 m, and 2.5 m, respectively. We employed the entire dataset to generate the radio environment map, which provided predicted RSSI values utilized in the localization process. Specifically, our localization model was constructed using a total of 600 RSSI predicted samples, which is analyzed in
Section 5. In
Figure 2, a 2D visual representation of the floor plan shows where an AP was located and illustrates the layout used for collecting measurements.
The experimental data collection process involved obtaining RSSI data using the built-in Wi-Fi module of Raspberry Pi. The iwconfig command line tool displays information about the wireless network interface, including SSID, signal frequency, quality, and strength. The encoder and IMU sensor data merge with LiDAR data to create ROS odometry. RSSI and location estimation data are collected separately using a shell script in Linux and synchronized using timestamps.
The merging process synchronizing the two data sets ensures the data are collected simultaneously while the mobile robot is in operation, and ensures that RSSI and localization data align correctly.
The localization of indoor REM data utilized in this paper consisted of X and Y coordinates, along with corresponding RSSI values. Localization data play a crucial role in navigation and location-based services, enabling precise determination of the robot’s physical position. The experiment used the integrated LiDAR and Wi-Fi interface in TurtleBot3 Burger to collect both localization data and RSSI values.
3.2. General Overview of Proposed Methodology
Our proposed method conducts REM localization by initially using the x- and y-axis values as features along with signal values as labels for REM construction. We employed various regression techniques to our dataset where the ETR yielded excellent results compared to the others. Our primary focus in this paper is on localization where we utilize the user’s steps in conjunction with RSSIs taken from the REM which were evaluated using regression algorithms.
The ETR is a supervised learning algorithm that relies on training on a labeled dataset containing input features and corresponding target values. Specifically, the ETR algorithm uses the input features to predict a continuous target variable. This algorithm proves particularly valuable when dealing with complex regression problems.
In our system model, we utilize RSSI signals to generate the coverage map, which is subsequently employed to construct our proposed ML-based framework for indoor localization. RSSI values provide insights into signal quality and are applied in tasks such as network planning, signal mapping, and device localization [
41]. Our experiment primarily focuses on utilizing Wi-Fi technology to obtain RSSI measurements.
3.3. Dataset Construction
We collected the data using the mobile robot, ensuring it encompassed a wide range of data types. This dataset was carefully selected to meet our specific requirements for localization and the construction of the indoor REM. The colored path in
Figure 3 shows the path direction of the mobile robot, where the start point is near the access point. The start point is colored red because the access point is located in that place. The values corresponding to the
x-axis and
y-axis were designated as features and RSSI as labels in order to create the coverage map.
Next, we pre-processed the data by employing training and testing datasets split for error evaluation. The ML algorithm was used for the prediction of RSSI values, as illustrated in
Figure 4 to establish a grid construction that covers the area of interest with a uniform interval. Then, by applying the ML algorithm, the RSSI values were predicted at each point on the grid for a graphical image of REM. Subsequently, we compared various regression algorithms to generate the 2D floor plan of REM, employing advanced techniques to ensure accurate modeling.
For localization, we utilized the already constructed REM based on RSSI signals as features, while the
x- and
y-axis values were used as labels. The data were then organized by associating the RSSI values with the REM. Our proposed approach to construct the dataset is based on the 8-nearest neighbors scheme illustrated in
Figure 5. The dataset is composed of multiple steps from the REM, where each step contains the RSSI value and the corresponding position
to identify the user’s location. A sample in the dataset represents a collection of
K steps. For example, the first sample includes features
and the position of the final step serves as the target position to be predicted
. The selection of each step is based on the nearest neighbor search. In each sample, the first point is randomly selected. Then, eight nearest neighbors are obtained. From these neighbors, the second point is randomly chosen. This process continues by obtaining eight nearest neighbors for the second point and randomly selecting the third point from these neighbors. This iterative process was repeated until
K steps were obtained, forming one sample. The final dataset was created by collecting multiple samples. We gathered 1000 samples to obtain a broad range of paths and user locations.
Following the above process, we trained ML algorithms and assessed the performance of our system model employing 10-fold cross-validation.
The dataset for the indoor localization scheme using 8-nearest neighbors is presented in
Figure 6. Each line corresponds to a single sample from the dataset, wherein a sample comprises a collection of several users’ steps. Within our system model, we meticulously incorporated a total of 600 samples, with each sample encompassing 8 distinct steps. By following this rigorous procedure, the dataset was meticulously prepared to facilitate the process of indoor localization.
3.4. ETR Framework for Indoor Localization
There are numerous supervised classification techniques available, including ensemble learning methods, among which random forest and the ETR have gained significant popularity as effective approaches to addressing supervised classification and regression problems. The methods harness the collective strength of multiple models to enhance performance [
21]. These algorithms create independent base learners through the utilization of various training algorithms and by introducing randomization during the tree construction process. The incorporation of randomization techniques promotes greater tree diversity, leading to reduced correlation among the trees and improved independence. However, the construction of ensembles can present computational challenges, especially when dealing with large datasets. To overcome this issue, the focus has shifted towards the faster ETR algorithm [
33,
34]. In this research paper, we propose an ETR that presents an innovative approach to predicting indoor localization. The ETR algorithm combines predictions from individual trees, with each tree constructed using the entire training dataset. It employs a top-down learning approach, starting from the root node and subsequently traversing branches and child nodes. Setting itself apart from the random forest technique, the ETR incorporates two distinctive characteristics: the random selection of feature subsets for each tree and the random selection of splitting values.
Comprising a multitude of individual decision trees, the ETR utilizes the complete training dataset for each tree. Several decision tree regressors consist of interconnected root, child, and leaf nodes, forming the hierarchical structure depicted in
Figure 7. which is composed of M decision tree regressors. The ETR algorithm initiates at the root node and progressively determines split rules by leveraging a randomized subset of features and a partially random cut point in each decision tree regressor. This iterative process is perpetuated at each subsequent child node until the traversal reaches a leaf node, encapsulating the decision-making process within the decision tree.
Formally, given a training dataset,
, where
n takes values from 1 to N samples and
represents a
-dimensional vector composed of
K features and two target values to be predicted, the ETR algorithm generates
M independent decision trees. Within each decision tree, subset
of training dataset
X is assigned to each child node
r. At each node
r, the ETR algorithm selects the optimal split based on training subset
and a random subset of features, following the algorithm outlined in Algorithm 1.
| Algorithm 1: Selection of the split rule in the ETR-based scheme. |
1. Input: training subset K-dimensional vector made from sample numerous attributes selected randomly node to be split as required at the minimum number of samples 2. If or the node has a label for each observation it contains. When splitting is complete, classify the node as a leaf node. 3. Else Choose a random subset of G features from among the original K features. 4. For each feature g in the subgroup Do: Find , and as the higher and lower rates of feature g in subset . Obtain a random cut-point, , uniformly in the range Set End for 5. Select a split such that 6. Output: Best split at child node r. |
To elaborate, subset at child node r is divided into two sets: , comprising the samples that satisfy the split rule, and , consisting of the remaining training samples. The selection of the best-split MSE is used as a scoring function. This process is repeated at each child node until it reaches the minimum number of samples required for splitting , or until all the samples in subset possess the same label. Finally, the label of the samples in subset represents each leaf node. During the testing phase, a test sample progresses through each decision tree and traverses each child node. The best splits guide the test sample toward either the left or right child node until it arrives at a leaf node.
5. Numerical Results
In this section, we provide a detailed description of the performance of the proposed approach and the process of hyperparameter tuning. Additionally, we present graphical representations comparing the model’s performance using different regression techniques. To evaluate the performance of REM construction, we employ various error metrics, including RMSE, MAE, and
, and present the results in
Table 2. Furthermore, we assess the accuracy of indoor localization using location error measurements.
5.1. Model Evaluation for the REM Construction
In this subsection, we provide a detailed description of the error metrics used to evaluate REM construction. As described in
Section 3.1. The dataset collected by the mobile robot is used to construct the REM. The features in the dataset correspond to positions with coordinates x and y, measured in meters, while the target value is the RSSI measured in dBm.
A measurement that quantifies the average error of the estimates is the MAE. The true RSSI value is denoted as
, while the predicted RSSI value is denoted as
, obtained through regression techniques. To determine how well the predictions match the actual values, MAE calculates the absolute difference between the true value
and the corresponding predicted measure of the RSSI value
[
44]. Then, MAE can be expressed by
where
N is the total number of data samples. Note that the true RSSI and predicted RSSI values were converted from dBm to mW for the evaluation of each error metric. Subsequently, the results obtained in mW were converted to dBm. As a result, the error metrics MAE and RMSE are presented in dBm.
The square root of the average of the squared discrepancies between predicted RSSI values
and corresponding actual observations
is used to calculate the root mean square error, a metric that measures the error rate. RMSE gives an indication of how well predictions reflect the actual numbers calculated by:
For Equations (1) and (2), the performance of the system model will be considered good if the result is lower, whereas
is totally opposite; it is good when the
result is higher:
where
is the average target value.
The numerator of the second term is the mean error determined by the sum of squares of the residual prediction errors, and the denominator is the variance [
45,
46]. The fundamental goal of the
score is to quantify how much of the variation in the target-dependent variable is predictable by the independent variables in a regression model. The score has no lower range (indicating that forecasts can be severely erroneous) and an upper bound of 1, which denotes a fully accurate prediction. When the score is close to 0, it may be compared to making a random estimate about the mean
. According to the described equation, all of them will analyze a comprehensive evaluation of the system model’s performance because each statistic distinguishes different aspects of the model’s correctness and data fit.
First, we evaluate the REM construction based on RMSE,
, and MAE.
Table 2 shows the performance from REM construction, which can be evaluated based on the errors obtained for different regression techniques. We can see that the proposed ETR-based scheme achieved the lowest error among the comparative schemes, followed by random forest and the bagging regressor. However, support vector regression and AdaBoost regression models showed higher errors, suggesting comparatively poorer performance in this specific scenario.
Figure 8a,b illustrate how the algorithm’s training and prediction times vary with the number of samples needed to create REM. This analysis involved the use of different methods such as ETR, random forest, bagging, and SVR. The
x-axis represents the total number of samples in the dataset used for the 10-fold cross-validation scheme. In each fold, 90% of the total samples are allocated for training, while the remaining 10% are reserved for testing. The presented results are the averages obtained from multiple repetitions of the 10-fold cross-validation scheme, with data shuffling performed in each repetition. These figures serve as a performance indicator for the regression models. The findings from
Figure 8 are clear: as the number of samples increases, the training and prediction times also increase. Notably, ensemble learning methods exhibit a lower computational burden compared to SVR, which demands the most extended time for both training and prediction. It is worth noting that these computations were conducted on a PC equipped with an MD Ryzen 5 5600X CPU and 32 GB of RAM.
Additionally, the performance comparison of the proposed ETR-based scheme with multiple regression techniques for constructing the REM is visually represented in
Figure 9 using a bar graph. The data used in
Figure 9 are derived from
Table 2.
5.2. Model Evaluation for Localization Prediction
We provide a detailed description of the error metric used to evaluate the ML-based approach, as well as an explanation of hyperparameter tuning for indoor localization. The dataset used to evaluate the performance of the indoor localization approach is described in
Section 3.3. In this dataset, the features consist of RSSI values, and the target values correspond to the user’s position, with coordinates x and y measured in meters.
To evaluate the performance of the algorithms for indoor localization, we rely on the Euclidean distance between the true location, denoted as
and the predicted location, denoted as
, both represented as two-dimensional points in the Cartesian coordinate system. Then, the location error is defined as follows:
where
is the operator to calculate the Euclidean distance between two locations, and
N is the total number of data samples.
We evaluated the performance of the proposed ETR-based scheme for indoor localization using the location error in Equation (
4). The location error is the Euclidean distance, where the coordinates of the position are given by the coordinates on the
x and
y-axis and are measured in meters. The proposed scheme used
K features and two labels to implement indoor localization. Then, we employed two ML-based regressors to handle the two target variables. Each ML regressor takes as features the RSSI values obtained in
K steps, denoted as
, and predicts the corresponding target value. The first ML model predicts the position of the final
K-th step in the
x-coordinate, while the second ML model predicts the position in the
y-coordinate. We evaluated the algorithm’s performance by using the location error described in Equation (
4). Multiple regression techniques were used for the selection and comparison of the algorithm’s performance as well.
This paper presents various figures showcasing the utilization of the parameters, max depth, and number of estimators in different regression algorithms. Fine-tuning of hyperparameters was performed to achieve optimal system performance. In
Figure 10, we conducted location error calculations employing a range of estimators, spanning from 20 to 200, along with 600 sample data. These calculations were executed through 10-fold cross-validation using various regression techniques, where 90% of the data constituted the training set and the remaining 10% comprised the testing set. This visual representation clearly demonstrates the superior performance of the ETR compared to other regression techniques. Notably, at 140 estimators, the ETR still exhibited a lower error rate, with the rate remaining the lowest thereafter.
Figure 11 compares the location error versus maximum depth for the ETR, random forest, and decision tree regressors. Once again, the ETR demonstrated better performance. The error gradually decreased after a max depth of 15, reaching the lowest error rate at 40.
Simulations were conducted for the significance of the number of samples to determine the behavior of the ML-based regressor from different dataset sizes.
Figure 12 illustrates the location error versus the number of samples of the dataset used for indoor localization. We can observe that the proposed ETR-based scheme outperforms the comparative methods, including the random forest algorithm proposed in [
37]. An array of regressors, including the ETR and random forest regression, bagging regression, AdaBoost regression, support vector regression, artificial neural network, and decision trees regressors, were employed to compare their performance. We can see that the lowest error is achieved with a sample size of 600 and remains stable for larger datasets in the proposed ETR-based scheme. The lower error achieved by the ETR scheme compared to the random forest is attributed to a higher level of randomization during tree growth, which reduces the variance. Furthermore, as the entire dataset is utilized for each individual regressor tree, the proposed approach also mitigates bias in contrast to the random forest [
21].
Figure 13a,b depict the training time and prediction time of the considered algorithm in relation to the number of samples in the dataset for indoor localization. Various techniques, including ETR, random forest, bagging, ANN, and SVR, were employed in this investigation. We observe that extra-trees regression (ETR) exhibits the shortest training time and prediction time among the compared ML-based schemes. The
x-axis represents the total number of samples in the dataset used for the 10-fold cross-validation scheme. In each fold, 90% of the total samples are allocated for training, with their training time reported in
Figure 13a, while the remaining 10% are reserved for testing, and their prediction time is reported in
Figure 13b. In terms of computational time for training, the second-best model is the AdaBoost Regressor, followed by the ANN. Regarding prediction time, the second-best model is the Random Forest, followed by the AdaBoost Regressor. In our system model, ETR emerged as the standout performer in both training and predicting times among the regression techniques we tested. It exhibited efficiency, making it the preferred choice for scenarios where rapid predictions are essential.
Next, we evaluate localization performance in indoor environments by using a cumulative distribution function (CDF) graph in
Figure 14. The graph provides an insightful performance comparison among the various regression techniques used in the study, namely the ETR and decision tree, random forest, AdaBoost, bagging, support vector regression, and artificial neural network. Upon analyzing the CDF graph, we can see that the proposed ETR outperformed the other regression methods in terms of localization accuracy. This implies that the ETR-based algorithm consistently provided more precise estimations of user locations.
In conclusion, the best parameters for our proposed ETR-based model were selected by fine-tuning the hyperparameters of ML-based regressors, and the ETR showed better performance than the compared algorithms.
5.3. Computational Complexity Analysis
The computational complexity of the proposed ETR-based approach and the random forest regressor and bagging regressor comparison systems are examined in this subsection. The results show the number of regression trees, the number of features, the number of samples, and the maximum depth of the trees affect the computational complexity of the proposed ETR. In further detail, may be used to approximate the computational complexity of the ETR, where V denotes the number of trees, K is the number of features, P is the number of training samples, and is the maximum tree depth. When choosing the optimal split in our simulations, we considered and the maximum tree depth to be .
The computational complexity of the random forest regressor is similarly determined by
[
47]. Nevertheless, compared to the random forest regressor, the ETR takes less time to compute since it employs a random threshold rather than trying to find the best practicable threshold to split the data at each node. For the bagging regressor, the computational complexity can be expressed by
[
47] where
is the total number of base regressors, and
is the computational difficulty of training a base regressor. We utilized the decision tree regressor, which has a complexity of
, as the basis estimator in our simulations.
An important component of the study is the algorithm complexity of the suggested extra-trees regression (ETR) indoor localization method. It is a decision tree-based technique that divides the dataset into smaller groups repeatedly and fits a regression model to each smaller subset. The algorithm’s added randomization makes it typically quicker than conventional decision trees, but its complexity is still dependent on the quantity of data points, the number of features, and the depth of the trees [
33].
The complexity of the ETR algorithm has direct implications for real-time positioning. In a real-time positioning system, low latency is crucial. The more complex the algorithm, the more time it may take to process the received RSSI data and estimate the user’s position. Additionally, complex machine learning algorithms may demand more computational resources, including CPU and memory. This can be a limiting factor for real-time positioning on resource-constrained devices or in a real-time system with multiple users [
48].
The study addressed the complexity concern by conducting parameter tuning using 10-fold cross-validation. This optimization step aimed to find the best set of hyperparameters for ETR, balancing accuracy and processing speed. The study also compared the ETR algorithm with other machine learning regression algorithms, including random forest regression and decision tree regression. This comparison helped in understanding how the complexity of ETR affects its performance relative to other techniques. To evaluate the real-time positioning accuracy, the study used error metrics such as root mean square error, absolute error, and r-square error. These metrics help assess the trade-offs between complexity and accuracy. The results of the study demonstrated that the ETR algorithm achieved the best performance among the evaluated techniques. The study also showed that the complexity of the ETR algorithm can be managed effectively through parameter tuning and comparative analysis. This makes ETR a suitable algorithm for real-time indoor localization.
Although machine learning methods, like extra-trees regression, can make accurate predictions, they have inherent drawbacks. It can be susceptible to overfitting, particularly when working with small datasets. In addition, these models lack transparency and interpretability, which can be a drawback in scenarios where understanding the decision-making process is crucial. Furthermore, the quest for optimal hyperparameters in extra-trees regression can be a challenging and computationally intensive task. Addressing these limitations often necessitates meticulous data preprocessing, hyperparameter tuning, and consideration of alternative algorithms tailored to the specific problem at hand [
49,
50].
While our system model has shown promising results, it is essential to acknowledge its limitations. Firstly, the use of a relatively small dataset for localization, derived from the predicted values of REM construction, might not fully capture the complexity and variability of real-world scenarios. This limitation could impact the model’s ability to generalize accurately to diverse localization situations. Secondly, the reliance on the extra-trees regressor, while efficient and effective in many cases, might not be the optimal choice for all possible scenarios. Different algorithms could yield better performance depending on the specific characteristics of the data and the problem at hand. Additionally, the limited number of features used in both REM construction and localization tasks may not encompass all relevant information, potentially leading to information loss and reduced model performance. Addressing these limitations could involve acquiring larger and more diverse datasets, exploring alternative machine learning algorithms, and considering the inclusion of additional features to enhance the model’s accuracy and versatility.
5.4. Graphical Results of REM Construction
Using several regression algorithms, this section uses a graphical depiction of the REM. A grid of 50 × 50 points was created covering the whole area of interest and populated with RSSI-predicted values obtained from the trained regression algorithms, spanning the region of interest.
Upon examining
Figure 15, which depicts coverage prediction maps for the RSSI target value on 2D maps, we can discern the outcomes yielded by our proposed ETR-based algorithm, as well as random forest, decision tree, and bagging regressors. We observe from
Figure 15b–d that the random forest regressor, the decision tree regressor, and the bagging regressor exhibited abrupt changes in the RSSI values across the REM, rendering it challenging to identify critical points where the signal strength experienced a decline. Consequently, the reliability of the coverage prediction is compromised. In contrast, the REM generated by the ETR algorithm displays a tendency to offer more generalized prediction points, enabling a gradual depiction of degradation in signal strength without abrupt transitions in
Figure 15a. This characteristic of the ETR allows for better discernment of the quality of signal reception, enabling the identification of areas with satisfactory reception as well as shadow areas. It is crucial to highlight that a variety of factors, including the quality and quantity of training data, the method used to create the maps, and the complexity of the environment being mapped, affect how well REMs created using ML techniques perform.


