
Analysis of Control Strategy of Arc Plasma Power Supply Inverter Module


Abstract
:1. Introduction
2. Arc Plasma Power Supply Main Circuit
3. Control Strategy for the Inverter Module
3.1. Main Control Modes of the Inverter Module
3.2. Main Modulation Methods of the Inverter Module
3.3. Simulation of the Inverter Module
4. Results and Analysis
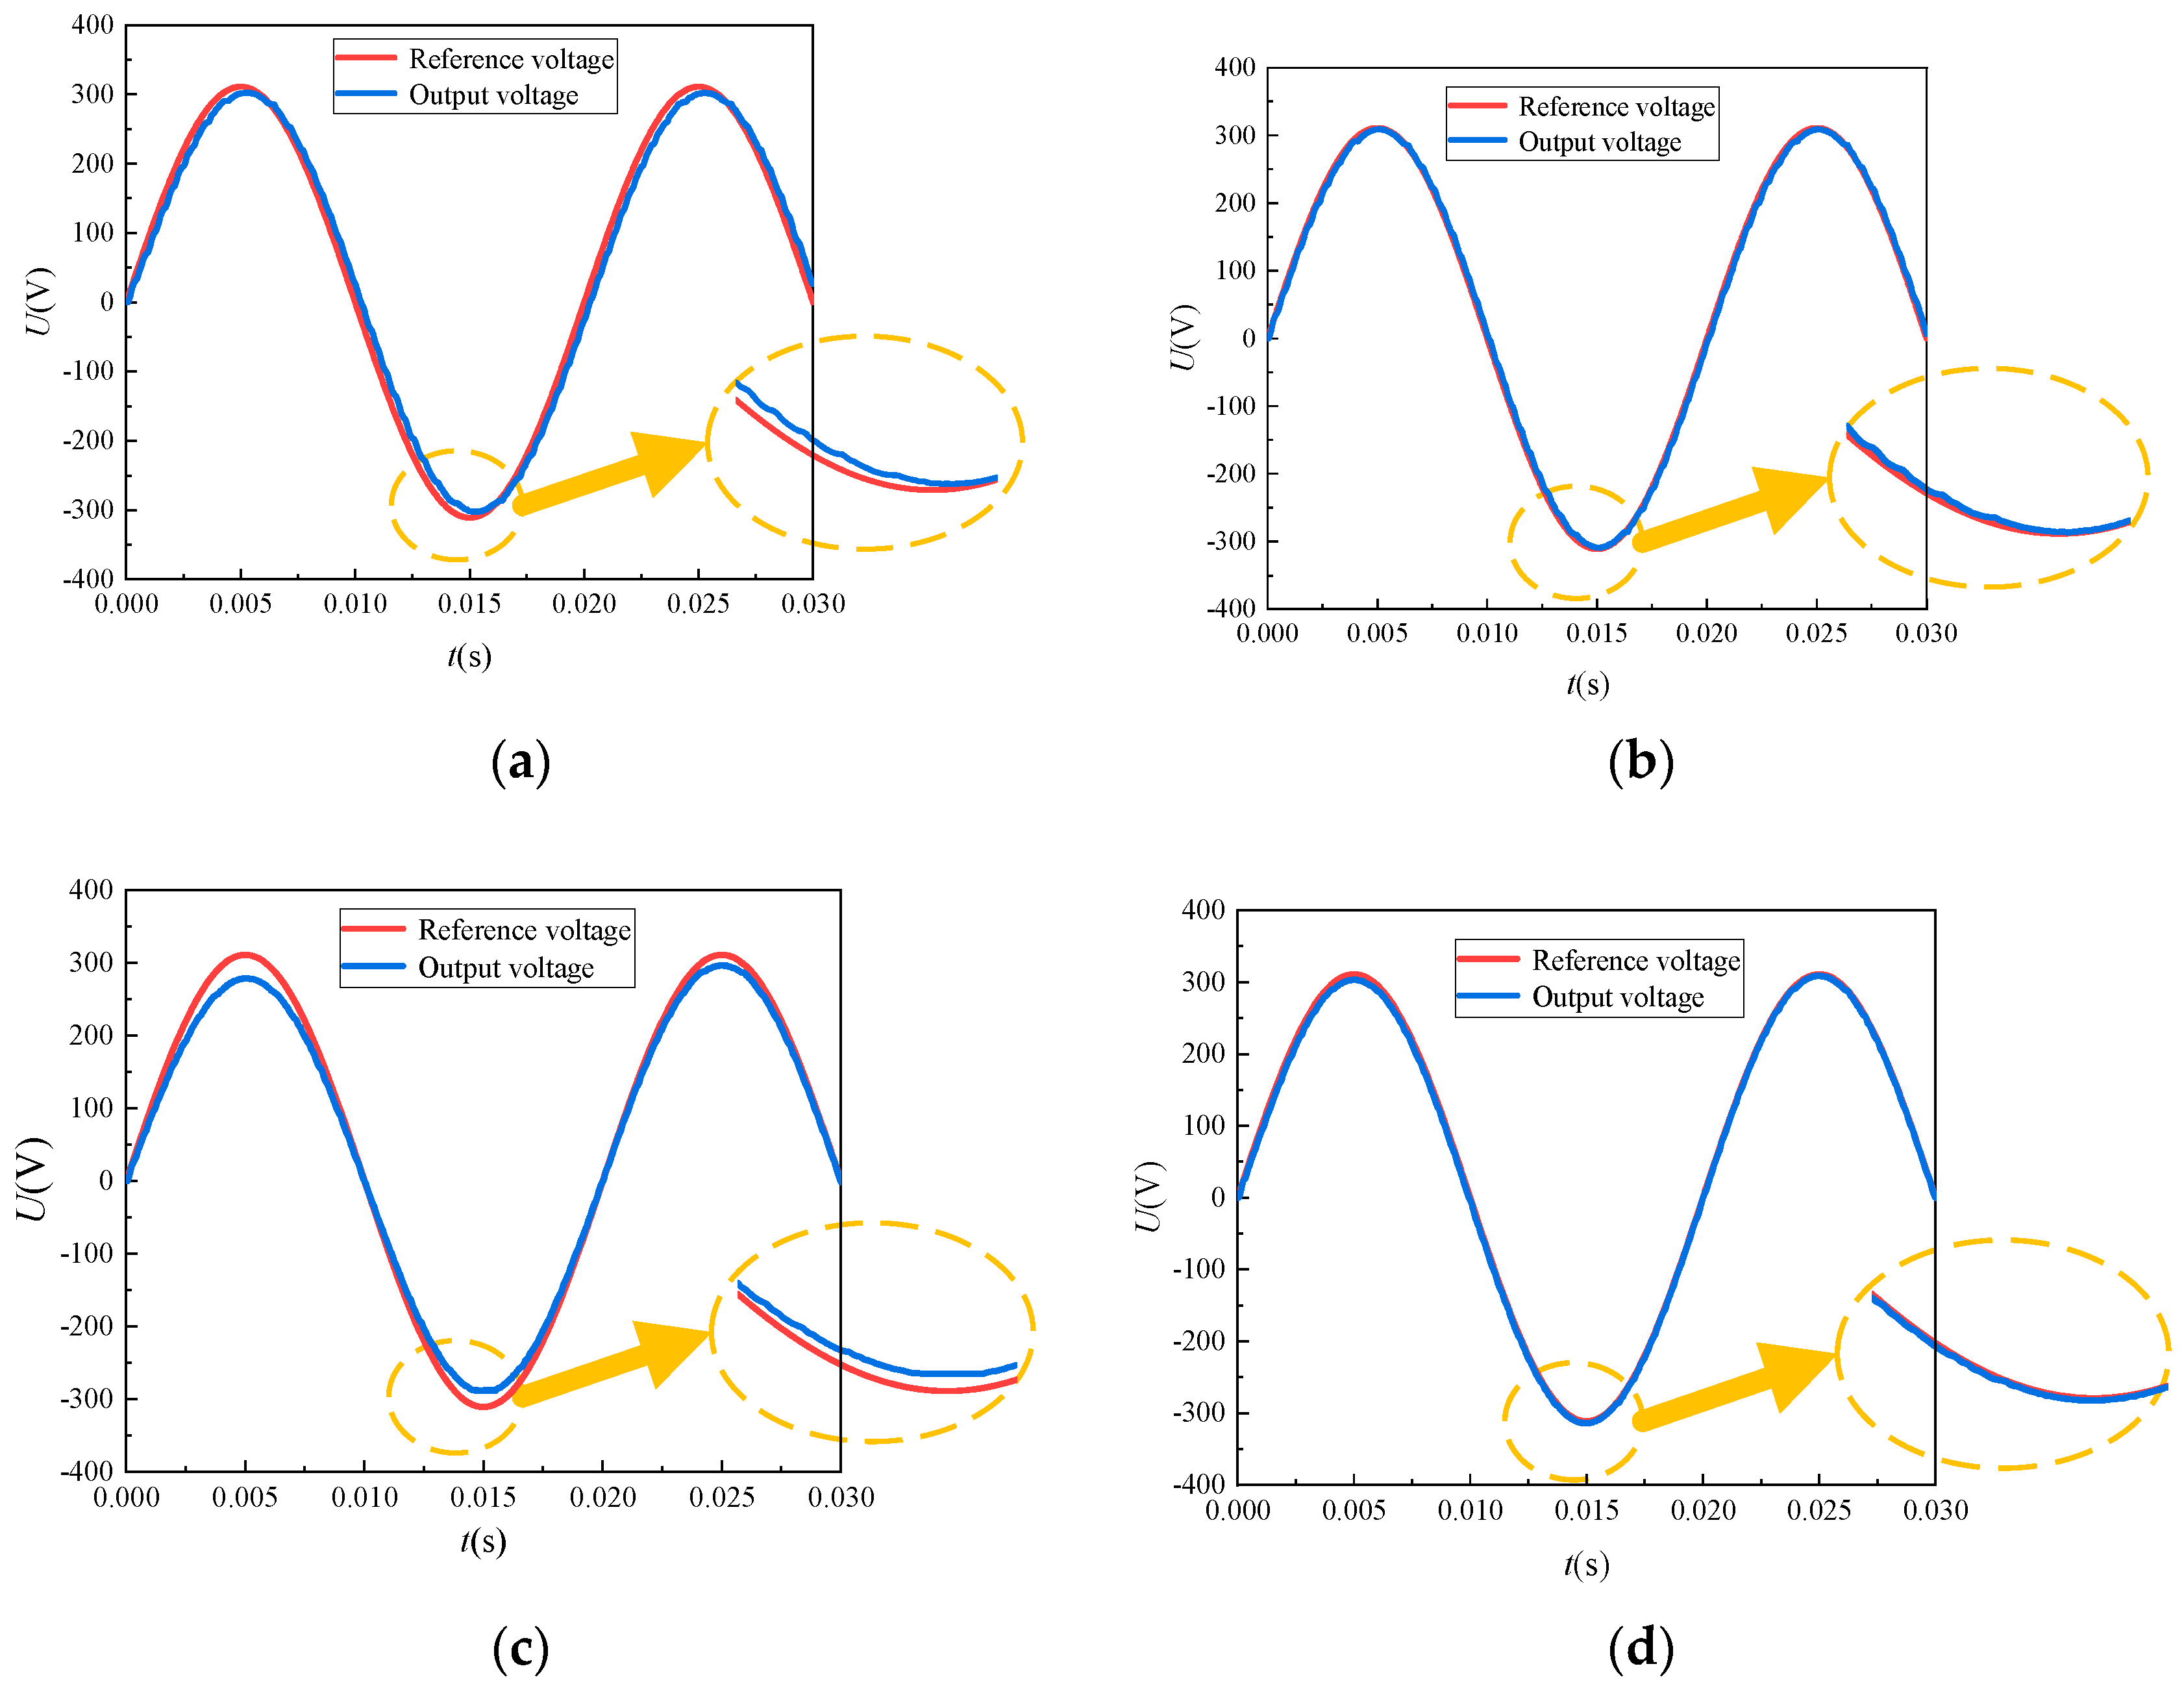
4.1. Main Control Strategies of the Inverter Module
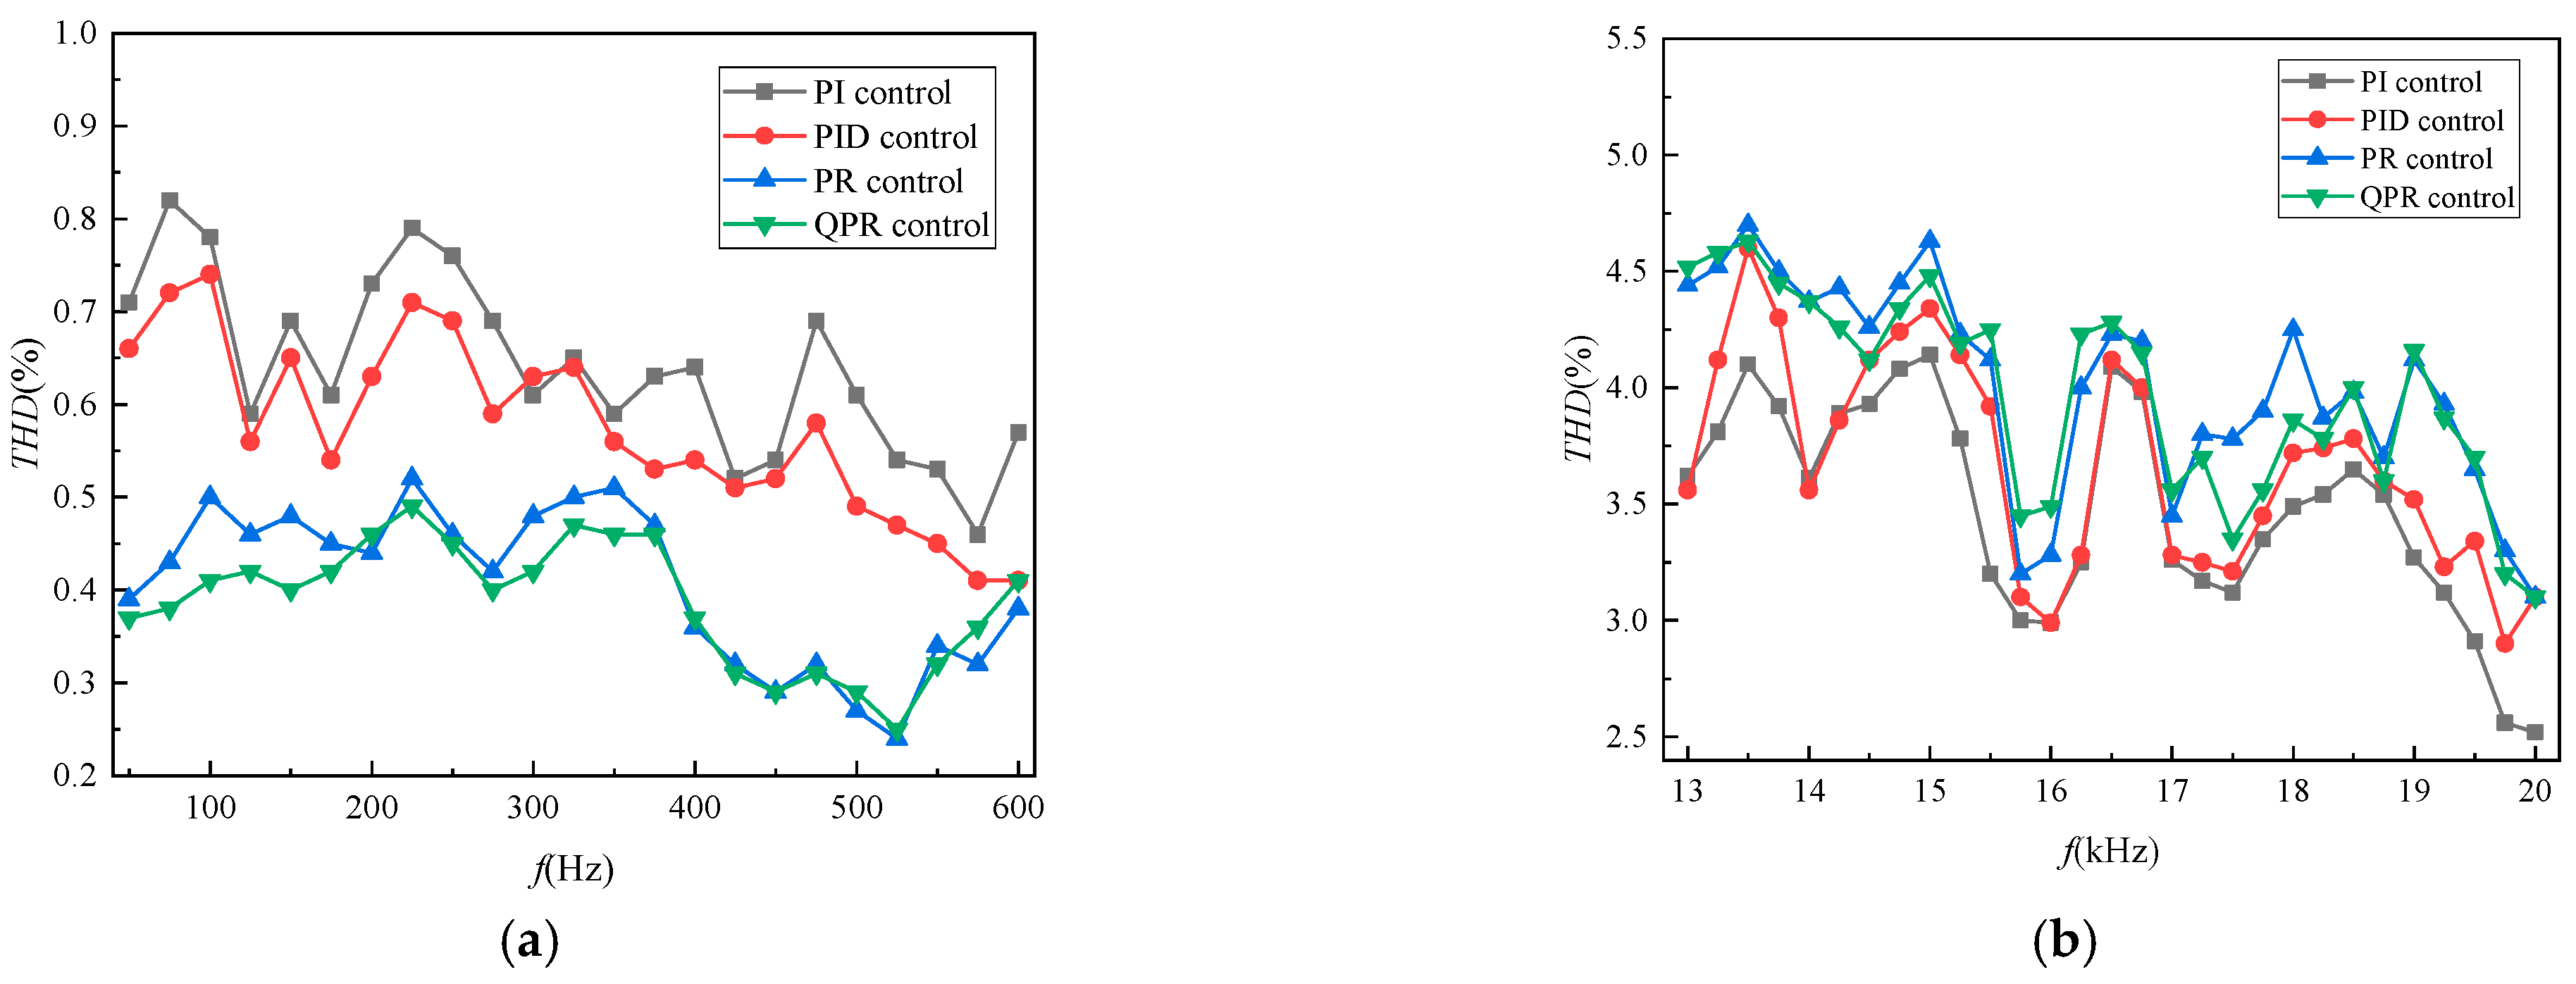
4.2. Influence of the Control Method
5. Conclusions
Author Contributions
Funding
Data Availability Statement
Conflicts of Interest
References
- Li, J.; Liu, K.; Yan, S.; Li, Y.; Han, D. Application of thermal plasma technology for the treatment of solid wastes in China. Waste Manag. 2016, 58, 260–269. [Google Scholar] [CrossRef] [PubMed]
- Bhatt, K.P.; Patel, S.; Upadhyay, D.S.; Patel, R.N. A critical review on solid waste treatment using plasma pyrolysis technology. Chem. Eng. Process. 2022, 177, 108989. [Google Scholar] [CrossRef]
- Dovilė, G.; Mindaugas, A.; Andrius, T. Recent Advances in Renewable Energy Technologies; Academic Press: Cambridge, MA, USA, 2022; Chapter 4. [Google Scholar]
- Zhou, F.; Ma, H.D.; Chen, H.; Zhu, X.; Liu, X. Research progress of AC arc plasma torch and its application. J. Aerodyn. 2022, 40, 15–29. [Google Scholar] [CrossRef]
- Zhou, G.; Xu, J. A Comprehensive Review of Switching Converter Modulation and Control Techniques. Chin. J. Electr. Eng. 2014, 34, 815–831. [Google Scholar]
- Mattavelli, P. An improved deadbeat control for UPS using disturbance observers. IEEE Trans. Ind. Electron. 2005, 52, 206–212. [Google Scholar] [CrossRef]
- Blaabjerg, F.; Teodorescu, R.; Liserre, M.; Timbus, A.V. Overview of control and grid synchronization for distributed power generation systems. IEEE Trans. Ind. Electron. 2006, 53, 1398–1409. [Google Scholar] [CrossRef]
- Cortes, P.; Ortiz, G.; Yuz, J.I.; Rodriguez, J.; Vazquez, S.; Franquelo, L.G. Model predictive control of an inverter with output LC filter for UPS applications. IEEE Trans. Ind. Electron. 2009, 56, 1875–1883. [Google Scholar] [CrossRef]
- Deng, H.; Oruganti, R.; Srinivasan, D. Analysis and design of iterative learning control strategies for ups inverters. IEEE Trans. Ind. Electron. 2007, 54, 1739–1751. [Google Scholar] [CrossRef]
- Tai, T.-L.; Chen, J.-S. UPS inverter design using discrete-time sliding-mode control scheme. IEEE Trans. Ind. Electron. 2002, 49, 67–75. [Google Scholar] [CrossRef]
- Hu, J.; Shang, L.; He, Y.; Zhu, Z. Direct active and reactive power regulation of grid-connected DC/AC converters using sliding mode control approach. IEEE Trans. Power Electron. 2010, 26, 210–222. [Google Scholar] [CrossRef]
- Benyoucef, A.; Kara, K.; Chouder, A.; Silvestre, S. Prediction-based deadbeat control for grid-connected inverter with L-filter and LCL-filter. Electr. Power Compon. Syst. 2014, 42, 1266–1277. [Google Scholar] [CrossRef]
- Parvez, M.; Elias, M.; Rahim, N.; Osman, N. Current control techniques for three-phase grid interconnection of renewable power generation systems: A review. Sol. Energy 2016, 135, 29–42. [Google Scholar] [CrossRef]
- Kennel, R.M.; Kazmierkowski, M.; Rodriguez, J.; Cortes, P. Predictive control in power electronics and drives. IEEE Int. Symp. Ind. Electron. 2008, 55, 4312–4324. [Google Scholar] [CrossRef]
- Gálvez-Carrillo, M.; De Keyser, R.; Ionescu, C. Nonlinear predictive control with dead-time compensator: Application to a solar power plant. Sol. Energy 2009, 83, 743–752. [Google Scholar] [CrossRef]
- Yan, W.; Hu, J.; Utkin, V.; Xu, L. Sliding mode pulse width modulation. IEEE Trans. Power Electron. 2008, 23, 619–626. [Google Scholar] [CrossRef]
- Schirone, L.; Celani, F.; Macellari, M. Discrete-time control for DC-AC converters based on sliding mode design. IET Power Electron. 2012, 5, 833–840. [Google Scholar] [CrossRef]
- Navarro-López, E.M.; Cortés, D.; Castro, C. Design of practical sliding-mode controllers with constant switching frequency for power converters. Electr. Power Syst. Res. 2009, 7, 796–802. [Google Scholar] [CrossRef]
- Wai, R.-J.; Wang, W.-H. Grid-connected photovoltaic generation system. IEEE Trans. Circuits Syst. 2008, 55, 953–964. [Google Scholar] [CrossRef]
- Tan, S.-C.; Lai, Y.; Chi, K.T. Indirect sliding mode control of power converters via double integral sliding surface. IEEE Trans. Power Electron. 2008, 23, 600–611. [Google Scholar] [CrossRef]
- Aamir, M.; Kalwar, K.A.; Mekhilef, S. Proportional-resonant and slide mode control for single-phase UPS inverter. Electr. Power Compon. 2017, 45, 11–21. [Google Scholar] [CrossRef]
- Abrishamifar, A.; Ahmad, A.; Mohamadian, M. Fixed switching frequency sliding mode control for single-phase unipolar inverters. IEEE Trans. Power Electron. 2012, 27, 2507–2514. [Google Scholar] [CrossRef]
- Carpita, M.; Marchesoni, M. Experimental study of a power conditioning system using sliding mode control. IEEE Trans. Power Electron. 1996, 11, 731–742. [Google Scholar] [CrossRef]
- Chiang, S.; Tai, T.; Lee, T. Variable structure control of UPS inverters. IEE Proc. Electr. Power Appl. 1998, 145, 559–567. [Google Scholar] [CrossRef]
- Kukrer, O.; Komurcugil, H.; Doganalp, A. A three-level hysteresis function approach to the sliding-mode control of single-phase UPS inverters. IEEE Trans. Ind. Electron. 2009, 56, 3477–3486. [Google Scholar] [CrossRef]
- Gu, D.; Yao, Y.; Zhang, D.M.; Cui, Y.B.; Zeng, F.Q. Matlab/Simulink Based Modeling and Simulation of Fuzzy PI Control for PMSM. Procedia Comput. Sci. 2020, 166, 195–199. [Google Scholar] [CrossRef]
- Zammit, D.; Staines, C.S.; Apap, M.; Licari, J. Design of PR current control with selective harmonic compensators using Matlab. J. Electr. Syst. Inf. Technol. 2017, 4, 347–358. [Google Scholar] [CrossRef]
- Yang, L.; Ye, M.; Wang, Y.; Xu, Q.; Meng, X. A novel low frequency current ripple suppression method for energy storage system in DC microgrid. Electric. Power. Syst. Res. 2022, 213, 108748. [Google Scholar] [CrossRef]
- Parvez, M.; Elias, M.F.M.; Rahim, N.A.; Blaabjerg, F.; Abbott, D.; Al-Sarawi, S.F. Comparative Study of Discrete PI and PR Controls for Single-Phase UPS Inverter. IEEE Access 2020, 8, 45584–45595. [Google Scholar] [CrossRef]
- Li, J.; Xu, S.; Hui, D. A Study on a Suitable PI and Quasi-PR Control Strategy for Energy Storage PCS. New Technol. Electr. Eng. Energy 2016, 35, 54–61. [Google Scholar] [CrossRef]
- Wang, X.; Mao, R.; Tian, B.; Huang, Q. Current Optimization of Photovoltaic Grid Integration Based on PI and Quasi-PR Joint Control. Power Syst. Prot. Control 2017, 45, 121–125. [Google Scholar] [CrossRef]
- Monirul, I.; Saad, M.; Mahamudul, H. Single phase transformerless inverter topologies for grid-tied photovoltaic system. Renew. Sustain. Energy Rev. 2015, 45, 69–86. [Google Scholar] [CrossRef]
- Yuan, L.; Xiu, C.; Ma, X. Sliding mode control strategy for microgrid inverter systems. Power Electron. 2023, 23, 821–831. [Google Scholar] [CrossRef]
- Huang, R.H.; Xie, S.J. Double-loop digital control strategy based on proportional-resonant controller. Trans. China Electrotech. Soc. 2012, 27, 77–81. [Google Scholar]
- Qian, N.S. Simulation Study of Single-Phase Photovoltaic Grid-Connected Inverter Based on PI Control. Guangdong Electr. Power 2012, 25, 57–60. [Google Scholar] [CrossRef]
- Jin, Y.Y.; Wang, Z.S.; Chen, H.M.; Liu, H. Design of Single-Phase Inverter PID Controller Based on Root Locus. Electromechanical Eng. 2008, 25, 83–85. [Google Scholar] [CrossRef]
- Wang, Y.S.; Wang, S.Y.; Hai, R. Harmonic Suppression Strategy of Grid-Connected Inverter Based on PR Regulator. Power Supply Technol. 2016, 40, 184–188. [Google Scholar] [CrossRef]
- Liu, Y.X.; Teng, Q.F. Control Research of Grid-Connected Inverter Based on QPR Regulator for Harmonic Compensation. J. Lanzhou Jiaotong Univ. 2020, 39, 67–74. [Google Scholar] [CrossRef]
- Yaşar, B.; Kaner, Y.; Volkan, K. Design of a single-phase SPWM inverter application with PIC micro controller. Eng. Sci. Technol. 2019, 22, 592–599. [Google Scholar] [CrossRef]
- Wang, W.; Li, K.; Liu, Z.Y. Research on frequency doubling technology and harmonic suppression method of SPWM inverter. Micromotors 2015, 6, 60–64. [Google Scholar] [CrossRef]
- Zhang, G.R.; Yan, L.H. Research on Transmission Bandwidth of Unipolar Carrier-Based CPS-SPWM. Power Syst. Prot. Control 2018, 46, 1–8. [Google Scholar] [CrossRef]
- Sang, H.K. Pulse width modulation inverters. Electr. Mot. Control 2017, 7, 265–340. [Google Scholar] [CrossRef]
- Du, G.; Zhang, P.; Luo, R.J.; LI, H. Research on Dual-Closed-Loop SPWM Inverter Control Strategy Based on Particle Swarm Optimization. Electron. Devices 2020, 43, 815–819. [Google Scholar] [CrossRef]
- Vladimír, B.; Jinří, M.; Roman, P. Tuning of Digital PID Controllers Based on Ziegler—Nichols Method. IFAC Proc. 1997, 30, 145–150. [Google Scholar] [CrossRef]
- Song, S.J.; Yang, X.; Liu, B.; Liao, B.; Song, C. Grid-Connected Inverter Quasi-Proportional Resonant Control Based on Grid Impedance. China Electr. Power 2019, 52, 90–96. [Google Scholar]
- Liu, Y.Z. Design of Overshoot-Free PID Controller; Hangzhou Dianzi University: Hangzhou, China, 2010; Volume 4, pp. 25–42. [Google Scholar] [CrossRef]
- Huang, X.L.; Feng, X.D.; Zhang, X.X. Influence of QPR controller parameters on the adaptability of weak power grid of converter. Electr. Drive 2020, 50, 28–34. [Google Scholar] [CrossRef]
- Liu, E.; Han, Y.; Zalhaf, A.S.; Yang, P.; Wang, C. Performance evaluation of isolated three-phase voltage source inverter with LC filter adopting different MPC methods under various types of load. Control Eng. Pract. 2023, 135, 105520. [Google Scholar] [CrossRef]
- Ćalasan, M.; Aleem, S.H.A.; Zobaa, A.F. On the root mean square error (RMSE) calculation for parameter estimation of photovoltaic models: A novel exact analytical solution based on Lambert W function. Energy Convers. Manag. 2020, 210, 112716. [Google Scholar] [CrossRef]
- Fu, W.P.; Wang, X.H.; Wang, H. Analysis of power supply voltage waveform distortion rate. J. Chang. Electr. Power Inst. 2001, 16, 47–49. [Google Scholar] [CrossRef]
- Fu, J.M. Harmonic analysis of single-phase SPWM inverter circuit based on MATLAB. Sci. Technol. Innov. 2021, 21, 24–26. [Google Scholar] [CrossRef]
- Ye, Q.; Ruan, Y.; Ma, Z. Simulation analysis of total harmonic distortion rate of voltage in inverter circuit. Proc. Chin. Soc. Electr. Power Syst. Autom. 2010, 22, 100–102. [Google Scholar] [CrossRef]
- Lin, H. Introduction to Current Limits in the American Harmonic Standard IEEE Std. 519. Power Supply 2012, 29, 11–14. [Google Scholar] [CrossRef]
- Han, Y.F.; Shen, H.F.; He, G.F.; Fan, X.H.; Zhao, Q.Y. Application of composite proportional resonance control in multi-inverter grid-connected system. Meas. Control Technol. 2018, 37, 122–127. [Google Scholar] [CrossRef]


| Parameters | Numerical Values | Unit |
|---|---|---|
| AC input power | 220 | V |
| Power rating | 10 | kW |
| Rated input frequency | 20 | kHz |
| Total harmonic distortion of the output voltage (THD) | ≤5% | / |
| Output voltage variation | ±3% | / |
| Control Mode | Control Principle | Transfer Functions | Theoretical Control Effects |
|---|---|---|---|
| PI Control | According to the deviation between the given value and the actual output value, the proportion and the integral of the deviation were combined linearly to form a controlled quantity to control the object under control. | Differential adjustment | |
| PID Control | The addition of an extra differential link (D) to PI control enables better elimination of static errors, accelerates the control regulation process, reduces overshoot, and overcomes oscillations. | Differential adjustment | |
| PR Control | Proportional resonance controller, consisting of a proportional link and a resonance link, for static-free control of sinusoidal quantities. | Non-differential adjustment | |
| QPR Control | Quasi-proportional resonance controller, based on PR control, relieved the gain at the resonance point. | Non-differential adjustment |
| Modulation Method | Modulation Principle | Advantages | Disadvantages |
|---|---|---|---|
| Bipolar modulation | When the modulating waveform amplitude is greater than the carrier waveform amplitude, switch tubes Q1 and Q4 are on and output high, Q2 and Q3 are off and output low, and vice versa. | Good common mode performance allows for higher output frequency response and reduces harmonic components. | Higher complexity, the need for more switching devices, and increases switching losses. |
| Monopole frequency doubling Modulation | The SPWM pulse sequence is obtained by modulating two sine waves with a half-switching period difference with a carrier triangle to control each of the two half-bridges in the full-bridge inverter, and the desired sinusoidal pulse sequence is obtained by precise control of the four power devices. | Lower switching losses, relatively simple control, and easier control of harmonic components in the output waveform [41]. | Limited high-frequency response, and in complex applications, achieving sufficient control flexibility and precision may be challenging. |
| Simulation Parameters | Set Values | Unit |
|---|---|---|
| DC-side voltage | 400 | V |
| Base voltage | 311sinωt | V |
| Inverter switching frequency | 50 | Hz |
| Filter Inductors | 1 | mH |
| Filter capacitors | 20 | µF |
| Control Methods | Kp | Ki | Kfb | Kr | ωr | ωc |
|---|---|---|---|---|---|---|
| PI control | 0.01 | 10 | / | / | / | / |
| PID control | 0.01 | 10 | 500 | / | / | / |
| PR control | 0.02 | 1 | / | 1 | 100π | 5π |
| QPR control | 0.02 | 1 | / | 1 | 100π | 5π |
| Control Method | RMSE at Zero Crossing Point (V) | RMSE at Peak Point (V) | Total RMSE (V) |
|---|---|---|---|
| PI | 22.7927 | 12.3213 | 18.9213 |
| PID | 8.0795 | 4.0808 | 6.4401 |
| PR | 3.2038 | 19.8410 | 9.8194 |
| QPR | 4.9321 | 2.4780 | 2.6980 |
| Control Method | THD |
|---|---|
| PI control | 0.71% |
| PID control | 0.66% |
| PR control | 0.39% |
| QPR control | 0.37% |
Disclaimer/Publisher’s Note: The statements, opinions and data contained in all publications are solely those of the individual author(s) and contributor(s) and not of MDPI and/or the editor(s). MDPI and/or the editor(s) disclaim responsibility for any injury to people or property resulting from any ideas, methods, instructions or products referred to in the content. |
© 2023 by the authors. Licensee MDPI, Basel, Switzerland. This article is an open access article distributed under the terms and conditions of the Creative Commons Attribution (CC BY) license (https://creativecommons.org/licenses/by/4.0/).
Share and Cite
Li, Y.; Yu, H.; Jiang, C.; Jin, Y. Analysis of Control Strategy of Arc Plasma Power Supply Inverter Module. Electronics 2023, 12, 4400. https://doi.org/10.3390/electronics12214400
Li Y, Yu H, Jiang C, Jin Y. Analysis of Control Strategy of Arc Plasma Power Supply Inverter Module. Electronics. 2023; 12(21):4400. https://doi.org/10.3390/electronics12214400
Chicago/Turabian StyleLi, Yue, Hailong Yu, Chuan Jiang, and Yong Jin. 2023. "Analysis of Control Strategy of Arc Plasma Power Supply Inverter Module" Electronics 12, no. 21: 4400. https://doi.org/10.3390/electronics12214400
APA StyleLi, Y., Yu, H., Jiang, C., & Jin, Y. (2023). Analysis of Control Strategy of Arc Plasma Power Supply Inverter Module. Electronics, 12(21), 4400. https://doi.org/10.3390/electronics12214400