Abstract
In this paper, we study the enhancement of channel transmission information by expanding the transmission channel in the frequency-hopping rate dimension in a communication system. This is achieved using the frequency-hopping spread spectrum (FHSS) without increasing communication resources, such as power and bandwidth. The anti-jamming capability of the original information is maintained during this process. The spectral characteristics of the extended signal for frequency-hopping (FH) transmission are investigated, a demodulation method based on carrier reconstruction is proposed, the bit error rate performance is simulated, and the capacity enhancement and anti-jamming ability of the extended signal for FH transmission are analyzed.
1. Introduction
Satellite communication systems are an important component of next-generation mobile communication networks. Through the introduction of satellite communication means, the global coverage of mobile communication systems can be enhanced, thereby expanding applications in such areas as automatic flight piloting in remote areas [1,2,3], maritime logistics monitoring [4,5], global environmental resource monitoring [6,7], and disaster early warning [8,9].
Satellite communication systems have a significantly increased beam coverage compared to terrestrial communication networks. As long as it is within the beam coverage, it is possible to interfere with satellite communication signals. In addition, satellite communication systems have high-gain characteristics, with the S-band synchronous-orbit communication satellite antenna aperture reaching 15 m [10]. The wide-area coverage and high-gain characteristics of satellite communication systems make the risk and probability of interference significantly higher, especially for wide-beam antenna systems used for signaling or IOT message transmission [11].
In order to improve the anti-jamming performance of satellite communication systems to meet the transmission of highly reliable information, such as signaling transmission, autopilot, far-area flight, disaster warning, etc., the spectrum is usually extended in exchange for a certain anti-jamming gain. The higher the spectrum expansion ratio, the greater the anti-jamming gain. Under the premise of an unchanged transmission bandwidth, the lower the information rate, the stronger the anti-jamming ability. Therefore, in the above scenario, the information rates of each user’s signaling secret key, driving instructions, warnings, etc., are generally reduced to the kbps scale for transmission [12,13].
According to Shannon’s theorem, there is some room for information capacity improvement before the communication link reaches maximum efficiency after spectrum expansion [14].
Spread spectrum is divided into frequency-hopping spread spectrum and direct spread spectrum. There is a contradiction between the anti-interference capability of information transmission and the need for an information transmission rate. To alleviate the contradiction between the two, this paper proposes a capacity enhancement method for the anti-jamming communication system for FH, which aims to increase the information transmission capacity of the anti-jamming communication system by modulating the incremental information in the frequency-hopping frequency point dimension without guaranteeing the anti-jamming capability of the original system or increasing communication resources, such as the power and bandwidth.
1.1. Related Works
Since the late 1990s, scholars have studied and utilized modulation information on the amount of change in frequency-hopping frequency point positions, using techniques such as differential frequency hopping, etc.
The United States-based organization Lockheed Sanders developed CHESS radio based on differential frequency-hopping technology [15]. With a hopping speed of up to 5000 hops/s and an information transmission rate of up to 19.2 kb/s, CHESS radio is equipped to handle tracking interference, and has considerable resistance to fading ability [16,17]. Zhongying Liu et al. proposed a frequency-hopping detection method based on STFT (short-time Fourier transform) [18], which was combined with the G-function to analyze the frequency characteristics of shortwave differential frequency-hopping signals at each hop time interval, enabling the detection of hopping frequency information. Qian Bo et al. [19] proposed a multi-hop autocorrelation-based differential frequency-hopping (DFH) signal detection method for the non-periodic characteristics of DFH signal hopping sequences.
In recent years, both domestic and foreign scholars in this field have focused on further optimizing security performance using algorithms such as chaotic sequence encryption, as well as the design of the principal rate transfer function and the detection of broadband high-speed frequency-hopping signals.
In 2008, Qu Xiaoxu et al. proposed a FH-DFH approach that combines DFH with the traditional FH technique to eliminate the correlation between successive frequency hopping and to improve the anti-interception performance [20]. Several years later, in 2015, Yong Li, Fuqiang Yao et al. proposed a frequency domain equalization algorithm for wideband DFH systems: the frequency domain decision feedback sliding multi-hop equalization algorithm (DF-SMH-FDE) [21], which can improve the BER performance of differential frequency-hopping (DFH) systems. In 2022, Yin Aibing and Li Yi [22] designed an encryption scheme based on pseudo-random sequences of logistic chaotic mapping to randomly scramble frequency-hopping (FH) patterns to address the poor two-dimensional uniformity of FH patterns in differential frequency-hopping (DFH) communications, which are easily intercepted. In doing so, they strengthened the anti-interception capability; however, this negatively affected the systems’ performance. In 2022, Xin Liu et al. [23] proposed an enhanced differential frequency-hopping (EDFH) framework, which adds the transmission and processing processes of training signals to the traditional communication signal transmission and designs a mixed-signal matched filter (CMF) for user signals and interference signals at the receiving end.
The research conducted in this field has demonstrated that differential frequency hopping conducts information modulation from the dimension of the amount of change in the frequency-hopping frequency point position, but the hardware complexity that is required for differential frequency hopping is high, and it only analyzes and utilizes the technology from the perspective of a single modulation method. The capacity-boosting modulation method proposed in this paper is based on the phase modulation and frequency-hopping that are already used in anti-jamming communication systems, in which frequency-hopping dimensional modulation is performed to boost the information capacity. The multidimensional modulation system differs from single dimension modulation in terms of the demodulation method and BER performance.
In frequency-hopping immunity papers, chaotic sequences are used to control frequency-hopping patterns to enhance the security of information transmission. Compared with these papers, the novelty of this paper lies in the use of transmitted information control instead of chaotic sequence control of the frequency-hopping patterns, which on the one hand enhances the unpredictability of frequency-hopping patterns and further improves the security of information transmission; on the other hand, it increases the dimension of the transmitted information and enhances the transmission capacity of the anti-jamming system.
1.2. Novelty and Main Contributions
- Firstly, the capacity enhancement method of FH anti-jamming communication systems is proposed, the capacity enhancement model of FH anti-jamming communication systems is established, the expression of FH capacity enhancement signals is given, and the spectral characteristics of the signal are deduced;
- Secondly, the FH capacity-boosting signal demodulation scheme is designed;
- Finally, the effect of the new method on improving capacity, BER performance, and anti-jamming performance is analyzed.
2. Materials and Methods
2.1. FH System Capacity Enhancement Methodology
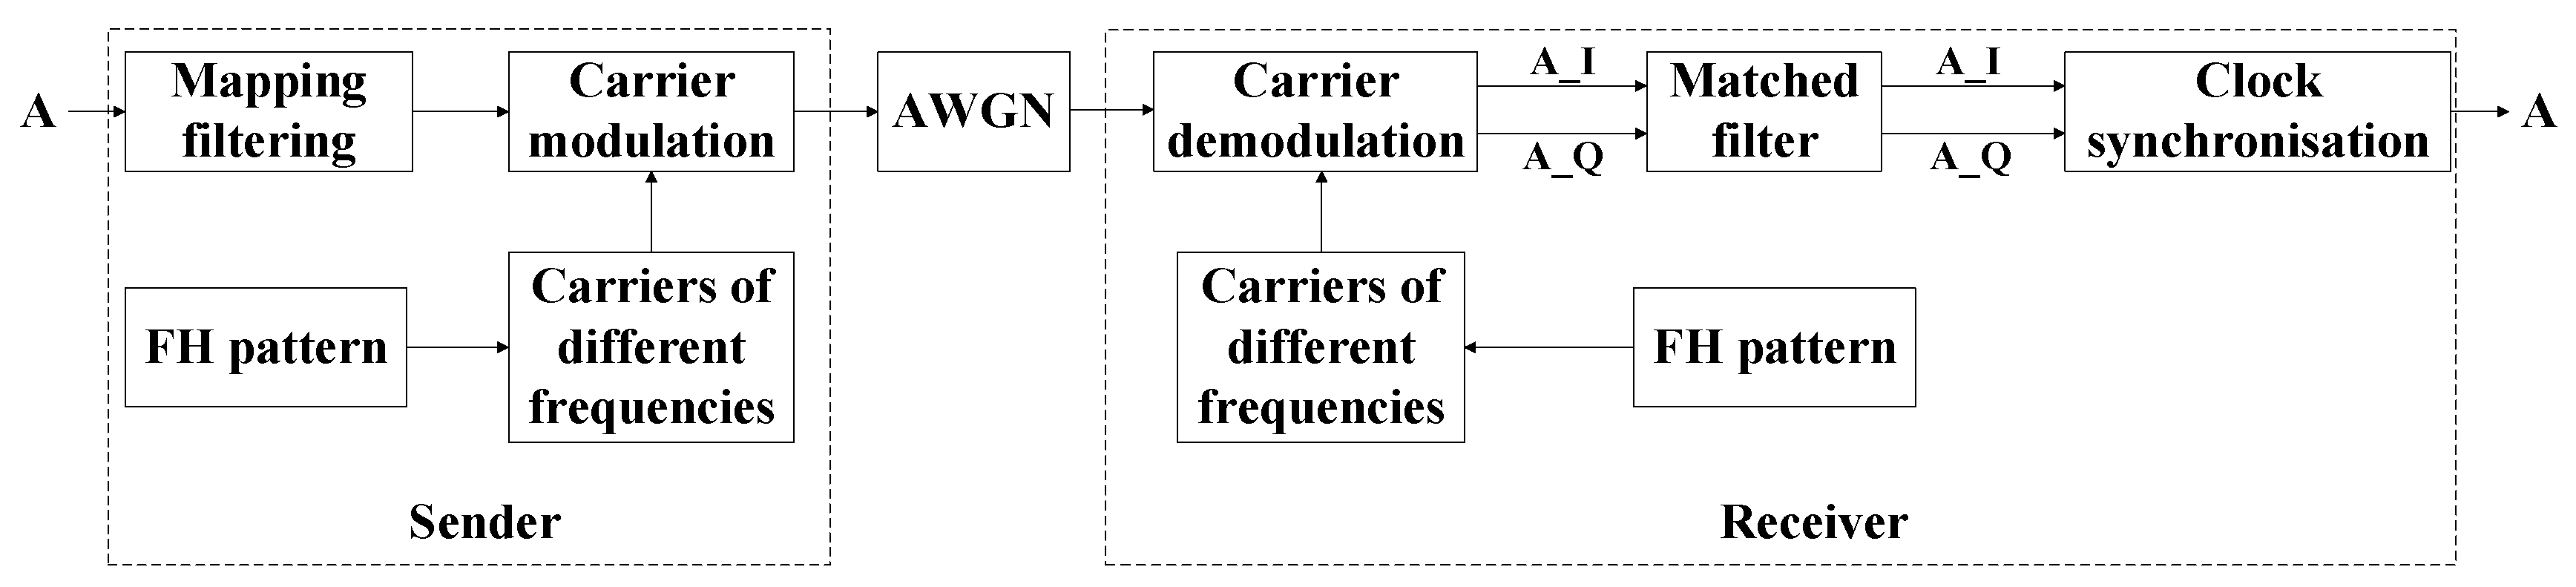
Previous FH systems selected carriers of different frequencies for modulation through frequency-hopping patterns; FH patterns carry no information [24] (see Figure 1). A_I denotes the I-way of information A and A_Q denotes the Q-way of information A.

Figure 1.
Schematic diagram of information rate enhancement for frequency-hopping systems.
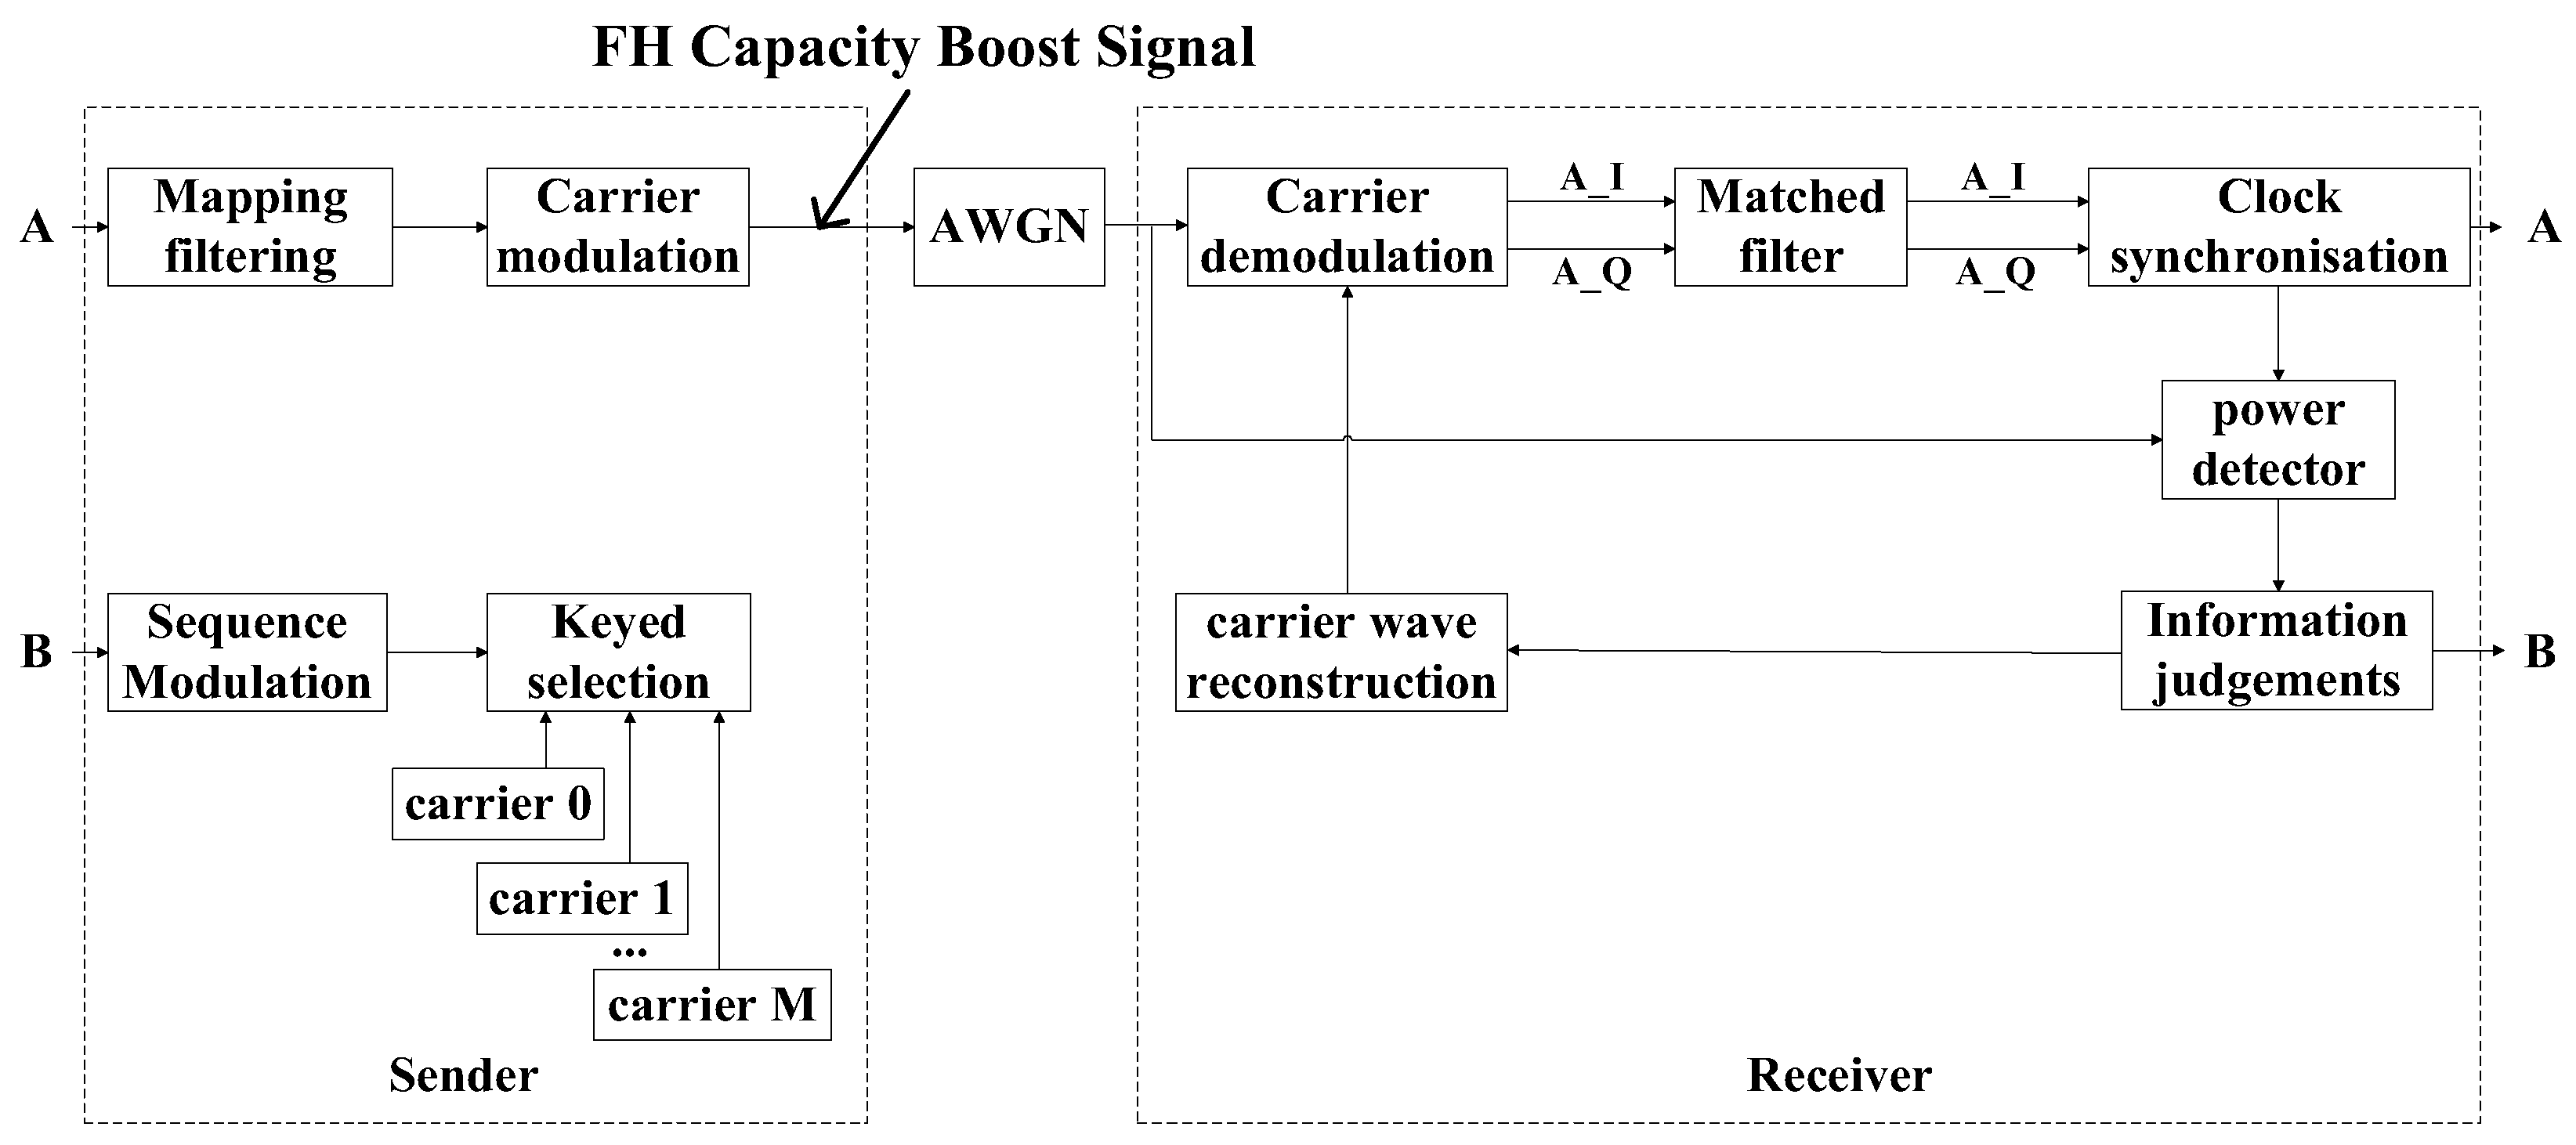
The FH system capacity enhancement method, which is used to enhance the information transmission capacity of the anti-jamming communication system by modulating the information at the frequency-hopping point dimension, is presented in Figure 2. A_I denotes the I-way of information A and A_Q denotes the Q-way of information A. In this method, the information transmitted in the original FH system is referred to as Information A, and the incrementally transmitted information is referred to as Information B.
Figure 2.
Schematic diagram of information rate enhancement for frequency-hopping systems.
At the transmitter side, for Information A, BPSK modulation is generally used. After symbol mapping, carrier modulation is performed. The carrier is a frequency-hopping carrier, and the frequency-hopping rate is selected based on Information B. The frequency-hopping period is generally an integer multiple of the period of the code element of Information A. For Information B, at the transmitting end, sequence modulation is performed according to the mapping relationship to transform Information B into control information that does not use frequency carriers. In this case, one code element cycle of Information B corresponds to one or more frequency-hopping cycles. The output at the transmitter side is an FH capacity boost signal carrying both Information A and Information B.
After passing through the AWGN channel, at the receiving end, carrier reconstruction is conducted to form a local carrier using Information B; carrier demodulation is then carried out to form a baseband signal. After the completion of clock synchronization and judgement, Information A is demodulated. At the receiving end, the carrier frequency point is measured using the power detector method, and then the baseband Information B is demodulated according to the modulation mapping relationship.
2.2. FH Capacity Boost Signal Design
2.2.1. FH Capacity Boost Signal Expression
The FH capacity boost signal transmits Information A and Information B in two dimensions: phase and FM point, respectively.
Information A uses BPSK modulation and Information B equivalently uses FSK modulation.
Without channel coding, the FH capacity boost signal is denoted as
where the baseband Information A is expressed as . When A = 1, takes 1, indicating that the carrier phase is 0. When A = 0, takes −1, which indicates that the carrier phase is . Information A is an equal probability source.
where the baseband Information B is expressed as . The vector is obtained from the modulation mapping relation. is the coefficient before the carrier at each frequency point. When , it indicates that this carrier frequency is used for transmission. When , it indicates that this carrier frequency is not selected for transmission. to correspond to . In each frequency-hopping cycle, only one is 1 and the others are 0.
When modulating a carrier with different frequency points using Information B, the M frequency points are divided into I groups of J frequency points each, which can modulate k bits of information.
The group label is i (the group label corresponds to the code element label), and . The frequency points within each group are labeled j, and . J is the number of frequency points in each group.
Putting Information B in terms of one code element per k bits, the corresponding decimal value is . Each Information B code element cycle corresponds to J frequency-hopping cycles. The jth frequency-hopping cycle of the current code element corresponding to is
where , , and .
This demonstrates the correspondence between each k bits and code elements in Information B. The grouping of code elements can undergo real-time chaotic processing to improve the system’s anti-interception performance.
2.2.2. FH Capacity Boost Signal Generation
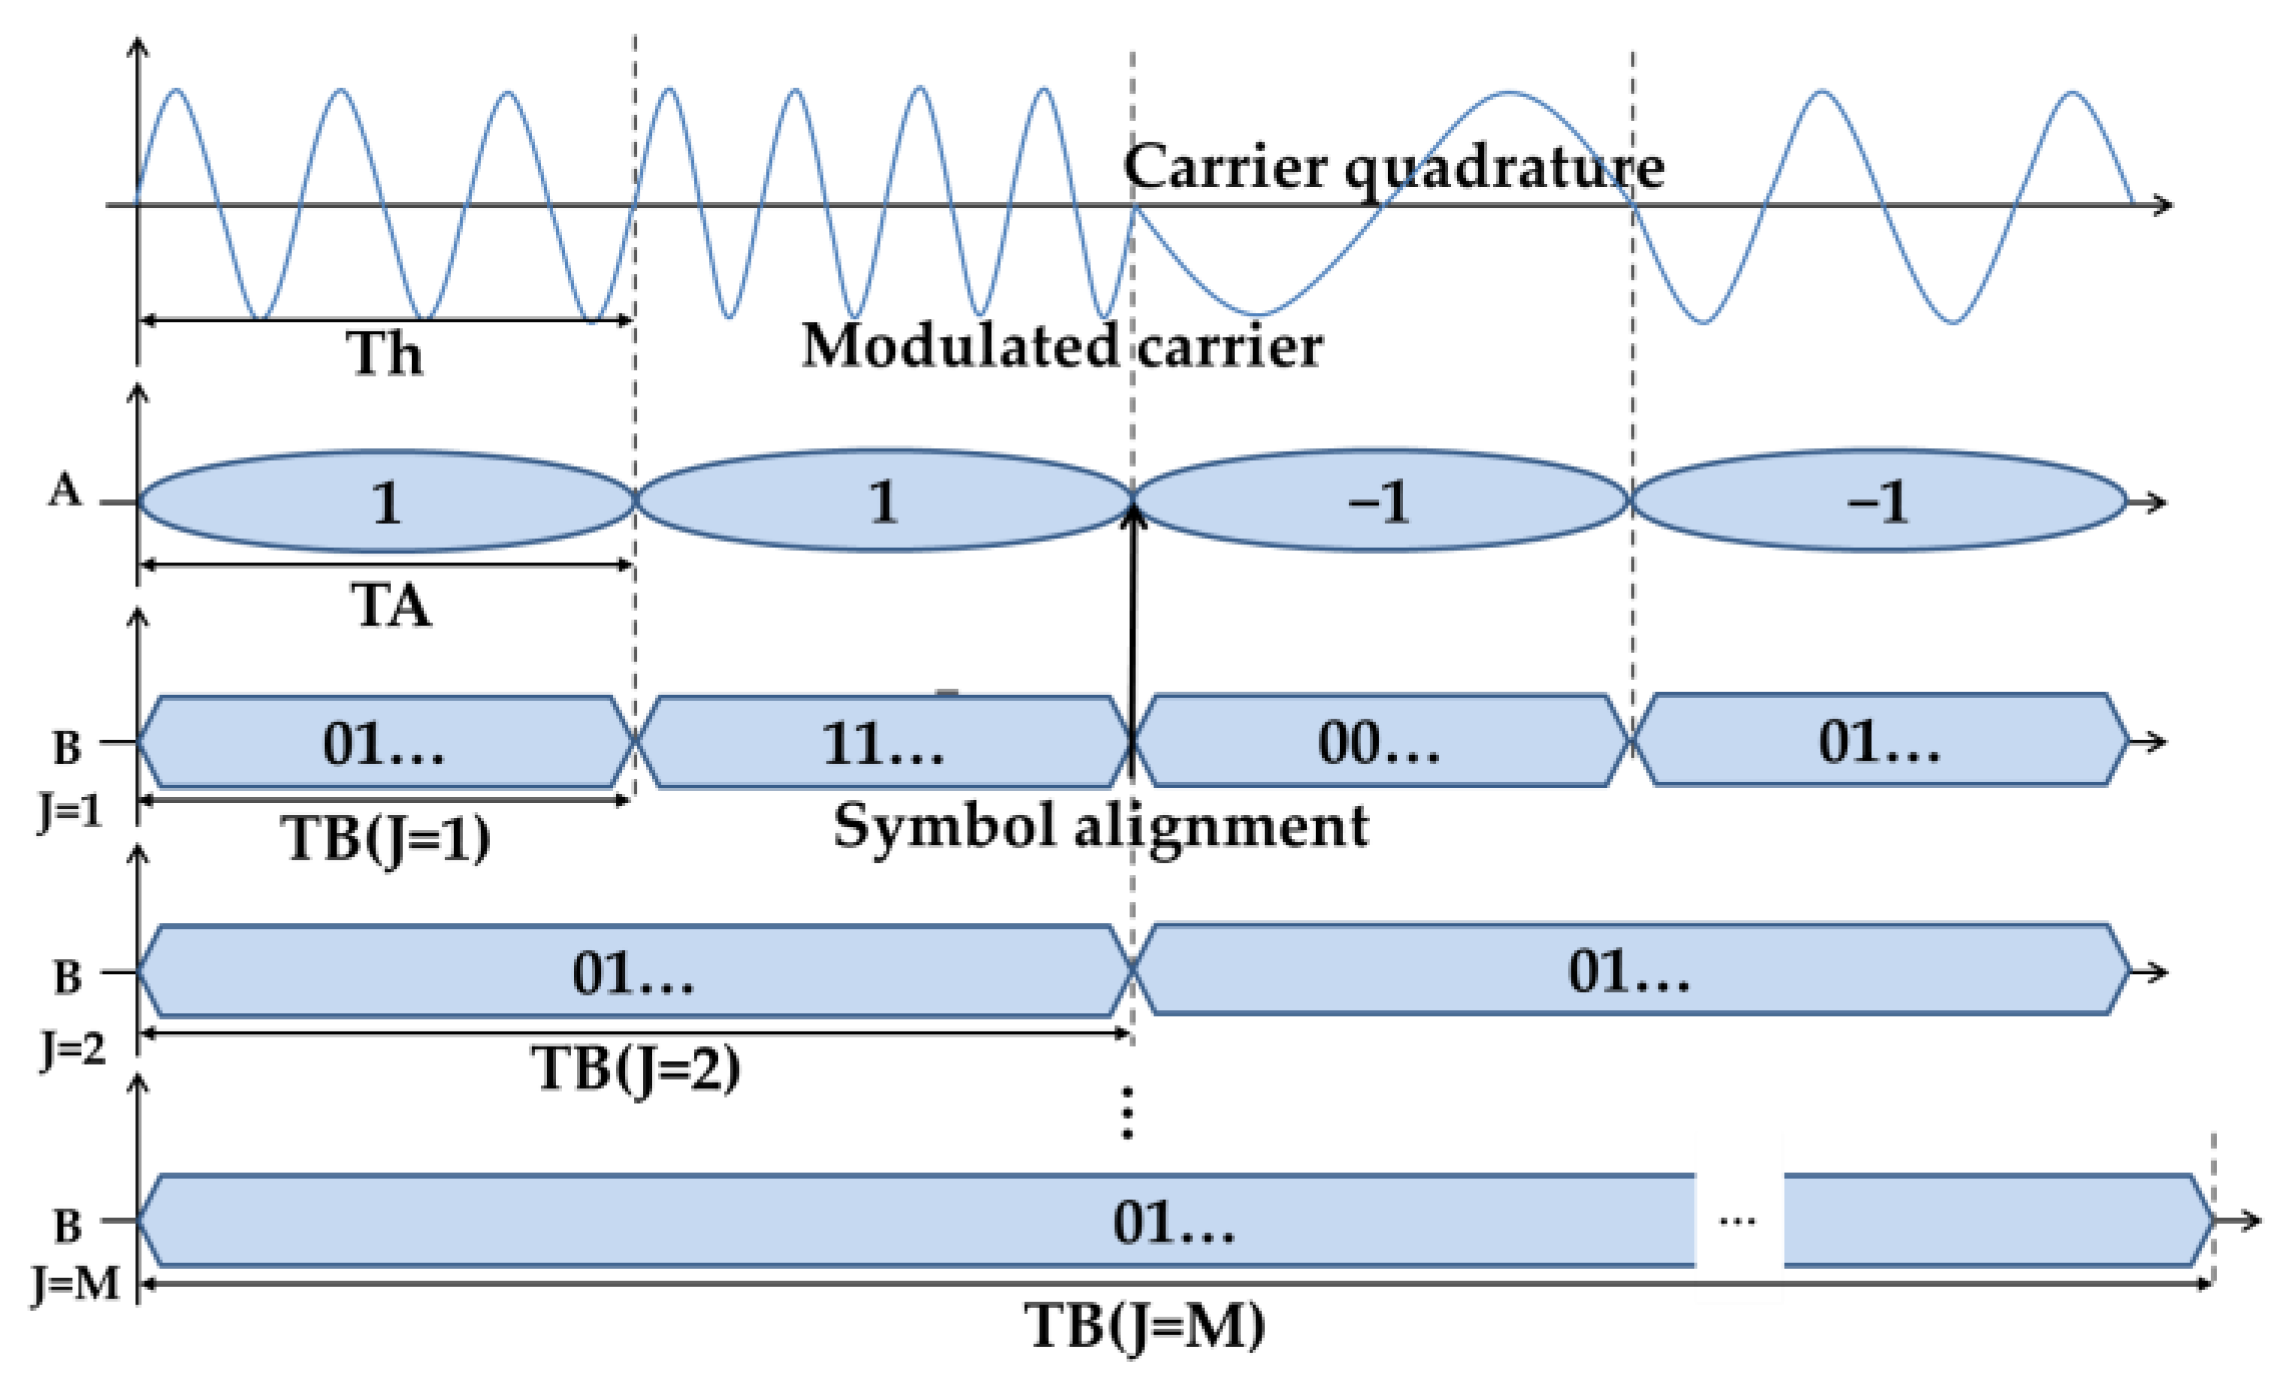
The FH capacity boost signal needs to meet the requirements of frequency-hopping point orthogonality, phase continuity, and code element alignment, as shown in Figure 3. In Figure 3, A denotes information A, B denotes information B.
Figure 3.
FH capacity boost signal generation.
The frequency-hopping points are orthogonal and the carrier frequency points are , , …, . The carrier signal , , …, is orthogonal in the period . Quadrature frequency hopping is implemented in the baseband first, and then the frequency-hopped signal is up-converted to RF.
In multi-symbol joint detection, to improve the BER performance of Information B without affecting the original anti-jamming performance of Information A, i.e., to maintain the frequency-hopping speed of Information A, multi-symbol joint detection is performed so that a single Information B code element controls one or more frequency-hopping points. At the same time, each set of frequency points is orthogonal to one code element period in the time domain.
To achieve phase continuity—that is, to facilitate the demodulation of Information A at the receiving end—the phase of the signal at different frequency-hopping points should change continuously, to ensure that a symbol period is an integer multiple of the carrier period. To provide the end of a symbol period for the end of the carrier period, the next symbol starts just for the beginning of the carrier period, so that the phase changes continuously.
The start and end moments of the code elements of the originating Information A and Information B are aligned with each other; the code element period of Information A corresponds to an integer number of frequency-hopping cycles; the code element period of Information B corresponds to an integer multiple of the code element period of Information A; and there are an integer number of carrier cycles within each frequency-hopping cycle.
For baseband Information A, the number of frequency-hopping points is . The frequency-hopping rate is . The channel coding efficiency is . The information rate is . The code element rate is . In general, the frequency-hopping period is equal to the code word period , or an integer multiple of the code word period .
For baseband Information B, the code element cycle corresponds to frequency-hopping cycles, , where .
2.2.3. FH Capacity Boost Signal Spectral Analysis
To derive the FH capacity boost signal spectrum, is divided into steady state and alternating waves [25].
- Steady State Wave Analysis
Here, the steady state wave is the statistically averaged component of the random sequence and a weighted average of the probability of occurrence of each code element.
When both Information A and Information B are equal-probability sources, the number of frequency-hopping points is M, and Information A adopts BPSK modulation; there are a total of 2M possible scenarios for the waveform of in each frequency-hopping cycle, and the probability of occurrence of each scenario is 1/2M. The statistical average of each frequency-hopping symbol is . Therefore, the s(t) signal contains no steady-state waves, and the s(t) signal spectrum contains no discrete spectral components.
- Alternating Wave Analysis
Alternating waves are defined according to the power spectral density Equation:
where E denotes the statistical average and T is the interception time, which is set equal to the length of (2N + 1) code elements, .
First, we find the spectral function, , of the function (1) of the random signal .
The truncated function, , of the random signal, , can be expressed as
For simplicity, the carrier term is initially ignored and the first term of the truncation function is taken to compute the spectrum, .
where .
- ①
- When , , .
- ②
- When , , , and .
, has a non-zero value only at .
T is the interception time; let it be equal to (2N + 1) code element lengths, .
When the carrier term is added, the power spectral density function of is .
Thus, the power spectral density of is
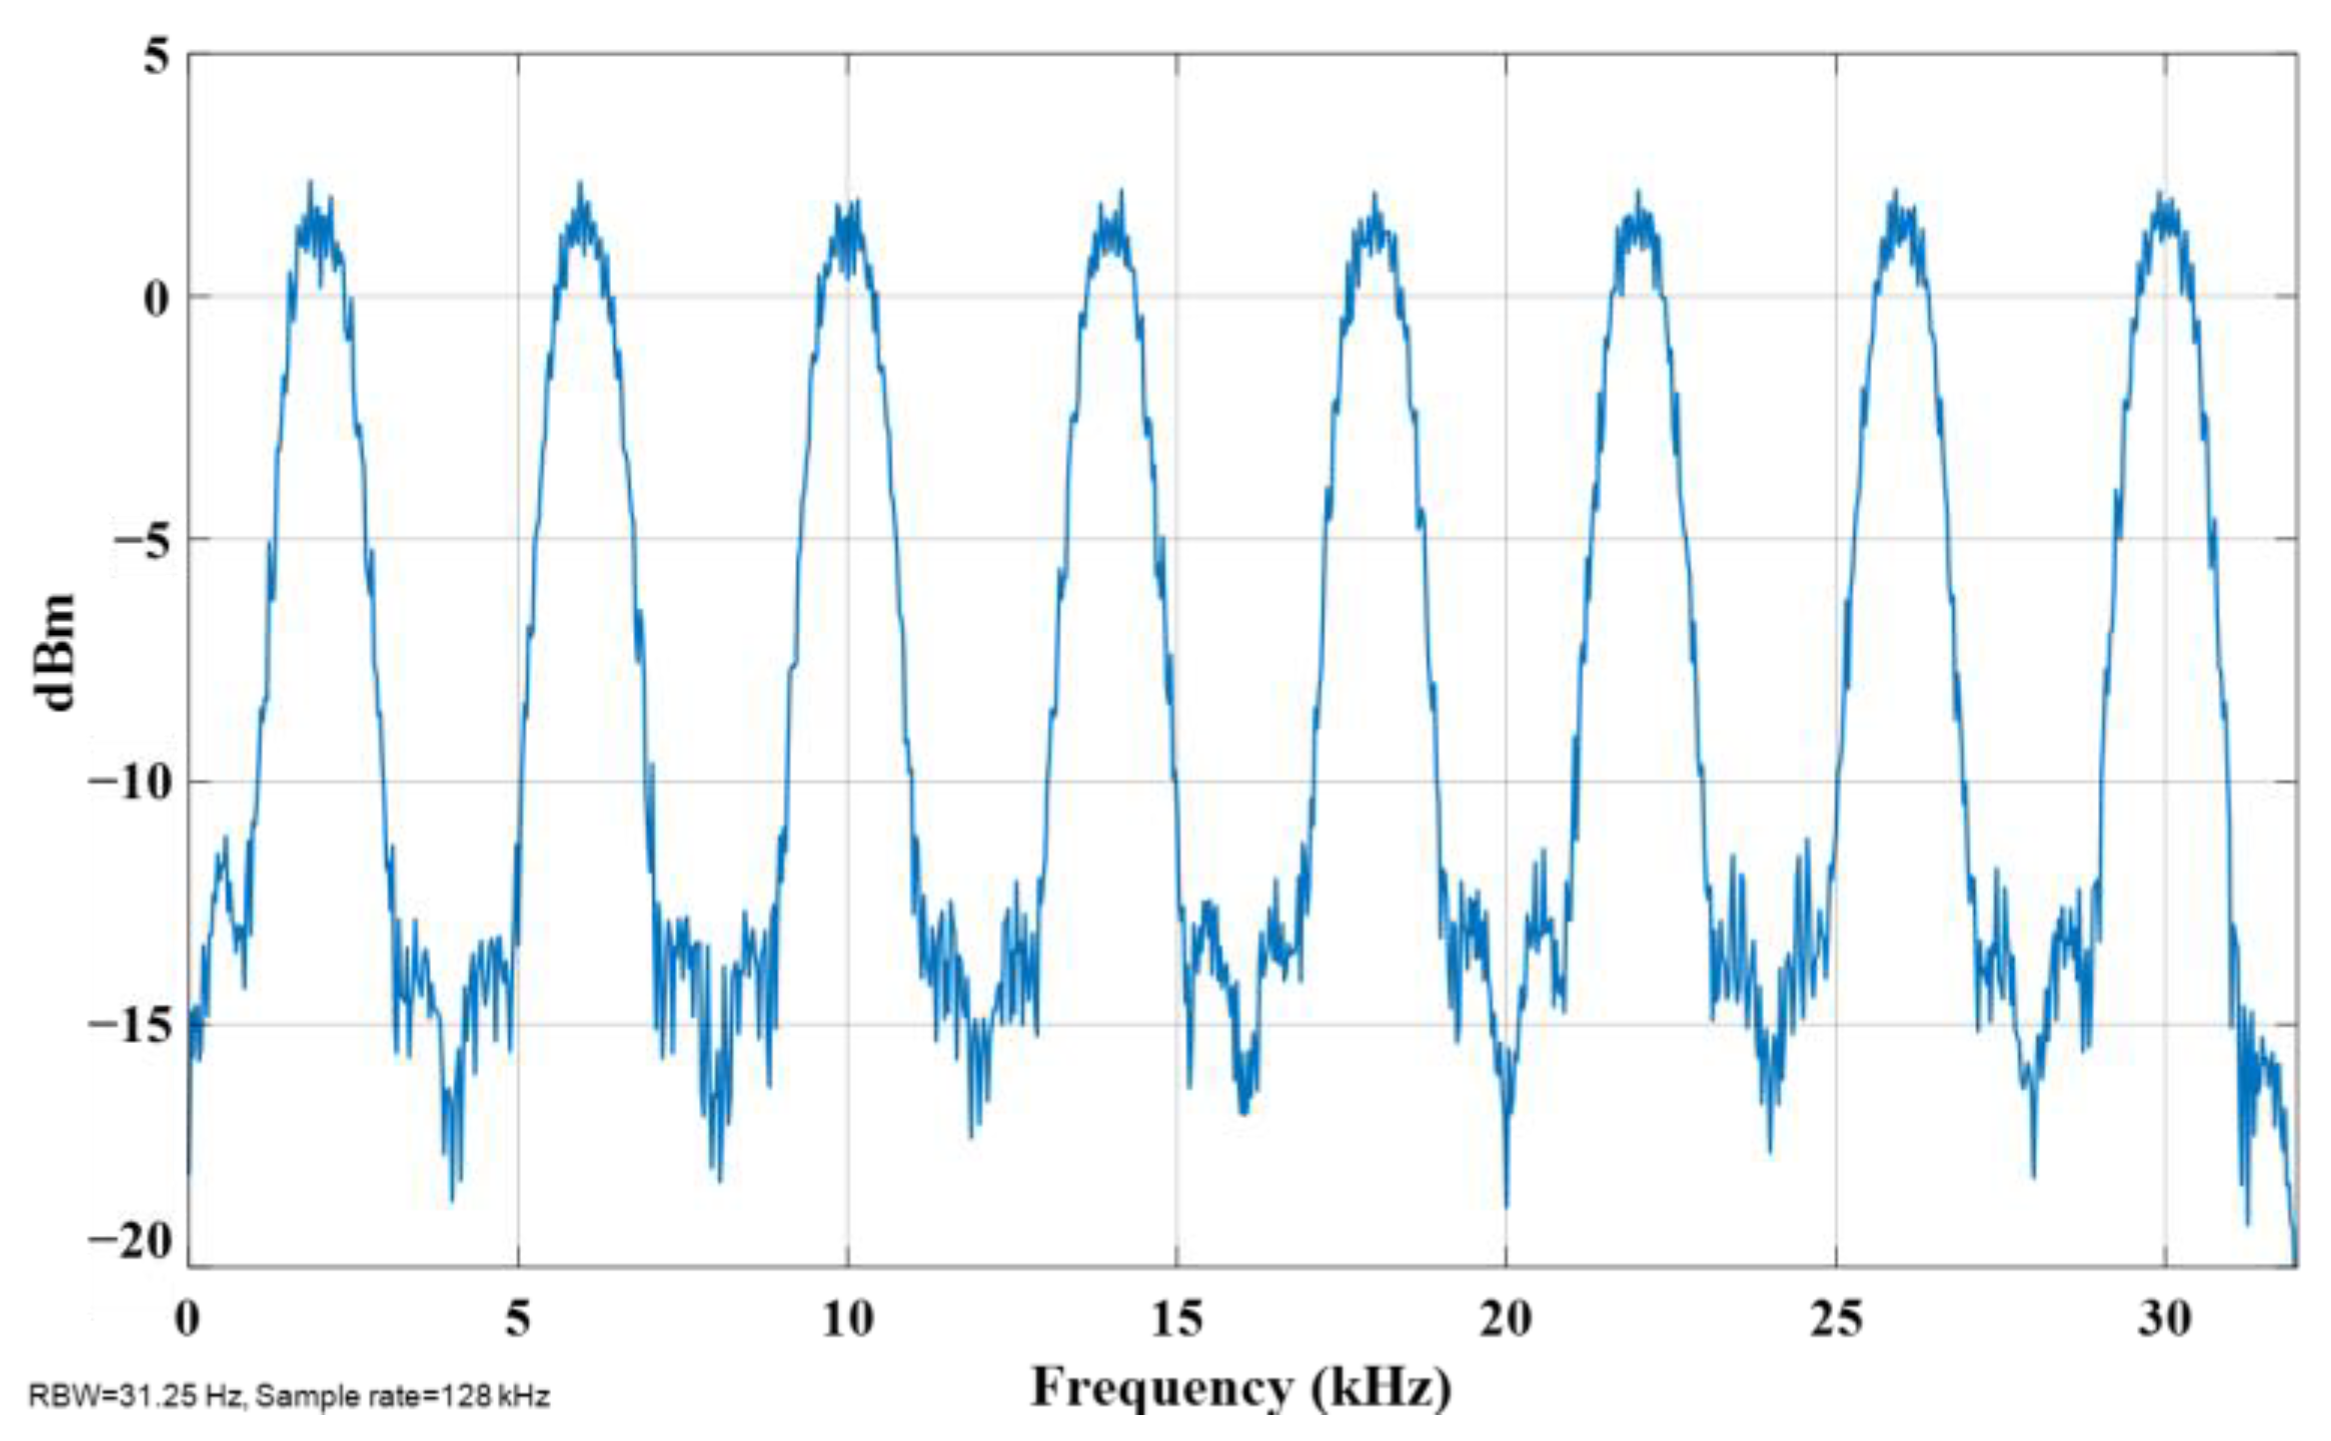
Taking eight frequency points as an example, when M = 8, the spectrum of the positive frequency point of the signal is shown in Figure 4. Each frequency point has equal power and the positive and negative frequency points are symmetrical about the position of the zero frequency point, which is consistent with Equation (16).
Figure 4.
Schematic diagram of the frequency-hopping spectrum of frequency points.
The spectrum is characterized by the following three points:
- (1)
- No steady state waves in the spectrum and no discrete carrier components, unlike FM signals;
- (2)
- The average power at each frequency point is 1/M of the total power, and as the number of frequency points increases, the average power of the signal at each frequency point decreases;
- (3)
- The signal power spectrum at each frequency point is the Fourier transform of the product of the time domain baseband waveforms of signals A and B.
3. Results
3.1. Design of Demodulation Algorithm for FH Capacity Boost Signal
Demodulation Algorithm Flow
As shown in Figure 2, for Information A, coherent demodulation is used to ensure BER performance. Before demodulating Information A, the carrier frequency of the FH capacity boost signal must be determined. After the demodulation of Information B, the carrier reconstruction is performed according to the correspondence between Information B and the carrier frequency, and then Information A is demodulated using the reconstructed carrier of Information B. For Information B, the demodulation performance of both the envelope detection and coherent demodulation converge as the modulation order increases; for simplicity, the demodulation method of envelope detection is used for Information B.
The specific flow of the demodulation algorithm is as follows:
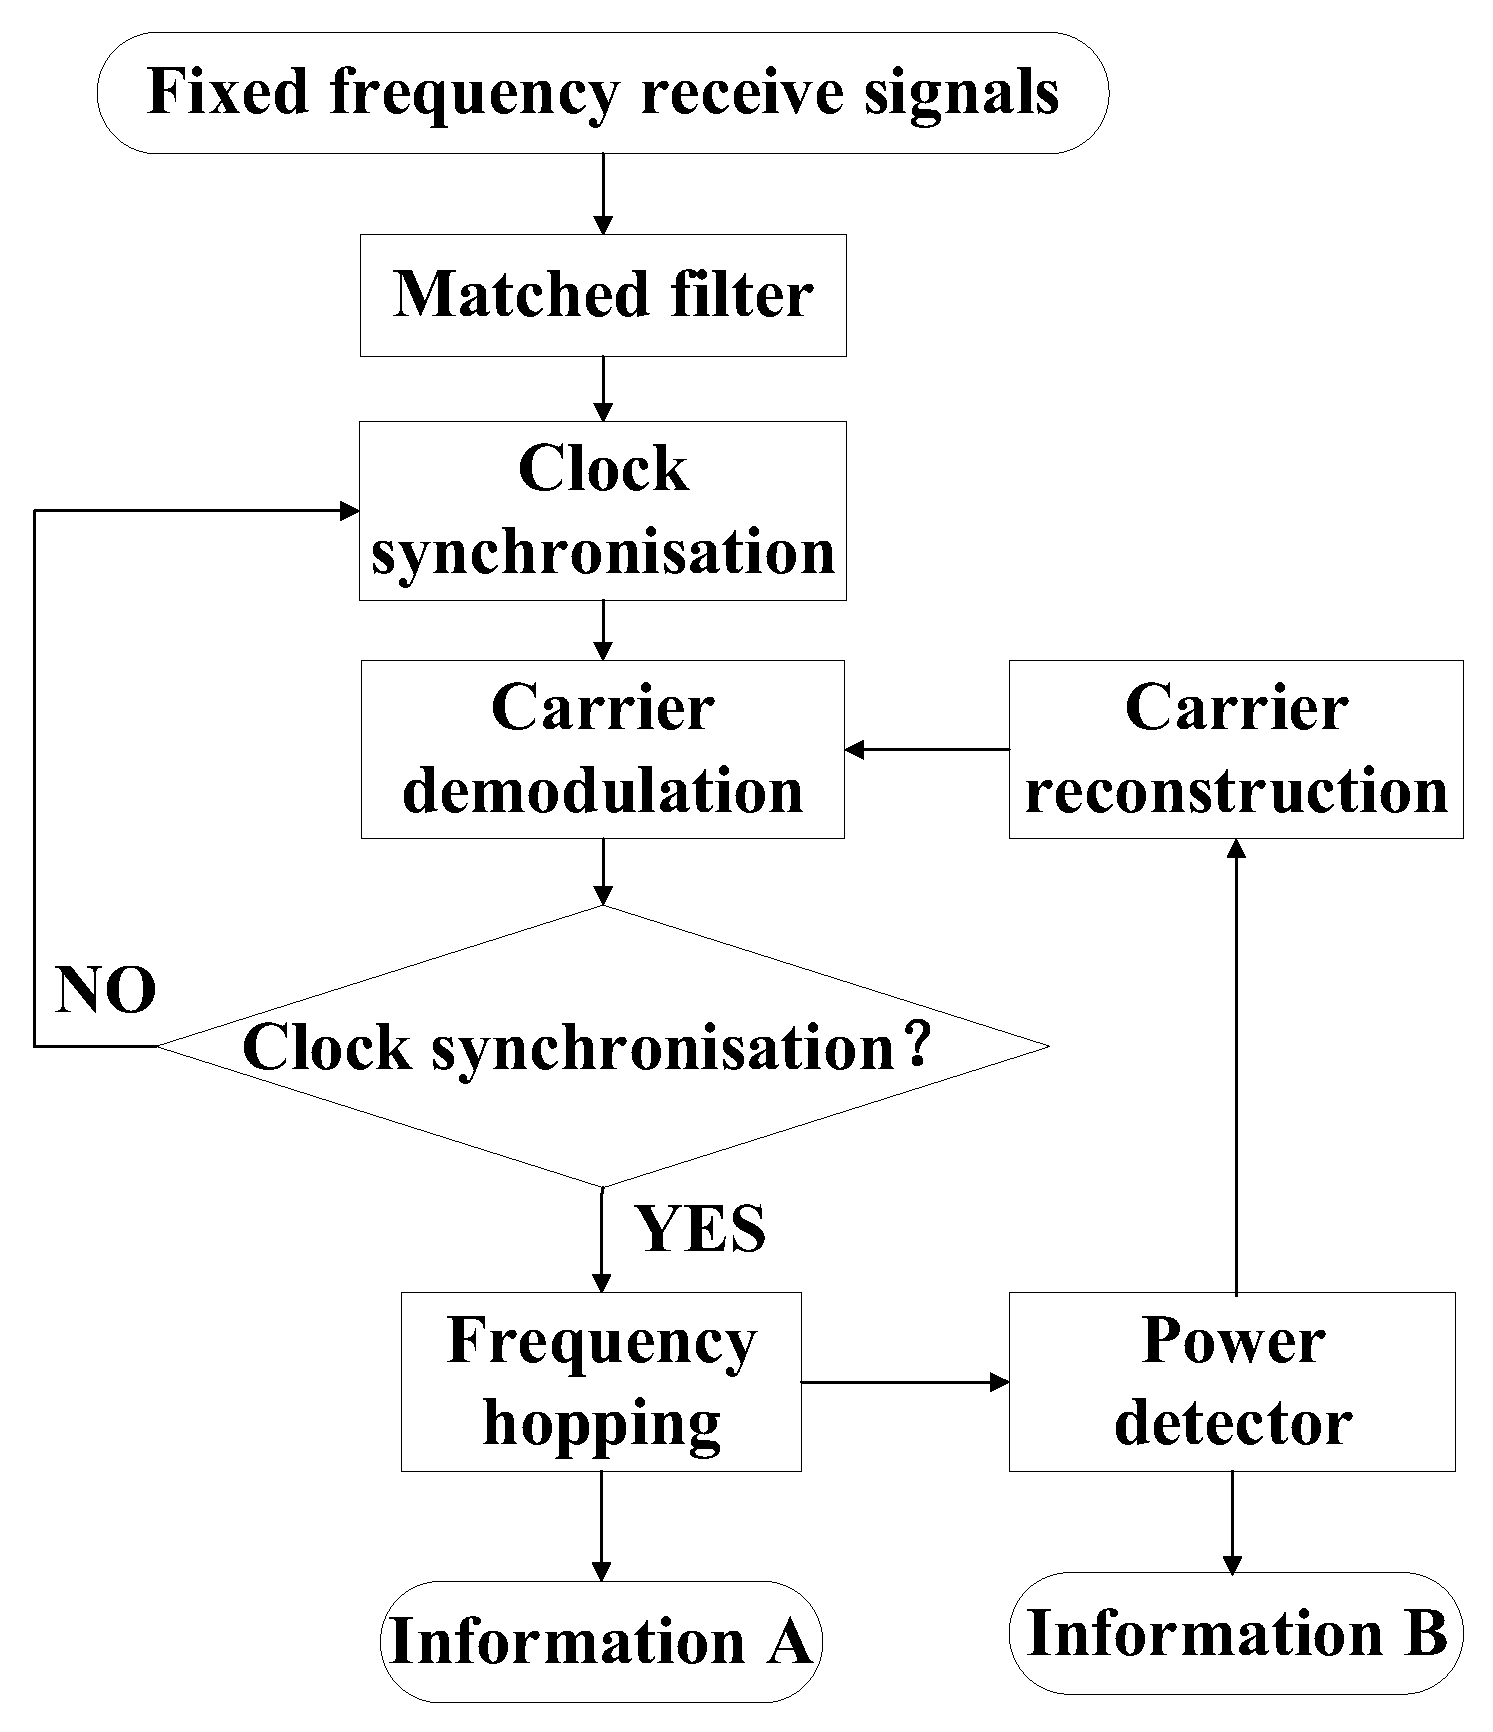
The received fixed-frequency signal is input into the Gardner loop for timing synchronization after passing through the matched filter, after which the reconstructed carrier of Information B, demodulated using the power detector method, is used to perform carrier recovery out of Information A. First, it is determined whether the timing synchronization is completed or not, and the frequency hopping begins once the timing synchronization is completed, as shown in Figure 5.
Figure 5.
Demodulation flowchart.
Based on the proposed signal generation and demodulation methods, a simulation verification system is established to verify the functional performance parameters.
In the simulation verification model, Gardner’s algorithm is used for the timing error detection of Information A. The carrier recovery of Information A is performed using a Costas loop. Before the information transmission link is established, a certain synchronization time is reserved, and the frequency is fixed during the synchronization time without the transmission of Information B.
- Power Detection Method for Demodulation of Information B
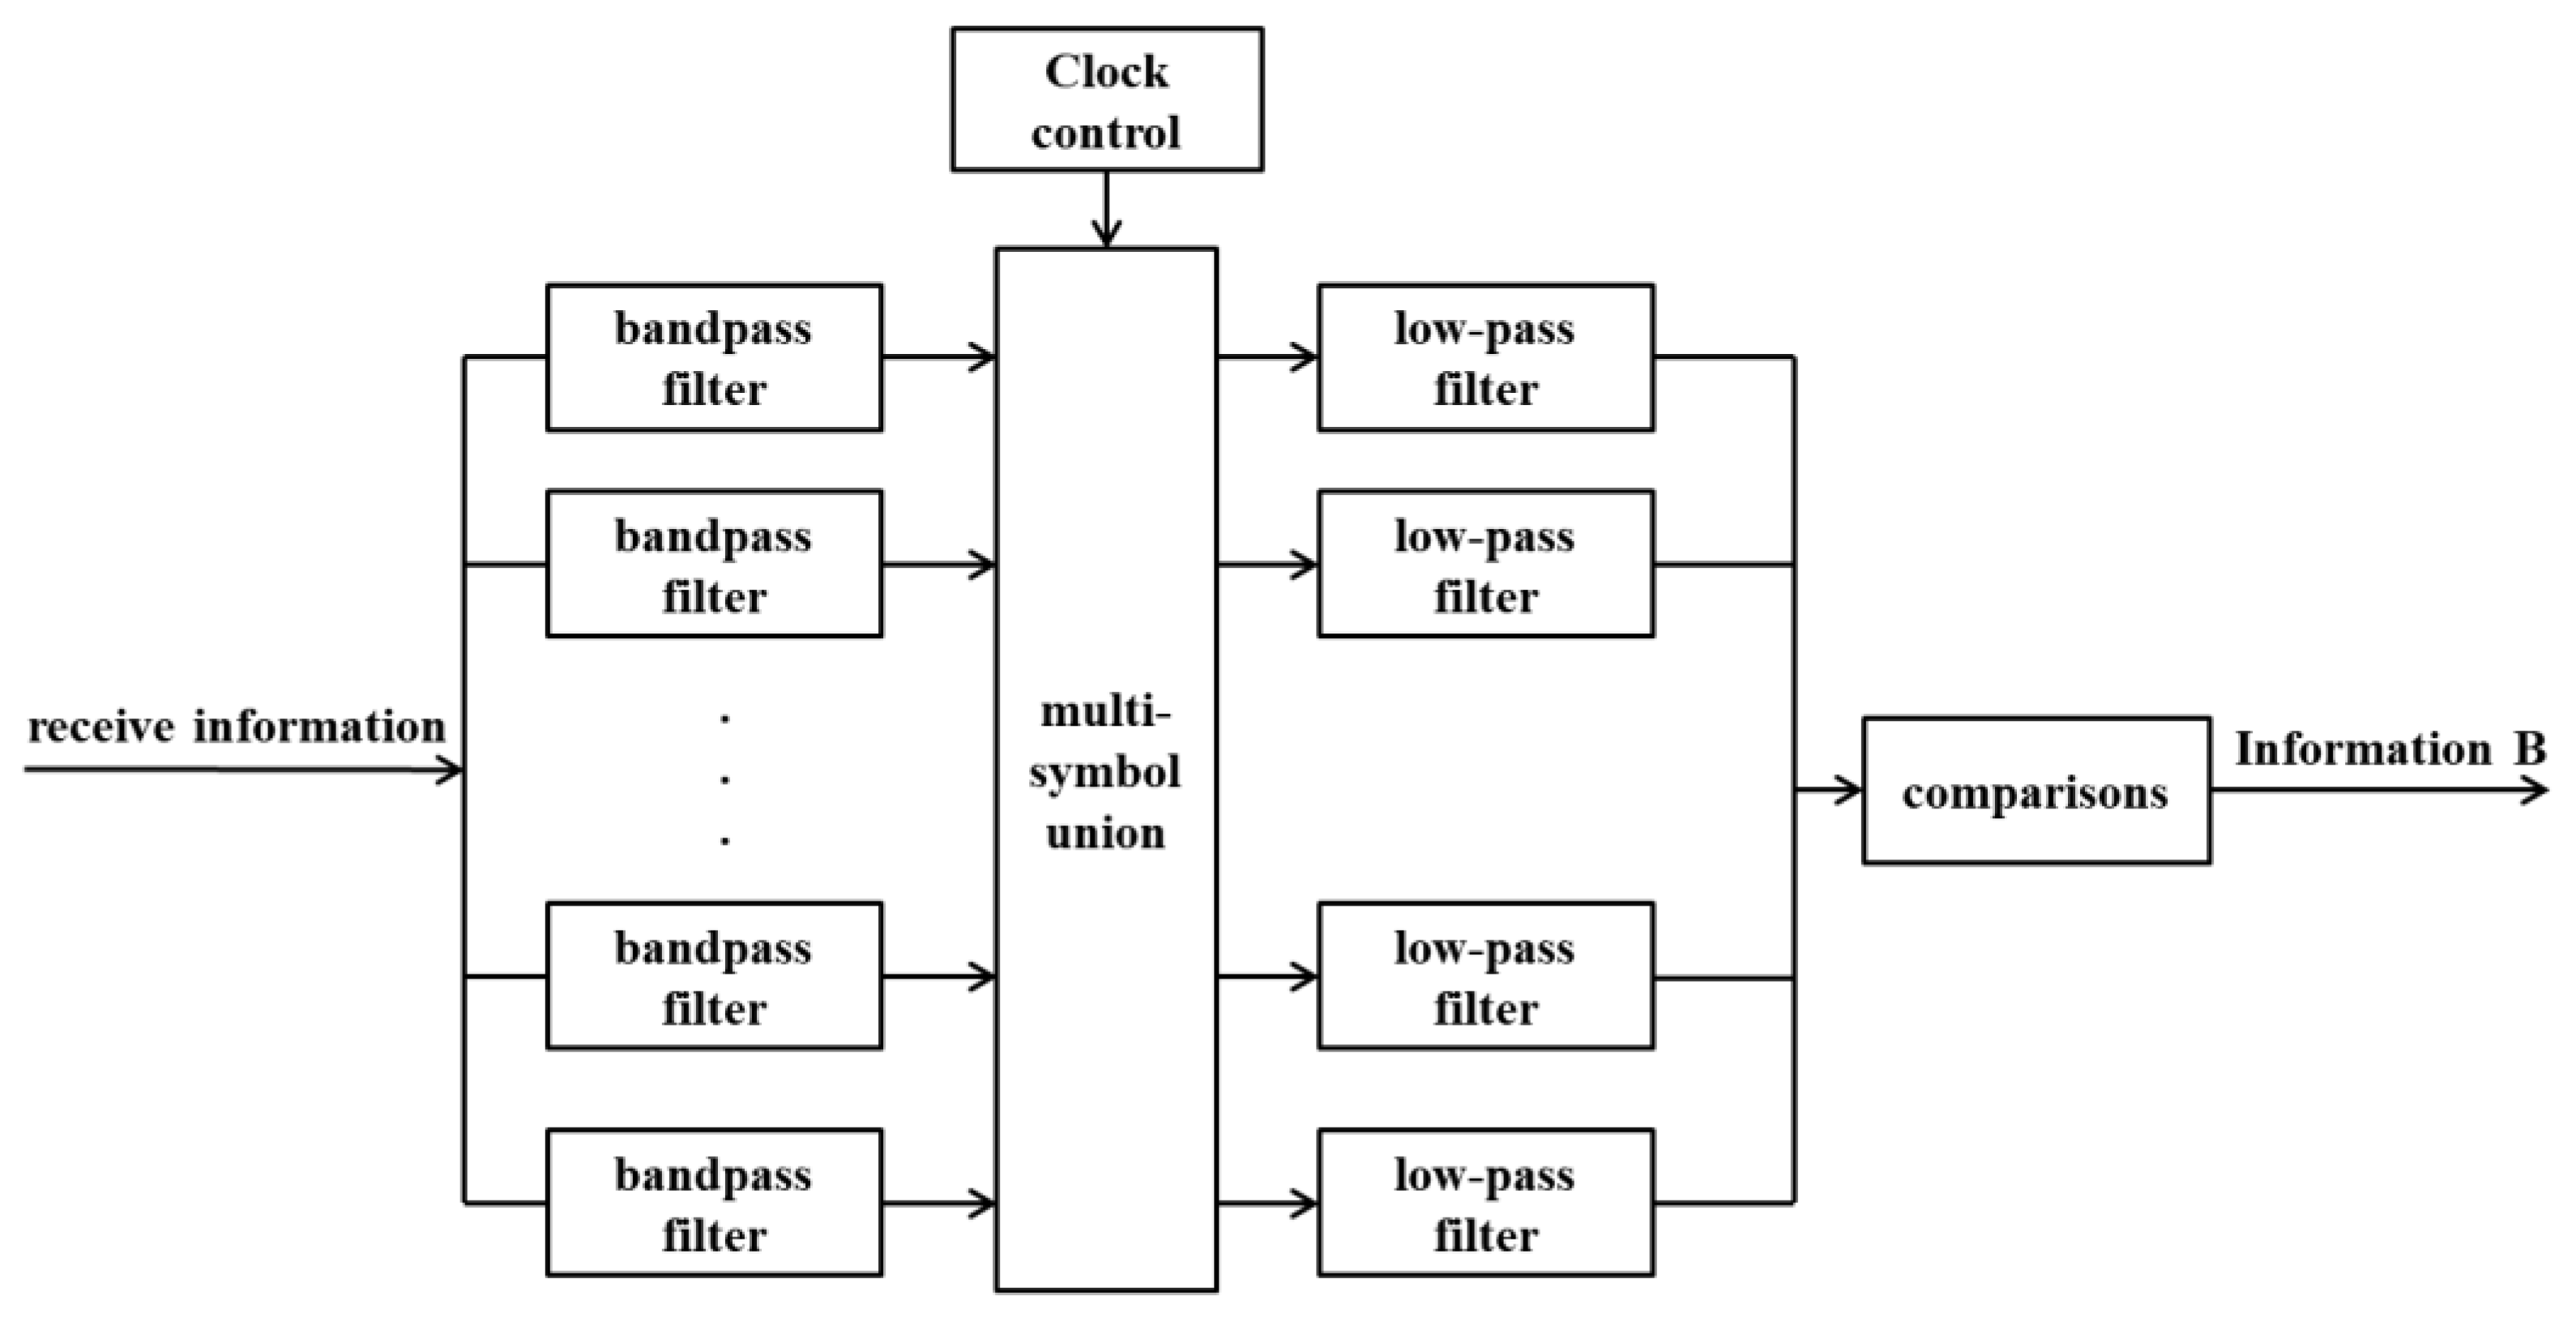
The demodulation of Information B is equivalent to the demodulation of FSK signals. There are two different methods that can be used to demodulate FSK signals: the coherent demodulation method and the power detector method. When the number of frequency points gradually increases, the demodulation performance of these two methods is similar. However, the power detector method is relatively simple, so this paper adopts the envelope detector method. The realization block diagram is shown in Figure 6.
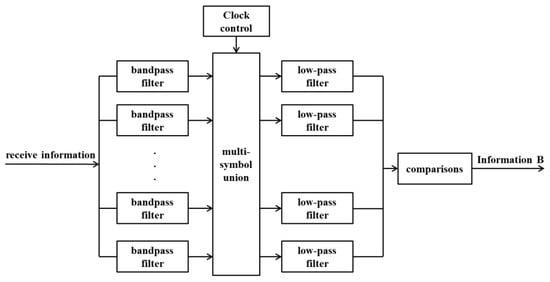
Figure 6.
Block diagram of the power detection method.
In order to improve the received signal-to-noise ratio of Information B, the BER can be reduced at the expense of the information rate by using a joint detector judgement of multiple symbols, in which the J frequency-hopping symbols are jointly estimated as one Information B symbol.
When J = 16, the Information B symbol keying selects the carrier frequency group of 16 frequency points, and Information B is recovered using the envelope detection method according to the correspondence between different frequency groups and Information B, as shown in Figure 7.
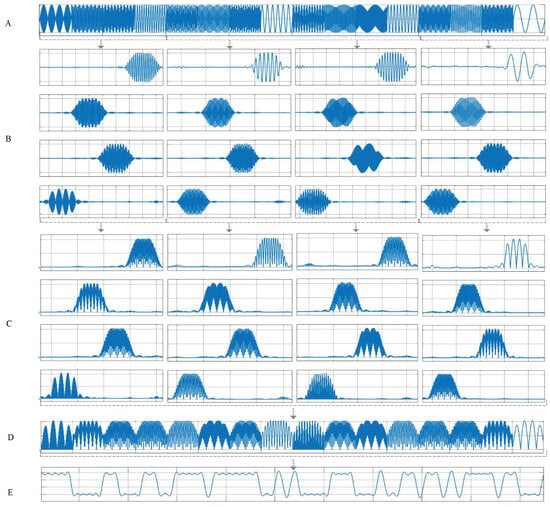
Figure 7.
Schematic diagram of joint envelope detection for J = 16 symbols.
Figure 7A shows a received signal containing multiple carrier frequencies, and Figure 7B shows the received signal passing through bandpass filters at different frequencies to separate the different frequency carriers, respectively. As shown in Figure 7C, the signals are integrated to take the absolute value, and Figure 7D,E show the combined signals and the correspondence with Information B in accordance with Information B, respectively. Finally, the baseband Information B is recovered by the low-pass filter.
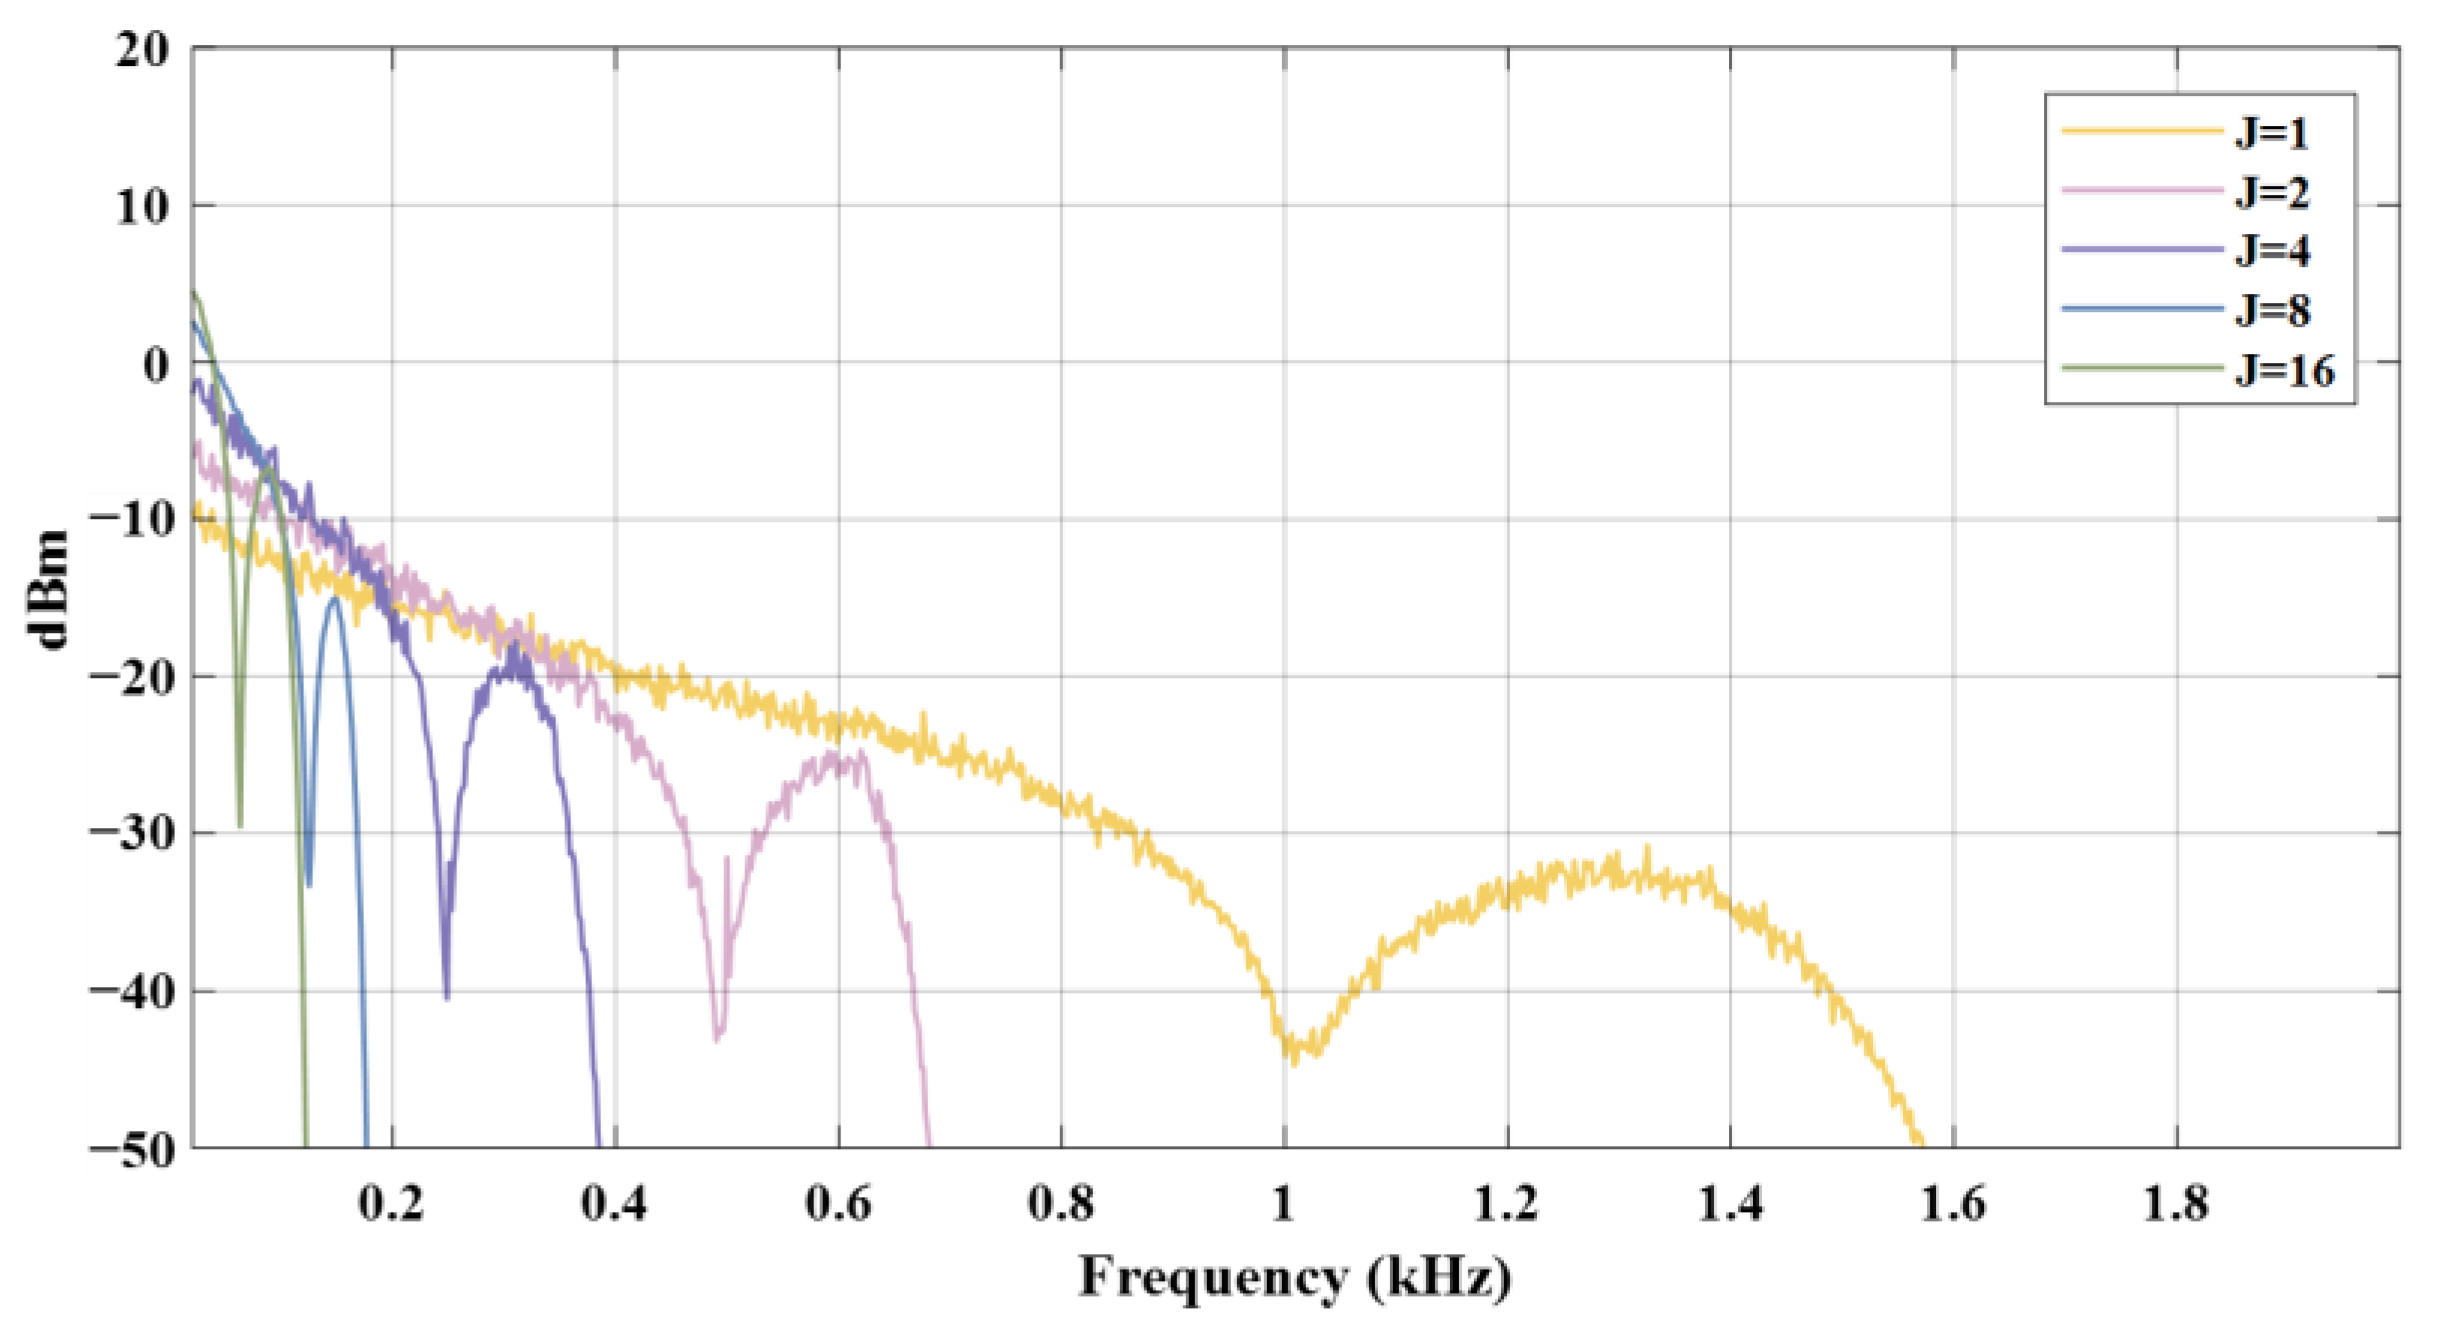
Through simulation, the spectra after the multi-symbol joint detector for J of one, two, four, eight, and sixteen are shown in Figure 8. The signal power spectral densities are all enhanced with respect to the J = 1 signal, and the power spectral density values at the highest points are enhanced by 4 dB, 9 dB, 12 dB, and 15 dB, respectively.
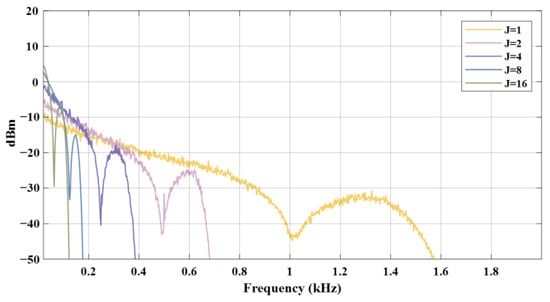
Figure 8.
Spectrum after joint multi-symbol wave detection.
- Clock Synchronization
For the Gardner algorithm [26], each code element needs two sampling points, and each code element cycle only needs to calculate one timing error. The Gardner algorithm structure is shown in Figure 9.
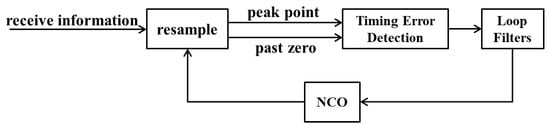
Figure 9.
Gardner structure.
At the receiving end of Figure 2, the I and Q path baseband signals of Information A are sampled at twice the code word rate to generate two paths: the peak point and the over-zero point. After timing error detection is performed, the timing error information is fed into the loop filter and the phase of the resampled clock signal is controlled by the NCO. The NCO output is also used for envelope detection and carrier reconstruction for Information B.
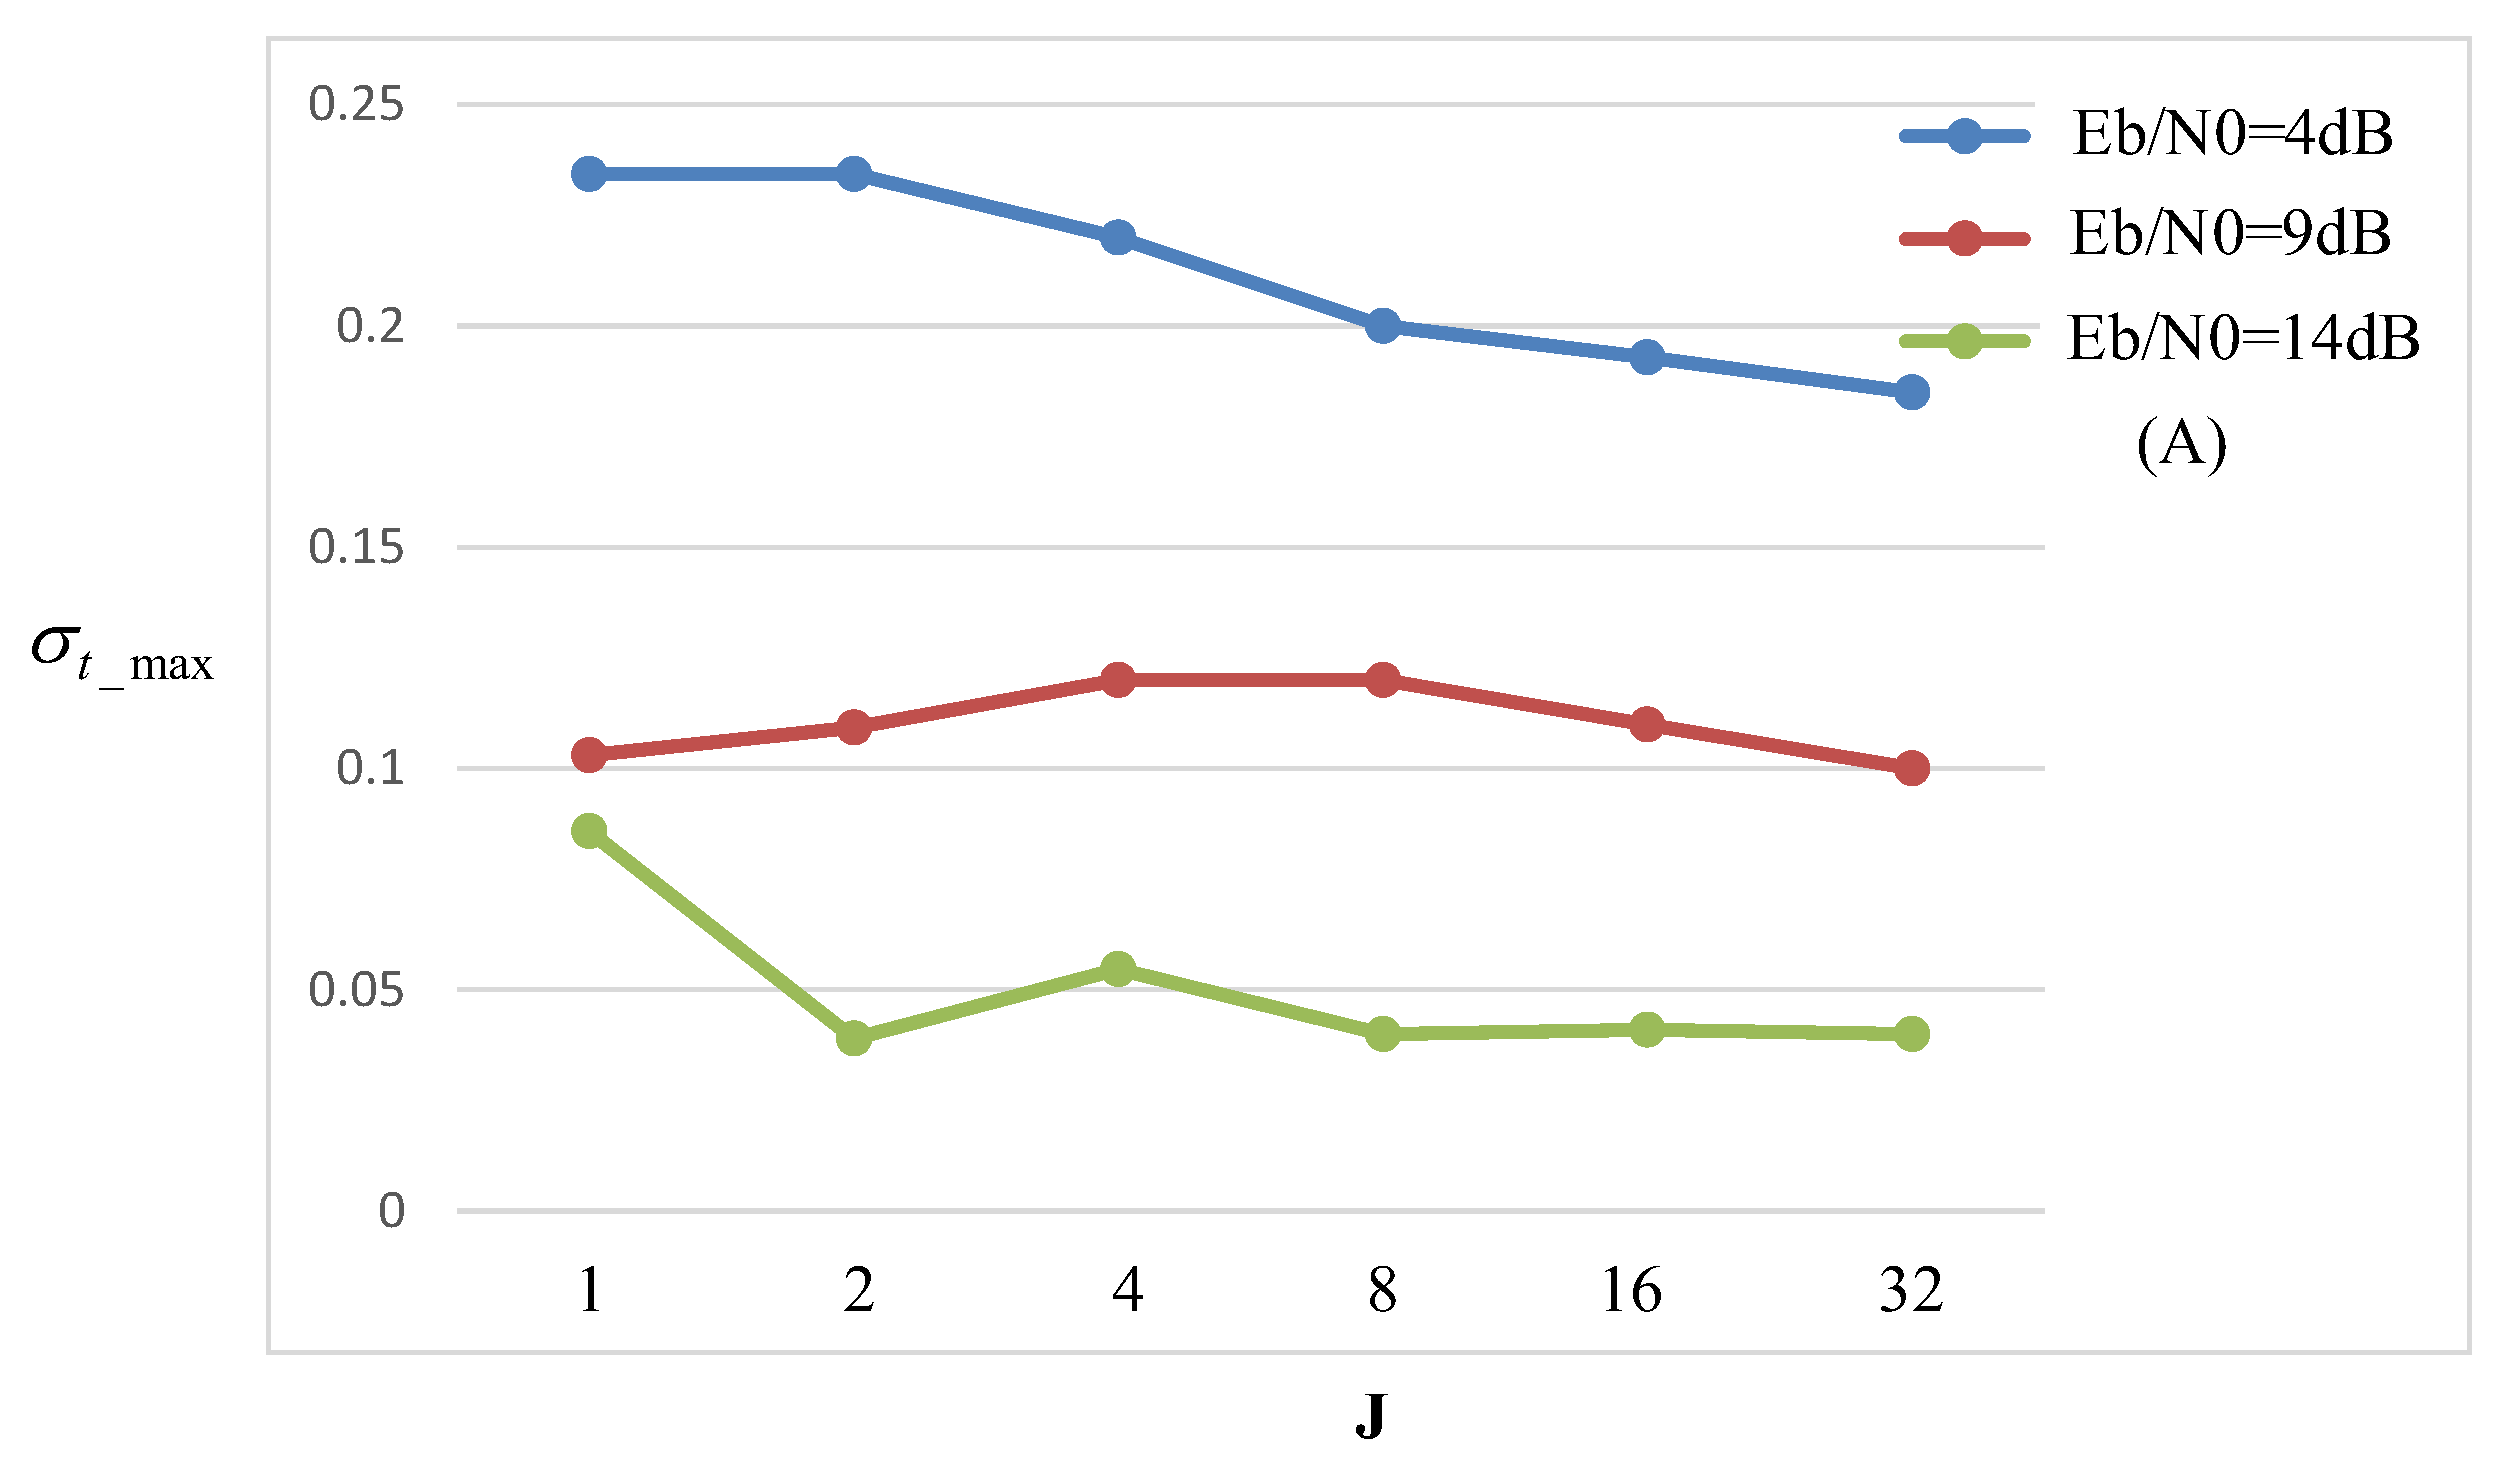
When Information B is not transmitted, the system receiver is equivalent to a general BPSK demodulator, and the clock synchronization link is normally locked. In this paper, we focus on the work of the clock loop after the normal transmission of Information A, the moment at which Information B begins to be transmitted (the moment when the carrier begins to hop), and the impact of Information B on the clock loop in the presence of different J values of the error code. The clock loop locking condition is represented by the clock phase offset statistics’ mean square difference value and the clock phase maximum offset value.
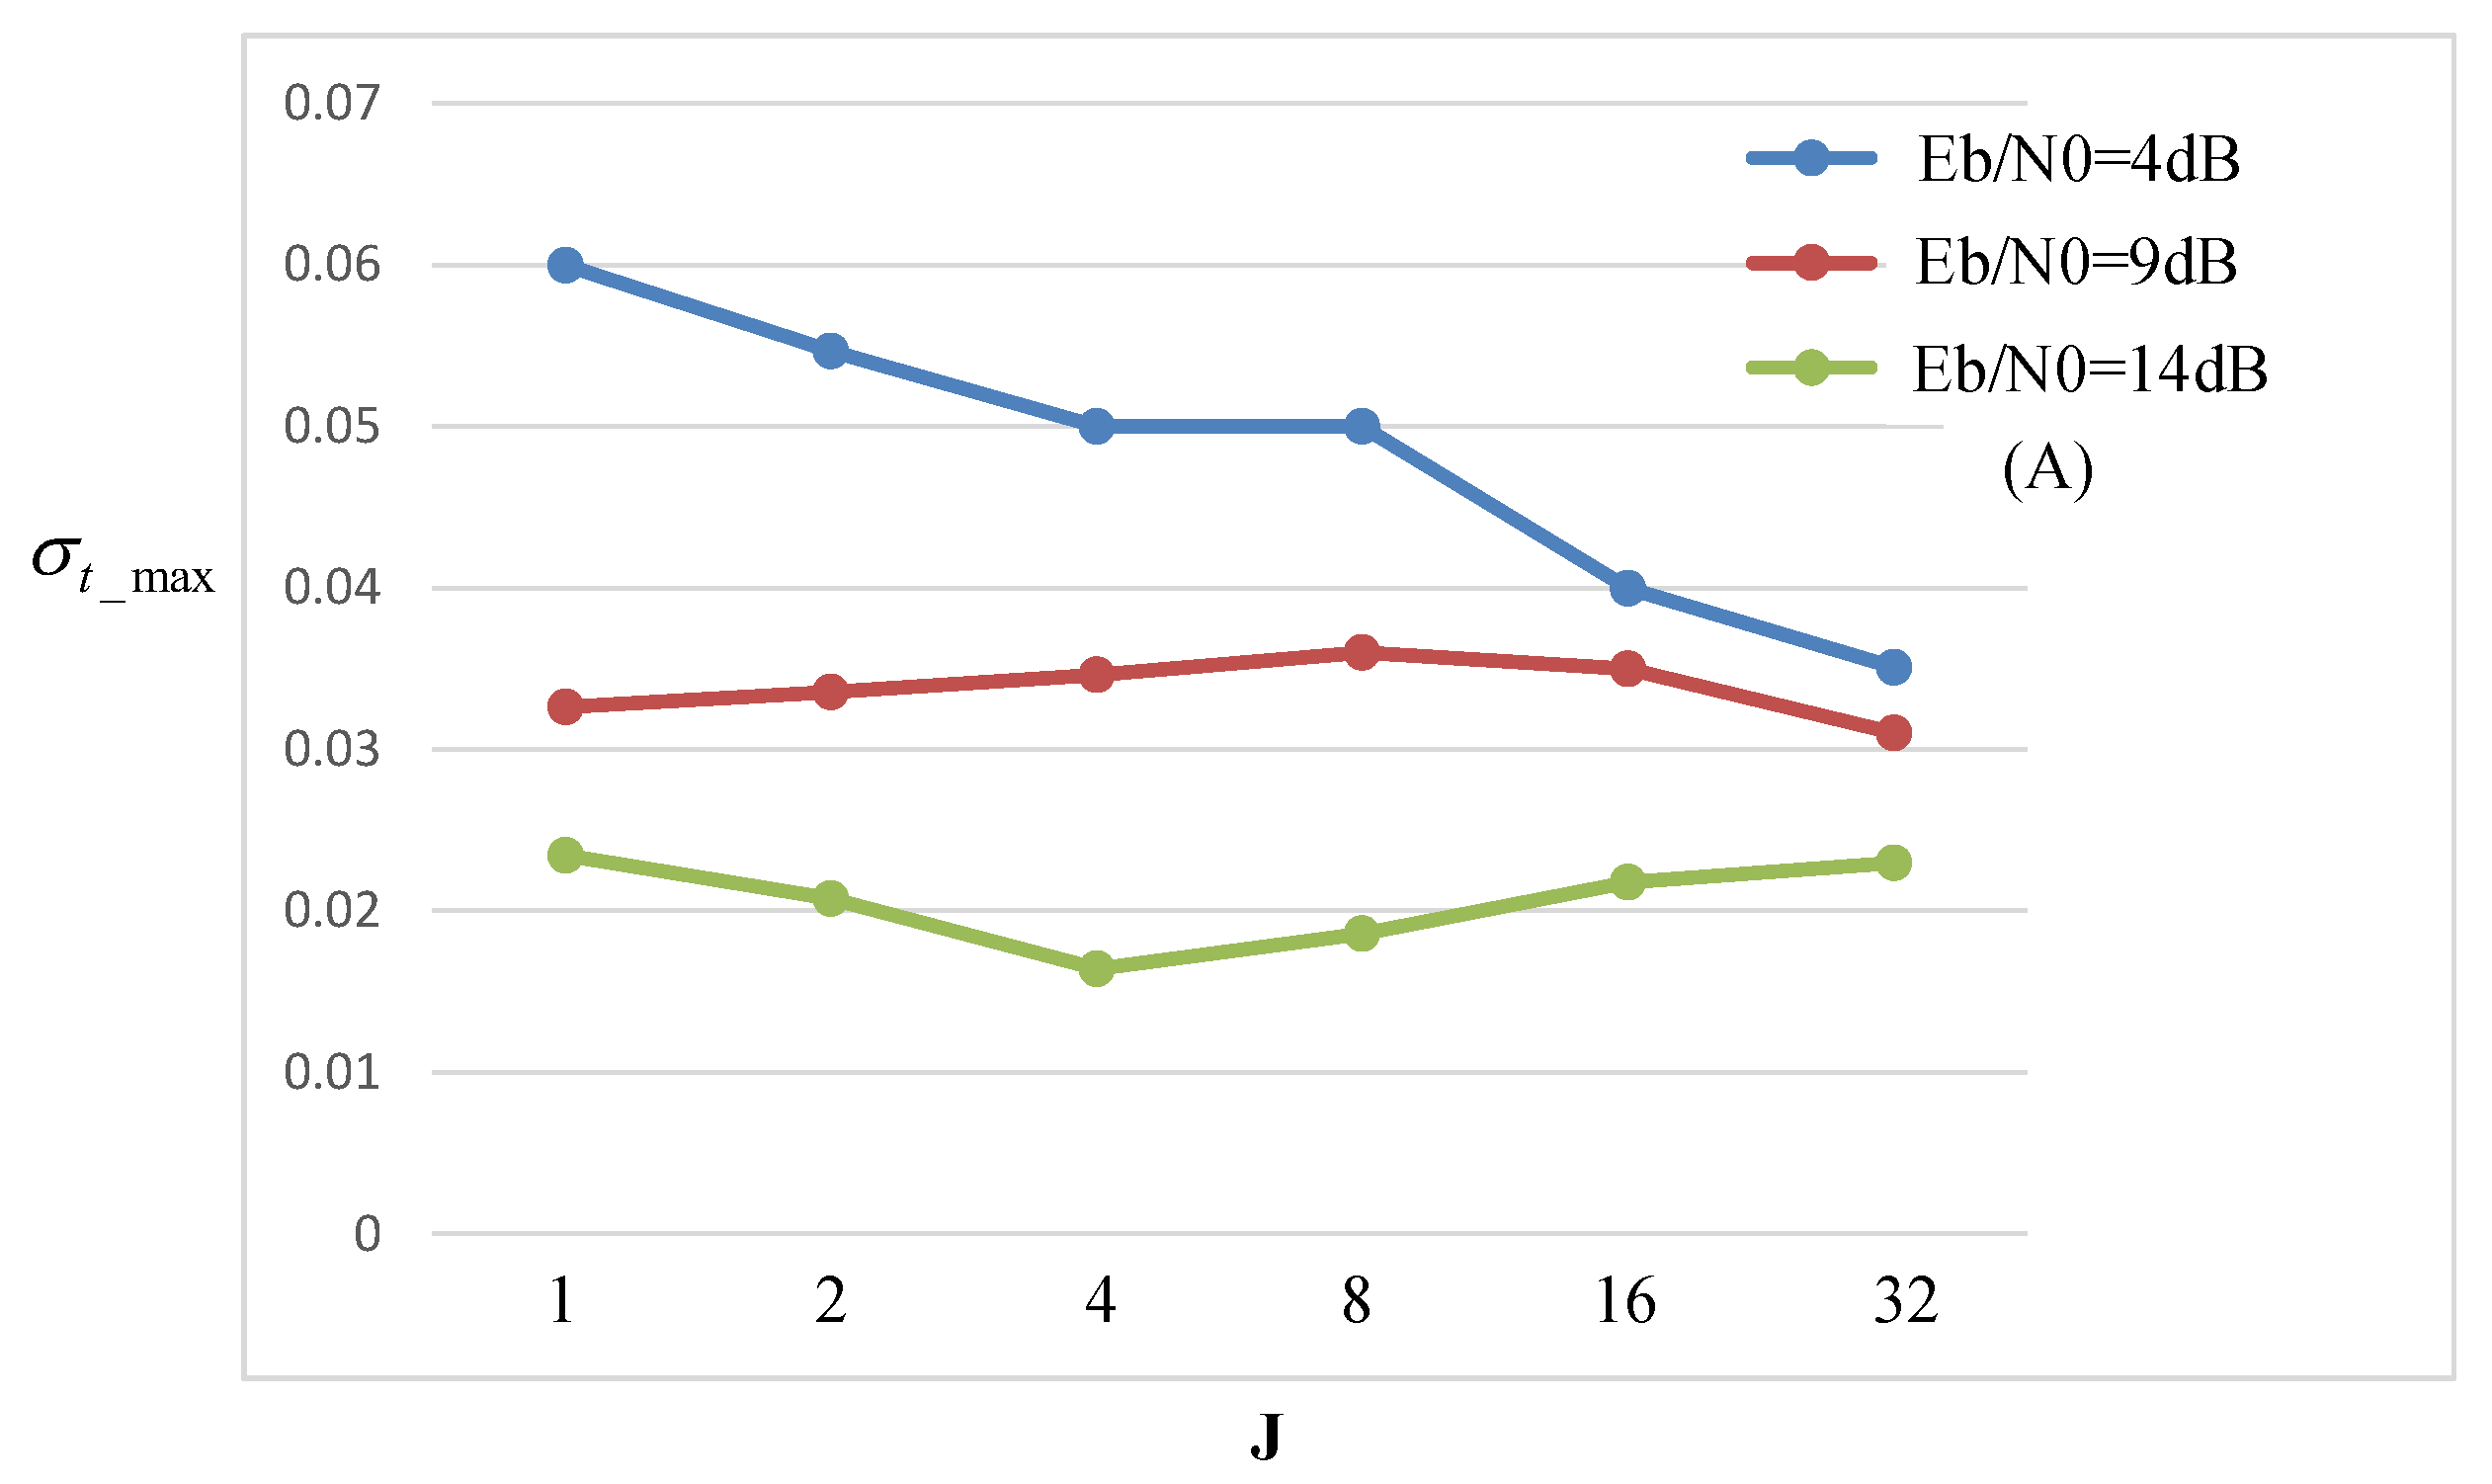
The quality of clock recovery varies for different Eb/N0 values for Information A and different J values for Information B. The quality of clock recovery is expressed as the average frequency shift difference of the clock-phase error signal and the maximum offset value of the clock phase. The clock recovery quality is expressed in terms of the average frequency shift difference, , of the clock-phase error signal and the maximum shift value, , of the clock phase, where is the error value between the clock recovered from the timing loop and the standard clock, and is the average value of .
denotes the maximum offset of the clock from the start of transmission of Information B
Table 1, Table 2 and Table 3 show the standard deviation values of the clock-phase shift and the maximum shift values of the clock phase within 10 s after the start of frequency hopping, obtained via simulation for different values of J at different SNRs, where the information rate of Information A is 1 kbps, the frequency-hopping points are 64, and the Eb/N0 of Information A is 4 dB, 9 dB, and 14 dB. The offset value is normalized by the hopping period ; a maximum offset value of 0.11 is offset by 0.11 times the hopping period.

Table 1.
Clock-locked data for Eb/N0 = 4 dB with different J values.
Table 2.
Clock-locked data for Eb/N0 = 9 dB with different J values.
Table 3.
Clock-locked data for Eb/N0 = 14 dB with different J values.
Figure 10 and Figure 11 present the clock locking for J values of 1, 2, 4, 8, 16, and 32 for the Eb/N0 values of Information A of 4 dB,9 dB, and 14 dB, respectively. Figure 10 shows the standard deviation of the clock-phase offset and Figure 11 shows the maximum clock-phase offset. For the same J value, the clock-locking quality becomes progressively better with the increase in the Eb/N0 values; the effect of the J value on the clock-locking quality is weaker than that of Eb/N0.
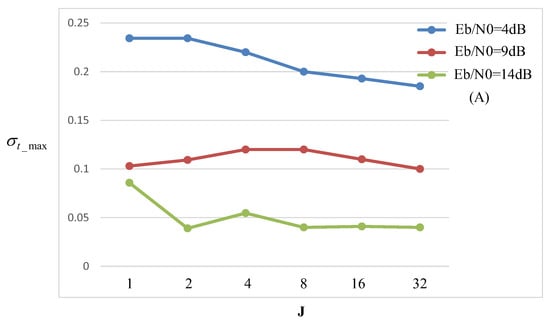
Figure 10.
Standard deviation of clock-phase shift for different Eb/N0 values and different values of J.
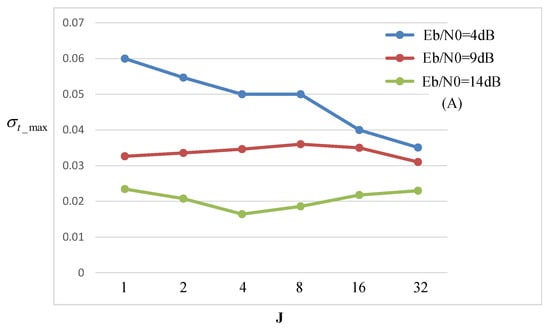
Figure 11.
Maximum shift of clock-phase for different Eb/N0 values and different values of J.
- Carrier Synchronization
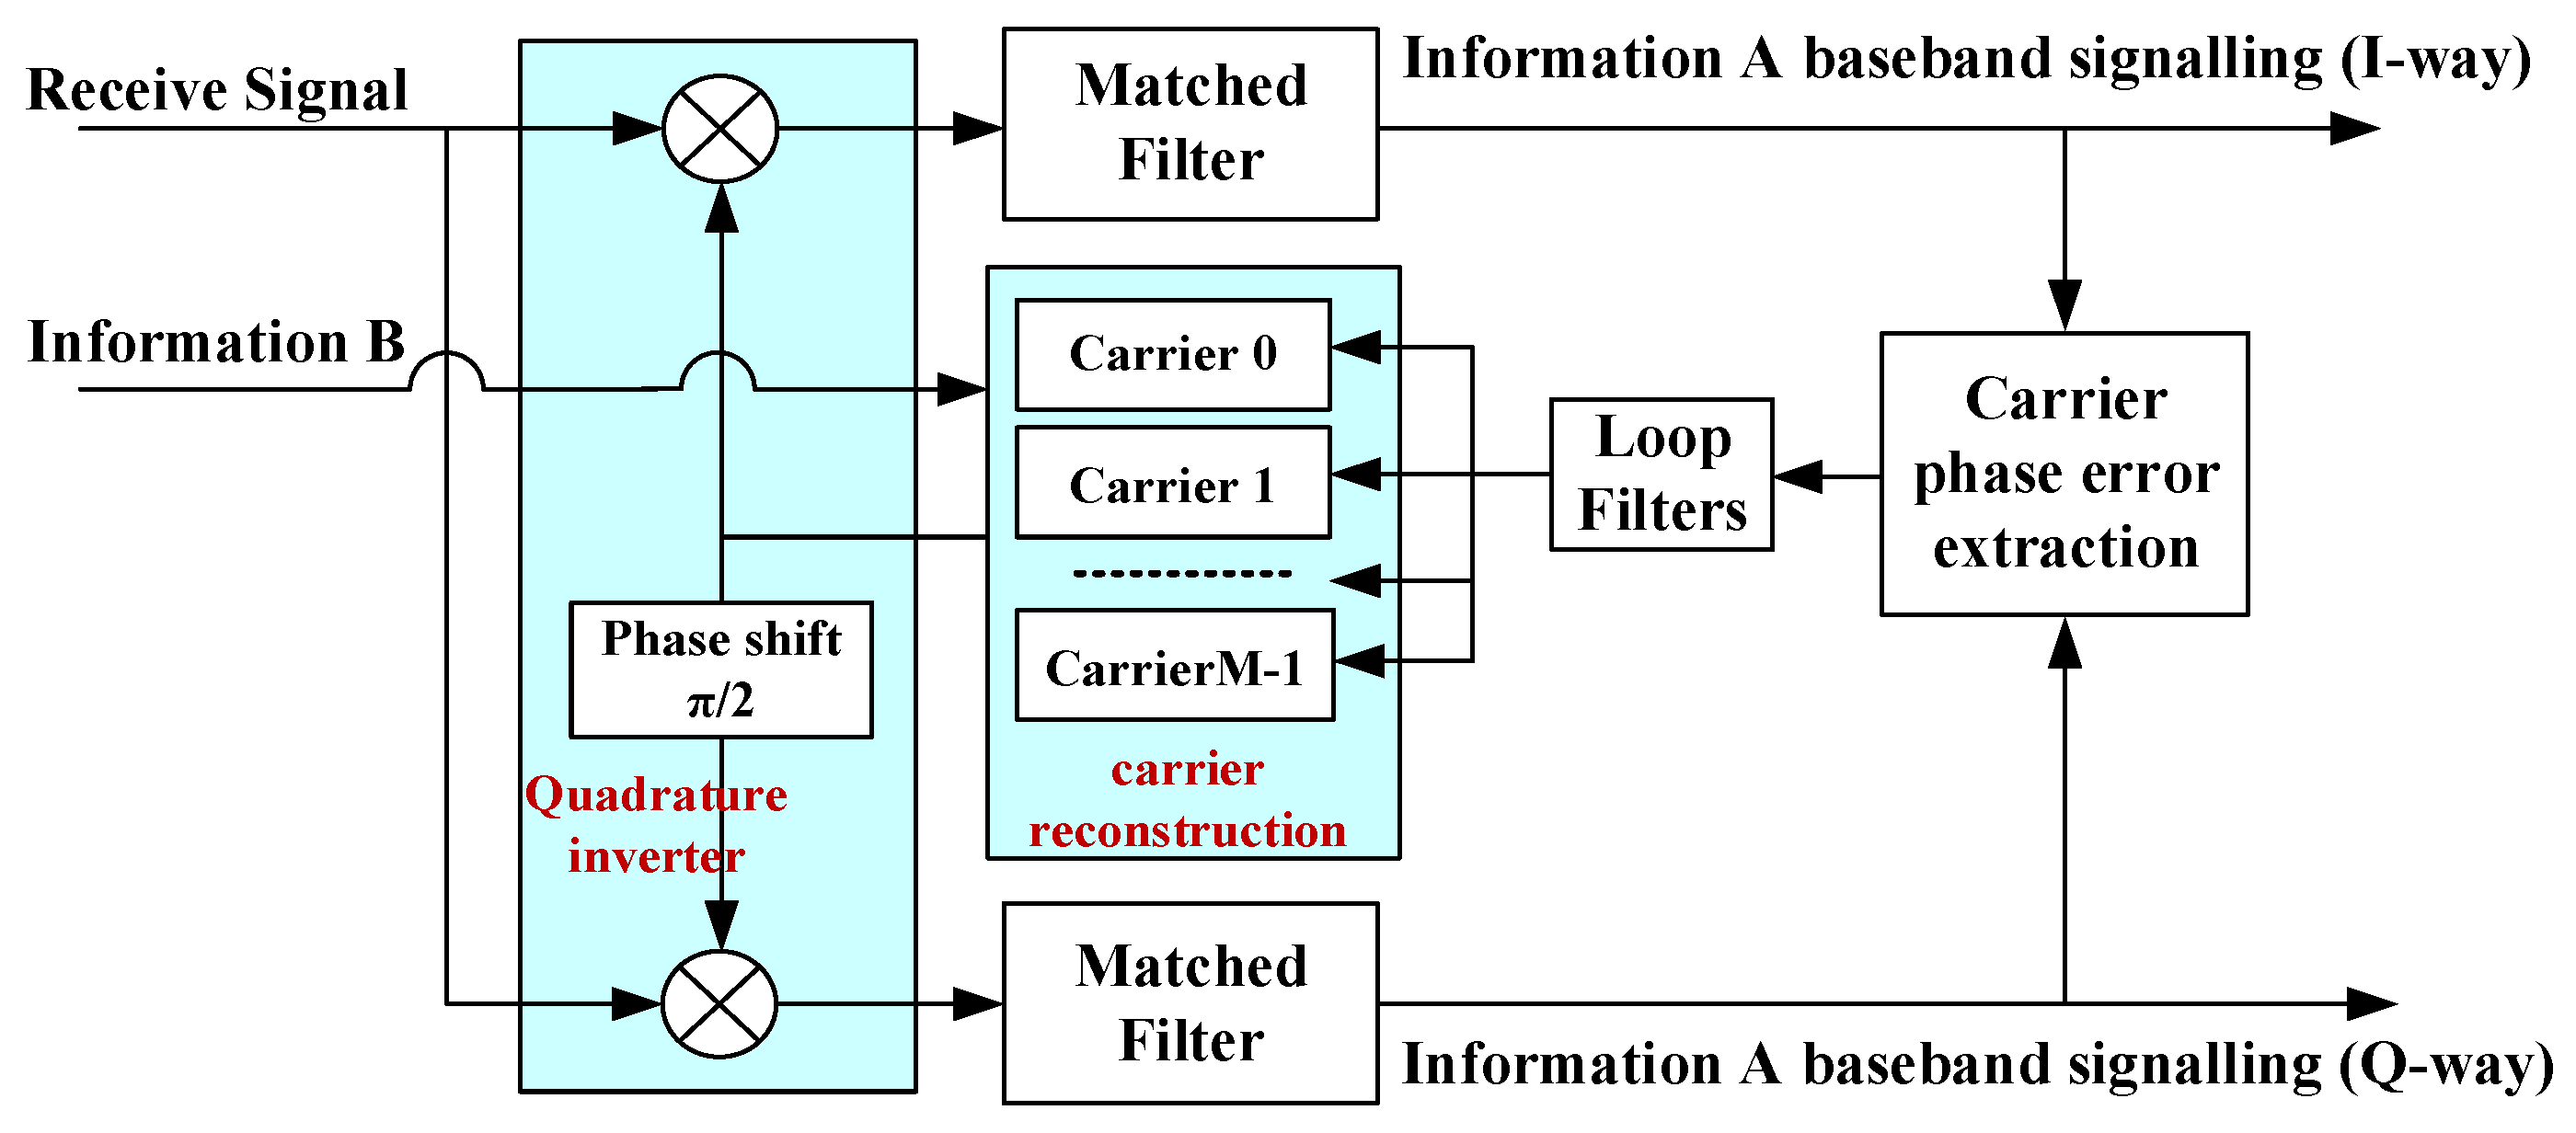
The carrier recovery uses the Costas ring [27], which has a block diagram, as shown in Figure 12. It mainly consists of a phase detector, a numerically controlled oscillator, and a loop filter. The phase detector is used to identify the phase, i.e., to track the phase information, which is generally realized with a multiplier. The quadrature frequency converter module multiplies the received IF signal and the local carrier to form I- and Q-way baseband signals. The matched filter module filters out the high harmonics of the baseband signal. The carrier phase error extraction and loop filter cooperate to form the carrier-phase error signal, which controls the carrier signal in the carrier reconstruction module for phase adjustment; the carrier reconstruction module carries out carrier selection and reconstruction according to Information B, as well as the mapping relationship between Information B and the carriers of different frequency-hopping points.
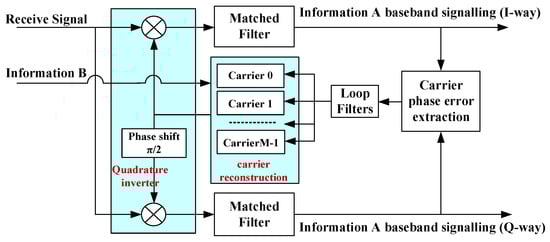
Figure 12.
Costas ring structure diagram.
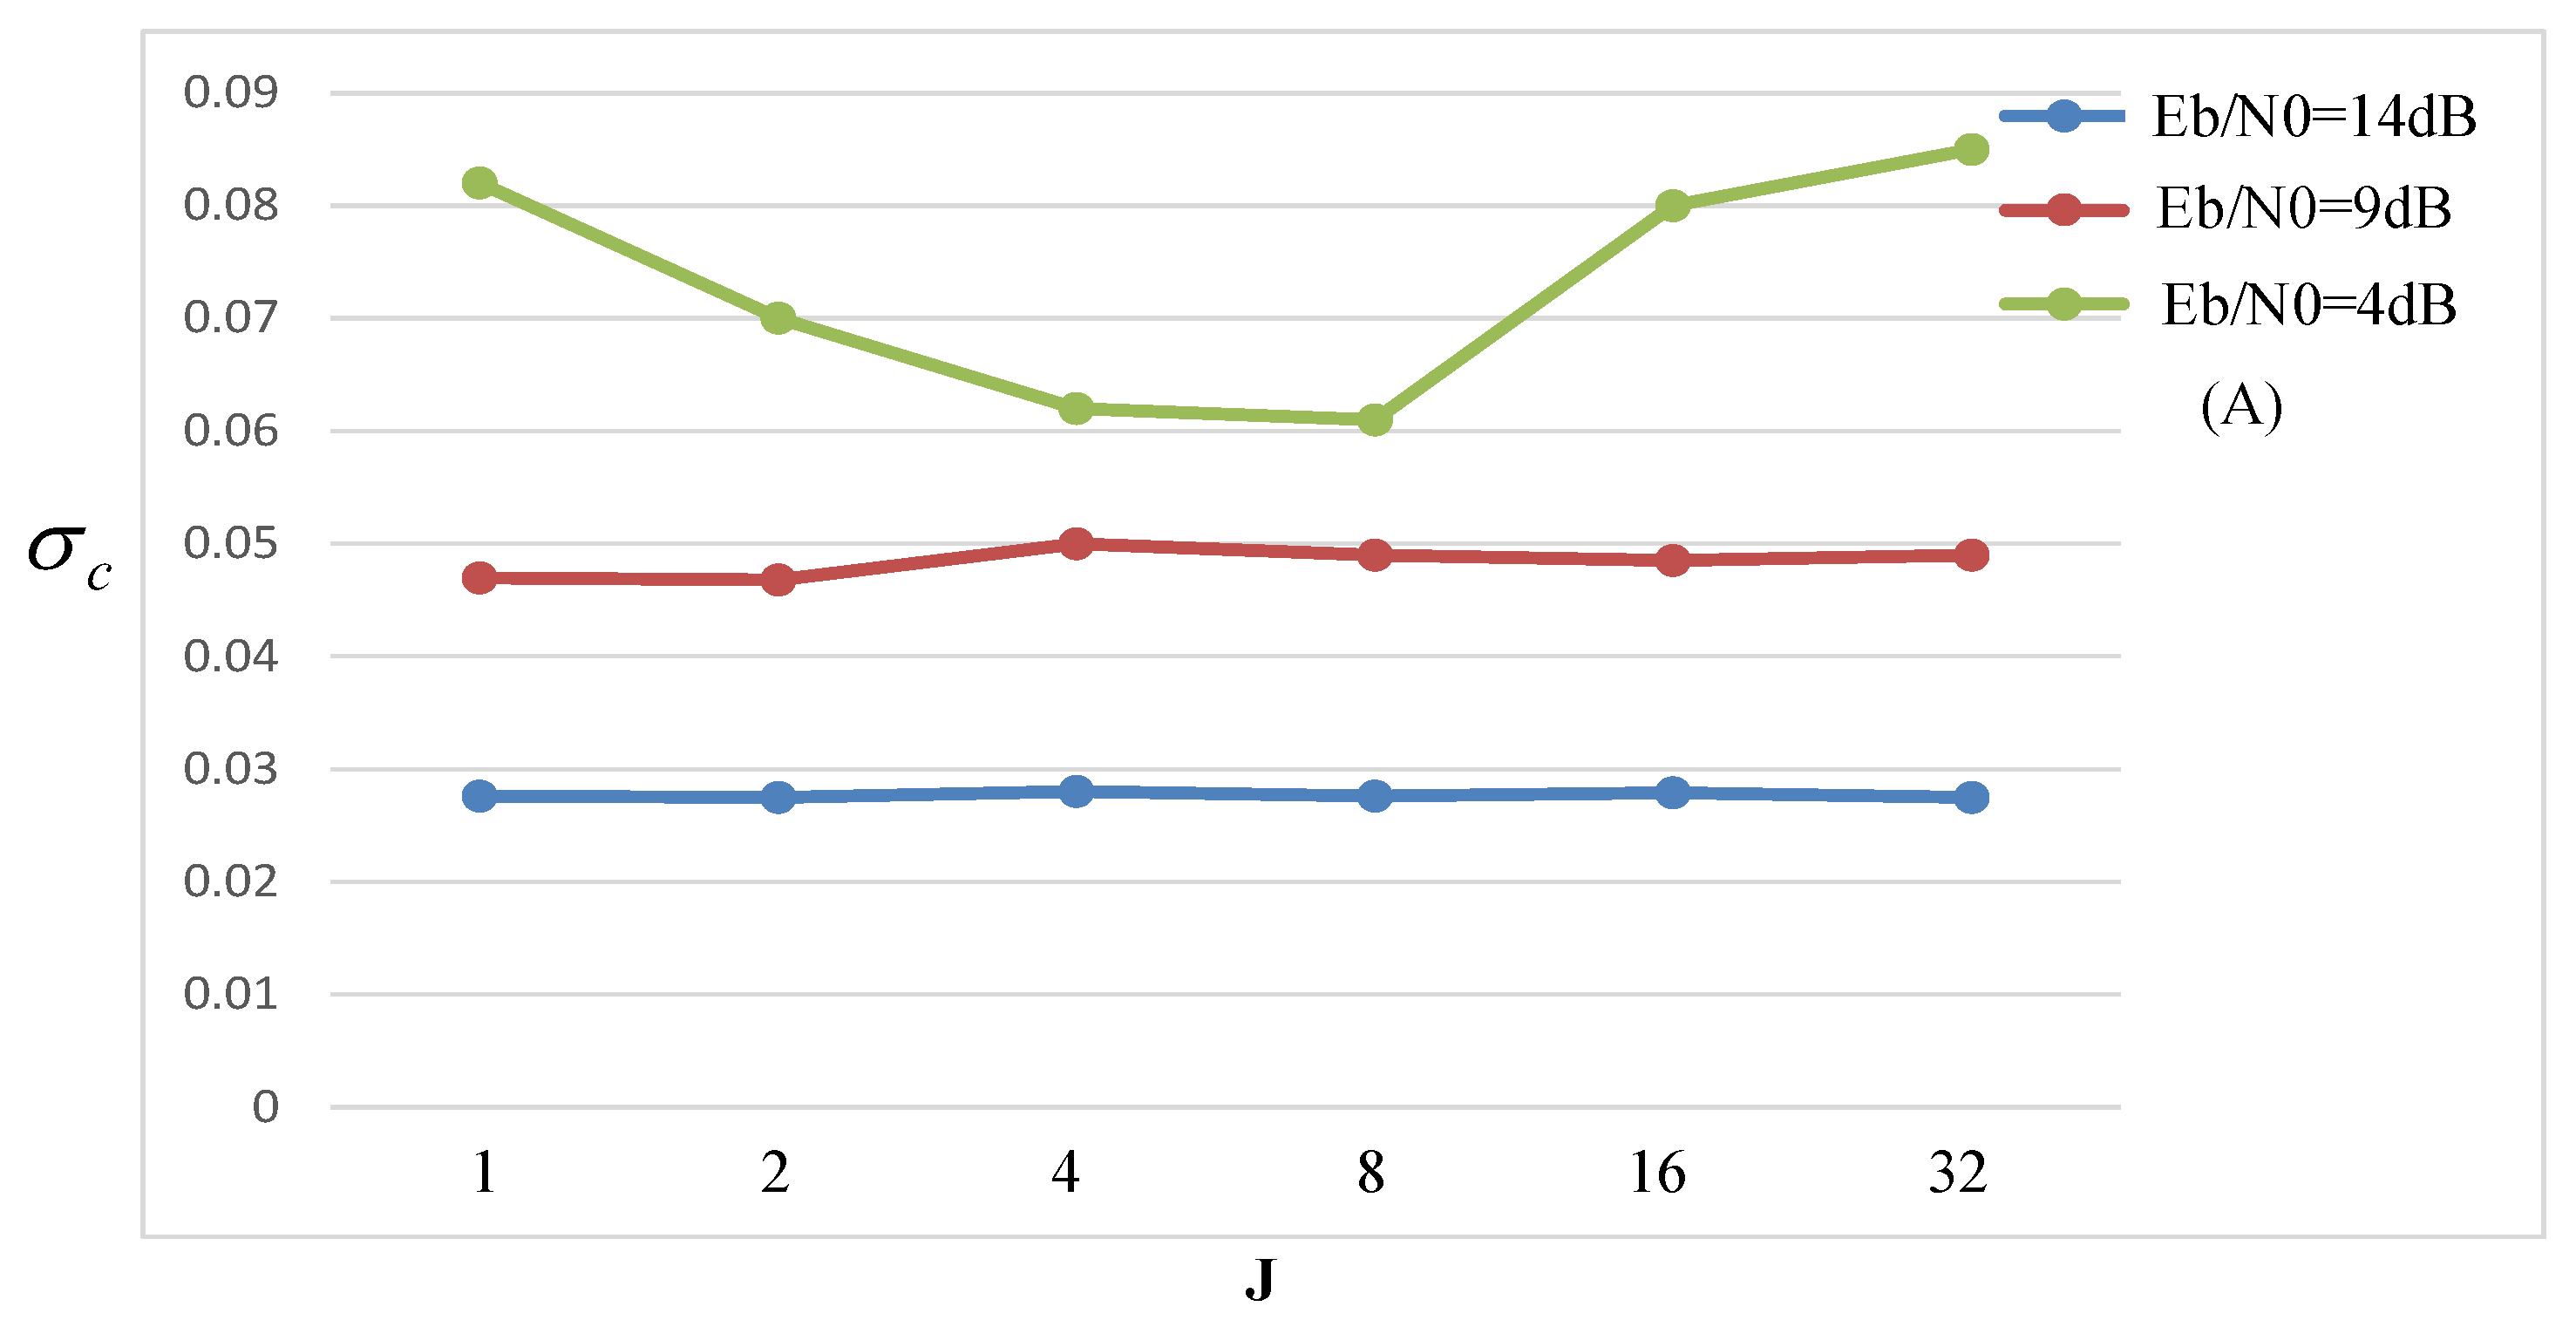
The quality of carrier recovery varies for different Eb/N0 values for Information A and different J values for Information B. The quality of carrier recovery is expressed as the average offset difference, , of the carrier-phase error signal, where is the error between the carrier recovered from the carrier loop and the carrier at the transmitter, and is the average value of .
Figure 13 shows the variation in the standard deviation of the carrier-phase error signal for the J values of 1, 2, 4, 8, 16, and 32 for the Eb/N0 values of Information A of 4, 9, and 14 dB, respectively. In addition, since the error code of Information B creates errors in the reconstructed carrier, which also leads to degradation in the quality of the carrier recovery, the error case of the reconstructed carrier is also presented in Figure 13, denoted as , where denotes the carrier used for modulation at the transmitter and denotes the carrier recovered from the loop to be used for carrier reconstruction.
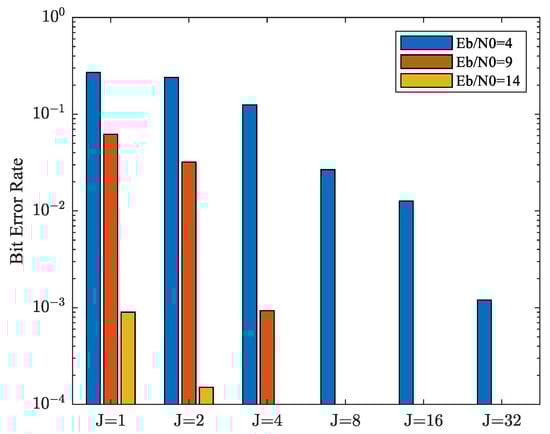
Figure 13.
Quality of carrier recovery under different conditions.
Figure 13 is a histogram of the error probability of the reconstructed carrier, and it can be seen that the error probability of the reconstructed carrier gradually decreases as the Eb/N0 value of Information A gradually increases with the same J value. At the same Eb/N0 value, the error probability of the reconstructed carrier decreases as the value of J increases.
Figure 14 shows the variation in the standard deviation of the carrier phase error signal for the J values of 1, 2, 4, 8, 16, and 32 for the Eb/N0 values of Information A of 4, 9, and 14 dB, respectively. As shown in Figure 14, the carrier recovery quality varies with the Eb/N0 value of Information A. At an Eb/N0 value of 14 dB for Information A, the value of varies between 0.025 and 0.028. At an Eb/N0 value of 9 dB for Information A, varies between 0.046 and 0.05, and the carrier jitter worsens by a factor of two, relative to the previous condition. At an Eb/N0 value of 14 dB for Information A, varies between 0.07 and 0.08, and the carrier jitter deteriorates further. Additionally, the carrier recovery quality is not sensitive to the value of J or the number of hopping cycles occupied by the Information B code element, and the carrier quality, , varies within 0.01 between different values of J at the same signal-to-noise ratio, which suggests that carrier recovery can be carried out normally on the basis of the reconstructed carrier.
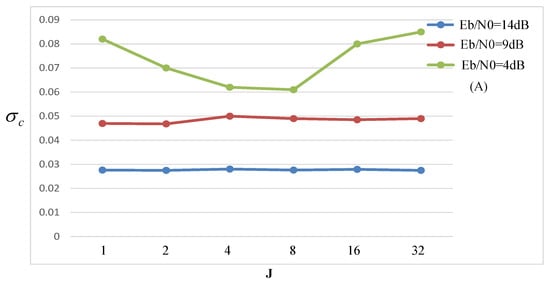
Figure 14.
Variation in carrier recovery quality with J for different signal-to-noise ratios.
3.2. BER Performance Analysis
3.2.1. Information A BER Analysis
Without using channel coding, an information rate of 1 kbps for the Information A signal is generated; this signal is mapped using the BPSK modulation method and then subjected to eightfold sampling square-root ascending cosine-forming filtering to form the Information A baseband signal. The Information A baseband signal and the frequency-hopping carrier signal are multiplied to form the FH capacity boost signal. The FH carrier signal is created using Information B by selecting different frequency carriers according to the keying rule. The simulation specific parameters are shown in Table 4.
Table 4.
BER performance simulation parameters.
After passing through a Gaussian white noise channel, Information A is demodulated and then adjudicated bit by bit. After that, the BER is calculated.
Since the demodulation performance of Information A depends on Information B for carrier reconstruction, the BER of Information B influences the carrier reconstruction effect, which in turn affects the demodulation performance of Information A.
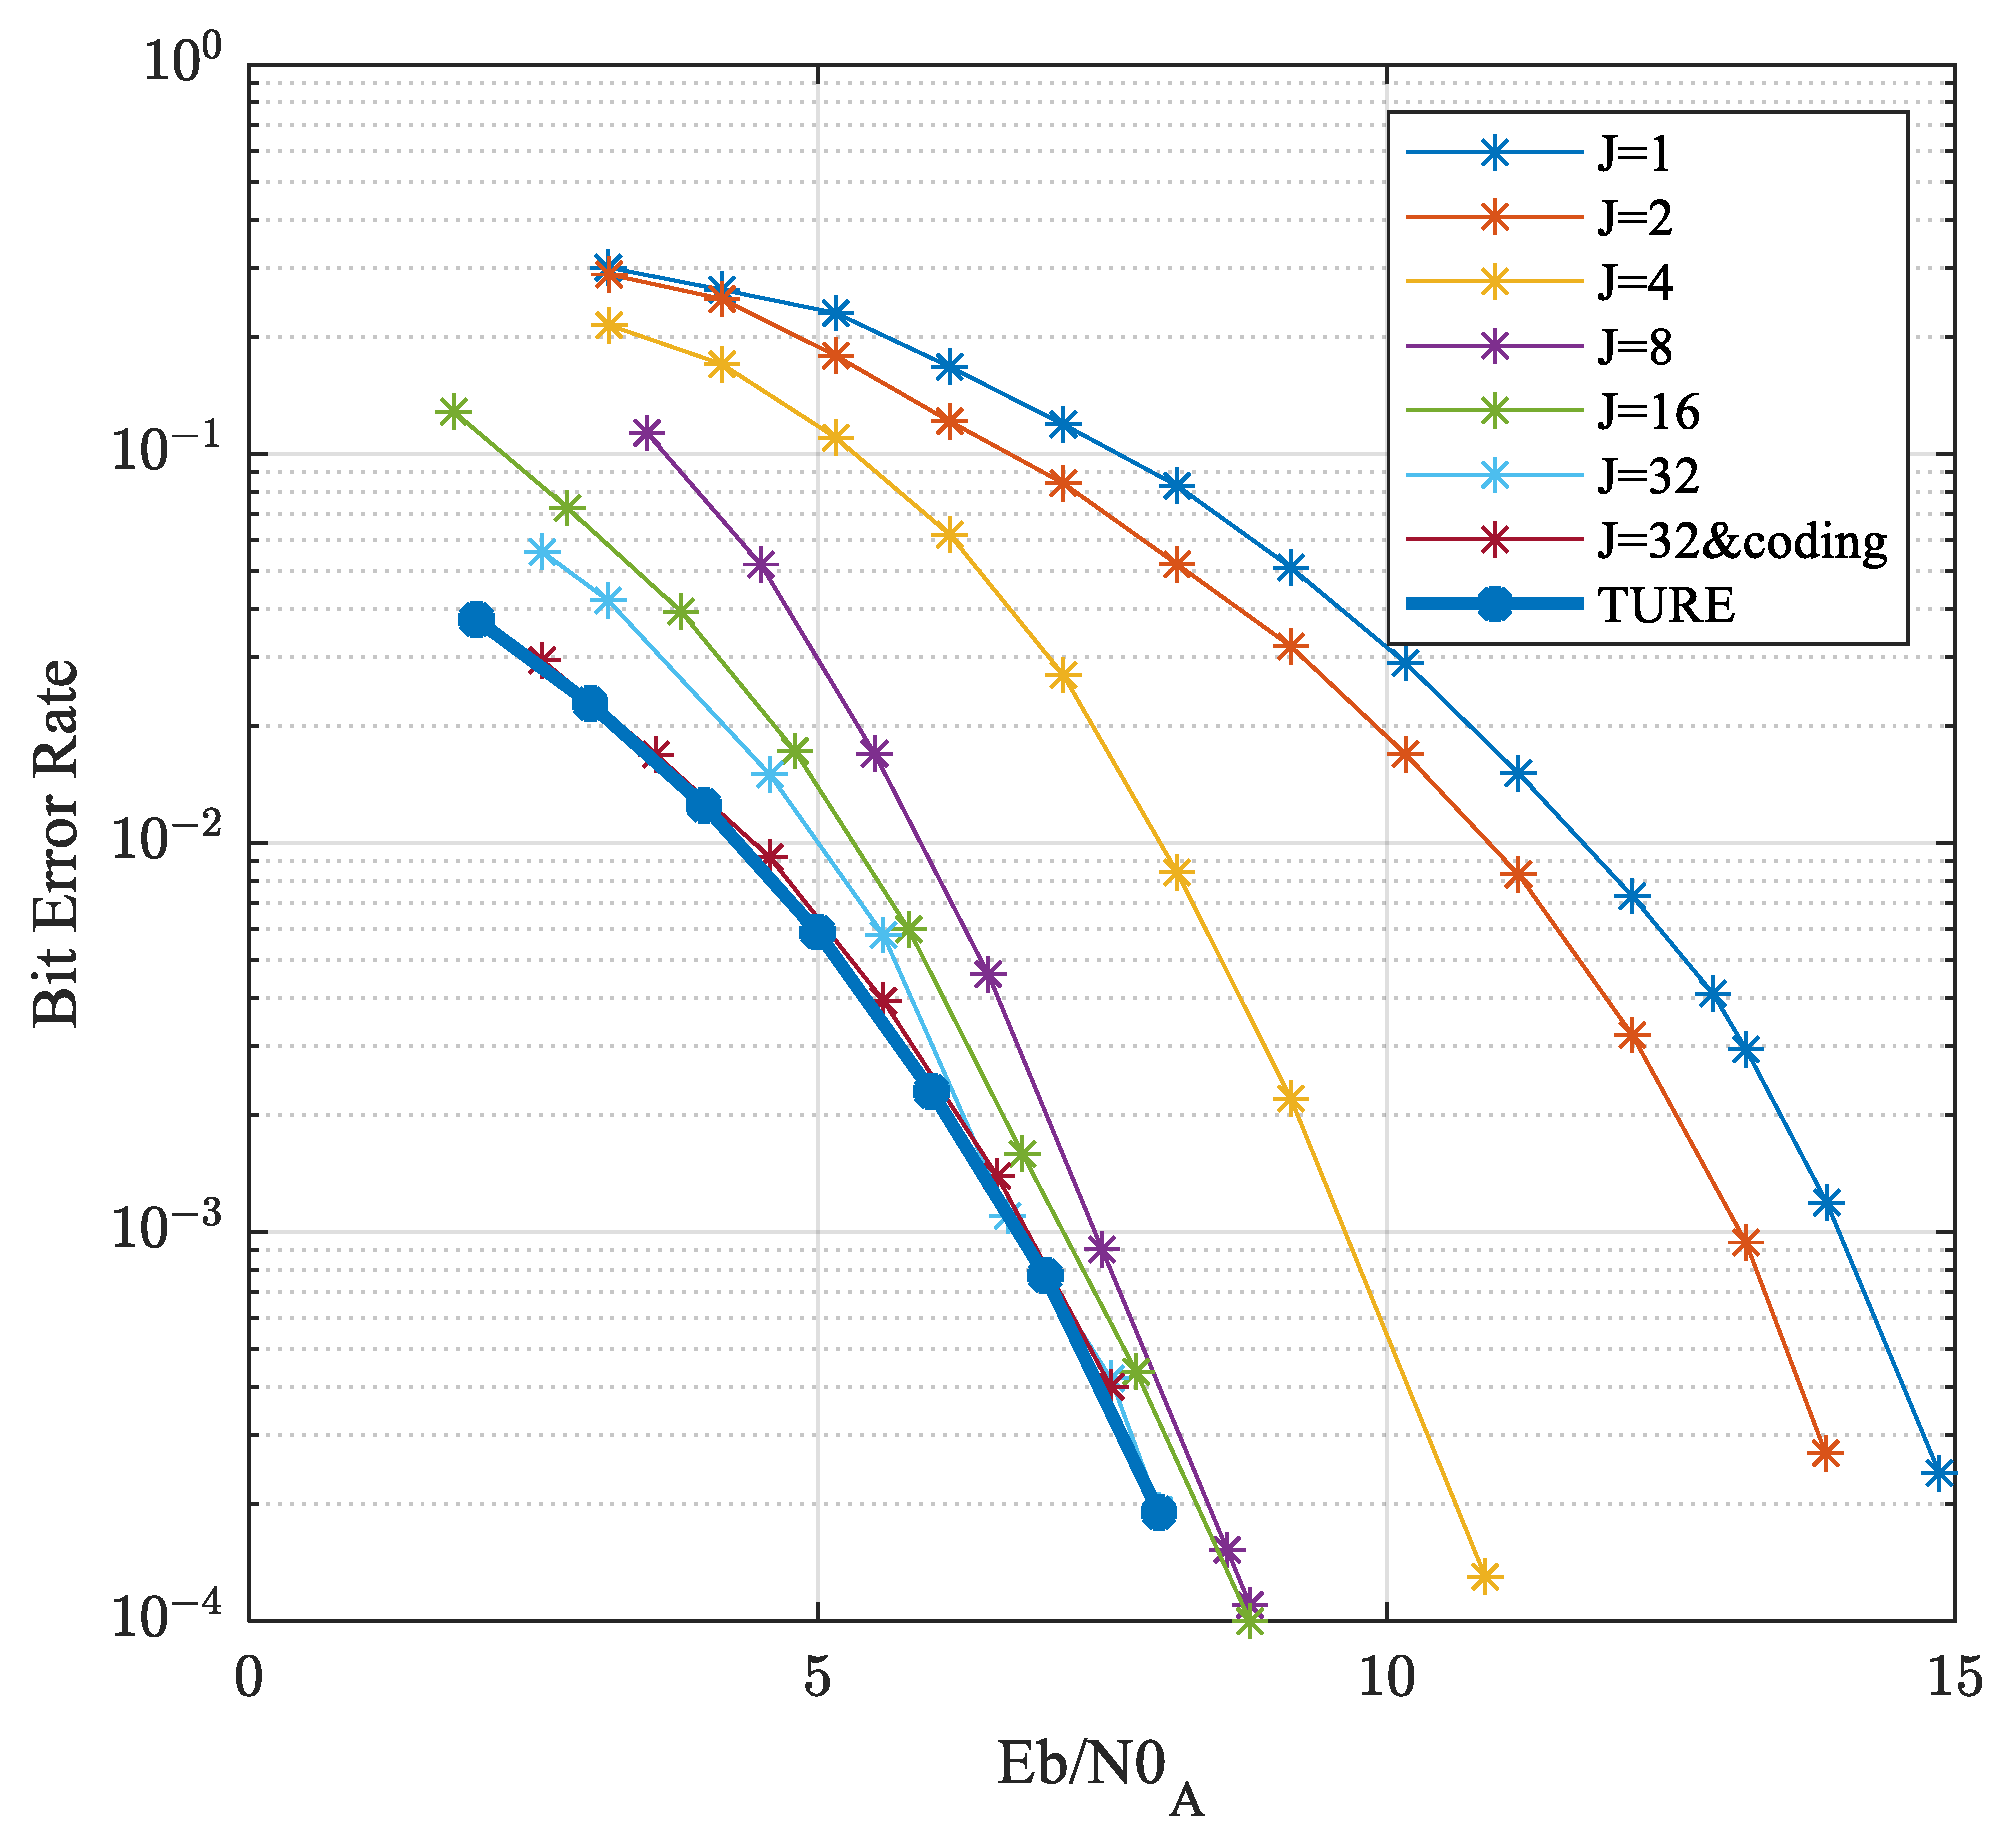
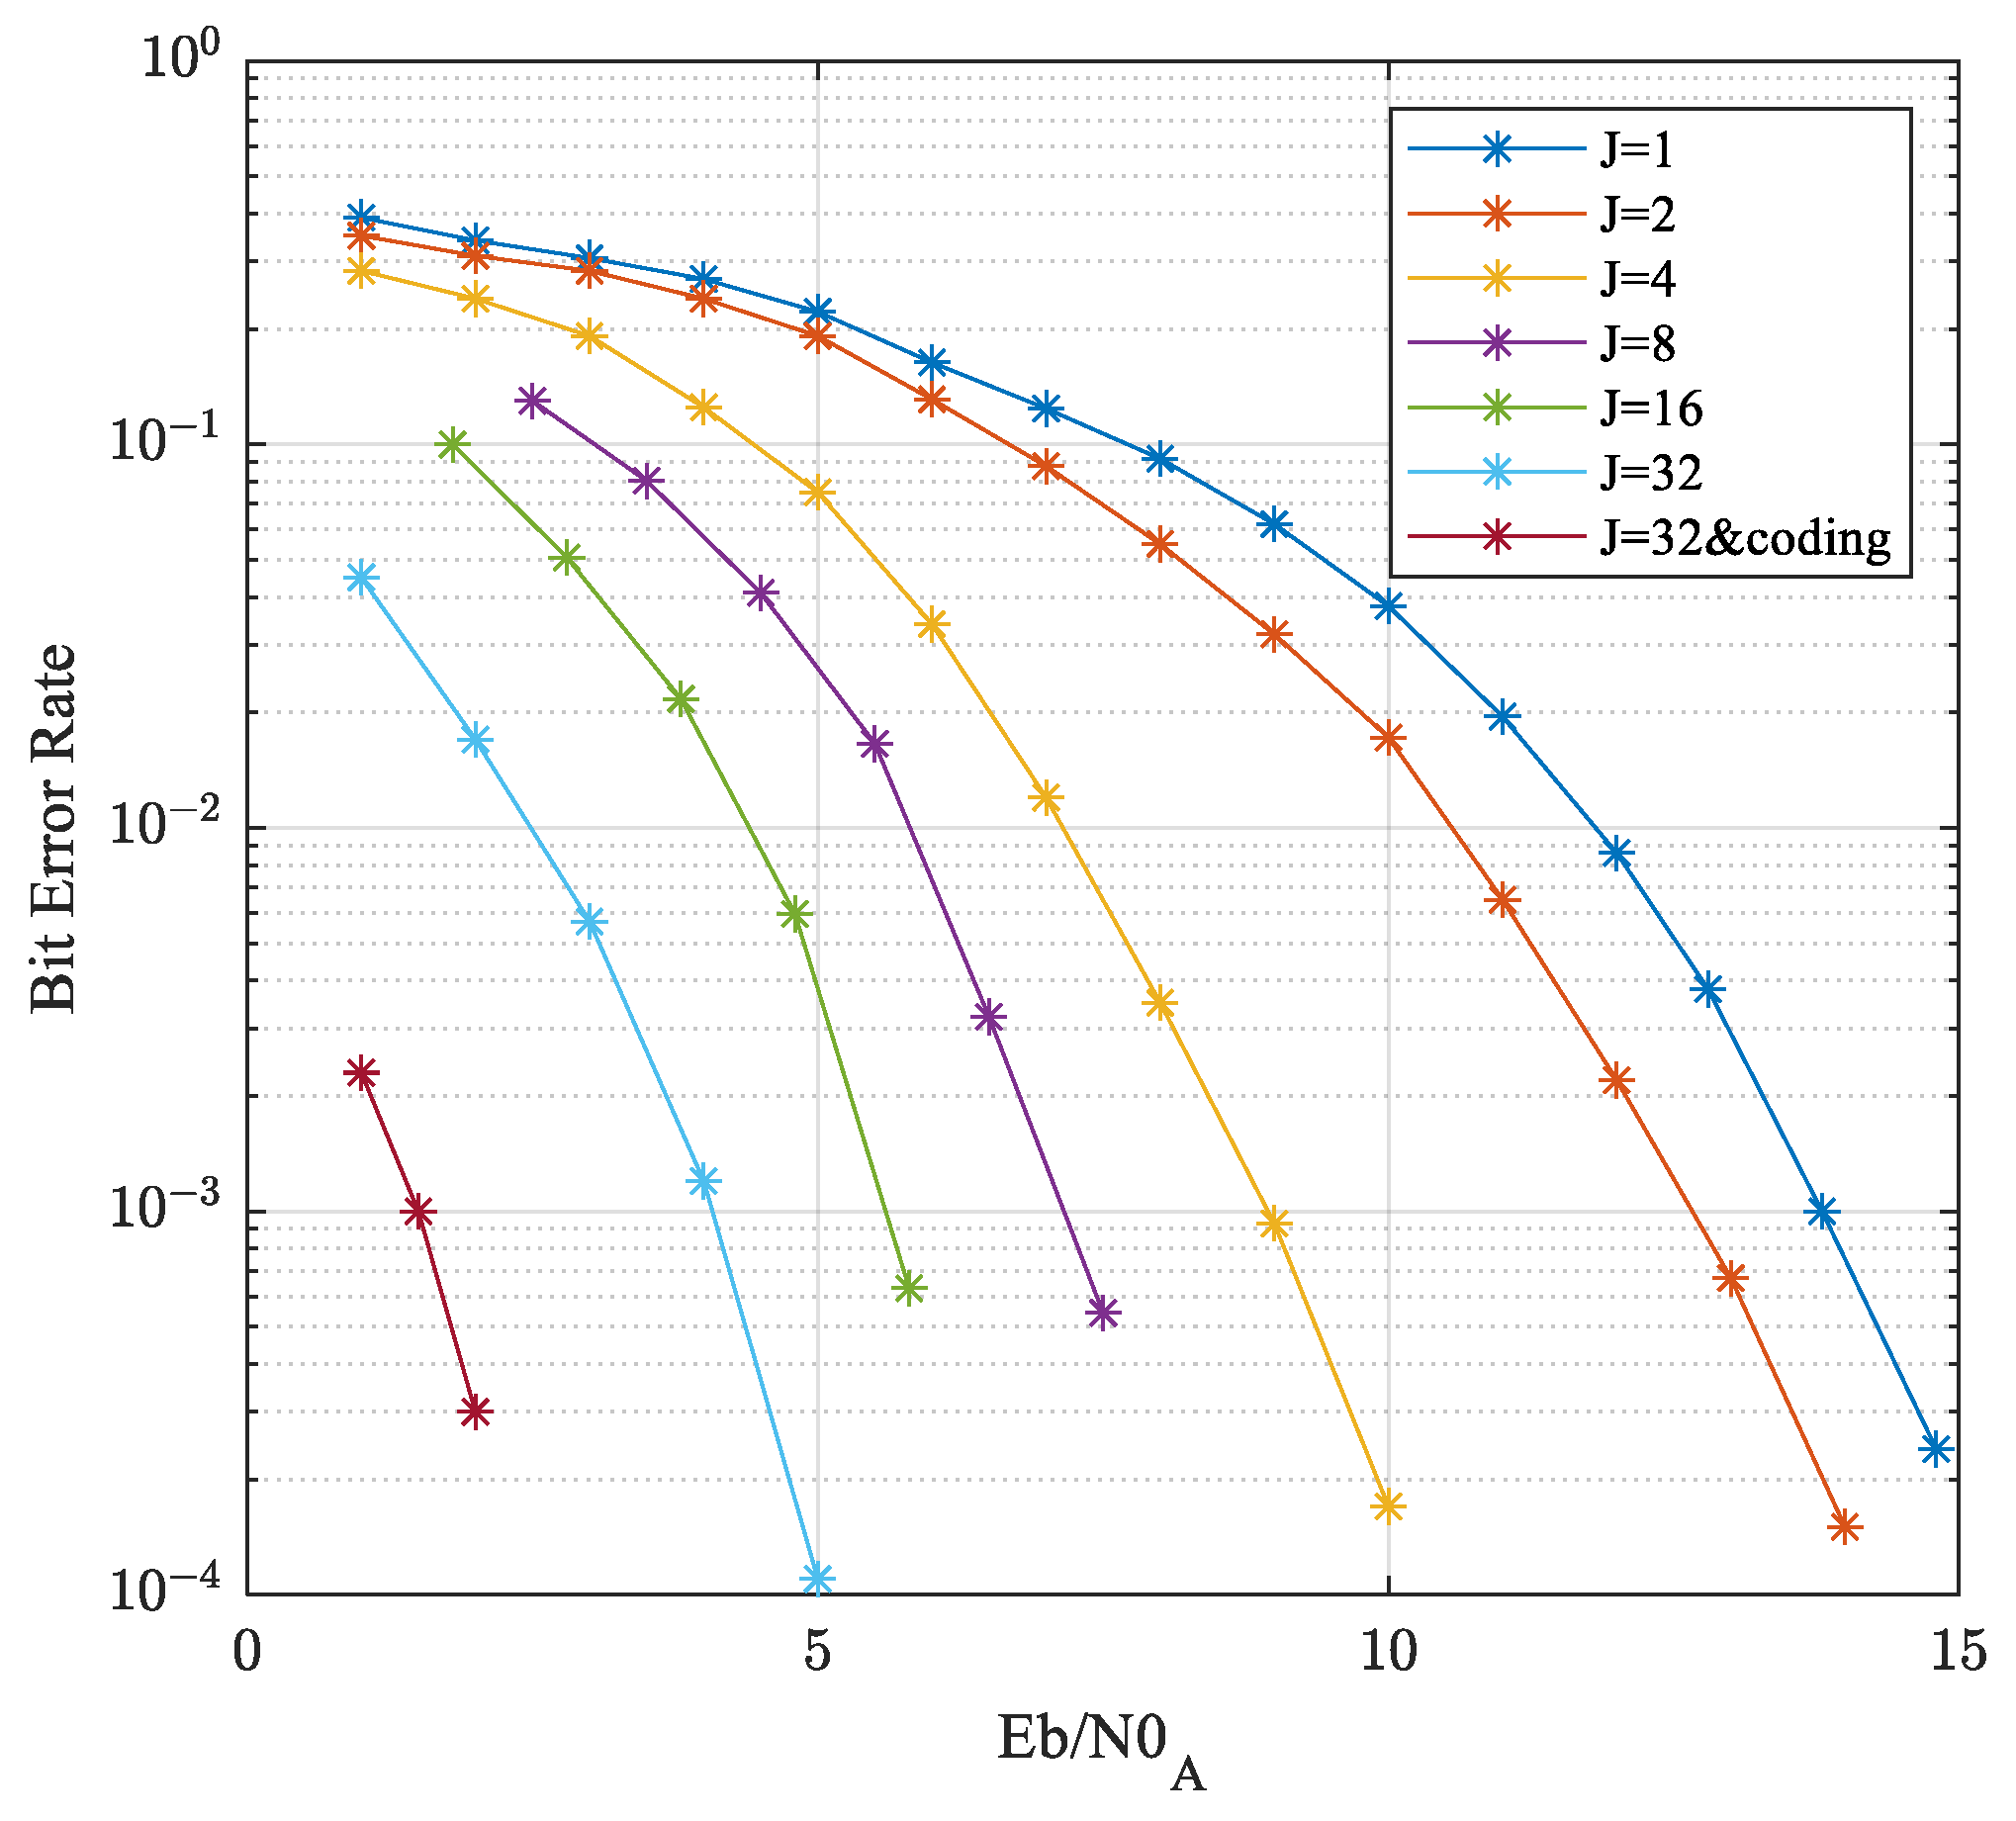
The BER performance of Information A is simulated under seven cases of J values such as 1, 2, 4, 8, 16, 32, and 32 encoded, as well as coding with different Eb/N0 conditions for Information A. The simulation results are shown in Figure 15. To simplify the simulation algorithm, eight frequency-hopping points are selected, and to ensure signal orthogonality in the Information B code element cycle, the same frequency-hopping points are used in each Information B code element for J values of 8, 16, and 32.
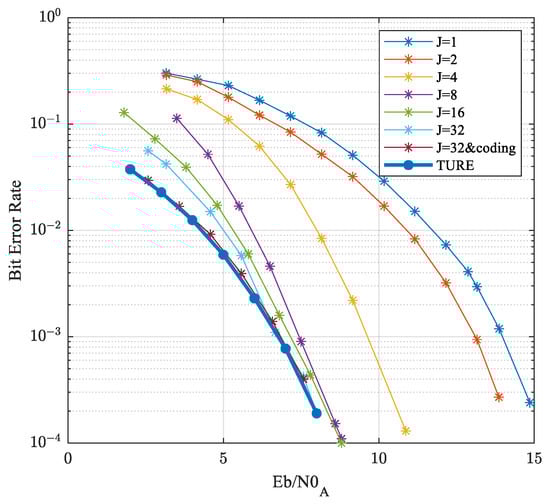
Figure 15.
Information A BER test data for different J values.
As shown in Figure 15, the BER curve of Information A gradually converges to the BPSK theoretical value as the value of J increases. At J = 32 plus coding, the theoretical value of Information A is consistent when the BER of Information A at an order of −2 magnitude (the operating point of Information A after adding channel coding).
3.2.2. Information B BER Analysis
After the FH capacity boost signal passes through the Gaussian white noise channel, the baseband Information B is recovered using envelope detection.
To reduce the BER of Information B, two methods are used to reduce the information rate (joint multi-symbol judgement) in addition to channel coding.
Multi-symbol joint judgement reduces the information rate to achieve a lower BER by sacrificing the transmission rate of Information B and estimating multiple symbols as one symbol. The Information B code element rates are 1000, 500, 250, 125, 62.5, and 31.25 bps for the code elements of joint judgement of 1, 2, 4, 8, 16, and 32, respectively. The BER improvement of Information B is shown in Figure 16. The more symbols that are united, the better the BER performance of Information B.
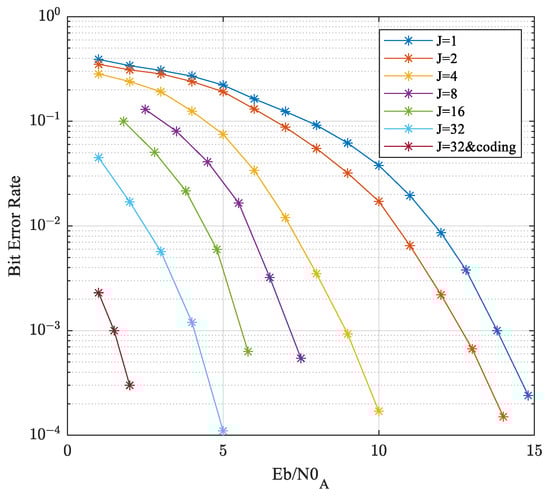
Figure 16.
Information B BER test data for different rates.
To further reduce the bit error rate, the (2, 1) convolutional code is added at the Information B code element rate of 31.25 bps. A simulation verifies that the bit error rate reduces further as a result. When J = 32 and (2, 1) convolutional coding is used, the Information B BER is less than three orders of magnitude lower than the Information A BER.
3.3. Transmission Upgrade Analysis
The information rate of Information B represents the system transmission capacity enhancement capability.
To ensure the BER performance of Information B, one Information B code element cycle, , corresponds to j frequency-hopping cycles, , in which . The code elements of each Information B are orthogonal within the code element cycle. The M frequency-hopping points are divided into groups, with each group including j frequency points. Each Information B code element carries k bits of information.
Together, the number of code elements, the code element rate, and the coding efficiency of Information B determine the information rate of Information B.
where is the hopping speed, which is the reciprocal of the hopping period, ; is the coding efficiency of Information B.
Equation (21) shows that the larger the number of frequency-hopping points M, the higher the frequency-hopping rate and the higher the information enhancement capacity.
If , the rate of frequency hopping is and the information rate of Information A is . To enable Information B to obtain sufficient BER to support Information A for carrier reconstruction, every four frequency-hopping cycles correspond to one code word cycle of Information B, in which . Then, the equivalent Information B code element rate is ; each code element carries four bits of information (1/2 channel coding). At this stage, the information rate of Information B is .
3.4. Analysis of Anti-Interference Capability
Resistance to Broadband Interference
- Information A Broadband-Jamming Capability
The anti-interference gain is generally used to reflect the signal’s ability to resist broadband interference. When the anti-jamming gain is enhanced by expanding the bandwidth, the anti-jamming gain is the expanded bandwidth compared with the bandwidth of the original information modulation signal, as shown in the following equation:
indicates Information A immunity gain, denotes the total spreading bandwidth, is the information rate of A, and is the demodulation BER threshold of Information A.
Anti-jamming gain is essentially the value of the power that the jamming source needs to prioritize relative to the jammed link in order to achieve the jamming effect when the jamming source is in the same location as the transmitter terminals of the jammed system with the same aperture antennae, and the jammed system has an infinite power link margin.
Since there is no change in W and R before and after the capacity enhancement method is applied to Information A, the incremental Information B also barely affects the demodulation BER threshold, , of A. Thus, the signal A anti-interference gain is unchanged before and after the use of the capacity-boosting method, i.e., the addition of the transmitted Information B in the channel has little effect on signal A’s ability to resist broadband interference.
- 2.
- Information B Broadband Interference Resistance
Similarly, the immunity gain of Information B can be expressed as follows:
Since the expanded bandwidths of Information B and Information A are the same, the anti-interference gain of Information B depends on the product of the information rate of B and the demodulation threshold of B.
In general, as long as the number of frequency-hopping points and the frequency-hopping speed reach a certain value, when the information rate of Information B is equal to that of Information A, and if the BER demodulation threshold is also the same, the anti-jamming ability of Information B and Information A is the same.
- 3.
- Resistance to Narrowband Tracking Interference for Information A
Information A’s ability to resist narrowband tracking interference depends on factors such as the frequency-hopping speed and frequency-hopping pattern. The addition of incremental Information B does not reduce the frequency-hopping speed. The frequency-hopping pattern changes from being driven by sequence polynomials or functions to being driven by Information B, which drastically reduces its predictability. The ability of Information A to resist narrowband tracking interference is strengthened accordingly.
- 4.
- Resistance to Narrowband Tracking Interference for Information B
The demodulation of Information B uses power detection. When the narrowband interference signal exists on the same frequency as the signal, the power of Information B is strengthened, which is conducive to the judgment of Information B. Similarly, the frequency-hopping pattern of the signal is driven by Information B, which is unpredictable and decipherable. Therefore, Information B has a strong anti-narrowband interference capability.
3.5. Comparison with OFDM Signals
OFDM is a multicarrier modulation with high frequency utilization and good resistance to multipath fading [28]. It is generally used in scenarios where frequency resources are limited and frequency resource efficiency is prioritized, such as terrestrial mobile communications. In mobile communication 5G systems, OFDM signals are divided into two categories: OFDM access signals and OFDM transmission signals.
FH capacity-boosting signals with high power utilization are generally used in scenarios where power is limited and transmission reliability is a priority, such as anti-jamming communications, satellite signaling beams, and private network communications.
3.5.1. Comparison of FH Capacity Enhancement Signals with OFDM Access Signals
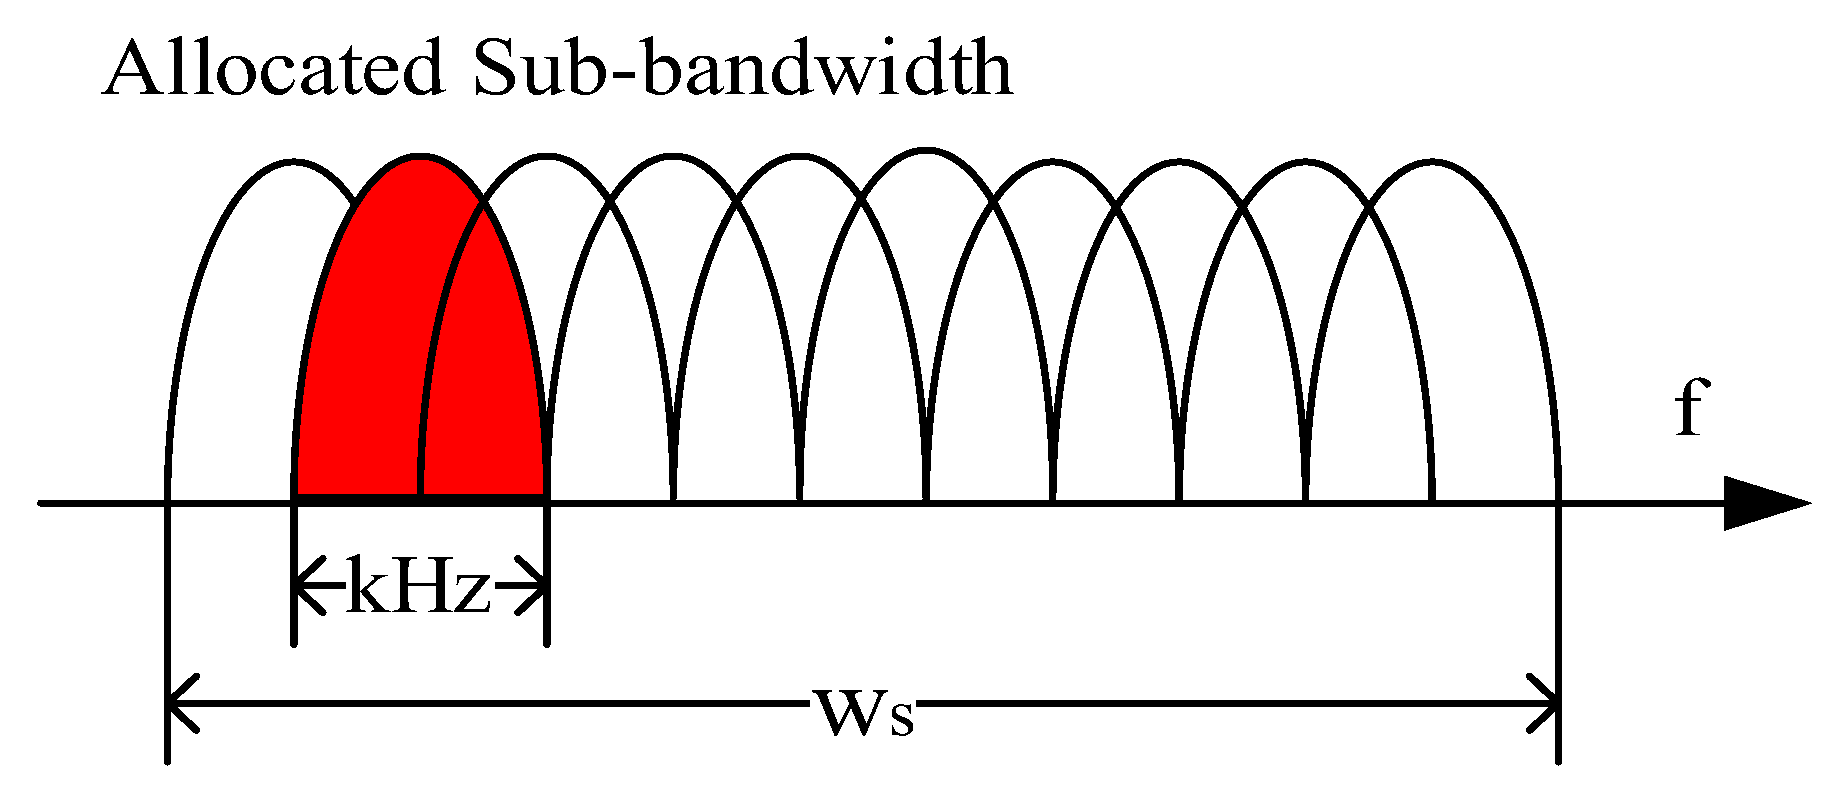
OFDM access signals, typically used in multi-user access scenarios, transmit narrowband information such as access signaling, with the sub-bandwidth typically on the order of kHz. Within the communication bandwidth, , the frequency resource is divided into a number of sub-bandwidths, and each sub-bandwidth is divided into a number of time slots. At the time of access, each user is assigned to a time slot within a sub-bandwidth to communicate.
The spectral structure of the OFDM access signal is shown in Figure 17.

Figure 17.
OFDM access signal spectrum structure.
With the same bandwidth resource-limiting parameter (bandwidth ) and power resource-limiting parameter (BER threshold ), according to Equation (22), FH capacity-boosting signal A is able to obtain the same anti-jamming gain when the information rate of the FH capacity-boosting signal A is the same as the information rate of the OFDM access signal. At this time, the FH capacity enhancement signal is able to transmit Information B in addition to Information A. Therefore, the FH capacity enhancement signal transmission rate is higher than the OFDM access signal.
FH capacity-boosting signals and OFDM access signals both suffer from random variations in frequency parameters. The FH capacity-boosting signals use the frequency parameter variations for transmitting Information B, and the OFDM access signals are used to indicate multiple access information.
3.5.2. Comparison of FH Capacity Enhancement Signals with OFDM Transmission Signals
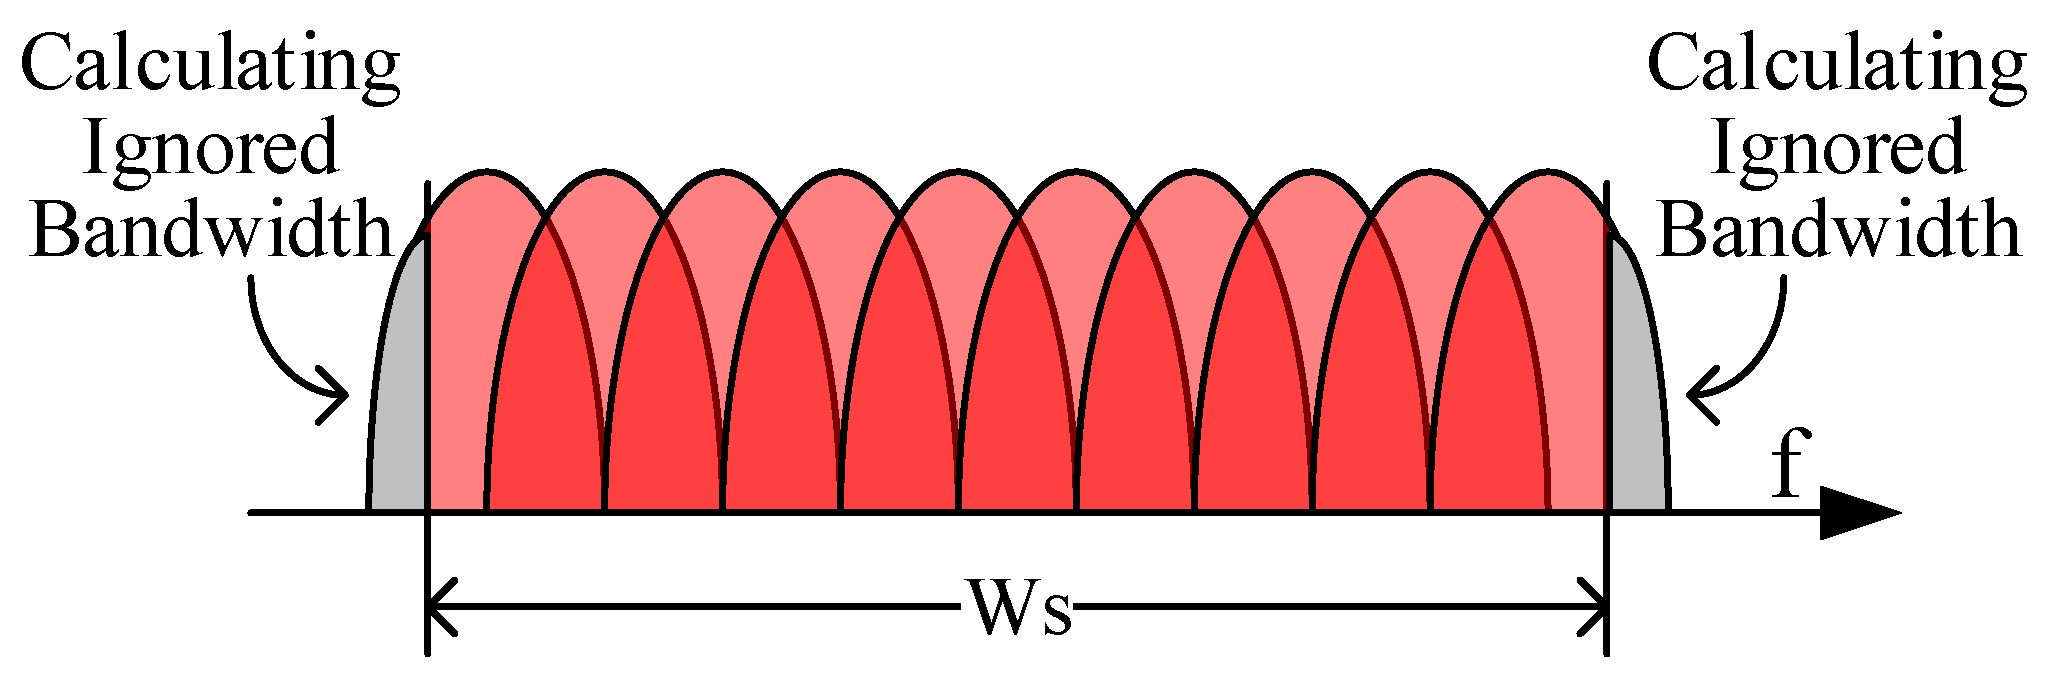
OFDM transmission signals, generally used to transmit broadband information, occupy one or more sub-bandwidths, up to all sub-bandwidths within the bandwidth, when the transmission rate is at its highest. OFDM transmission signals give priority to the utilization of frequency resources, so higher-order modulation is generally used.
OFDM transmits the signal using a coding efficiency of and a modulation order of , when the demodulation threshold of OFDM is , with an occupied bandwidth of and a transmission information rate of . For ease of calculation, the bandwidth of the 1/2 sub-bandwidth is ignored, as shown in Figure 18.
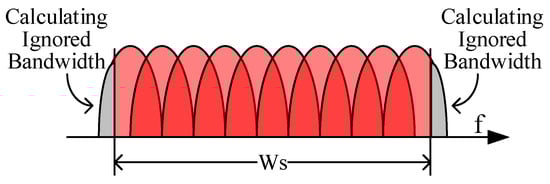
Figure 18.
Spectrogram of OFDM transmitted signals.
The information transmission rate is and the demodulation threshold is for the case of doubling the signal rate with FH capacity enhancement.
According to Equation (22), the ratio of the immunity of the two types of signals depends on the following equation:
According to Equation (24), for a certain occupied bandwidth, when the BPSK regime is used for FH capacity enhancement signals and the 16QAM regime is used for OFDM signals. The demodulation SNR requirement for OFDM high-order modulated signals is four times that of FH capacity-boosted signals (6 dB). At this point, when is 1000 (30 dB) times as large as , the FH capacity-boosting signal is 36 dB more resistant to interference than the OFDM transmission signal. When and (the total rate of messages A and B) are equal, FH capacity-boosting signal A is more resistant to interference than the OFDM transmission signal by 9 dB.
4. Discussion
Interference signals can be carried to the internal communication system through two ways. One way is through the coupling of the internal transmission line of the equipment; this type of interference increases the electromagnetic interference shielding performance of the equipment chassis materials for suppression [29,30,31,32]. The other is spatially coupled and enters the interior of the system through the receiving antenna, where the signal is usually suppressed through the means of spectrum expansion. After the signal spectrum is expanded, lower-rate signals are generally transmitted.
By expanding the information transmission channel in the frequency dimension of frequency-hopping signals, we increased the amount of transmitted information and enhanced the information transmission efficiency of the anti-jamming satellite communication system.
In this paper, a simulation model of a frequency-hopping spread-spectrum communication system is established, the signal generation method and spectral characteristics are presented, and the BER rate performance of the system is simulated.
The transmission of Information B does not change the frequency-hopping rate or bandwidth of Information A, so it does not affect the anti-jamming performance of Information A. Due to the unpredictability of Information B, different carrier frequencies are driven for frequency hopping. This further enhances the unpredictability of Information A while increasing the communication capacity, increasing the anti-interception capability of Information A.
In future work, we will continue to study the optimization of demodulation algorithms to enhance the information capacity of FH signals and DS signals, and we will continue to investigate the impact of broadband channel characteristics and digital compensation [33,34].
5. Patents
Transmission capacity enhancement method for spread spectrum anti-jamming communication system: China, ZL202310279789.8 [P]. 2023-3-22.
Author Contributions
Conceptualization, Z.H. and Z.Y.; methodology, Z.Y. and Z.H.; software, Z.Y., W.Y. and M.J.; validation, Z.Y., W.Y. and M.J.; formal analysis, M.J.; investigation, W.Y.; resources, M.J.; data curation, Z.Y. and M.J.; writing—original draft preparation, Z.Y. and Z.H.; writing—review and editing, W.Y. and M.J.; visualization, W.Y.; supervision, W.Y.; project administration, M.J. and W.Y.; funding acquisition, M.J. All authors have read and agreed to the published version of the manuscript.
Funding
This research was funded by the National Natural Science Foundation of China [62231012] and the Natural Science Foundation for Outstanding Young Scholars of Heilongjiang Province [YQ2020F001].
Data Availability Statement
The simulation of the FH capacity boost signal can be provided: https://blog.csdn.net/yuziting/article/details/133881184?csdn_share_tail=%7B%22type%22%3A%22blog%22%2C%22rType%22%3A%22article%22%2C%22rId%22%3A%22133881184%22%2C%22source%22%3A%22yuziting%22%7D; https://download.csdn.net/download/yuziting/88437737. Accessed from 17 October 2023 to the present. The data presented in this study are available on request from the corresponding author due to ethical and privacy restrictions.
Conflicts of Interest
The authors declare no conflict of interest.
References
- Chen, Z.; Scott, T.R.; Bearman, S.; Anand, H.; Keating, D.; Scott, C.; Arrowsmith, J.R.; Das, J. Geomorphological Analysis Using Unpiloted Aircraft Systems, Structure from Motion, and Deep Learning. In Proceedings of the 2020 IEEE/RSJ International Conference on Intelligent Robots and Systems (IROS), Las Vegas, NV, USA, 25–29 October 2020; pp. 1276–1283. [Google Scholar] [CrossRef]
- Hook, L.R.; Skoog, M.; Garland, M.; Ryan, W.; Sizoo, D.; VanHoudt, J. Initial considerations of a multi-layered run time assurance approach to enable unpiloted aircraft. In Proceedings of the 2018 IEEE Aerospace Conference, Big Sky, MT, USA, 3–10 March 2018; pp. 1–11. [Google Scholar] [CrossRef]
- Jasiunas, M.; Chakraborty, A.; Kearney, D. A distributed operating system supporting strong mobility of reconfigurable computing applications in a swarm of unpiloted airborne vehicles. In Proceedings of the 2009 International Conference on Field-Programmable Technology, Sydney, Australia, 9–11 December 2009; pp. 392–398. [Google Scholar] [CrossRef]
- Kim, K.H.; Hong, B.H. Maritime logistics and applications of information technologies. In Proceedings of the 40th International Conference on Computers & Indutrial Engineering, Awaji, Japan, 25–28 July 2010; pp. 1–6. [Google Scholar] [CrossRef]
- Zhu, S.; Du, G. Evaluation of the Service Capability of Maritime Logistics Enterprises Based on the Big Data of the Internet of Things Supply Chain System. IEEE Consum. Electron. Mag. 2023, 12, 100–108. [Google Scholar] [CrossRef]
- Ditsariyakul, P.; Sutheparuks, L.; Limlamai, N. Role of Thailand Remote Sensing Center in data service for global environment monitoring. In Proceedings of the IGARSS’93—IEEE International Geoscience and Remote Sensing Symposium, Tokyo, Japan, 18–21 August 1993; Volume 4, pp. 1841–1842. [Google Scholar] [CrossRef]
- Chang, Y.-G.; Chen, C.-H.; Huang, H.-L.; Miao, H.-H. Geographic information systems and global positioning systems for watershed management. IGARSS 2001. Scanning the Present and Resolving the Future. In Proceedings of the IEEE 2001 International Geoscience and Remote Sensing Symposium (Cat. No.01CH37217), Sydney, Australia, 9–13 July 2001; Volume 5, pp. 2112–2114. [Google Scholar] [CrossRef]
- Rajarapollu, P.; Sharma, V.K. Design and analysis of satellite based disaster warning system—II. In Proceedings of the TENCON 2007—2007 IEEE Region 10 Conference, Taipei, Taiwan, 30 October–2 November 2007; pp. 1–4. [Google Scholar] [CrossRef]
- Fan, Q.; Huang, H.; Wu, J.; Niu, W.; Zhang, Q.; Zhang, Y. Design and Construction of Multi-Source Satellite High-Frequency Power Grid Fire Risk Monitoring and Early Warning System. In Proceedings of the 2023 5th International Conference on Electronic Engineering and Informatics (EEI), Wuhan, China, 23–25 June 2023; pp. 262–268. [Google Scholar] [CrossRef]
- Tiezzi, F.; Padilla, J.; Vigano, C. S-band transmit/receive antenna with electronically switched beams for mobile satellite systems. In Proceedings of the 2012 6th Advanced Satellite Multimedia Systems Conference (ASMS) and 12th Signal Processing for Space Communications Workshop (SPSC), Vigo, Spain, 5–7 September 2012; pp. 62–67. [Google Scholar] [CrossRef]
- Jin, L.; Wang, L.; Jin, X.; Zhu, J.; Duan, K.; Li, Z. Research on the Application of LEO Satellite in IOT. In Proceedings of the 2022 IEEE 2nd International Conference on Electronic Technology, Communication and Information (ICETCI), Changchun, China, 27–29 May 2022; pp. 739–741. [Google Scholar] [CrossRef]
- Ban, Y.; Li, B.; Le, Q. Optimization and simulation of network management signaling transmission in satellite communication systems. Radio Eng. 2017, 47, 5–9. [Google Scholar]
- Chang, D.-C.; Cheng, P.-W.; Lee, C.-H.; Wu, C.-T. Broadband wide-beam circular polarization antenna for global navigation satellite systems application. In Proceedings of the 2015 Asia-Pacific Symposium on Electromagnetic Compatibility (APEMC), Taipei, Taiwan, 26–29 May 2015; pp. 44–46. [Google Scholar] [CrossRef]
- Shannon, C.E. A mathematical theory of communication. Bell Syst. Tech. J. 1948, 27, 379–423. [Google Scholar] [CrossRef]
- Herrick, D.L.; Lee, P.K. CHESS a New Reliable High Speed HF Radio. In Proceedings of the MILCOM ‘96 IEEE Military Communications Conference, McLean, VA, USA, 24–24 October 1996; Volume 3, pp. 684–690. [Google Scholar] [CrossRef]
- Herrick, D.L.; Lee, P.K.; Ledlow, L.L. Correlated Frequency Hopping: An Improved Approach to HF Spread Spectrum Communications. In Proceedings of the 1996 Tactical Communication Conference, Fort Wayne, IN, USA, 30 April–2 May 1996; pp. 320–324. [Google Scholar]
- Mills, D.G.; Edelson, G.S.; Egnor, D.E. A multiple access differential frequency hopping system. In Proceedings of the IEEE MILCOM’03, Bostom, MA, CSA, 13–16 October 2003; pp. 1184–1189. [Google Scholar]
- Liu, Z.; Zhang, Y.; Yao, F. A shortwave DFH hop detection method based on the combination of STFT and G-function. J. Electron. 2003, 1, 13–16. [Google Scholar]
- Qian, B.; Feng, Y.; Pan, C.; Tian, B. A differential frequency hopping signal detection method based on multi-hop autocorrelation. J. Aeronaut. 2011, 32, 2268–2276. [Google Scholar]
- Xiaoxu, Q.; Jingyi, L.; An, L. Improving Anti-interception Performance of Differential Frequency Hopping Communication. In Proceedings of the 2008 International Seminar on Future BioMedical Information Engineering, Wuhan, China, 18 December 2008; pp. 295–299. [Google Scholar] [CrossRef]
- Li, Y.; Yao, F.; Xu, B.; Zhao, L. Equalization Algorithm in Frequency Domain for Broadband DFH Systems. In Proceedings of the 2015 4th International Conference on Computer Science and Network Technology (ICCSNT), Harbin, China, 19–20 December 2015; pp. 1154–1159. [Google Scholar] [CrossRef]
- Yin, A.; Li, Y. Design of a differential frequency hopping scheme based on chaotic encryption algorithm. Opt. Commun. Res. 2022, 4, 69–72. [Google Scholar] [CrossRef]
- Liu, X.; Chen, L.; Yao, C.; Wang, M.; Song, X. A novel enhanced anti-jamming system for differential frequency hopping communication. Comput. Appl. Res. 2022, 39, 1820–1824. [Google Scholar] [CrossRef]
- Yu, J.; Wang, C.; Shen, L. Principles of Spread Spectrum Communication Technology and its Applications. China Wirel. 2010, 03, 44–47. [Google Scholar]
- Fan, C.; Cao, L. Principles of Communication, 6th ed.; National Defence Industry Press: Beijing, China, 2006; pp. 230–231. [Google Scholar]
- Gardner, F. A BPSK/QPSK Timing-Error Detector For Sampled Receivers. IEEE Trans. Commun. 1986, 34, 423–429. [Google Scholar] [CrossRef]
- Best, R.E.; Kuznetsov, N.V.; Leonov, G.A. Tutorial on dynamic analysis of the Costas loop. Annu. Rev. Control 2016, 42, 27–49. [Google Scholar] [CrossRef]
- Schmidl, T.M.; Cox, D.C. Robust frequency and timing synchronization for OFDM. IEEE Trans. Commun. 1997, 45, 1613–1621. [Google Scholar] [CrossRef]
- Amini, M.; Kamkar, M.; Rahmani, F.; Ghaffarkhah, A.; Ahmadijokani, F.; Arjmand, M. Multilayer Structures of a Zn0.5Ni0.5Fe2O4-Reduced Graphene Oxide/PVDF Nanocomposite for Tunable and Highly Efficient Microwave Absorbers. ACS Appl. Electron. Mater. 2021, 3, 5514–5527. [Google Scholar] [CrossRef]
- Zhou, M.; Gu, W.; Wang, G.; Zheng, J.; Pei, C.; Fan, F.; Ji, G. Sustainable wood-based composites for microwave absorption and electromagnetic interference shielding. J. Mater. Chem. A 2020, 8, 24267–24283. [Google Scholar] [CrossRef]
- Ryu, S.H.; Han, Y.K.; Kwon, S.J.; Kim, T.; Jung, B.M.; Lee, S.B.; Park, B. Absorption-dominant, low reflection EMI shielding materials with integrated metal mesh/TPU/CIP composite. Chem. Eng. J. 2022, 428, 131167. [Google Scholar] [CrossRef]
- Stupar, S.L.; Vuksanović, M.M.; Mijin, D.Ž.; Milanović, B.C.; Joksimović, V.J.; Barudžija, T.S.; Knežević, M.R. Multispectral electromagnetic shielding and mechanical properties of carbon fabrics reinforced by silver deposition. Mater. Chem. Phys. 2022, 289, 126495. [Google Scholar] [CrossRef]
- Zhisong, H.; Zhiming, Z. High symbol-rate polarization interference cancelation for satellite-to-ground remote sensing data transmission system. EURASIP J. Wirel. Commun. Netw. 2018, 286, 1–10. [Google Scholar]
- Hao, Z.; He, C.; Jia, M.; Wu, L. Design of Multichannel Adaptive Filter by Constructing Multidimensional Wiener-Hopf Equation. China Commun. 2022, 19, 124–134. [Google Scholar] [CrossRef]


Disclaimer/Publisher’s Note: The statements, opinions and data contained in all publications are solely those of the individual author(s) and contributor(s) and not of MDPI and/or the editor(s). MDPI and/or the editor(s) disclaim responsibility for any injury to people or property resulting from any ideas, methods, instructions or products referred to in the content. |
© 2023 by the authors. Licensee MDPI, Basel, Switzerland. This article is an open access article distributed under the terms and conditions of the Creative Commons Attribution (CC BY) license (https://creativecommons.org/licenses/by/4.0/).