Article

Research on the Prediction Method of Clock Tester Calibration Data Based on Radial Basis Function Neural Network

1
Gansu Institute of Metrology, Lanzhou 730050, China
2
School of Materials Science and Engineering, Lanzhou University of Technology, Lanzhou 730050, China
3
Mechatronics T&R Institute, Lanzhou Jiaotong University, Lanzhou 730070, China
*
Authors to whom correspondence should be addressed.
Electronics 2023, 12(22), 4677; https://doi.org/10.3390/electronics12224677
Submission received: 24 October 2023 / Revised: 14 November 2023 / Accepted: 14 November 2023 / Published: 17 November 2023
(This article belongs to the Section Computer Science & Engineering)

Abstract

:
A radial basis function (RBF) neural network-based calibration data prediction model for clock testers is proposed to address the issues of fixed calibration cycles, low efficiency, and waste of electrical energy. This provides a new method for clock tester traceability calibration. First, analyze the mechanism of clock tester calibration parameters and the influencing factors of prediction targets. Based on the learning rules of an RBF neural network, determine the data types of training and testing sets. Second, normalize the training and testing data to avoid the adverse effects of data characteristics and distribution differences on the prediction model. Finally, based on different prediction objectives, time-driven and data-driven calibration data prediction models are constructed using RBF neural networks. Through simulation analysis, it is shown that an RBF neural network is superior to a BP neural network in predicting clock tester calibration data, and time-driven prediction accuracy is superior to data-driven prediction accuracy. Moreover, the prediction error and mean square error of both prediction models are on the order of 10−9, meeting the prediction accuracy requirements.

1. Introduction

A clock tester is an instrument that uses an internal quartz crystal oscillator as a time reference and can display daily errors, second errors, and frequency errors. It is used to measure frequency accuracy and second pulse signals. It is composed of a waveform shaping circuit, a frequency division circuit, an electronic control circuit, a display circuit, etc. It is mainly used for measuring the second pulse signal of electric energy meters [1]. The general traceability calibration interval for clock testers is one year, and the acquisition time of calibration indicators (stability and accuracy) is long (at least 8 h) [2], which poses challenges to customers and inspectors and wastes electrical energy.
At present, there are no more efficient physical measurement methods and calibration standards, and research on predictive models for clock tester calibration data is still in its infancy. A radial basis function neural network is capable of approximating any nonlinear function and can handle difficult-to-analyze laws within the system. It has good generalization ability and fast learning convergence speed. It has been successfully applied in nonlinear function approximation, time series analysis, data classification, pattern recognition, information processing, image processing, system modeling, control, and fault diagnosis [3,4,5,6,7]. The prediction method based on radial basis function neural networks has been widely studied and applied in other fields [8,9,10,11,12]. Lashkenari et al. [13] developed a radial basis function neural network prediction model for predicting the viscosity of Iranian crude oil that has universality and accuracy. Luo et al. [14] proposed a fast method for predicting the fatigue life of automotive wheels based on radial basis function neural networks combined with orthogonal decomposition, which has ideal accuracy. Mohammad et al. [15] established a concrete mix ratio model based on radial basis functions to estimate the compressive strength of concrete containing different amounts of fly ash at any time in response to the fact that fly ash can enhance the mechanical properties and durability of concrete materials. Hao et al. [16] proposed a prediction model for chaotic radial basis function neural networks based on radial basis function neural networks and chaos theory, which utilizes the Earth’s natural pulse electromagnetic field signals for potential strength trend prediction. Stephen et al. [17] introduced the radial basis function neural network algorithm into the path loss prediction model to solve the problems of large errors and low universality in empirical and deterministic models. Zhang et al. [18] developed an intelligent model based on radial basis function neural networks to predict the thermal conductivity of nanofluids under various conditions in response to the inherent complexity of nanofluids. This is of great significance for promoting the industrial application of nanofluids. Tao et al. [19] proposed an improved radial basis function prediction model based on a differential evolution algorithm for the complexity of the coking energy consumption process, which is of great significance for reducing energy consumption, saving costs, and improving enterprises’ economic benefits. Yoon et al. [20] proposed a probabilistic motion prediction algorithm based on radial basis function neural networks for the uncertainty of vehicle motion trajectories. This algorithm can accurately calculate the likelihood of multiple target lanes and surrounding vehicle trajectories using radial basis function neural networks, which is crucial for avoiding potential risks in the future. The successful application of the prediction method based on radial basis function neural networks in other fields has verified the theoretical feasibility of the clock tester calibration data prediction model. In addition, GMDH neural networks, BP neural networks, etc., can also be used for building prediction models. Roshani et al. [21] used the GMDH neural network to build a prediction model for estimating the gas volume percentage in two-phase flow without relying on the flow pattern and improving the measurement accuracy by 2.7 times. Qin et al. [22] built a BP neural network model to predict user behavior that has high prediction efficiency and accuracy. The calibration data of the clock tester studied in this article has typical nonlinear characteristics and randomness within a certain numerical range. Therefore, an radial basis function neural network with a strong generalization ability and a good nonlinear function approximation effect is used for research.
In view of this, a radial basis function neural network is used to build a clock tester calibration data prediction model to replace traditional calibration methods. By analyzing the calibration parameters of the clock tester, time- and data-driven training functions are established to expand the prediction range of the model and improve its applicability. The clock tester calibration data prediction model provides a new method to improve the efficiency of the clock tester traceability calibration, which can effectively reduce the number of traditional calibration times, not only saving electricity but also providing theoretical support for subsequent calibration time decisions and creating conditions for condition-based traceability.

2. Basic Theory and Problem Description

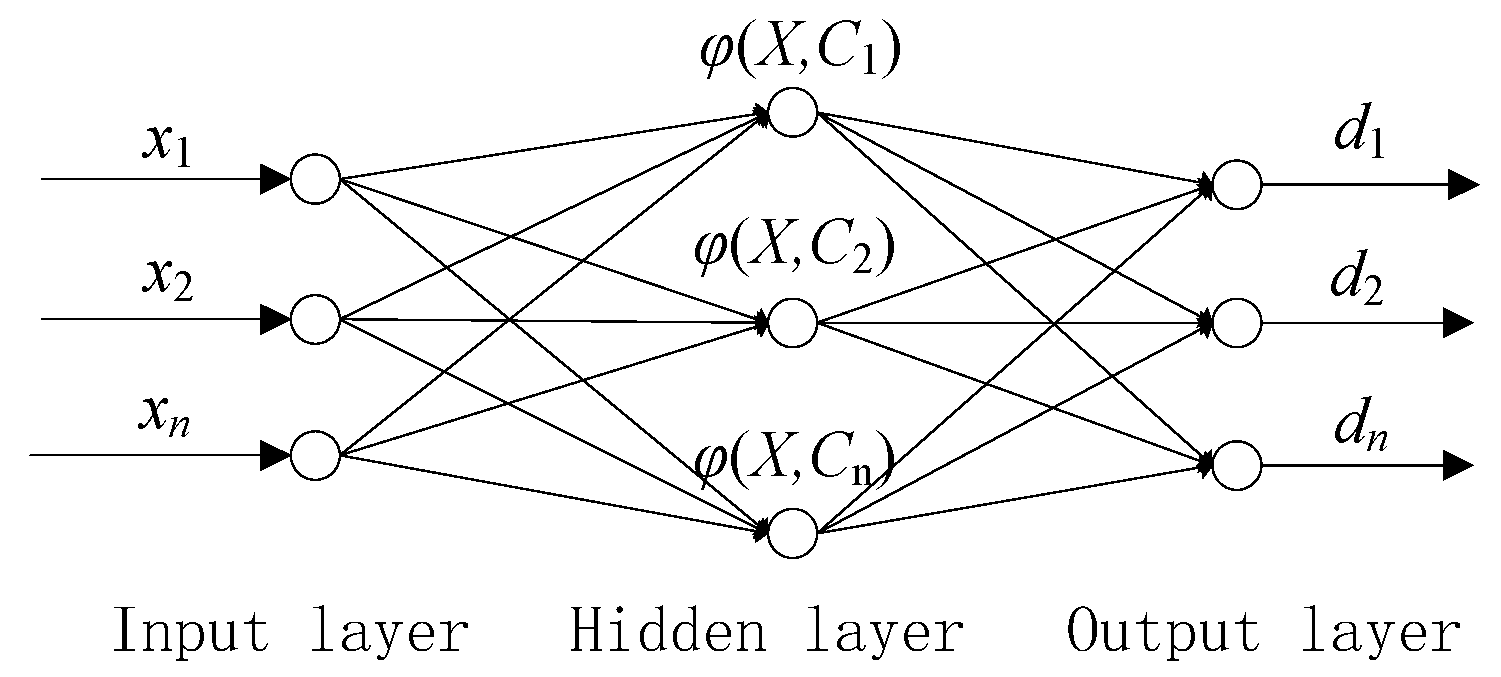
2.1. Principles of Radial Basis Function Neural Networks

Radial basis function neural networks, abbreviated as RBF neural networks, is a neural network structure proposed by J. Moody and C. Darken in the late 1980s. An RBF neural network is a high-performance feedforward network with the ability to achieve optimal approximation and overcome local minimum problems [7].
According to the different number of radial basis functions, RBF neural networks can be divided into regularized RBF neural networks and generalized RBF neural networks. When using a regularized RBF neural network structure, the number of hidden layer nodes is the number of samples, and the data center of the basis function is the sample itself. Parameter design only needs to consider the extension constant and the weight of the output nodes. The network topology is shown in Figure 1 [5].
The regularized RBF neural network is usually a three-layer feedforward network. The first layer is the input layer, where x1, x2, …, xn are the input data. The second layer is the hidden layer, where the node basis function φ ( X , C n ) is the radial basis function, where X is the input data vector and Cn is the center of the data sample. The third layer is the output layer, where d1, d2, …, dn are the output data, and their activation function is a linear function.
When using a generalized RBF neural network structure, the learning algorithm of the RBF neural network should address issues such as how to determine the number of hidden layer nodes in the network, how to determine the data centers and extension constants of each radial basis function, and how to correct the output weights. The topology structure of the RBF neural network is shown in Figure 2 [23].
In Figure 2, the number of hidden layer nodes in the RBF neural network is smaller than the number of samples. This is because when the number of samples is large, the computational complexity of the network will be large, and the larger the matrix, the greater the likelihood of its ill condition. Therefore, the generalized RBF neural network reduces the likelihood of a matrix ill condition by reducing the number of hidden layer nodes. Figure 2 φ0 is the offset value.
The paper builds a clock tester calibration data prediction model based on the RBF neural network, which has a small amount of data. Therefore, a regularized RBF neural network is used. The Gaussian function is chosen as the radial basis function, as shown in Formula (1).
φ ( r ) = e ( r 2 2 δ 2 )
wherein r is the distance from the data to the center of the sample, δ the width of the center of the basis function.

2.2. Problem Description

Using a clock tester as the measurement object, analyze the measured data and construct a prediction model.
The calibration of the clock tester mainly involves measuring its stability and accuracy, and the main calibration methods [2] are as follows:
Calibration basis: JJF1662-2017 “Clock Tester” calibration specification.
Calibration instrument: GPS-locked rubidium atomic frequency standard, universal counter.
Stability calibration method: After starting the machine, measure eight times using 500 kHz as the standard, with a measurement interval of 1 h. We randomly sample three times during each measurement, take the arithmetic mean of them as the measurement value, and calculate the stability according to Formula (2).
S = 8 x m a x i x m i n i i = 1 8 x i
wherein S represents the calculated stability, xi represents the measured data, and ximax and ximin are divided into the maximum and minimum values in the measured data.
Accuracy calibration method: After starting the machine, randomly measure 10 times, take three samples of data each time, take their arithmetic mean as the measurement value, and calculate the accuracy according to Formula (3).
A = i = 1 10 x i 10 x 0 10 x 0
wherein A is the calculated accuracy, and x0 is the reference standard.
Taking a clock tester as an example, collect data measured by the clock tester. Build a prediction model based on the RBF neural network algorithm, train the collected data, and predict the accuracy and stability of the clock tester after meeting the requirements.

3. Prediction Model

3.1. Factors Affecting Calibration Parameters

According to Section 2.2, the calibration parameters of the clock tester are accuracy and stability. Through analysis of the calibration process, it can be seen that the measurement parameters are mainly affected by the calibration instrument. Therefore, in the measurement process of the clock tester, it is necessary to consider the calibration uncertainty [2]. According to Formulas (2) and (3), the uncertainty of measurement results mainly comes from measurement repeatability and accuracy of reference standards. Therefore, the measurement data are shown in Formula (4),
x s = x 0 + Δ x
wherein xs, x0, Δx represent the general counter display data (i.e., measurement data), output data standard values, and data measurement errors.
(1)
Measurement Repeatability
Use a universal counter to repeatedly sample the output data of the clock tester n times. According to the Bessel formula, calculate the measurement uncertainty component as shown in Formula (5).
u 1 = i = 1 n ( x i x ¯ ) 2 n 1
wherein u1 is the calculated uncertainty component, xi is the collected data, and x is the average value of the collected data.
(2)
Accuracy of Reference Standards
According to uniform distribution, if the reference standard accuracy is cb, then k = 3 , and the uncertainty component is calculated as shown in Formula (6).
u 2 = c b x 0 3
(3)
Uncertainty Calculation
Due to the independence of the introduced measurement uncertainty components, the combined measurement uncertainty is shown in Formula (7).
u c = u 1 2 + u 2 2
The expanded uncertainty of measurement is shown in Formula (8),
U = k u c
wherein k is the expansion coefficient, generally taken as k = 2. In the actual calibration work, if we estimate that the measured value follows the normal distribution, when k = 2, U is the half-width of the confidence interval with a confidence probability of approximately 95%, representing that 95% of the measured value is within the range of ±U of the actual value.

3.2. Data Analysis and Preprocessing

The data in the paper came from the measurement results of five clock testers of the same model produced by the same manufacturer and year by a certain unit for 4 consecutive years. Part of the data is shown in Table 1.
Taking the clock tester as the research object, the order of error is small. Therefore, it is necessary to preprocess the measured data, remove common features, and amplify the error, as shown in Formula (9).
x d e a = c d ( x m e a x c o m )
wherein xdea is the processed data, cd is the error amplification coefficient, xmea is the measurement data, and xcom is the common feature data.
In order to avoid the adverse effects of data features and distribution differences on the model, it is necessary to normalize and denormalize the training samples. The normalization process is shown in Formula (10), and the denormalization process is shown in Formula (11).
x n o r m = x d e a x m i n x m a x x m i n
x d e a = x n o r m ( x m a x x m i n ) + x m i n
wherein xnorm is the normalized data, x n o r m [ 0 , 1 ] .

3.3. Model Construction

From Section 2.1, it can be seen that the RBF neural network has a multi-layer forward structure with one hidden layer. According to the different number of hidden layer nodes, it can be divided into regularized RBF neural networks and generalized RBF neural networks. The paper selects the regularized RBF neural network structure.
Let the N-dimensional space have P data points Xp, p = 1, 2, … P, and the corresponding target values in the output space are dp, p = 1, 2, … P.
Find a nonlinear mapping function F(X) that satisfies the condition of Formula (12).
F ( X p ) = d p         p = 1 , 2 , , P
Select P basis functions, each corresponding to one data, and the form of each basis function is shown in Formula (13),
φ ( X X p )         p = 1 , 2 , , P
wherein the basis function φ is a nonlinear function, and Xp is φ the center of the data, and the independent variable is the distance X X p between the data X and the center Xp.
F(X) based on radial basis functions is defined as a linear combination of radial basis functions, as shown in Formula (14).
F ( X ) = p = 1 P w p φ ( X X p )
wherein wp is the corresponding weight value. In the regularized RBF neural network, Xp is the sample itself, and X is known. φ is the Gaussian function; therefore, as long as we find wp, we can obtain F(X).
Bring the data into F(X) to obtain a linear system of Equation (15).
p = 1 P w p φ ( X 1 X p ) = d 1 p = 1 P w p φ ( X 2 X p ) = d 2 p = 1 P w p φ ( X P X p ) = d P
If x = 1, then equation system (15) can be rewritten as equation system (16).
p = 1 P w p φ 1 p = d 1 p = 1 P w p φ 2 p = d 2 p = 1 P w p φ P p = d P
That is
φ 11 φ 12 φ 1 P φ 21 φ 22 φ 2 P φ P 1 φ P 2 φ P P w 1 w 2 w P = d 1 d 2 d P
Write Formula (17) in vector form as shown in Formula (18).
φ W = d
In the formula, φ is an interpolation matrix, and the basis function chosen in the paper is the Gaussian function. Therefore, φ is reversible.
W = φ 1 d
Then, the nonlinear mapping function F(X) is solved. The prediction method model is shown in Figure 3.
The specific steps of the calibration data prediction method are as follows:
Step 1:
Obtain the measurement data of five clock testers of the same model produced by the same manufacturer and year for a certain unit for 4 consecutive years.
Step 2:
Classify the obtained data according to the measurement method, preprocess the data according to the calibration specifications of the clock tester, and obtain stability- and accuracy-related data.
Step 3:
Decommon the data related to measurement stability and accuracy and amplify the error to obtain the feature data.
Step 4:
Normalize the feature data.
Step 5:
Build time-driven prediction models and data-driven prediction models and classify feature data.
Step 6:
Train the two models based on the prediction target to obtain corresponding prediction models and achieve calibration data prediction.
Step 7:
Verify the effectiveness of the RBF neural network prediction method using test samples.

4. Simulation Analysis

To verify the effectiveness of the proposed theory, an RBF neural network model was constructed using MATLAB (https://www.mathworks.com). Modeling can be divided into time-driven models and data-driven models based on the different prediction objectives and input data. The input data of the time-driven model is time and collection frequency, and the output is corresponding measurement data, which can predict the stability and accuracy of the measurement data of the same type of device in the training sample within the year. The data-driven model inputs measurement data for a certain year and outputs measurement data for the corresponding next year, which can predict the stability and accuracy of the measurement data device for the next year.
Based on the physical characteristics of the calibration device, the system calibration uncertainty Urel = 2 × 10⁻⁸ can be obtained from Formulas (5)–(8).

4.1. Time-Driven Model

Using a time-driven model, the data from devices 20163320, 20163340, 20163366, and 20163355 were used as training samples, and the data from device 20163352 were used as test samples for simulation. The simulation results were compared with the BP neural network simulation results, as shown in Figure 4 and Figure 5 and Table 2 and Table 3.
Using a time-driven model and using data from four devices as training samples, the stability fitting curves for the years 2019 to 2022 were obtained, as shown in Figure 4a. Figure 4b shows the comparison between the actual measurement results and predicted results of the fifth device from 2019 to 2022 under stability measurement conditions. The stability of the corresponding year calculated is shown in Table 2. The simulation results show that the predicted results are basically consistent with the measured values. Among them, the RBF neural network has a better-fitting performance compared to the BP neural network, and the predicted stability is closer to the actual value.
Using a time-driven model and using data from four devices as training samples, the accuracy fitting curves for the years 2019 to 2022 were obtained, as shown in Figure 5a. Figure 5b shows the comparison between the actual measurement results and predicted results of the fifth device from 2019 to 2022 under accuracy measurement conditions. The accuracy of the corresponding year calculated is shown in Table 3. The simulation results show that the predicted results are basically consistent with the measured values. Among them, the RBF neural network has a better-fitting performance compared to the BP neural network, and the predicted accuracy is closer to the actual value.

4.2. Data-Driven Model
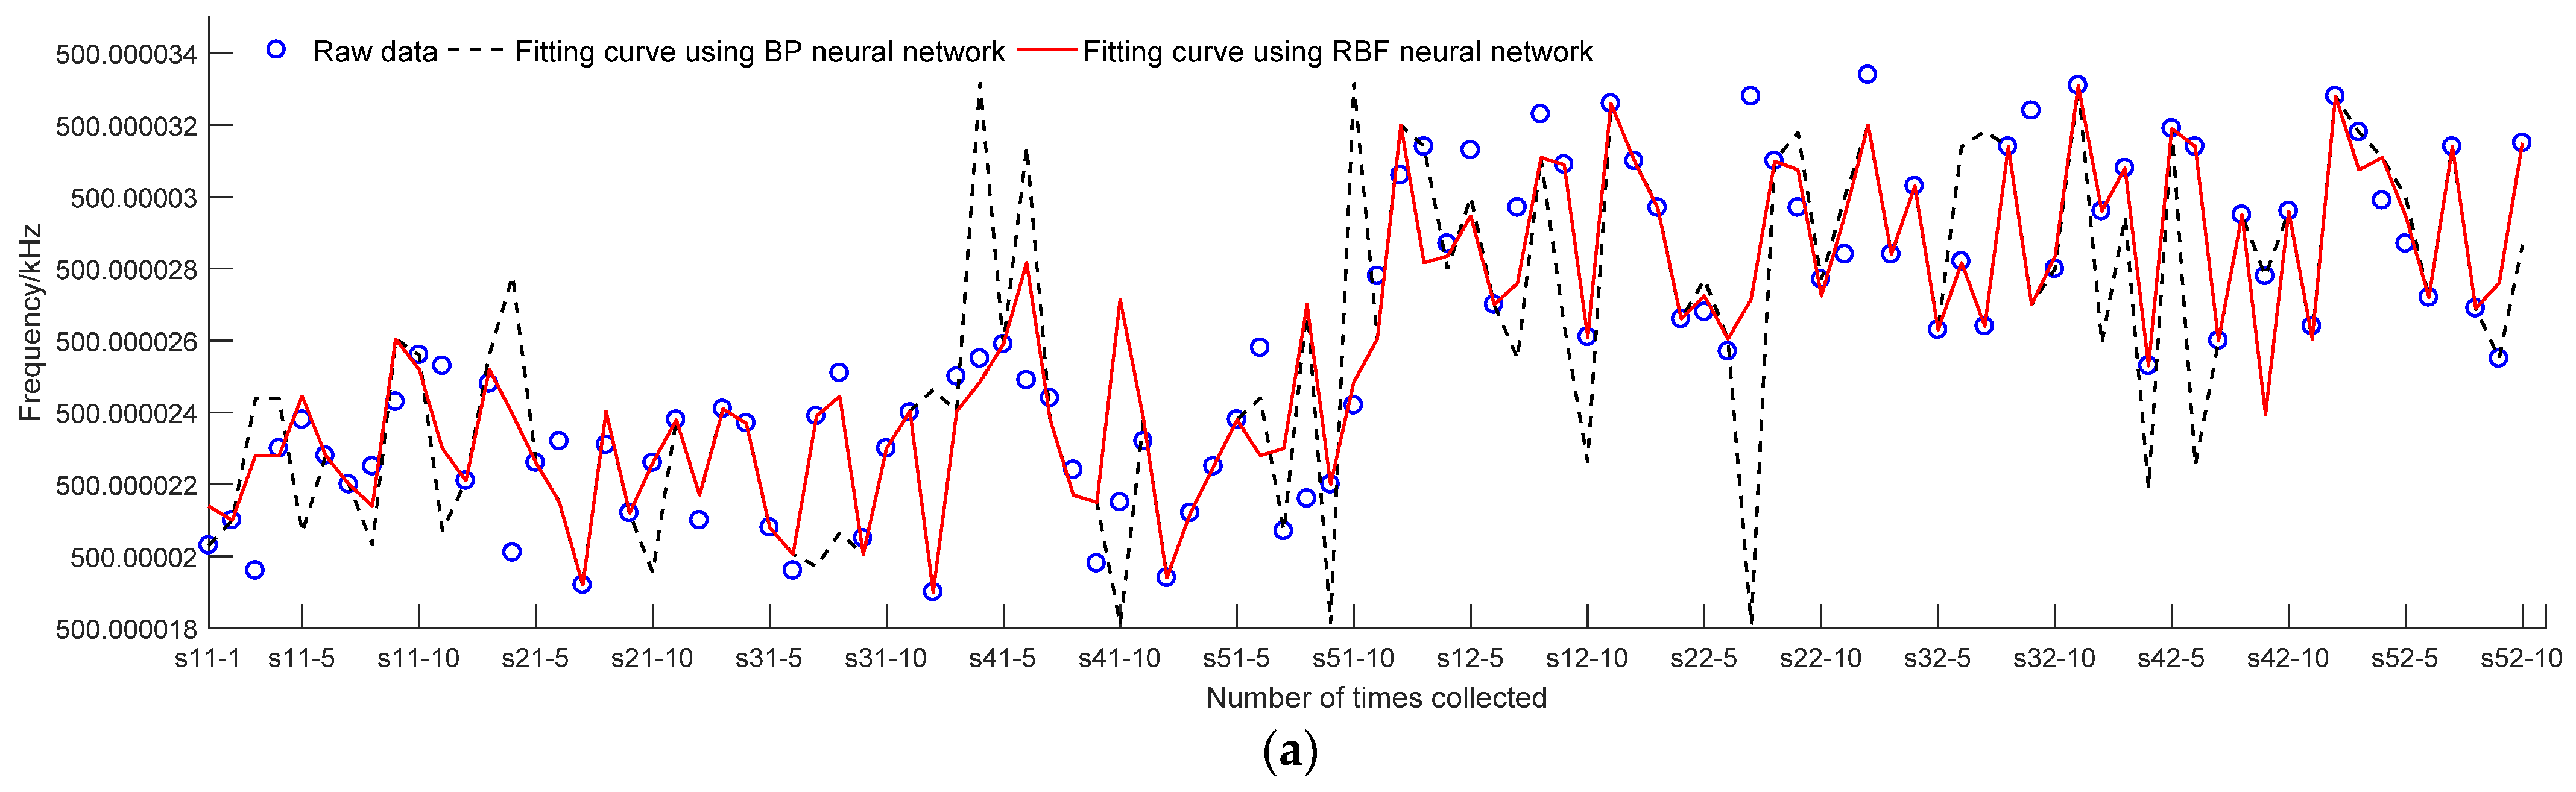
Using a data-driven model, data from five devices from 2019 to 2021 were used as training samples, and data from five devices from 2022 were used as test samples for training and predictive simulation. The results are shown in Figure 6 and Figure 7 and Table 4 and Table 5.
Figure 6a shows the fitting curve of the stability training sample after using a data-driven model, where the abscissa s11-1 represents the measurement data of the first device in the first hour of the first year (2019), and other abscissa annotations are similar. Figure 6b shows the comparison between predicted data and measured data, where the abscissa 1-1 represents the measurement data of the first device in the first hour of the fourth year (2022), and other abscissa annotations are similar. Calculate the corresponding stability of the measured and predicted data according to Formula (2), as shown in Table 4. The simulation results show that the predicted stability is basically consistent with the measured stability, with the RBF neural network having better fitting performance compared to the BP neural network, and the predicted stability is closer to the actual value.
The fitting curve of the training samples for accuracy after using a data-driven model is shown in Figure 7a, and the comparison between predicted data and measured data is shown in Figure 7b. Calculate the data according to Formula (3) to obtain the corresponding accuracy, as shown in Table 5. The simulation results show that the prediction accuracy is basically consistent with the actual measurement accuracy, with RBF neural network having a better-fitting performance compared to BP neural network, and the prediction accuracy is closer to the actual value.

4.3. Error Analysis

Based on the predicted and measured stability/accuracy values, calculate the prediction error to obtain the stability and accuracy errors under time-driven and data-driven conditions, as shown in Figure 8 and Figure 9.
From Figure 8 and Figure 9, it can be seen that both the time-driven model and the data-driven model have predicted data errors of stability and accuracy on the order of 10−9. The mean squared deviations of stability and accuracy prediction errors for RBF neural networks driven by time are 1.077 × 10⁻⁹ and 1.729 × 10⁻¹⁰, respectively. The mean squared deviations of stability and accuracy prediction errors for BP neural networks driven by time are 2.269 × 10⁻⁹ and 2.666 × 10⁻⁹, respectively. The mean squared deviations of stability and accuracy prediction errors for RBF neural networks driven by data are 0.650 × 10⁻¹⁰ and 2.077 × 10⁻⁹, respectively. The mean squared deviations of stability and accuracy prediction errors for BP neural networks driven by data are 5.374 × 10⁻⁹ and 2.112 × 10⁻⁹, respectively. From the data, it can be seen that the mean square deviation of stability and accuracy prediction errors for RBF and BP neural networks is much smaller than the uncertainty of system calibration. The predicted results meet the requirements. The prediction error and mean square error of an RBF neural network are both smaller than those of a BP neural network. Therefore, in the prediction method of clock tester calibration data, an RBF neural network is superior to a BP neural network. The mean square error of the time-driven model prediction data is smaller than that of the data-driven model prediction data. Therefore, when predicting the stability and accuracy of equipment, when there are measurement data of other devices of the same model in the prediction year, a time-driven model can be selected. When there are no predicted annual data, a data-driven model can be selected.

5. Conclusions

In this study, we aimed to build a calibration data prediction model for clock testers using RBF neural networks and explore new ways to improve clock tester traceability calibration. We analyzed the mechanism of calibration parameter generation, determined the type of model training data, and, through normalization processing, avoided the impact of training data differences on the model, thereby improving the model’s prediction accuracy. Based on the different prediction objectives and training sets, we established time-driven prediction models and data-driven prediction models to predict the stability and accuracy of the same type of device in the measurement data year, as well as the stability and accuracy of the measurement data equipment in the next year. Through simulation analysis, the prediction model built using an RBF neural network has more advantages in data fitting and calibration data prediction compared to the prediction model built using a BP neural network. The prediction accuracy of time-driven prediction models is better than that of data-driven prediction models. The prediction errors of both time-driven and data-driven prediction models are in the order of 10−9, which is much smaller than the uncertainty of system calibration and meets the prediction accuracy requirements. When the clock tester meets the prediction requirements and the equipment usage is standardized during the calibration year, the research method in the paper can be considered to replace traditional calibration methods to improve calibration efficiency and lay the foundation for the next step of tracing according to the situation.

Author Contributions

Conceptualization, M.Y. and X.Z.; methodology, M.Y.; software, C.Z.; validation, M.Y., X.Z. and C.Z.; formal analysis, X.Z.; investigation, M.Y.; resources, M.Y.; data curation, M.Y.; writing—original draft preparation, M.Y.; writing—review and editing, X.Z.; visualization, C.Z.; supervision, M.Y.; project administration, C.Z.; funding acquisition, M.Y. All authors have read and agreed to the published version of the manuscript.

Funding

This research was funded by the Science and Technology Plan Project of Gansu (23JRRA1270, 22JR5RA313), the Talent Innovation and Entrepreneurship Project Lanzhou (114), and the Technology Project of Lanzhou Science and Technology of Bureau (2019-1-46).

Data Availability Statement

Data are contained within the article.

Conflicts of Interest

The authors declare no conflict of interest.

References

  1. Liu, X. Discussion on the Calibration Method of Clock Tester. Ind. Metrol. 2017, 27, 44. [Google Scholar]
  2. JJF1662-2017; Clock Tester Calibration Specification. Standards Press of China: Beijing, China, 2017.
  3. Liu, P.; Yin, C.; Jia, N.; Fan, X.; Yang, Q. Short-term Wind Power Prediction Based on Niche Genetic Algorithm and Radial Basis Function Surrogate Model. Acta Energ. Solaris Sin. 2013; in press. [Google Scholar]
  4. Feng, B.; Wang, S.; Feng, M. Application of Improved Radial Basis Interpolation Method in Ship Shape Optimization. J. South China Univ. Technol. Nat. Sci. Ed. 2022, 50, 57–64. [Google Scholar]
  5. Xue, P.; Hao, P.; Wang, H. Novel Gear Fault Diagnosis Method Based on RBF Neural Network. Control Decis. 2022, 37, 409–416. [Google Scholar]
  6. Wang, B.; Zhao, H. Small Obiect Detection in Hyperspectral Images Based on Radial Basis Activation Function. Acta Opt. Sin. 2021, 41, 95–105. [Google Scholar]
  7. Ren, X.; Wang, Y.; Wang, Q. Beam Pattern Optimization Method Based on Radial Basis Function Neural Network. J. Electron. Inf. Technol. 2021, 43, 3695–3702. [Google Scholar]
  8. Hu, M.; Wang, L.; Yang, F.; Zhou, Y. Weighted Radial Basis Collocation Method for the Nonlinear Inverse Helmholtz Problems. Mathematics 2023, 11, 662. [Google Scholar] [CrossRef]
  9. Yin, C.; Ji, Q.; Wen, C. An Adaptive Terminal Sliding Mode Control of Stone-carving Robotic Manipulators Based on Radial Basis Function Neural Network. Appl. Intell. 2022, 52, 16051–16068. [Google Scholar] [CrossRef]
  10. Zhao, Z.; Zhao, H.; Wang, Z.; Zheng, M.; Xun, Q. Radial Basis Function Neural Network Optimal Modeling for Phase-Only Array Pattern Nulling. IEEE Trans. Antennas Propag. 2021, 69, 7971–7975. [Google Scholar] [CrossRef]
  11. Marcin, K. Nature-Inspired Algorithm Implemented for Stable Radial Basis Function Neural Controller of Electric Drive with Induction Motor. Energies 2020, 13, 6541. [Google Scholar]
  12. Ludovico, O.; Fabio, T.; Mauro, Z. Adaptive Maximum Torque per Ampere Control of Synchronous Reluctance Motors by Radial Basis Function Networks. IEEE J. Emerg. Sel. Top. Power Electron. 2019, 7, 2531–2539. [Google Scholar]
  13. Lashkenari, M.; Bagheri, M.; Tatar, A.; Rezazadeh, H.; Inc, M. A Further Study in The Prediction of Viscosity for Iranian Crude Oil Reservoirs by Utilizing a Robust Radial Basis Function (RBF) Neural Network Model. Neural Comput. Appl. 2023, 35, 10663–10676. [Google Scholar] [CrossRef]
  14. Luo, J.; Shan, Y.; Liu, X.; Zhang, Y.; Jiang, E.; Kong, D. A Rapid Method to Predict Biaxial Fatigue Life of Automotive Wheels Using Proper Orthogonal Decomposition and Radial Basis Function Algorithm. Adv. Eng. Softw. 2023, 186, 103543. [Google Scholar] [CrossRef]
  15. Mohammad, A.; Awadh, A.; Aiesh, A.; Aiesh, Q.; Ljaz, A.; Alhashim, H.; Ehsan, E. Developing a Model Based on the Radial Basis Function to Predict the Compressive Strength of Concrete Containing Fly Ash. Buildings 2022, 12, 1743. [Google Scholar]
  16. Hao, G.; Guo, J.; Zhang, W.; Chen, Y.; David, A. High-precision Chaotic Radial Basis Function Neural Network Model: Data Forecasting for The Earth Electromagnetic Signal Before a Strong Earthquake. Geosci. Front. 2022, 13, 101315. [Google Scholar] [CrossRef]
  17. Stephen, O.; Agbotiname, I.; Daniel, A. Radial Basis Function Neural Network Path Loss Prediction Model for LTE Networks in Multitransmitter Signal Propagation Environments. Int. J. Commun. Syst. 2020, 34, e4680. [Google Scholar]
  18. Zhang, S.; Ge, Z.; Fan, X.; Huang, H.; Long, X. Prediction Method of Thermal Conductivity of Nanofluids Based on Radial Basis Function. J. Therm. Anal. Calorim. 2020, 141, 859–880. [Google Scholar] [CrossRef]
  19. Tao, W.; Chen, J.; Gui, Y. Coking Energy Consumption Radial Basis Function Prediction Model Improved by Differential Evolution Algorithm. Meas. Control 2019, 52, 1122–1130. [Google Scholar] [CrossRef]
  20. Yoon, S.; Jeon, H.; Kum, D. Predictive Cruise Control Using Radial Basis Function Network-Based Vehicle Motion Prediction and Chance Constrained Model Predictive Control. IEEE Trans. Intell. Transp. Syst. 2019, 20, 3832–3843. [Google Scholar] [CrossRef]
  21. Roshani, M.; Sattari, M.; Muhammad, A.; Roshani, G.; Nazemi, B.; Corniani, E.; Nazemi, E. Application of GMDH Neural Network Technique to Improve Measuring Precision of a Simplified Photon Attenuation Based Two-Phase Flowmeter. Flow Meas. Instrum. 2020, 75, 101804. [Google Scholar] [CrossRef]
  22. Qin, X.; Liu, Z.; Liu, Y.; Liu, S.; Yang, B.; Yin, L.; Liu, M.; Zheng, W. User OCEAN Personality Model Construction Method Using a BP Neural Network. Electronics 2022, 11, 3022. [Google Scholar] [CrossRef]
  23. Lv, C.; Liu, Y.; Liu, J.; Yu, Z. Application of Generalized Radial Basis Function Neural Network to Thermal Error Modeling. Opt. Precis. Eng. 2015, 23, 1705–1713. [Google Scholar]
Figure 1. Topological structure of regularized RBF neural networks.
Electronics 12 04677 g001
Figure 2. Topological structure of generalized RBF neural networks.
Electronics 12 04677 g002
Figure 3. Predictive model for calibration data.
Electronics 12 04677 g003
Figure 4. Fitting curve and predictive data for stability of time-driven models. (a) Stability fitting curve; (b) Stability prediction results.
Electronics 12 04677 g004aElectronics 12 04677 g004b
Figure 5. Fitting curve and predictive data for accuracy of time-driven model. (a) Accuracy fitting curve; (b) Accuracy prediction results.
Electronics 12 04677 g005
Figure 6. Fitting curve and predictive data for stability of data-driven models. (a) Stability fitting curve; (b) Stability prediction results.
Electronics 12 04677 g006
Figure 7. Fitting curve and predictive data for accuracy of data-driven model. (a) Accuracy fitting curve; (b) Accuracy prediction results.
Electronics 12 04677 g007aElectronics 12 04677 g007b
Figure 8. Stability and accuracy prediction errors using time-driven models.
Electronics 12 04677 g008
Figure 9. Stability and accuracy prediction errors using data-driven models.
Electronics 12 04677 g009
Table 1. Partial sample data.
Sample NumberTimeMeasurement ConditionsPartial Measurement Data/kHz
2016332015 April 2019Stability measurement conditions: measure every 1 h500.0000156\500.0000187
500.0000162\500.0000198
2016334014 April 2020Accuracy measurement conditions: random measurement500.0000253\500.0000221
500.0000248\500.0000201
2016336612 April 2021Stability measurement conditions: measure every 1 h500.0000264\500.0000303
500.0000324\500.0000264
2016335520 May 2022Accuracy measurement conditions: random measurement500.0000329\500.0000324
500.0000370\500.0000390
2016335221 May 2022Stability measurement conditions: measure every 1 h500.0000377\500.0000331
500.0000357\500.0000335
Table 2. Comparison between the actual value and the predicted value of stability.
TimePractical StabilityStability Prediction Using BP Neural NetworkStability Prediction Using RBF Neural Network
20191.080 × 10−80.912 × 10−81.200 × 10−8
20201.160 × 10−81.326 × 10−81.040 × 10−8
20211.300 × 10−81.481 × 10−81.220 × 10−8
20221.520 × 10−81.993 × 10−81.360 × 10−8
Table 3. Comparison between the actual value and the predicted value of accuracy.
TimePractical StabilityAccuracy Prediction Using BP Neural NetworkAccuracy Prediction Using RBF Neural Network
20193.510 × 10−83.394 × 10−83.498 × 10−8
20204.488 × 10−84.714 × 10−84.618 × 10−8
20215.842 × 10−85.708 × 10−85.906 × 10−8
20227.510 × 10−86.983 × 10−87.290 × 10−8
Table 4. Comparison between the actual value and the predicted value of stability (2022).
Equipment NumberPractical StabilityStability Prediction Using BP Neural NetworkStability Prediction Using RBF Neural Network
201633201.460 × 10−82.036 × 10−81.167 × 10−8
201633401.500 × 10−82.537 × 10−81.202 × 10−8
201633661.440 × 10−81.082 × 10−81.154 × 10−8
201633551.440 × 10−82.298 × 10−81.159 × 10−8
201633521.520 × 10−83.134 × 10−81.171 × 10−8
Table 5. Comparison between the actual value and the predicted value of accuracy (2022).
Equipment NumberPractical AccuracyAccuracy Prediction Using BP Neural NetworkAccuracy Prediction Using RBF Neural Network
201633207.436 × 10−87.282 × 10−87.341 × 10−8
201633407.142 × 10−86.974 × 10−87.282 × 10−8
201633667.456 × 10−87.133 × 10−87.150 × 10−8
201633557.110 × 10−87.358 × 10−87.335 × 10−8
201633527.510 × 10−87.361 × 10−87.386 × 10−8
Disclaimer/Publisher’s Note: The statements, opinions and data contained in all publications are solely those of the individual author(s) and contributor(s) and not of MDPI and/or the editor(s). MDPI and/or the editor(s) disclaim responsibility for any injury to people or property resulting from any ideas, methods, instructions or products referred to in the content.

