Article

Autonomous Vehicle Emergency Obstacle Avoidance Maneuver Framework at Highway Speeds

Automated Driving Laboratory, Ohio State University, Columbus, OH 43210, USA
*
Author to whom correspondence should be addressed.
Electronics 2023, 12(23), 4765; https://doi.org/10.3390/electronics12234765
Submission received: 27 October 2023 / Revised: 17 November 2023 / Accepted: 20 November 2023 / Published: 24 November 2023
(This article belongs to the Special Issue Active Mobility: Innovations, Technologies, and Applications)

Abstract

:
An autonomous vehicle (AV) uses high-level decision making and lower-level actuator controls, such as throttle (acceleration), braking (deceleration), and steering (change in lateral direction) to navigate through various types of road networks. Path planning and path following for highway driving are currently available in series-produced highly automated vehicles. In addition to these, emergency collision avoidance decision making and maneuvering are another key and essential feature that is needed in a series production AV at highway driving speeds. For reliability, low cost, and fast computation, such an emergency obstacle avoidance maneuvering system should use well-established conventional methods as opposed to data-driven neural networks or reinforcement learning methods, which are currently not suitable for use in highway AV driving. This paper presents a novel Emergency Obstacle Avoidance Maneuver (EOAM) methodology for AVs traveling at higher speeds and lower road surface friction, involving time-critical maneuver determination and control. The proposed EOAM framework offers usage of the AV’s sensing, perception, control, and actuation system abilities as one cohesive system to avoid an on-road obstacle, based first on performance feasibility and second on passenger comfort, and it is designed to be well integrated within an AV’s high-level control and decision-making system. To demonstrate the efficacy of the proposed method, co-simulation including the AV’s EOAM logic in Simulink and a vehicle model in CarSim is conducted with speeds ranging from 55 to 165 km/h and on road surfaces with friction ranging from 1.0 to 0.1. The results are analyzed and interpreted in the context of an entire AV system, with implications for future work.

1. Introduction

Though automotive safety technology has improved substantially over recent decades, there are still several accidents each year, with fatalities of approximately 1.25 million people annually [1,2]. The National Motor Vehicle Crash Causation Survey, conducted from 2005 to 2007, showed that 94% of all vehicle crashes in the US were due to driver error [3]. Of those driver-related errors, the largest percentage (41%) of human error was due to Recognition Errors, which can include driver inattention, internal and external distractions, and inadequate surveillance. This was followed by Decision Errors (33%), such as driving too fast for the existing road conditions, and misjudgment of either the gap between vehicles or other vehicle speeds. These sobering statistics demonstrate that human driving errors cause many car accidents, which are often fatal, even with the latest vehicle safety improvements. These statistics grow in severity as (a) vehicle speeds increase and (b) road and/or environmental conditions degrade.
One predominant takeaway from these collective statistics is that an autonomous vehicle (AV) could be well suited to safely deal with these driving situations that require evasive maneuvering, with high precision and accuracy, full utilization of the associated vehicle dynamics, and comprehensive real-time data regarding the outside environment. In this context, an AV is assumed to be equipped with Level 3–5 autonomy, as defined by the Society of Automotive Engineers J3016 standard [4]. An AV with an exclusive subsystem designed to handle Emergency Obstacle Avoidance Maneuvers (EOAMs) would be ideal to specialize in more severe AV obstacle avoidance tasks.
Regarding obstacle avoidance maneuvers for AVs, there are several works within the past 30 years that detail useful inputs for an AV to complete a lane change during severe lateral dynamic conditions. An earlier emergency maneuver study tested various types of steering controllers that utilized input data that could be extracted from onboard vehicle sensors without asserting decision-making logic for the AV [5]. Later updates provided by [6,7] included specific decision-making logic based on vehicle states relative to sensed road objects, such that the AV may either brake, steer and brake, or provide a pure steering maneuver to avoid the on-road object ahead.
Reference [8] offered a scoring-based system that utilized a minimum safety distance and required steering frequency with maximum lateral acceleration to assess emergency maneuver safety and comfort score. Additionally, ref. [9] provided a lookup table approach to create an obstacle avoidance trajectory for an AV with parameter–space robustness that could be computed in real time, and this approach was implemented using rapid prototype hardware in an HIL environment and then on an actual vehicle. A combined geometric and kinematic approach was used to treat the same problem in [10].
It is noted that many different approaches can work for an AV in an emergency maneuver situation. What is novel in this paper is the implementation of a particular decision-making and trajectory-generating approach within the context of an entire AV high-level system, which can work in real time and can, therefore, easily be integrated into a production-level AV system framework. This paper preserves recognition of an AV system hierarchy when determining the time and conditions in which the emergency maneuver should occur, the control handoff from the high-level AV system to the specific AV emergency maneuver domain, and the return of vehicle control back to the high-level AV system after the maneuver is complete.
It should also be noted that a probabilistic trajectory approach for obstacle avoidance was adopted by some researchers like reference [11], for example. A probabilistic approach works well in indoor robotics and challenge and demonstration environments but has problems in demanding applications like highway speed driving and is not used here. Model predictive control was used in reference [12]. Model predictive control can add the vehicle dynamics as a constraint in a collision avoidance application but suffers from high computational load and relying on weights to indirectly control performance.
The goal of a production-intent AV emergency maneuver framework and its active integration within the high-level AV system architecture of this paper are unique features. This contrasts with the data-driven neural network and reinforcement learning approaches that have appeared in the literature in recent years as advanced methods. For example, reference [13] used a back propagation neural network with lateral acceleration, longitudinal distance, lateral separation, AV speed and other vehicle speed as inputs, and brake percentage and steering percentage as outputs for collision avoidance maneuver computation. Neural network-based methods for collision avoidance low-level actuator command determination like these rely on training to adjust their weights and do not perform well when the training data do not contain the encountered situation, which may be rare or extreme like an emergency collision avoidance maneuver. Training data are usually generated using simulations, and the dynamics of the vehicle is not incorporated into the solution procedure as in conventional methods. Neural network-based methods also require a powerful computational system and are usually implemented using graphical processing units. Reinforcement learning and deep reinforcement learning methods like [14] use rewards or costs to train and develop a collision avoidance policy. While they move in the right direction of avoiding collisions, which maximize the reward and, hence, have basic feedback built in as compared to the simple pattern recognition approach of neural networks, they also suffer the same disadvantages as neural network-based methods. In addition, reinforcement learning methods may require extensive training and may not always converge to the desired collision avoidance solution. Reinforcement learning in smart vehicular technologies is given in [15], and other applications for collision avoidance are given in [16,17,18]. Finally, although effective, most of these procedures lack explainability features, actual technology such as Large Language Models (LLMs) combined with traditional approaches could enhance the understandability and interpretation of the actions taken by the systems [19]. It is clear that these approaches cannot be applied to a production-intent AV emergency obstacle avoidance maneuver. Hence, this paper focuses on developing and evaluating a conventional, inverse vehicle dynamics-based solution that can easily be integrated into a production AV’s decision making and perception system and is computationally fast, accurate, and reliable.
The method proposed in this paper needs the vehicle to be drive by wire with automated braking and automated steering capabilities. Drive-by-wire systems [20,21], including brake-by-wire [22,23] and steer-by-wire systems, are readily available as a result of the development of Advanced Driver Assistance Systems (ADASs) and SAE L2+ and above automated driving systems. Automated braking capability is needed in Automatic Emergency Braking [24] and Adaptive Cruise Control [25,26] systems available in many new cars. Automated steering capability is needed for lane-keeping assistance systems [27], which are also available in many new cars. The availability of automated braking and steering capability in current road vehicles will make the proposed approach of this paper easy to implement in production vehicles.
The organization of the rest of this paper is as follows. Section 2 is the Materials and Methods, which introduces the AV EOAM framework design goals, system description, and modeling details. The EOAM framework decision-making logic creation details are also presented in Section 2, along with additional EOAM framework novelties. The simulation scenario setup is presented in Section 3 (Simulation Experiment Setup). The results are presented and discussed in Section 4 (Results and Discussion). The final conclusions and recommendations for future work are provided in Section 5 (Conclusions).

2. Materials and Methods

2.1. Overall EOAM Framework Goals and System Description

A general AV EOAM framework system should utilize the key AV characteristics shown in Figure 1, comprising relevant World Model Data, Decision-Making Subsystem, Trajectory Generation Subsystem, Trajectory-Tracking Control Subsystem, and Actuation (throttle, steering, and brakes).
This EOAM framework should also embrace operational design domain (ODD) and dynamic driving task (DDT)-based architecture [28,29,30,31] that allows for specific domains to take care of unique tasks that occur less frequently than normal driving conditions; one of the domains could manage emergency maneuvers involving large-magnitude lateral dynamics with low processing and execution times.
The EOAM framework described in this paper is designed to be a real-time-capable, domain-based system, which can perform successful maneuvers during AV travel at highway speeds (55 km/h to at least 120 km/h) [32] on surfaces that range from ideal (dry, μ = 1.0 ) to slippery (ice, μ = 0.1 ). For an AV to execute an EOAM, the primary AV systems must all function in harmony with the EOAM domain. These systems are as follows: Sensing, Perception, Decision Making, Control, and Actuation.
The overall goals for this EOAM framework are as follows:
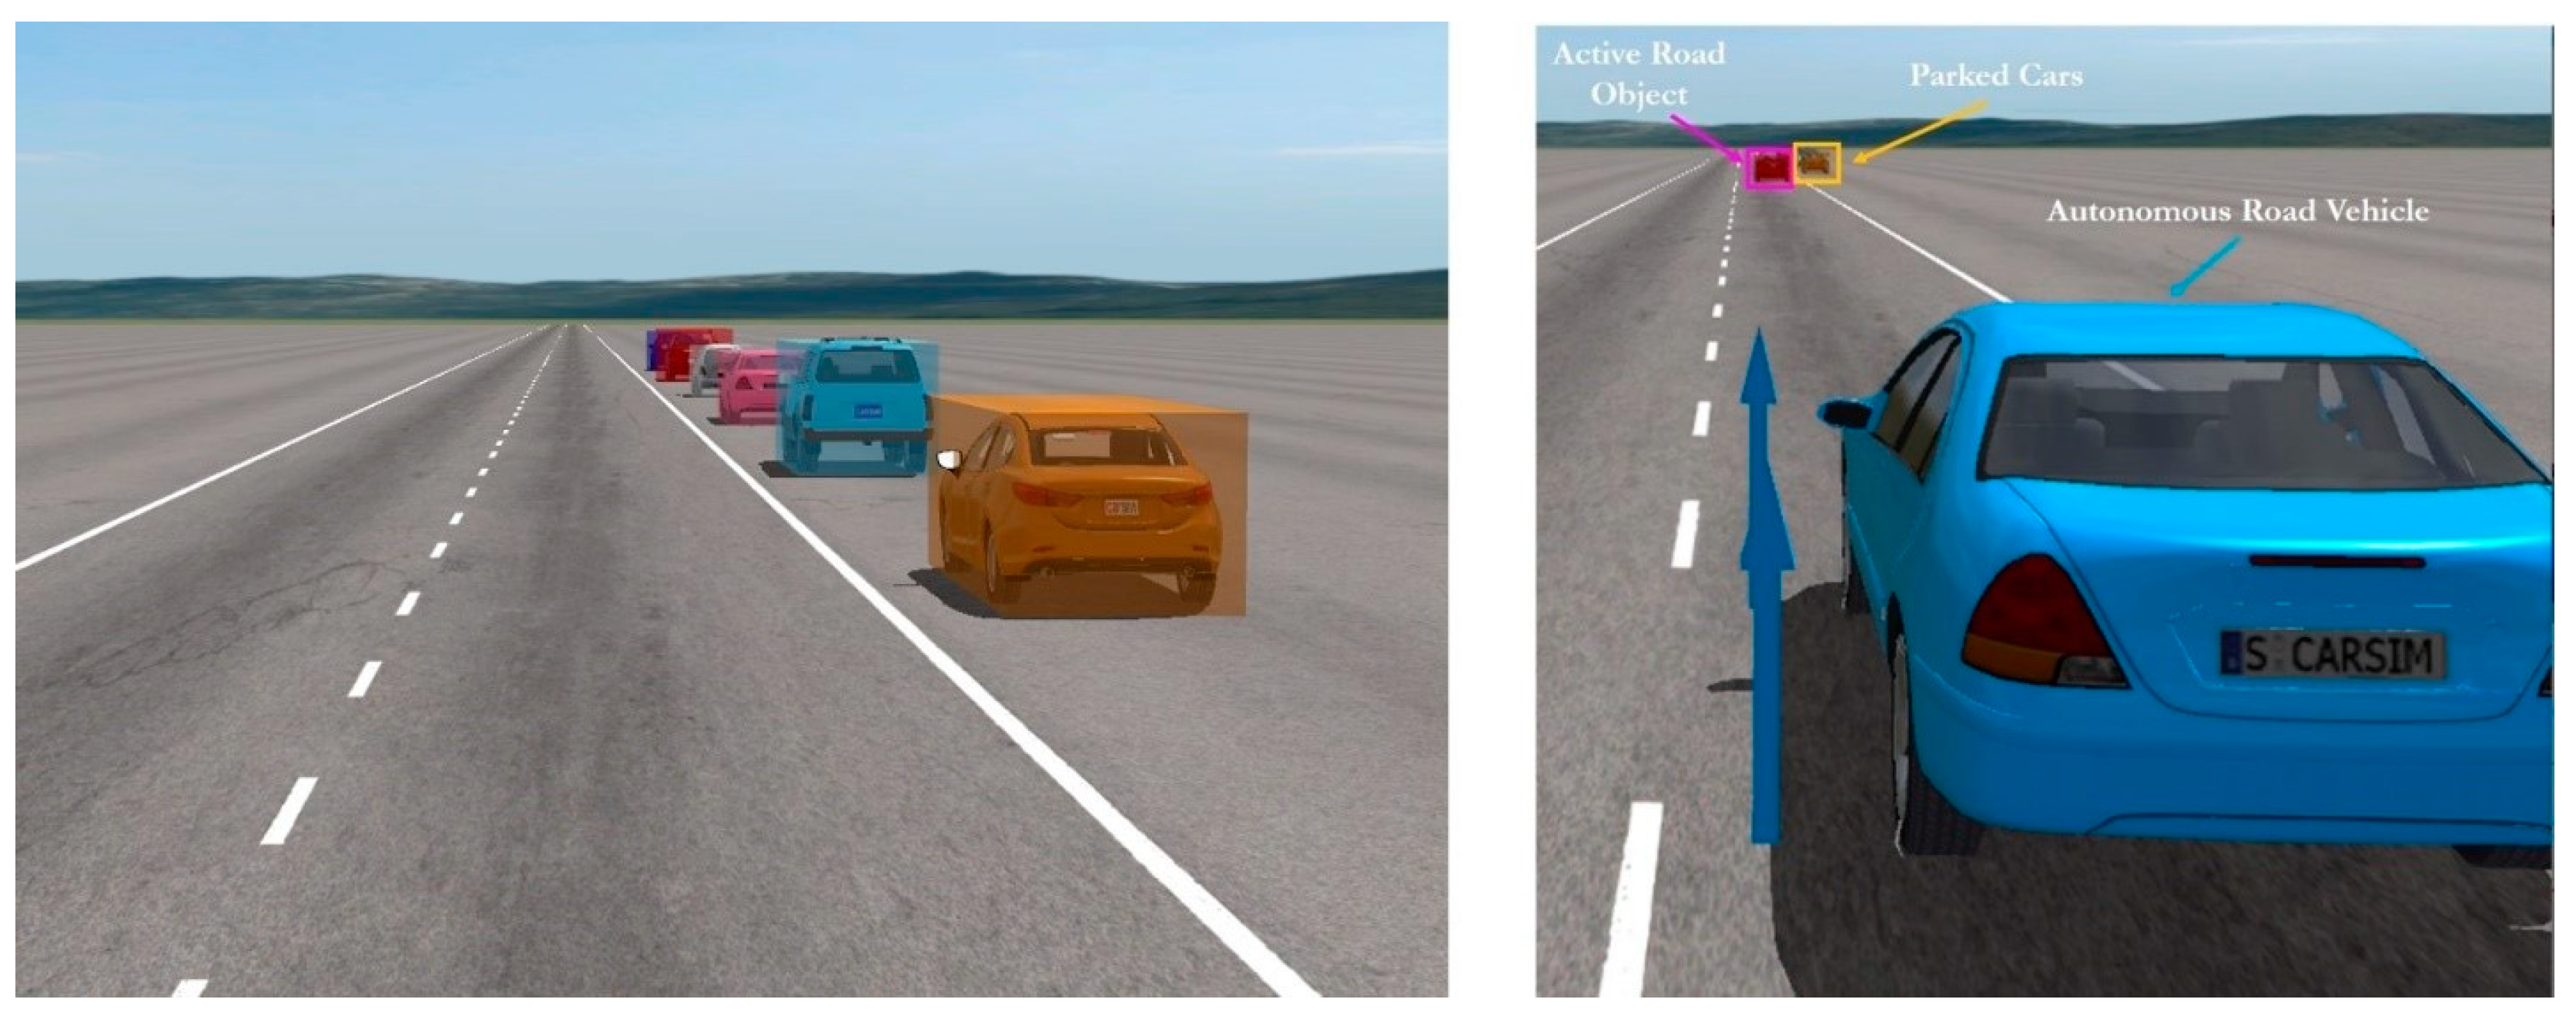
  • Understand and recognize World Model conditions that require an EOAM. This includes the ego AV states and ARO (active road object) relative states;
  • Create and utilize decision-making logic that allows the AV to know what type of maneuver to perform and precisely when to perform it, based on the current environmental conditions, known vehicle traits, and current on-road activity, including the states of the object(s) that must be avoided (the ARO);
  • Through AV actuator (steering, throttle, brake) control, perform the safest emergency maneuver based on environmental, AV, and ARO states;
  • Provide warnings to the vehicle occupants based on AV and ARO states and, potentially, before the EOAM begins. The warnings can also be used to activate pre-collision safety measures, such as occupant safety belt pre-tensioners, airbag arming, and increased seat side and leg bolstering [33,34].
The logic for this EOAM framework was deployed in Simulink with some Matlab functions, then co-simulated with CarSim. This simulation ran faster than in real time as a confirmation that this same software logic could be deployed in actual vehicle hardware within an AV, for real-time decision making and maneuver execution. Below is a summary of the steps utilized in the EOAM framework logic used in this research, based on the system information given earlier in Figure 1.
  • Determine if current conditions are necessary for an EOAM, using the decision-making module (DMM) phase;
  • When a lane change is required, utilize 3D lookup tables that were computed offline to determine the vehicle’s desired longitudinal acceleration and steering input through the maneuver;
  • Utilize steering and longitudinal acceleration controllers to assure that the maneuver is robust enough to be completed as prescribed;
  • Monitor the AV’s lateral position for a point of no return;
  • Provide a specified time-based duration for the entire lane change maneuver to complete that allows the AV to reach a stable final position;
  • After the maneuver is completed, return to the original lane of travel and hand control back to the AV high-level system controller.
Overall, there are six discrete modes of operation that are conducted by the EOAM module within the AV system architecture:
  • NORMAL: the high-level AV system is in control as traffic conditions do not require EOAM intervention;
  • UPDATE, BRAKE: EOAM intervention with occupant warning is required with pure braking; no oncoming vehicle is detected;
  • UPDATE, STEER + BRAKE: an EOAM lane change maneuver with occupant warning, known geometric path, and longitudinal acceleration profile is required; no oncoming vehicle is detected;
  • ONCOMING, BRAKE: an oncoming vehicle is detected at the time of either (1) or (2), but before the AV reaches the lateral point of no return, so limit braking should be conducted;
  • ONCOMING, STEER + BRAKE: an oncoming vehicle is detected at the time of either (1) or (2) and after the AV reaches the lateral point of no return, so the lane change maneuver should continue so that the AV avoids an offset/oblique collision with the first ARO; once the AV reaches the desired position in the next lane, it should immediately return to the original lane to ideally avoid the detected oncoming traffic. After the AV returns to the desired lane position in the original lane, it should hand control back over to the high-level AV system;
  • RETURN: The AV has completed (2) or the AV has reached the desired lane position after (4) occurred, so it should return to the original lane. After the AV returns to the desired lane position in the original lane, it should hand control back over to the high-level AV system.
A summary logic flowchart for the EOAM framework proposed in this paper that combines the high-level EOAM system summary and EOAM framework discrete modes of operation is shown in Figure 2.

2.2. Vehicle and Trajectory Modeling

For simulation of an EOAM under varying surface friction (mu) conditions at highway speeds (55 to 165 km/h), a simplified lateral dynamic model is useful in that it can be linearized about a single longitudinal speed and can capture transient lateral motion, with relatively low computational complexity. The vehicle used in the numerical work in this paper is an E-Class sedan with front-wheel steering and front-engine/rear-wheel-drive powertrain layout, without an anti-lock braking system (ABS) or electronic stability control (ESC). It is well known that current series production vehicles have both ABS [35,36] and ESC [37,38]. The reason for their omission in the simulations here is to focus on the emergency obstacle avoidance maneuver design and evaluation alone and to also see if the developed method creates wheel lockup or yaw stability problems. Through this approach, it was seen that the developed EOAM did not cause any such problems in the simulation studies of this paper.
The equations of motion for the planar bicycle model concerning the vehicle body can be derived by first creating a free-body diagram (as shown in Figure 3) that includes the relevant forces and moments on the vehicle during a turning maneuver, such that Newton’s second law applies [39]. The notation used in Figure 3 is given in Table 1.
The forces can be summed in the longitudinal and lateral directions with respect to the axes fixed to the vehicle body, in addition to the moments summed about the vehicle’s center of gravity [39]:
F x F y f s i n ( δ ) = m a x ,
F y r + F y f c o s ( δ ) = m a y ,
d f F y f c o s ( δ ) d r F y r = I z ψ ¨ ,
where the longitudinal and lateral acceleration vectors contain translational and rotational components
a x = v ˙ x v y ψ ˙ ,
a y = v ˙ y + v x ψ ˙ .
The cornering stiffness for the front and rear tires was obtained as the linear slope at the origin of the lateral force versus slip curves [40] from the CarSim 225/16 R18 Touring Tire data [34]. The lateral tire forces were approximated as linear using tire cornering stiffness ( C α ) and lateral tire slip angle ( α ) with Fy = C α α , in accordance with the literature [39,40,41,42,43,44]. This linear approximation is saturated using:
F y m a x = C α α * ,
which is used as the saturated lateral force output whenever the actual tire slip angle is greater than or equal to the maximum front or rear tire lateral slip angle of 5 degrees ( α m a x = α * = 5 ° ).
A fifth-order polynomial geometric trajectory and constant speed profile comprised the initial trajectory, noting that a coupled path and speed or acceleration profile equates to a trajectory. A fifth-order polynomial was implemented in the EOAM methodology as it is geometrically useful for a single lane change (SLC) maneuver, has geometric G3 continuity, and has a continuous curvature rate when parameterized in terms of arc length. The initial formulation for this fifth-order polynomial trajectory includes a time-based output (C2 parametric continuity), though this path is later parameterized in terms of arc length, so it is ultimately considered with geometric (G3) continuity. Details of how a fifth-order polynomial can be used as a formulation for an AV path generation are noted in [45,46]. If, for example, the desired trajectory had a constant longitudinal speed of 20 m/s, maneuver time of ( t f ) 2.5 s, beginning with zero lateral motion, and desired final y-position ( y f ) of 3.5 m, with zero lateral motion in its final conditions, the output would result in those shown in Figure 4.
The trajectory is parameterized in terms of arc length s for usage in inverse dynamics calculations as
s t = x ( t ) y ( t ) ,
s t = t 0 t f d x d t 2 + d y d t 2 d t ,
where s is the time integral of the two norm of the time derivatives of x ( t ) and y ( t ) . The path curvature is given by
K s = s   ×   s s y ( x ) 1 + y ( x ) 2 3 / 2 = d x d t d 2 y d t 2 d y d t d 2 x d t 2 d x d t 2 + d y d t 2 3 / 2 = d θ d s = θ s .
When considering the angle, which the trajectory makes with the absolute axes in terms of arc length, θ ( s ) , the following formulations of x ( s ) and y s can be determined:
θ s = 0 s K ( τ ) d τ ,
x s = x 0 + 0 s c o s ( θ τ ) d τ ,
y s = y 0 + 0 s s i n ( θ τ ) d τ .
It should be noted that the curvature is defined as
K s = 1 R = ρ ,
where R is the radius of the curvature of the path.
The inverse dynamics premise used in this research is similar to that outlined in [6,47], and those formulation details will not be covered here for the sake of brevity. The inverse dynamics solution outputs for the front and rear slip angles, front and rear lateral tire forces, and steering road wheel angle versus arc length when the initial AV-ARO relative speed is 100 km/h is illustrated in Figure 5. The final front and rear lateral forces and slip angles can then be used as inputs to determine the longitudinal acceleration constraints, as shown in Figure 6 (with the minimum and maximum longitudinal acceleration constraints along with a zero-acceleration example profile for reference).
Once the input steering road wheel angle and the longitudinal acceleration constraints are determined, an optimal or suboptimal longitudinal acceleration profile can be calculated using time-based optimization. This should minimize the total longitudinal distance needed to complete the lane change maneuver. This optimization includes the lateral dynamic constraints of the vehicle based on its relevant parameters (mass, yaw moment of inertia, longitudinal center of gravity location, front and rear tire cornering stiffness, etc.) as well as the lateral and longitudinal force constraints of the tires.
To reiterate, the goal of the nonlinear constrained optimization is to minimize the longitudinal distance traveled by the AV during the entire EOAM, based on the input steering angle and vehicle dynamic constraints and the control input constraints. Thus, the cost function for this optimization includes the longitudinal distance from the initial time of the maneuver to the final time at which the maneuver is complete. The output of the optimization is the longitudinal acceleration profile that represents the minimum distance traveled by the vehicle during the EOAM, given the constraints, boundary conditions, and vehicle states.
When considering this EOAM distance minimization optimal control problem, the AV states are the longitudinal and lateral distances and speeds, yaw, and yaw rate, x = { x , x ˙ , y , y ˙ , ψ , ψ ˙ } , and inputs of tractive force and steering road wheel angle, u = { F t , δ } . The optimization uses the cost function
min u J = m i n u   x 1 t f = m i n u 0 t f x 2 x , u , t d t ,
with initial AV-ARO relative speed at the beginning of the EOAM, x ˙ 0 , and free final time, t f , final yaw angle, ψ ( t f ) , and final yaw rate, ψ ˙ ( t f ) , subject to the system dynamics
x ˙ 1 = x 2 ,
x ˙ 2 = 1 m [ cos x 5 F r sin x 5 F f sin x 5 + u 2 ] ,
x ˙ 3 = x 4 ,
x ˙ 4 = 1 m [ F r cos x 5 + u 1 sin x 5 F f cos x 5 + u 2 ] ,
x ˙ 5 = x 6 ,
x ˙ 6 = 1 I z [ d r F r + d f F f cos u 2 ] ,
boundary conditions
x 1 0 = 0 ,
x 2 0 = x ˙ 0 ,
x 3 t f = y f ,
x 4 0 = x 5 0 = x 6 0 = 0 ,
state constraints
h x = F f x F f m a x x 0 ,
and control constraints
g 1 u = u 2 δ m a x 0 ,
g 2 u = δ m i n u 2 0 ,
g 3 x , u = u 1 F x m a x 2 + F r ( x ) F y m a x ( x ) 2 1 0 ,
g 4 u 1 = u 1 u 1 m a x 0 ,
where Equation (29) is representative of the maximum tractive force due to engine torque, while Equation (28) includes the maximum tire force due to braking that is bound by the friction ellipse. Example outputs of the suboptimal AV final y-position, yaw angle, and yaw rate on the μ = 1.0 surface can be seen in Figure 7. Note that the values in the plots of Figure 7 are zero for any speed below 47 km/h as that was the minimum speed at which EOAM optimization was performed and considered useful for a highway speed application. Corresponding suboptimal outputs for the longitudinal acceleration and longitudinal speed profile, for the AV-ARO relative speed of 100 km/h, are shown in Figure 8.
After the suboptimal longitudinal acceleration profile is determined for a given initial AV-ARO relative speed, the following steps can be used to complete that DMM phase diagram.
  • Note the final AV x and y trajectory coordinates, longitudinal speed and acceleration, path curvature, path yaw, and steering road wheel angle.
    • All of the outputs except for longitudinal speed will be used in the 3D lookup tables in the online Simulink model.
    • The longitudinal speed is used only as a reference when checking the output speed control.
  • Calculate the stopping distance for the vehicle based on the initial relative speed.
  • Calculate the minimum clearing distance (the longitudinal distance needed for the AV front right corner to barely contact the rear left corner of a square object, when completing a left-turn EOAM/lane change) based on the x-y trajectory, path yaw, and expected width of the detected object (outputs and equations shown later in the paper).
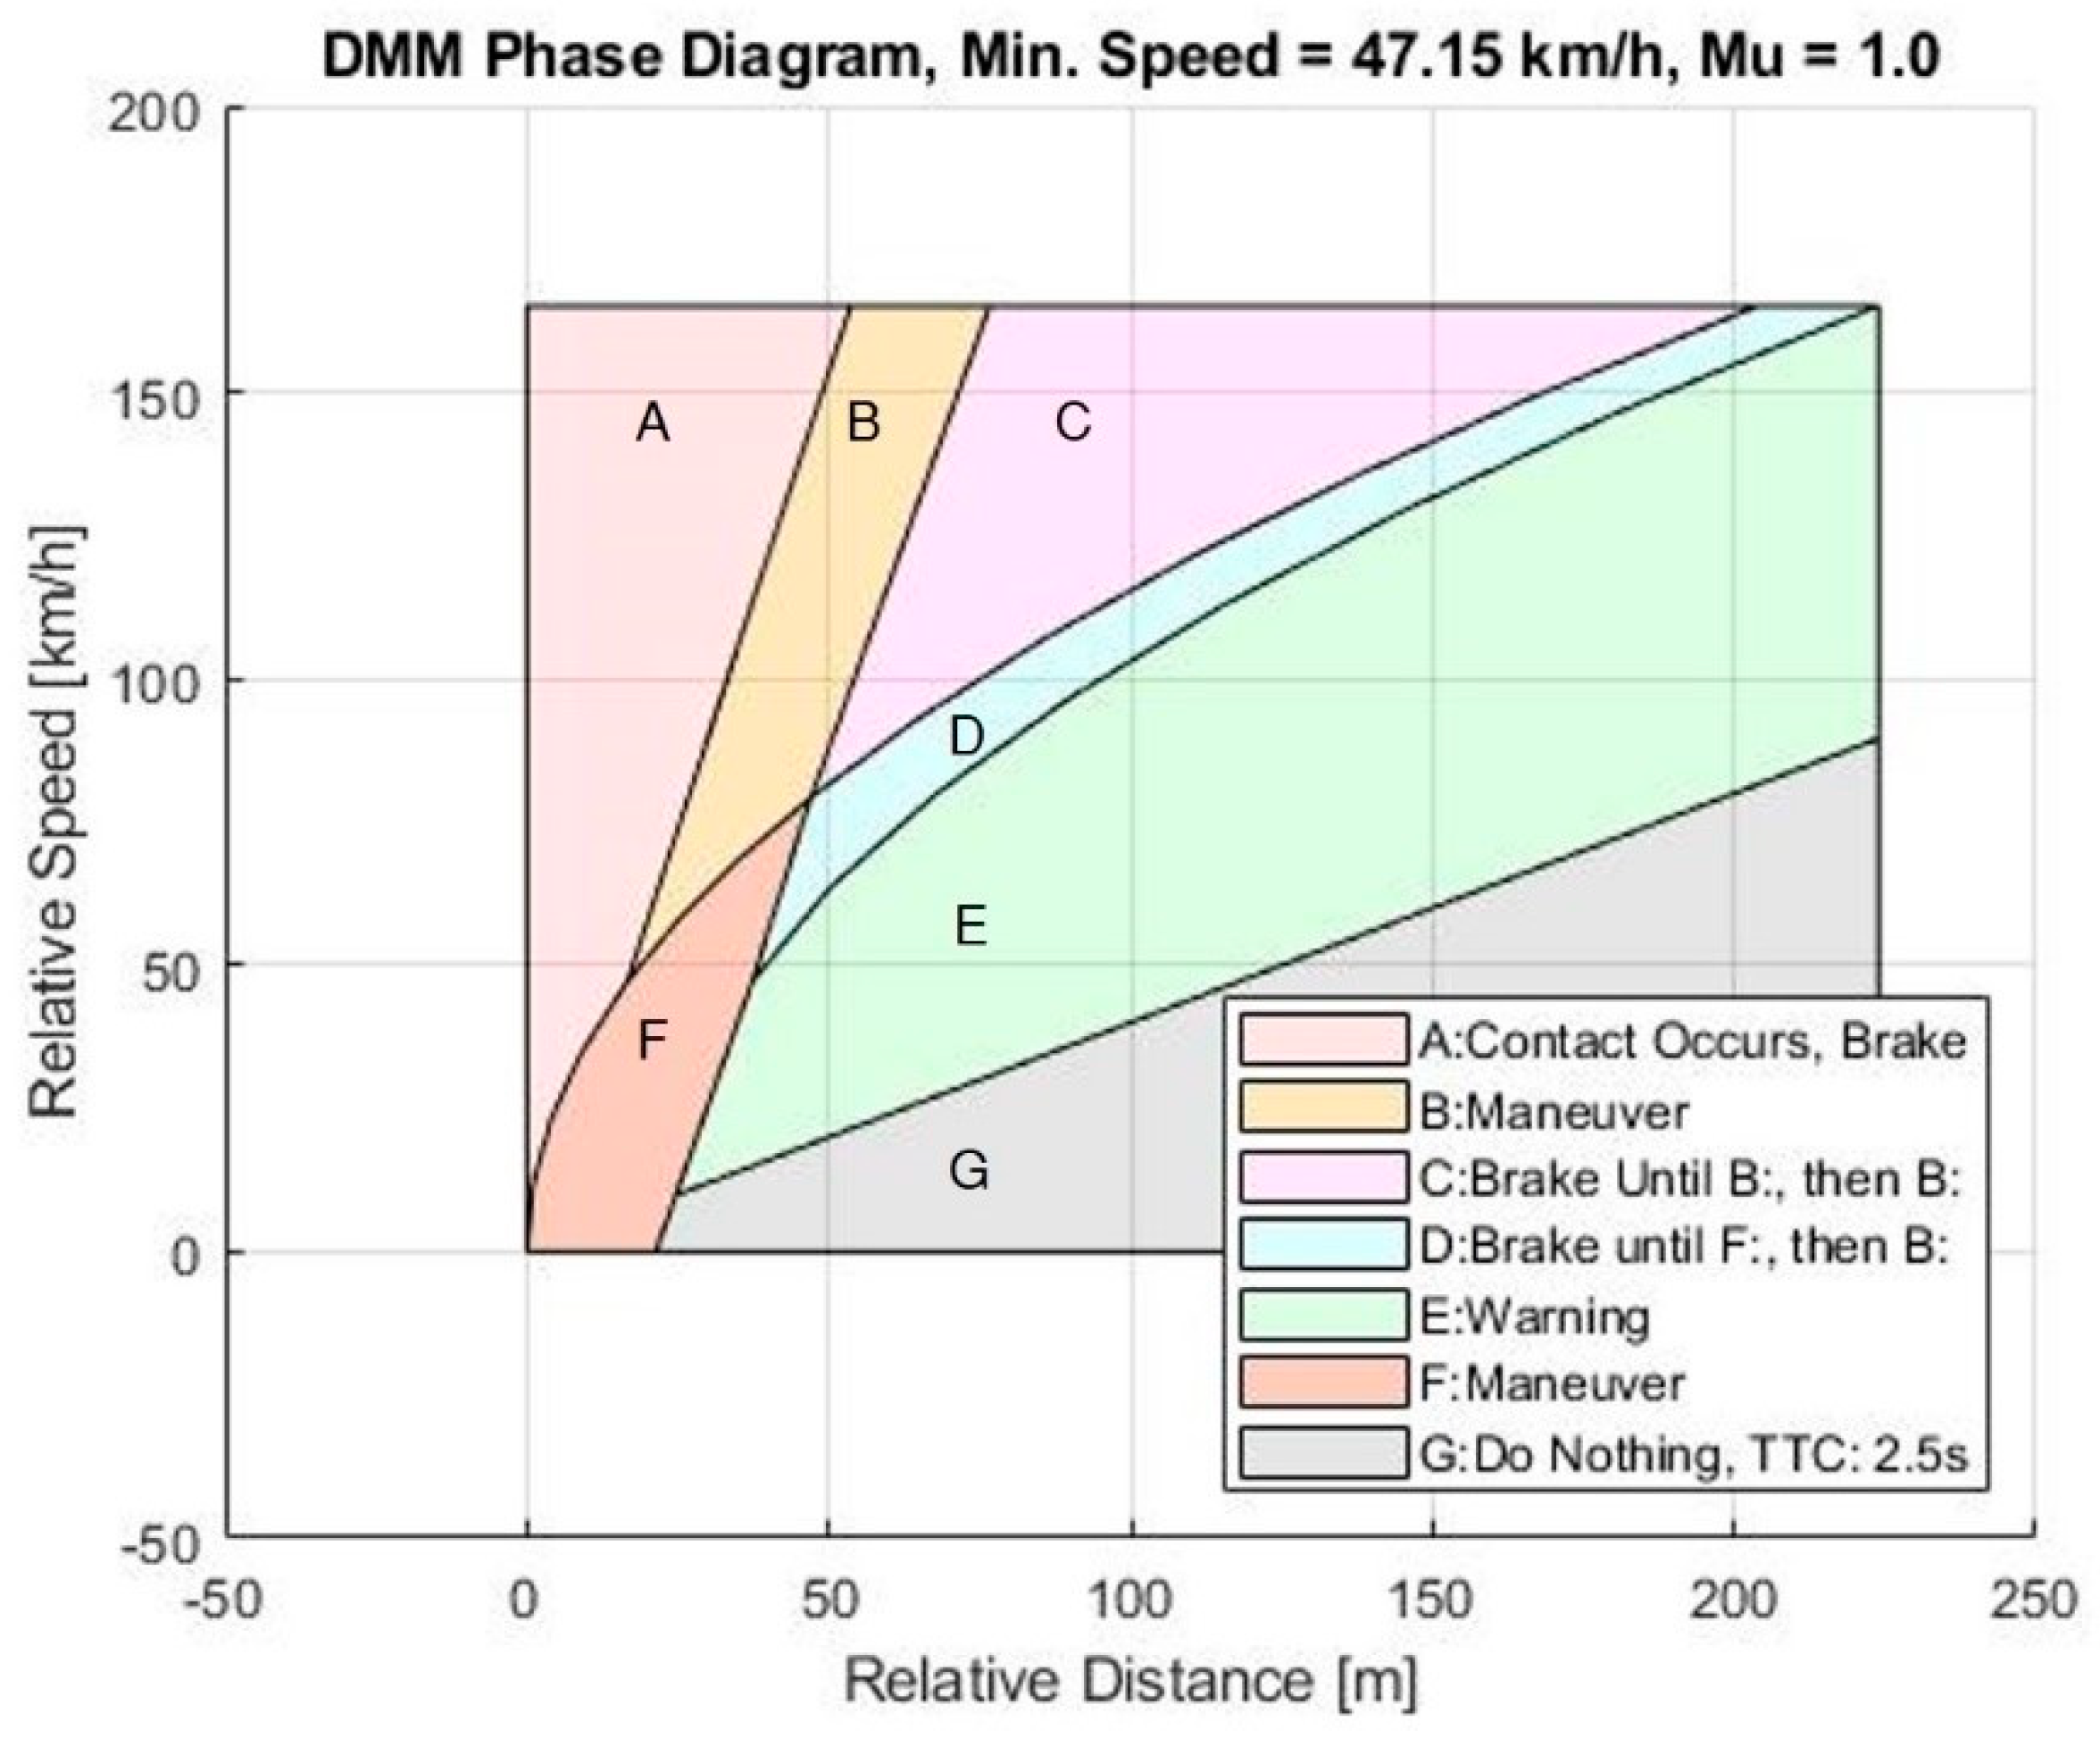
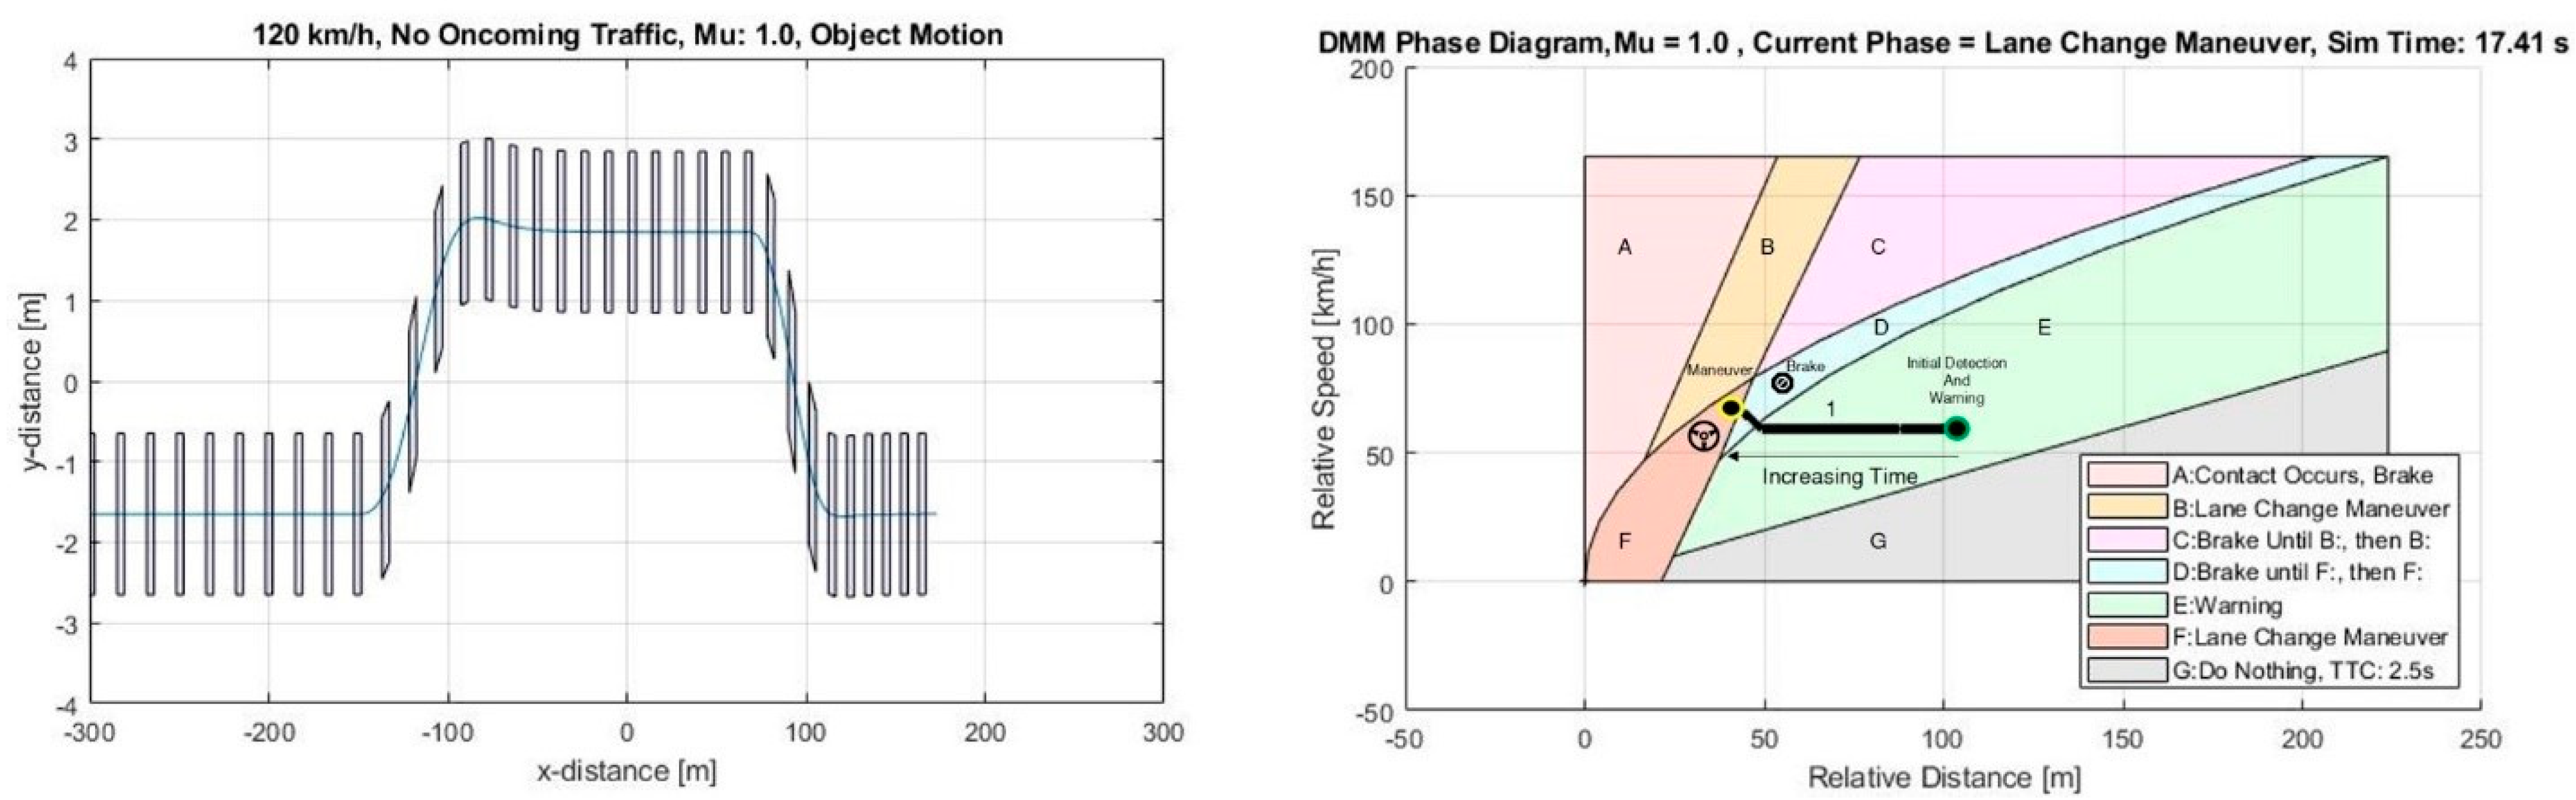
    • Use the combined outputs of the minimum clearing distances and the relative speed between the AV and the ARO at the time of the maneuver and create the EOAM boundary curve in the DMM phase diagram.
    • The stopping distance at each relative speed is also included in the DMM phase diagram.
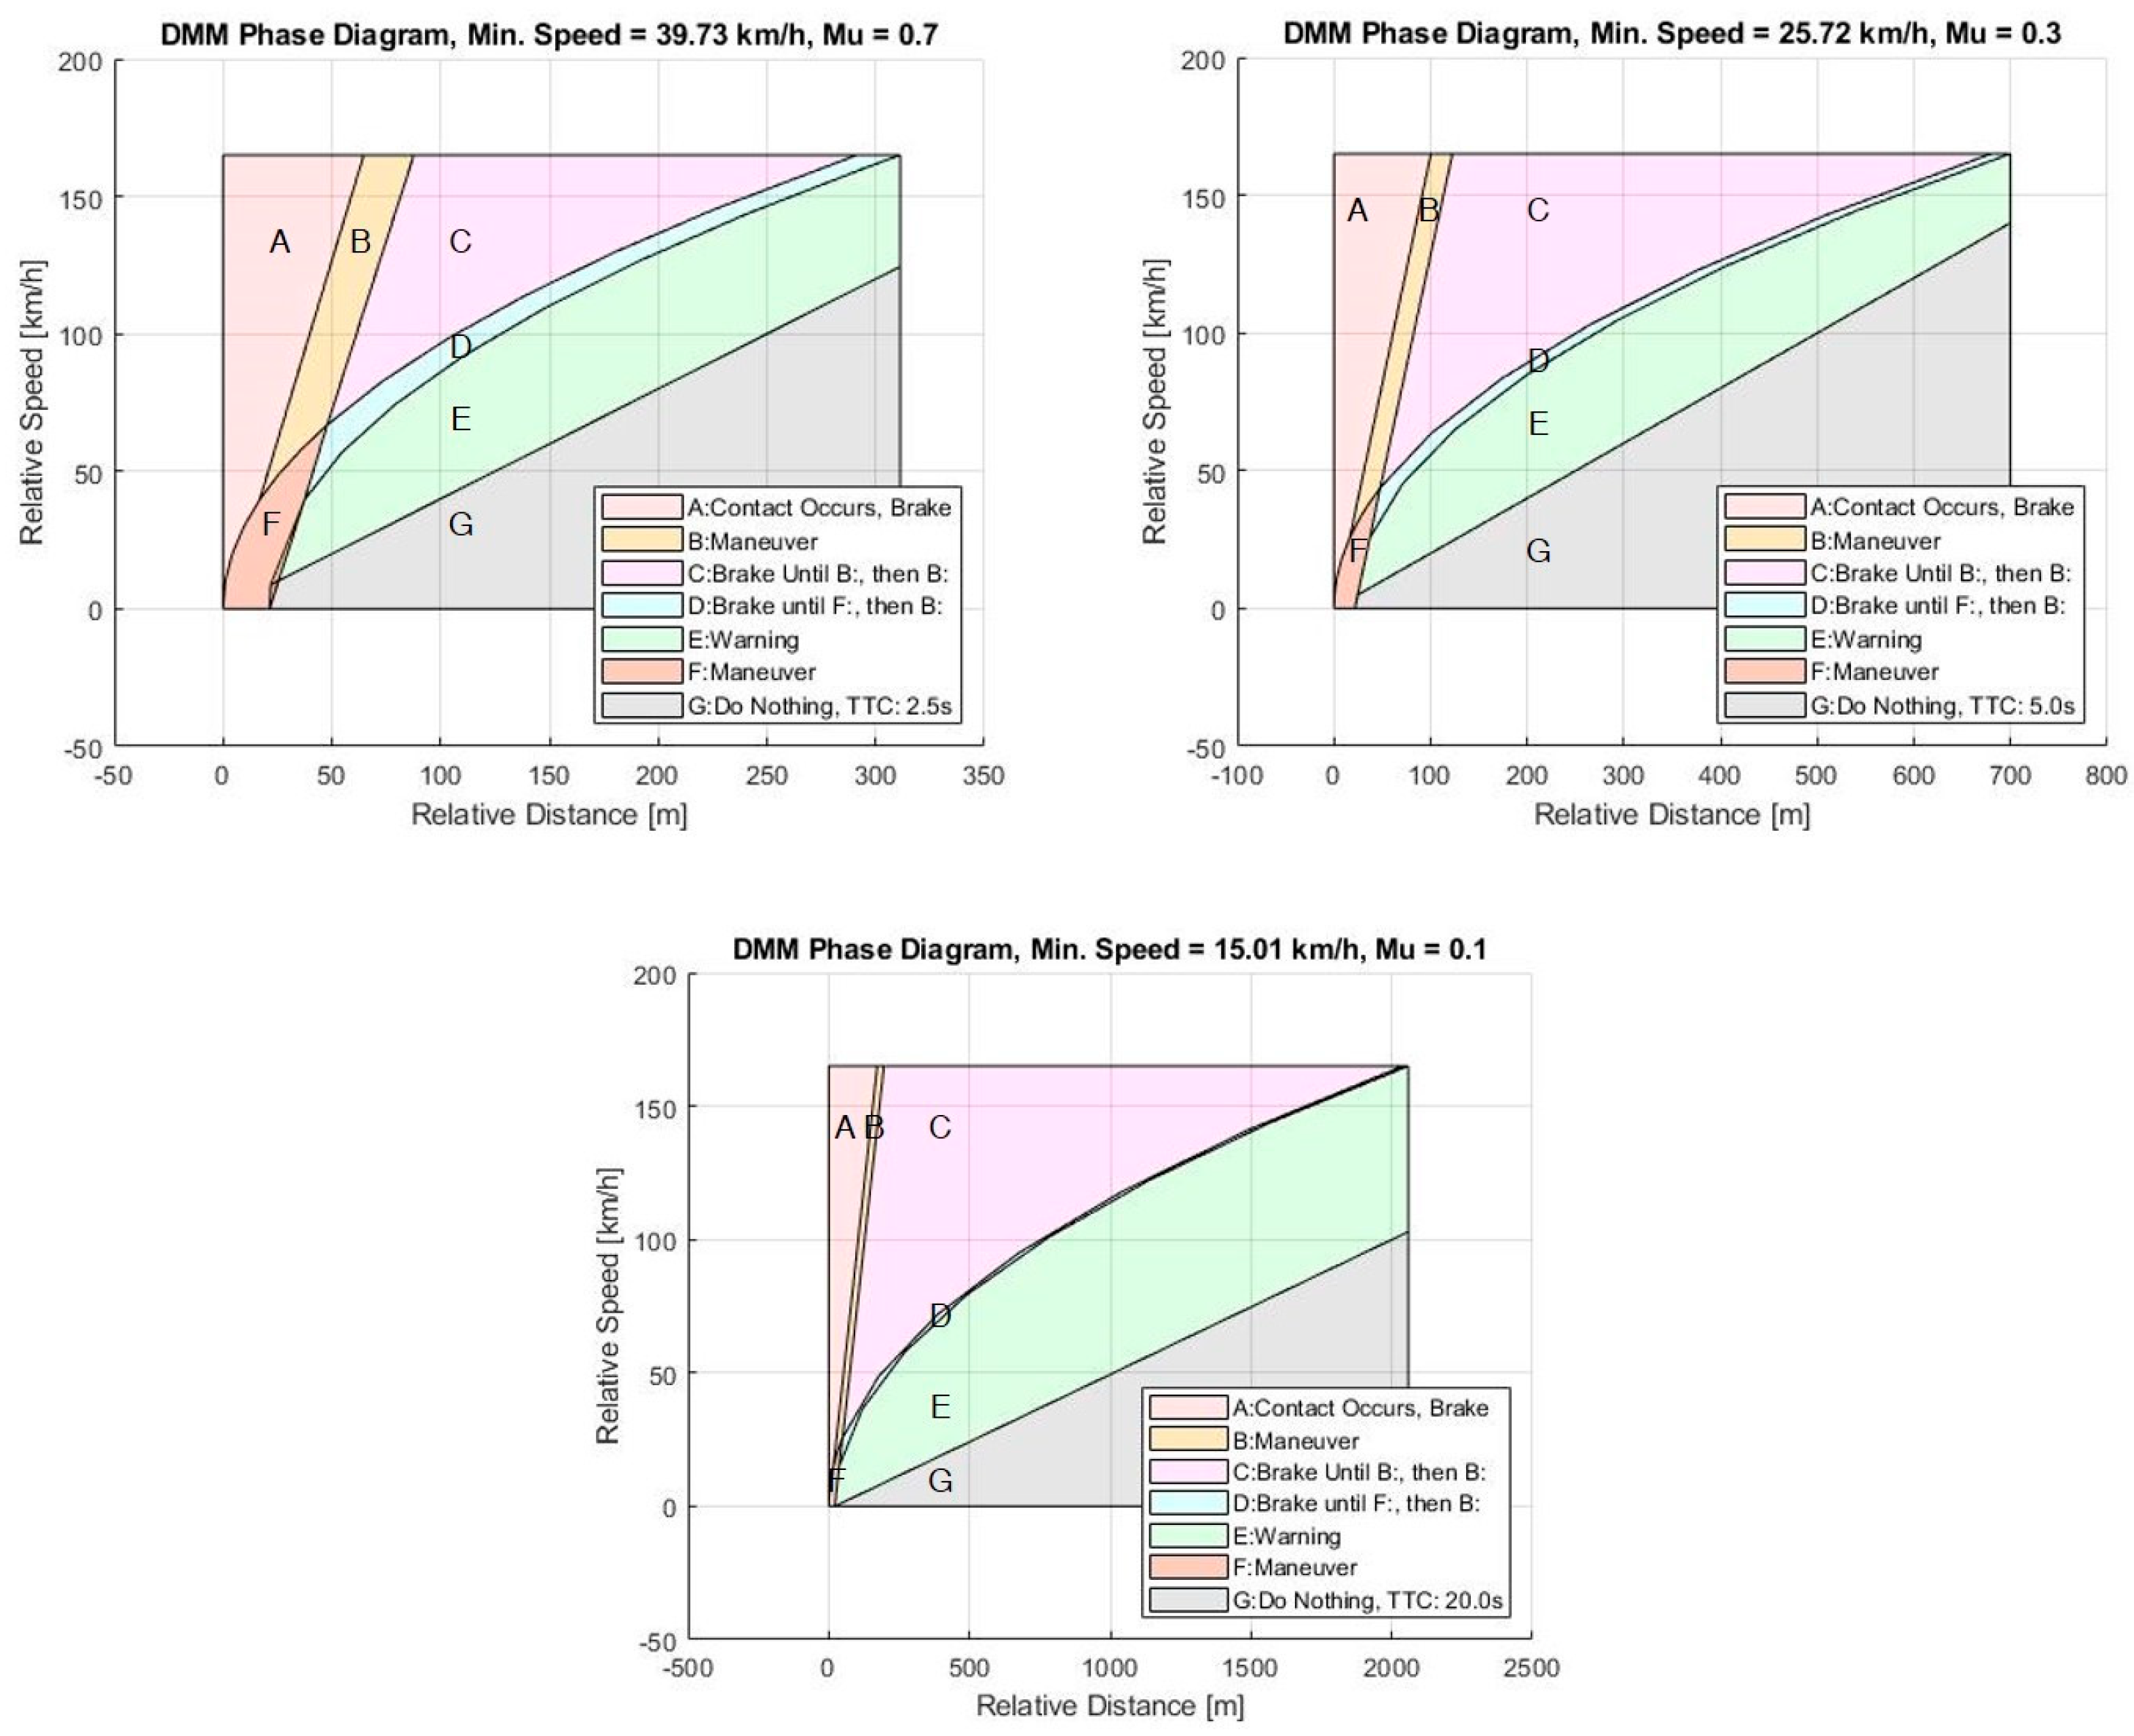
  • Repeat the entire process for the next speed in the range of speeds in the EOAM framework design space and for the desired tire–road surface friction values meant to be included in the 3D lookup tables.
  • Once the entire speed range has been simulated with each effective tire–road surface friction coefficient μ, the DMM phase diagrams for each friction coefficient μ can be created. The trajectory (paired geometric path and speed profile) outputs for the friction coefficient μ of 1.0 are shown in Figure 9, with more details about the phase diagrams to follow.
The EOAM framework decision-making phase diagram (DMM) utilizes relative distance and relative speed between the AV and sensed ARO state variables to determine the EOAM phase, similar to phase diagrams used by [6,7]. One example (used in the research of this paper) of a DMM phase diagram output across a range for relative speeds and on a dry surface ( μ = 1.0 ) can be seen in Figure 10. This diagram contains phase sections divided by the calculated minimum clearing distances (for both suboptimal longitudinal acceleration and constant speed) and stopping distances at various initial AV-ARO relative speeds.
The minimum clearing distance is noted as the shortest longitudinal relative distance needed for the AV to perform a single lane change (SLC) EOAM around the AV, such that during an SLC into a left lane, the AV’s front-right corner touches the rear-left corner of the ARO at a single point [6]. The y-position of the front-right corner of the AV with respect to the rear-left corner of the ARO, during the maneuver, can be determined as shown in Figure 11 for an example EOAM at 100 km/h on surface with mu = 1.0 using
y c l e a r a n c e = w i d o b j 2 ( d f s i n Ψ w i d e g o 2 c o s Ψ ) ,
and
t c = t min y c l e a r a n c e .
The minimum clearing coordinates along the trajectory can be seen on the plot in Figure 12, where
x c l e a r a n c e = x t c + d f c o s Ψ t c + w i d e g o 2 s i n Ψ t c .
The minimum clearance boundary in the DMM phase diagram is, thus, created with the minimum clearing distance ( x c l e a r a n c e ) at each initial maneuver speed x ˙ 0 considered for the EOAM in Equation (32). It is also noted that the stopping distance was calculated with the following formulation:
x s t o p = x ˙ 0 2 2 x ¨ max d e c e l ,
where x ¨ max d e c e l is based on the vehicle weight and road surface friction coefficient μ, which can be determined empirically as the maximum longitudinal deceleration during braking without lockup, as this system is assumed to be without an anti-lock braking system (ABS). The idea that his formulation is based on contact with the ARO—minimal contact but contact nonetheless—makes the usage of buffers for a safety margin clear and necessary. These buffers are used not only to avoid any contact with the ARO during the maneuver but to also reduce the occupant fear and increase their visual comfort in the situation during the maneuver.
The unique DMM phase diagram in this paper embraces the idea that this part of the software logic would be integrated into the system-level AV architecture as a design domain [28,29,30]. This DMM would be a sub-module of the middle-level EOAM framework module. The work in this paper calculates the stopping distance and lane change maneuver boundaries offline with the planar bicycle mode, then uses this phase and 3D lookup table data in online implementation (simulation here) to guide a vehicle through the maneuver. This is achieved by using the boundaries of the phase diagram in the simulated AV logic so that the AV recognizes its position in the phase diagram based on its current states and the detected states of the ARO, then makes decisions with unique EOAM logic and the phase boundaries within the decision-making module (DMM) phase diagram.
For a high-level understanding of this type of phase diagram, it is helpful to visualize that the AV-ARO phase usually moves from right to left and from high to low in the DMM phase diagram. This occurs while the ARO is sensed by the AV’s onboard sensors (radar, camera, lidar, etc.). After the ARO leaves the field of view (FOV) of the AV’s sensors, the DMM phase diagram no longer applies. The ideal final AV state requires the relative speed between the AV and ARO to be zero with a relative distance that is greater than or equal to zero, such that a collision is avoided between the AV and the ARO during the EOAM.
By including an additional minimum clearance phase boundary for the steering maneuver, phase sectors (B and F) can be utilized that allow the AV to avoid the ARO ahead, with some buffer distance and without coming too close to the ARO during the maneuver, as seen in Figure 13. This buffer distance is determined by the EOAM framework system designer and is tunable based on individual performance requirements. This stopping distance buffer sector forms a braking-only sector in the DMM phase diagram (sectors C and D). If the AV-ARO phase is within this sector, the AV applies pure braking until the AV-ARO phase enters one of the steering sectors. In addition to providing sectors that are dedicated to a braking-only maneuver (D), it provides a clear boundary on the phases that require any type of maneuver at all. To the right of this braking-only sector (D), no evasive maneuver is required. However, this braking-only sector is truncated by a maneuver sector represented by the intersection of the steering maneuver and braking maneuvers sector (F) in Figure 13. The area to the right of the braking-only sector is reserved for applying a visual warning to the vehicle occupants that an emergency maneuver is pending, without performing any evasive action. The corresponding sector (E) is to the right of the pure braking sectors. This type of warning is common in ADAS and is sometimes called forward collision warning (FCW). This warning serves to not only give visual and audio indication that a notable object is ahead but can also trigger pre-collision systems.
The last sector added was the “do-nothing” sector (G), representing the AV-ARO phase in which no evasive action is necessary. The boundary for this do-nothing sector is created by the slope of the time-to-collision (TTC) phase boundary. The TTC phase boundary represents the set of phases in which no evasive action is required by the AV. The TTC value of 2.5 s was chosen for the high mu (1.0) detected surface condition, where TTC is calculated as follows:
T T C = r e l a t i v e   d i s t a n c e r e l a t i v e   s p e e d .
For the 0.7 mu surface phase diagram, the same TTC was used as the high mu. For 0.3, this was updated to 5 s, and for 0.1, the value was 20 s. These are all tunable values and are left to the discretion of the system designer. It is noted that as the road surface friction coefficient μ decreases, the slopes of the lines in the DMM phase diagram, based on the representative steering maneuver optimization and stopping distance calculations, also decrease. This decrease in slope equates to the increased necessary distance needed for both steering and braking-only maneuvers to be completed, due to the decreased dynamic longitudinal and lateral force generation capabilities of the AV (especially due to reduction in tire forces on the road surface).
In summary, the additional relative distance between the AV and ARO, provided by the buffers in the DMM phase diagram, directly adds safety margin for the AV and its occupants during an EOAM that utilizes the DMM phase diagram with buffers. As an added benefit, the creation of these buffers also provides additional comfort indirectly. By potentially triggering maneuvers before the final phase boundary is reached for either stopping or steering and braking, the buffers allow the maneuvers to be completed before/without AV contacting the ARO ahead. By adding a distance buffer between the point at which the maneuver begins and the minimum clearing distance, the occupants will be less inclined to believe that contact might occur during the maneuver, especially during the steering maneuvers.
It should be noted that values represented as detectable tire–road surface friction coefficient μ can act as an effective tire cornering force and tractive force reduction coefficient by multiplying the initial linear tire corning stiffness by the mu reduction coefficient. This means that maximum lateral tire force captured by Equation (6) can be adjusted to the following
F y m a x = μ s u r f a c e C α α * ,
F t m i n = μ s u r f a c e F t m i n b r k ,
F t m a x = μ s u r f a c e F t m a x e n g .
to reflect the sensed tire–road surface friction coefficient μ for the maximum tractive force due to engine torque and the minimum tractive force due to braking.
This is not an exact representation of the friction between the tire and the road surface but rather a representation of the possible friction reduction that can occur between a tire and the surface on which it is traveling. There are many approaches to estimating the tire–road friction levels based on available vehicle sensor data, and some of those are listed in the following references for the reader to explore [48,49,50,51,52,53]. Outputs for the phase diagram for effective tire–road surface friction can be seen in Figure 14 for rain on asphalt ( μ = 0.7 ), snow on asphalt ( μ = 0.3 ), and ice on asphalt ( μ = 0.1 ) [54].
During the initial lane-change maneuver, a point-of-no-return lateral threshold value was designated, after which the EOAM logic would complete the lane change maneuver and not allow straight-line braking as an option. Before the point of no return, if the AV sensed an oncoming vehicle, even if the AV has initiated a steering maneuver, the sensed oncoming vehicle acts as an override to the maneuver. In essence, an oncoming vehicle sensed by the ARO will trigger emergency braking to avoid making a lane change into oncoming traffic; however, the success of the point of no return critically depends on the AV’s ability to sense an oncoming vehicle or object, with its perception logic. This point of no return is a lateral threshold from the initial lateral position before the lane-change maneuver begins. In the EOAM logic introduced in this paper, the point of no return was calculated as a percentage of the total lateral lane-change distance of 3.5 m. The point-of-no-return value was set to 0.3 and 0.3 × 3.5 = 1.05 m. An illustration of the point of no return ( y p o n r ) can be seen in Figure 15, where a typical front-looking camera/radar field of view with a perception range of about 100 m is also shown. If the point of no return was utilized, this does not mean that any accident was avoided—on the contrary, it is likely that some contact would occur with the object directly in front of the AV. However, by choosing to execute straight-line braking instead of a lane-change maneuver, the AV would be utilizing the front crash structures of its vehicle body to better absorb some of the energy in a direct collision compared to the lack of energy offset or oblique collision with an oncoming or adjacent object in the next lane.
As mentioned earlier, lookup table data are acquired during the process of creating the DMM phase diagram. These data consist of the calculated geometric trajectory for the lane-change maneuver, path yaw angle, path curvature, and longitudinal acceleration, all of which are necessary to calculate the steering maneuver and accompanying optimal or suboptimal speed profile during the maneuver. The steering angle data were not used in a lookup table reference, because the path curvature and control logic were enough to complete the lane change. Alternatively, the steering angle data or instantaneous path curvature and control logic could have been used together to complete the lane change as well. Each lookup table contains uniform x-distance and speed values with variable table data—the lookup tables utilized in this EOAM framework are as follows:
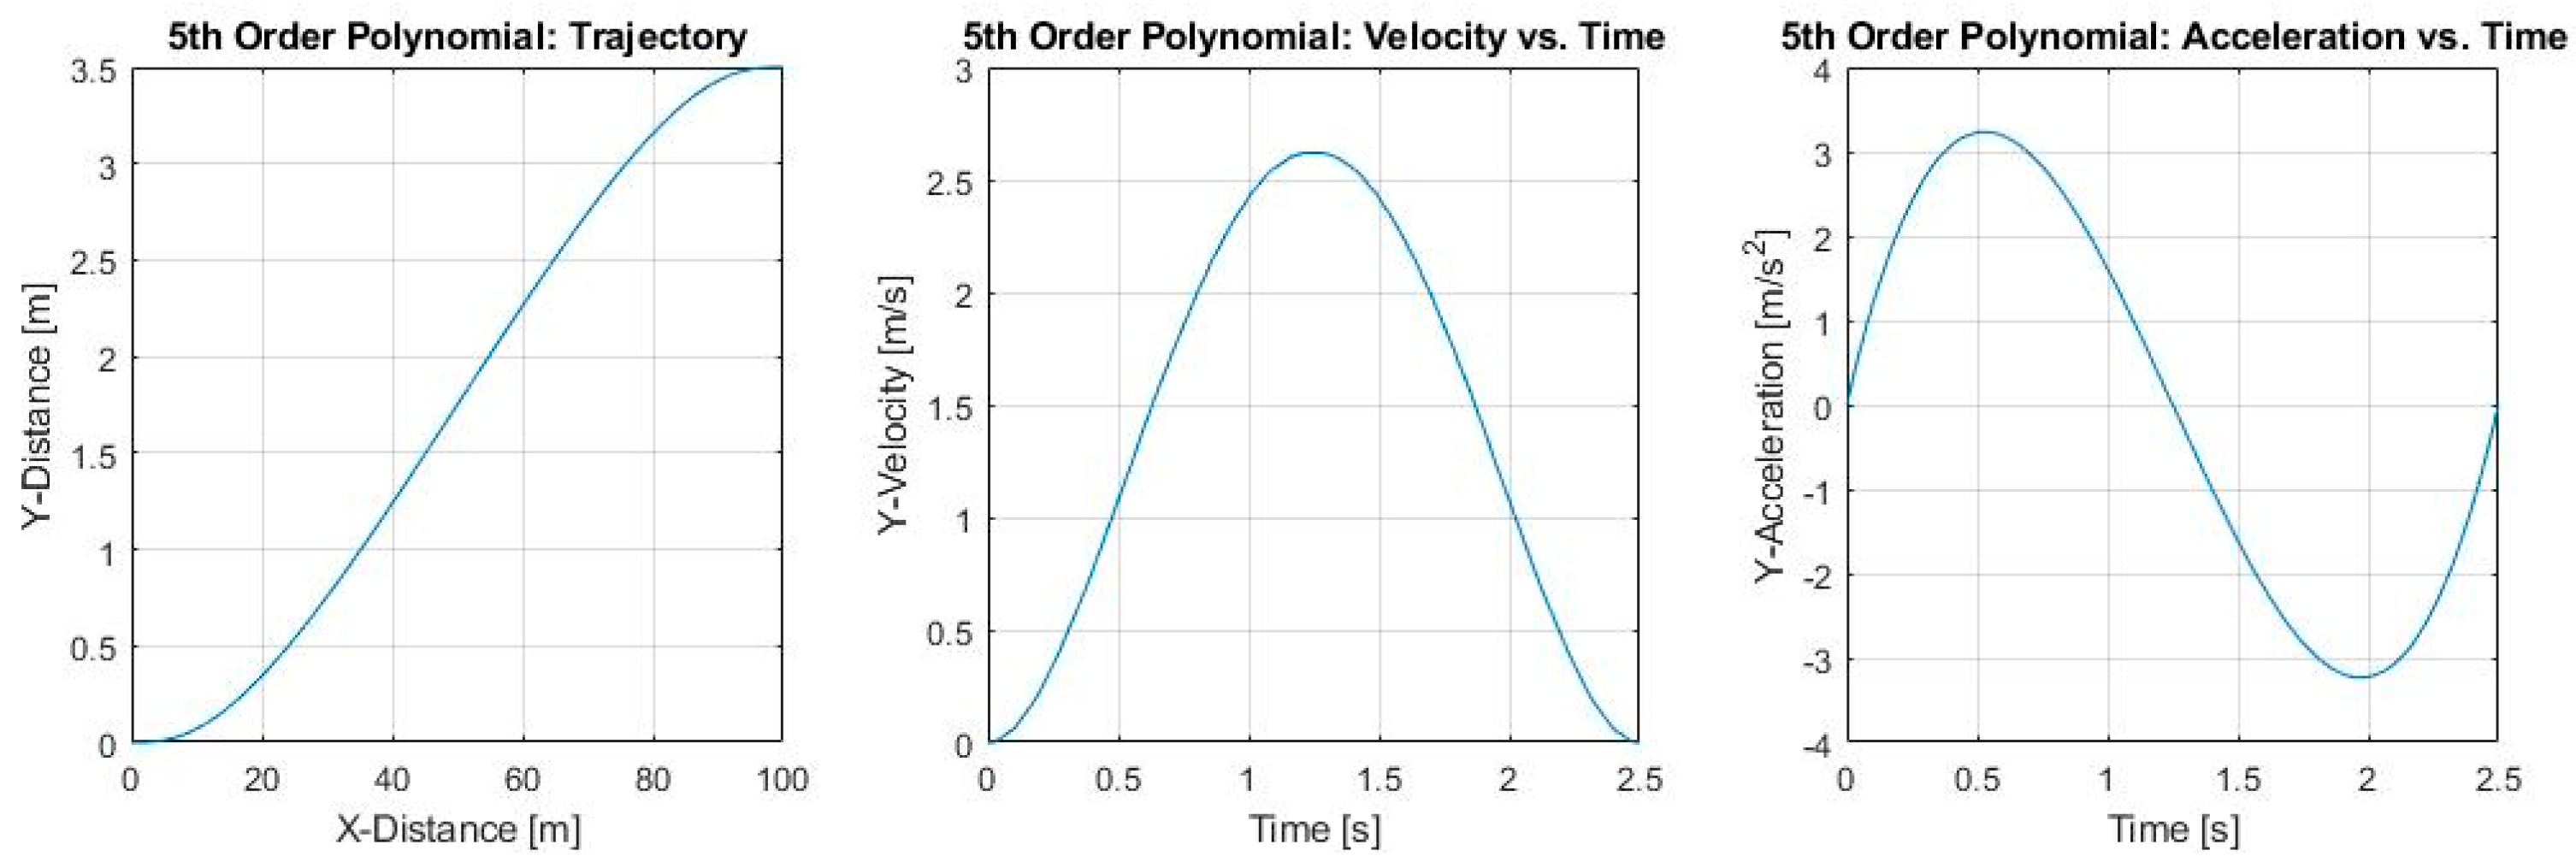
  • Geometric path for the lane change maneuver;
  • Longitudinal acceleration profile (coupled with the geometric path to form a trajectory);
  • Path yaw angle;
  • Path curvature.
Together, these create two-dimensional lookup tables based on the EOAM initial speed and differential x-distance along the lane-change maneuver; the road surface friction coefficient μ comprises the third dimension (page data) reference of the lookup tables. For any values that are not explicitly defined in the lookup tables, interpolation is used to determine the appropriate outputs. An illustration of the 3D lookup table data for the suboptimal longitudinal acceleration profile can be seen in Figure 16, where each of the various plot lines represent longitudinal acceleration profiles at various initial relative speed values at the trigger of the EOAM.
The control systems utilized in this EOAM framework are applied for the steering and longitudinal acceleration control. The steering controller utilizes three different types of control, in the form of feedforward, feedback, and yaw damping [47]. The feedforward and feedback controllers were previously defined as a potential field lane-keeping controller [55,56] but can also be used in an application with a defined lane-change maneuver, as considered in this paper. Together, the summation of each steering control (feedforward, feedback, and yaw damping) creates the overall steering control output:
δ c o n t r o l = δ f e e d f o r w a r d + δ f e e d b a c k + δ y a w d a m p i n g .
The longitudinal acceleration controller during the EOAM is a PID with longitudinal acceleration error between the reference noted in the longitudinal acceleration lookup table (for the initial EOAM relative speed) and the actual longitudinal acceleration, at each differential x-position along the EOAM trajectory. While the AV was not engaged in the EOAM lane change or stopping maneuver, longitudinal speed-based PID control was utilized with the initial simulation scenario speed as the reference/setpoint. This PID control of the longitudinal acceleration provided adequate performance with modest controller gains; however, future work would be better suited with applied gain scheduling based on the sensed road surface friction coefficient μ and vehicle speed.
While a steering controller based on artificial potential fields was used here as it was relatively easy to tune and implement, there are many different control methods that can be adapted and used for steering and also for speed control during the avoidance maneuver. Model Predictive Control (MPC) uses a finite horizon optimal control approach and uses a discrete time model of the plant and can be computed online [57] or can be computed offline and stored in tables for real-time implementation [58]. The single-track vehicle (bicycle) model used will have uncertainties and changes in transfer function coefficients accompanying changes in speed and cornering stiffness values, which require robust control methods. The model regulator, also called the disturbance observer, can be used to reject yaw moment disturbances while also regulating the plant model about the nominal one [59,60,61]. Parameter space-based robust control methods including their frequency domain extension have also been shown to be quite successful in treating these uncertain plants and can also be used together with the model regulator approach [53,62,63,64,65,66,67,68]. This paper focuses on the decision-making problem, and the goal of the controllers is merely to follow the desired speed and path profiles. For this reason, a methodological simulation experiment comparing the effect of different controller choices on performance is not included in this paper.
Application of the method in this paper to the conventional lane-changing process is not recommended as EOAM executes a last-minute and emergency lane change in order to avoid a possible collision with the preceding vehicle. In comparison, a standard lane-changing process is a slower and more comfortable path-planning and execution task.

3. Simulation and Experiment Setup

The baseline simulation setup in this paper utilizes CarSim and Simulink in co-simulation with the DMM phase diagram data and 3D lookup table completed offline in Matlab. The DMM phase diagram boundaries for each road surface friction coefficient μ and 3D lookup table parameter matrix data were extracted from the Matlab workspace and utilized in the Simulink DMM Main Logic block for online simulation.
Individual AV speeds of 165, 120, 90, and 55 km/h were used in the baseline simulation test matrix, along with surface friction values of 1.0, 0.7, 0.3, and 0.1. The layout for the baseline runs was conducted on a simulated straight two-lane highway in a proving ground setting (CarSim 2021.0), where the adjacent lane allows for traffic traveling in the opposite direction. In addition to the road surface, parked cars were added to the right of the highway lane on which the AV was traveling (1.5 m from the right lane marker), as shown in Figure 17, to assure that the AV (with radar sensor) could perform the EOAM without detecting parked cars as false positives. For each baseline scenario, the AV encountered the same ARO, D-Class Minivan, which started at 120 m ahead of the AV and at an initial speed of 60 km/h. This ARO traveled on a straight path in the same lane as the AV and executed the following speed profile to mimic an emergency stop on the highway, as shown in Figure 18. The combination of proving ground setting with two-lane highway, parked cars for sensing and perception ARO false-positive check, and ARO, which conducts an emergency stop in the same lane as the AV, comprised the fundamental pieces of the baseline test scenarios. Depending on the initial speed of the AV, the execution of the EOAM by the AV followed the same steps as listed in the EOAM framework logic explained previously. Stroboscopic views of the AV performing EOAM at 165 km/h with dry surface ( μ = 1.0 ) are shown in Figure 19.
In addition to the baseline scenarios listed above, the same scenarios were attempted with an oncoming additional ARO traveling in the lane adjacent to that of the AV in its initial position. The scenarios with the oncoming ARO were repeated with the oncoming ARO starting at 500 m, 400 m, and 300 m away from the AV. In each test scenario including the oncoming ARO, the ARO speed was constant at 20 m/s (76 km/h). Each oncoming vehicle scenario was tested with the discrete AV test speeds of 165, 120, 90, and 55 km/h and discrete road surface friction coefficient μ conditions of 1.0, 0.7, 0.3, and 0.1.

4. Results and Discussion

A summary of the results of the test scenarios is shown below in Table 2, with the following color-coding definitions:
  • Green: the EOAM single lane change (SLC) was performed successfully without collision of any type with return to the original lane.
  • Yellow: the EOAM logic worked as planned but an imminent collision was detected based on the DMM phase diagram so straight-line limit braking was applied and a collision occurred with the ARO ahead, or the AV detected oncoming traffic before the point of no return and determined that straight-line limit braking was necessary to avoid a collision with oncoming traffic and by doing this had a reduced-speed direct (rather than offset/oblique) collision with the ARO.
  • Orange: the AV performs the lane-change EOAM, and there is some resulting lateral contact with the oncoming vehicle (not a head-on collision).
  • Red: the AV performs the lane-change EOAM, resulting in a head-on collision with the oncoming vehicle that is either direct (squarely in front of the offset vehicle) or offset/obliquely.
A sample of the AV dynamic performance can be seen in Figure 20 when viewing the output data for the 120 km/h EOAM scenario on a dry surface ( μ = 1.0 ), without oncoming traffic DMM phase diagram output. Outputs in Figure 20 demonstrate that the EOAM performed by the AV allowed it to successfully avoid the ARO, and without the EOAM, a collision would have occurred. In Figure 20, the black phase data (trace 1) indicate that upon first sensing the ARO, the AV is in the FCW phase (sector E) of the DMM phase diagram to warn occupant(s) of an impending EOAM and arm any available pre-collision safety systems. When appropriate, the AV reduces its speed by braking while in sector D, to reduce the severity of the upcoming steering maneuver, then performs the steering maneuver upon entry into sector F of the DMM phase diagram. It is noted that choosing a steering maneuver in sector F allows the AV to clear the ARO with more distance (and associated passenger visual comfort) than if a pure braking maneuver was performed instead. The phase trace truncates in sector F when the FOV of the AV radar sensor no longer detects the ARO. There are several other dynamic output plots describing the EOAM modes of operation, forward collision warning (FCW) flag, longitudinal speed and acceleration profiles versus the target values, the AV EOAM actual versus target lateral position, lateral offset and lookahead error outputs, and differential x-position output during each steering maneuver and used for the 3D lookup tables, as shown in Figure 21.
The modes of operation shown in Figure 21 indicate that, during the EOAM, first a braking maneuver was applied, followed by the steering maneuver with longitudinal acceleration control. After the single lane-change (SLC) steering was completed and when the maneuver timer reached its maximum time, the AV completed the return maneuver to the original lane. At a speed of 120 km/h, the lateral position control was adequate, with only slight overshoot indicated upon reaching the desired lateral position for the SLC. That amount of overshoot is expected for a maneuver at this speed. The lateral offset and lookahead error are also within expected bounds. The differential x-position output is offered just to show the values that are fed into the 3D lookup tables during the EOAM steering maneuver, to extract the various outputs (target lateral position, longitudinal acceleration, path yaw angle, path curvature) utilized for the AV control. The differential x-position resets when the steering maneuver is fully complete (8 s duration) or when the return maneuver begins. Outputs, including the steering controller roadwheel angle, combined steering handwheel angle (steering ratio is applied), corresponding lateral acceleration, and yaw rate, are shown in Figure 22.
From the steering outputs, it is apparent that the controllers work well together to allow the AV to follow its desired trajectory during the EOAM. The feedforward control for the initial EOAM steering maneuver is small in magnitude, and this is due to the steering maneuver optimization, which does not account for steering control to be applied; instead, the optimization expects only open-loop steering application, which would result in more lateral motion than what is seen with the closed-loop steering control. Thus, the feedback steering control for this maneuver increases the steering angle to assist the AV in reaching its final desired lateral lane position for the SLC.
The yaw damping controller is quite active for the initial maneuver due to lateral acceleration and yaw rate outputs at the traction limit of the tire. The yaw damping steering controller also provides useful steering input for the RETURN maneuver, even though the AV longitudinal speeds during the RETURN are lower than those during the initial SLC. There is an indication of the AV’s longitudinal versus lateral acceleration output for the 120 km/h dry surface scenario with no oncoming traffic, as can be seen with the E-class sedan’s parameter-based friction ellipse superimposed in Figure 23. Sometimes, this is called a g-g diagram [42].
The lateral and longitudinal acceleration outputs for this 120 km/h dry surface scenario without an oncoming vehicle mostly lie within the friction ellipse, though some of the lateral acceleration outputs lie just outside the ellipse during the steering and RETURN portions of the EOAM. These excess lateral acceleration magnitudes (less than 0.03 g) can be attributed to the fact that the trajectory output is suboptimal in nature. This was also expected based on suboptimal lateral acceleration results in the creation of the DMM phase diagram, as shown in Figure 8. To understand a snapshot of broader AV EOAM performance, outputs of the AV trajectories during the EOAMs are shown for the AV traveling at 120 km/h on all of the various road surface friction coefficient μ values (1.0 through 0.1) in the left plot of Figure 24, and outputs on the dry surface with various oncoming traffic scenarios are shown in the right plot. The trajectory profiles in Figure 24 show that 1.0 and 0.7 road surface friction coefficient μ values yield nearly identical and not distinguishable results in this plot. It is reasonable to conclude that the EOAM SLC outputs for a high mu dry surface (1.0) and high mu wet surface (0.7) would yield similar EOAM SLC outputs in the EOAM framework, as designed in this paper.
The outputs in Figure 24 should be compared to the 120 km/h experiment summary in Table 2. What is notable is that the addition of the oncoming vehicle causes the SLC to be truncated before the maximum maneuver time. This is due to the RETURN being triggered early upon perception of the oncoming ARO by the AV. This is the expected output based on the proscribed EOAM framework logic. Additionally, the test scenario with the oncoming ARO starting only 300 m from the AV indicates graphically that the AV sensed the oncoming ARO before the point of no return (twice). Then, the AV performed limit braking to minimize the danger of the EOAM by choosing a collision with reduced speed that best uses the AV’s crash structures and safety devices (airbags, etc.).
The overall output for the runs in the full AV EOAM experiment was summarized earlier in Table 2. What is most notable about the full experiment output table is that the majority of the 0.3 and 0.1 road surface friction coefficient μ values involve collisions, either those that were anticipated and prepared for with straight-line limit braking before the point of no return or more severe collisions that occurred with the oncoming ARO. This is one area where the experiments in this manuscript extend beyond other studies that have a single ARO in the lane of the AV and no oncoming traffic. This summary highlights the importance of considering oncoming vehicles for an EOAM when deciding if an EOAM should be executed and, if so, what type of maneuver.
One positive note regarding the collisions that occurred in the scenarios with oncoming vehicles is that most of them involved avoiding the oncoming vehicle by utilizing the point-of-no-return feature. This shows that the addition of the point-of-no-return feature added an extra element of safety for the AV and its occupants than if it were not included. The other collisions that involved the oncoming ARO are important to highlight, as these could have catastrophic outcomes (critical injuries and fatalities) for the AV and its occupants. These collisions, however, could be eliminated with additional vehicle-to-vehicle (V2V) or vehicle-to-infrastructure (V2I) communication, notifying the AV that oncoming traffic exists and triggering the same in-lane, straight-line limit braking that can be triggered by the point-of-no-return feature. The potential for V2V and V2I communications to improve safety outcomes is an important point. V2V and V2I communication used Dedicated Short-Range Communication Radio (DSRC) technology and required dedicated onboard unit and road-side unit modems to be present, which was a major barrier against the widespread use of communication to improve road safety. Cellular vehicle-to-everything communication (C-V2X) is now replacing DSRC technology, and it is also possible to have V2V and V2I communication over the air through cloud servers using internet connectivity, which is present in new cars. These new developments will make V2V and V2I communication widely available, which will also help in the implementation of collision avoidance methods.

5. Conclusions

With the details presented in this paper, it is apparent that the proposed EOAM framework for AVs is useful and effective in providing a domain-based emergency maneuver system for AVs designed to be integrated into other functional AV system architectures. This EOAM framework was shown to function within a high-level AV system that required taking control of the AV during the EOAM, then handing control back to the high-level system once the EOAM was completed. Additionally, the inclusion of a point-of-no-return feature that depended on the sensing and perception capability of the AV to detect oncoming traffic was a useful and necessary EOAM feature to minimize contact with an ARO if it was imminent. The various features of the EOAM framework and accompanying logic included offline-calculated data used to create the proposed DMM phase diagrams and 3D lookup tables, which were crucial in allowing the AV EOAM framework to conduct sensing, perception, decision making, trajectory generation, control, and actuation, quickly enough to avoid the ARO ahead. This capability for integration into larger AV system architectures for daily road usage makes this EOAM framework novel, as compared to other proposed frameworks that do not focus on taking control and handing it back to other system domains within the AV’s architecture. Such AVs can be used in smart cities as autonomous shuttles, for example [69].
While the simulation experimentation for the AV EOAM framework highlighted in this paper was extensive, with only some exemplary results being presented, there are other opportunities for future work in this research area, including but not limited to the following:
  • Creating EOAM framework lookup table data for a vehicle, including ABS [70] and ESC [71], then seeing how it performs in the tests shown in Table 2;
  • Performing EOAM scenario tests with other traffic scenarios on other highway types with various levels of traffic [72];
  • Inclusion of AV EOAM framework logic updates that utilize V2X [73];
  • Inclusion of actual sensing and perception systems [74];
  • Conducting experimentation with different types of vehicles (compact cars, trucks, vans, SUVs) with different drivetrain layouts (FWD, AWD, electronic-AWD);
  • Incorporating the effects of the vertical direction into the evaluations [75].
All of these items would illuminate a rich area of research relating to AV EOAM capabilities, and it is recommended that these tests be explored before the mass utilization of AVs on public roads at highway speeds.
Sensor modeling is an important topic but is outside the scope of this paper. It was assumed that the AV perception sensor system and its outputs are available to the EOAM framework. AVs use camera, radar, and lidar as perception sensors. It is assumed that front-looking camera/radar-based object data as distance and angle of vehicles in the same and adjacent lane are available to EOAM. Sensor malfunction issues are also important as they affect the results of any collision avoidance system. This is outside the scope of the current paper and will be a part of future work. The EOAM framework developed and presented here was for a production-level AV. Series-produced vehicle sensors and perception systems go through rigorous failure mode effect analysis and have built-in sensor diagnostics and sensor fault tolerance algorithms. The main limitation of the EOAM framework developed here is its validation using only a limited number of simulations. Use of such an approach in actual AVs requires more extensive simulations, hardware-in-the-loop simulations with the actual control modules, proving ground tests, and road testing.

Author Contributions

Conceptualization, E.L. and L.G.; methodology, E.L.; software, E.L.; validation, E.L.; formal analysis, E.L.; investigation, E.L.; resources, E.L. and L.G.; data curation, E.L.; writing—original draft preparation, E.L.; writing—review and editing, L.G.; visualization, E.L.; supervision, L.G.; project administration, E.L. and L.G.; funding acquisition, E.L. and L.G. All authors have read and agreed to the published version of the manuscript.

Funding

This research received no external funding.

Data Availability Statement

Data are contained within the article.

Acknowledgments

The authors thank the Automated Driving Lab at the Ohio State University.

Conflicts of Interest

The authors declare no conflict of interest.

References

  1. World Health Organization. Global Status Report on Road Safety 2018: Summary: (WHO/NMH/NVI/18.20); License: CC BY-NC-SA 3.0 IGO); World Health Organization: Geneva, Switzerland, 2018.
  2. Centers for Disease Control and Prevention (CDC). Web-based Injury Statistics Query and Reporting System (WISQARS). Retrieved from National Center for Injury Prevention and Control (NCIPC). 2020. Available online: https://www.cdc.gov/injury/features/global-road-safety/index.html (accessed on 1 January 2020).
  3. Singh, S. Critical Reasons for Crashes Investigated in the National Motor Vehicle Crash Causation Survey; Traffic Safety Facts Crash•Stats. Report No. DOT HS 812 115; National Highway Traffic Safety Administration: Washington, DC, USA, 2015. [Google Scholar]
  4. SAE. Taxonomy and Definitions for Terms Related to Driving Automation Systems for On-Road Motor Vehicles (SAE J3016); Society of Automotive Engineers, SAE Technical Standards Board; SAE International: Warrendale, PA, USA, 2016. [Google Scholar]
  5. Chee, W.; Tomizuka, M. Lane change maneuver of automobiles for the intelligent vehicle and highway system (IVHS). In Proceedings of 1994 American Control Conference-ACC’94; IEEE: Baltimore, MD, USA, 1994; pp. 3586–3587. [Google Scholar]
  6. Shiller, Z.; Sundar, S. Emergency Lane-Change Maneuvers of Autonomous Vehicles. ASME J. Dyn. Syst. Meas. Control. 1998, 120, 37–44. [Google Scholar] [CrossRef]
  7. Hattori, Y.; Ono, E.; Hosoe, S. Optimum vehicle trajectory control for obstacle avoidance problem. IEEE/ASME Trans. Mechatron. 2006, 11, 507–512. [Google Scholar] [CrossRef]
  8. Peng, T.; Su, L.; Zhang, R.; Guan, Z.; Zhao, H.; Qiu, Z.; Xu, H. A new safe lane-change trajectory model and collision avoidance control method for automatic driving vehicles. Expert Syst. Appl. 2020, 141, 112953. [Google Scholar] [CrossRef]
  9. Zhu, S.; Gelbal, S.Y.; Aksun-Güvenc, B.; Güvenc, L. Parameter-Space Based Robust Gain-Scheduling Design of Automated Vehicle Lateral Control. IEEE Trans. Veh. Technol. 2019, 68, 9660–9671. [Google Scholar] [CrossRef]
  10. Ding, Y.; Zhuang, W.; Wang, L.; Liu, J.; Guvenc, L.; Li, Z. Safe and Optimal Lane Change Path Planning for Automated Driving. Proc. Inst. Mech. Eng. Part D J. Automob. Eng. 2020, 235, 1070–1083. [Google Scholar] [CrossRef]
  11. Li, P.; Pei, X.; Chen, Z.; Zhou, X.; Xu, J. Human-like motion planning of autonomous vehicle based on probabilistic trajectory prediction. Appl. Soft Comput. 2022, 118, 108499. [Google Scholar] [CrossRef]
  12. Liang, Y.; Yin, Z.; Nie, L. Shared steering control for lane keeping and obstacle avoidance based on multi-objective MPC. Sensors 2021, 21, 4671. [Google Scholar] [CrossRef]
  13. Cong, S.; Wang, W.; Liang, J.; Chen, L.; Cai, Y. An Automatic Vehicle Avoidance Control Model for Dangerous Lane-Changing Behavior. IEEE Trans. Intell. Transp. Syst. 2022, 23, 8477–8487. [Google Scholar] [CrossRef]
  14. Ma, C.; Liu, J.; He, S.; Hong, W.; Shi, J. Confrontation and Obstacle-Avoidance of Unmanned Vehicles Based on Progressive Reinforcement Learning. IEEE Access 2023, 11, 50398–50411. [Google Scholar] [CrossRef]
  15. De Zarzà, I.; De Curtò, J.; Calafate, C.T. Decentralized Planning of Platoons in Road Transport using Reinforcement Learning. In Proceedings of the 2023 IEEE 43rd International Conference on Distributed Computing Systems Workshops (ICDCSW), Hong Kong, China, 18–21 July 2023; pp. 133–138. [Google Scholar] [CrossRef]
  16. Sanil, N.; Rakesh, V.; Mallapur, R.; Ahmed, M.R. Deep learning techniques for obstacle detection and avoidance in driverless cars. In Proceedings of the 2020 International Conference on Artificial Intelligence and Signal Processing (AISP), Amaravati, India, 10–12 January 2020; pp. 1–4. [Google Scholar]
  17. Chen, P.; Pei, J.; Lu, W.; Li, M. A deep reinforcement learning based method for real-time path planning and dynamic obstacle avoidance. Neurocomputing 2022, 497, 64–75. [Google Scholar] [CrossRef]
  18. Cimurs, R.; Lee, J.H.; Suh, I.H. Goal-oriented obstacle avoidance with deep reinforcement learning in continuous action space. Electronics 2020, 9, 411. [Google Scholar] [CrossRef]
  19. de Zarzà, I.; de Curtò, J.; Roig, G.; Calafate, C.T. LLM Adaptive PID Control for B5G Truck Platooning Systems. Sensors 2023, 23, 5899. [Google Scholar] [CrossRef]
  20. Drage, T.; Kalinowski, J.; Braunl, T. Integration of Drive-by-Wire with Navigation Control for a Driverless Electric Race Car. IEEE Intell. Transp. Syst. Mag. 2014, 6, 23–33. [Google Scholar] [CrossRef]
  21. Wang, Z.; Ding, X.; Zhang, L. Chassis Coordinated Control for Full X-by-Wire Four-Wheel-Independent-Drive Electric Vehicles. IEEE Trans. Veh. Technol. 2023, 72, 4394–4410. [Google Scholar] [CrossRef]
  22. Meng, B.; Liu, F.Y.; Wang, Y. A Survey of Brake-by-Wire System for Intelligent Connected Electric Vehicles. IEEE Access 2020, 8, 225424–225436. [Google Scholar] [CrossRef]
  23. Wang, X.; Wu, X.; Cheng, S.; Shi, J.; Ping, X.; Yue, W. Design and Experiment of Control Architecture and Adaptive Dual-Loop Controller for Brake-by-Wire System with an Electric Booster. IEEE Trans. Transp. Electrif. 2020, 6, 1236–1252. [Google Scholar] [CrossRef]
  24. Zhang, L.; Yu, Z.; Xu, X.; Yan, Y. Research on Automatic Emergency Braking System Based on Target Recognition and Fusion Control Strategy in Curved Road. Electronics 2023, 12, 3490. [Google Scholar] [CrossRef]
  25. Guvenc, B.A.; Kural, E. Adaptive cruise control simulator: A low-cost, multiple-driver-in-the-loop simulator. IEEE Control. Syst. Mag. 2006, 26, 42–55. [Google Scholar] [CrossRef]
  26. Emirler, M.T.; Guvenc, L.; Guvenc, B.A. Design and Evaluation of Robust Cooperative Adaptive Cruise Control Systems in Parameter Space. Int. J. Automot. Technol. 2018, 19, 359–367. [Google Scholar] [CrossRef]
  27. Bian, Y.; Ding, J.; Hu, M.; Xu, Q.; Wang, J.; Li, K. An Advanced Lane-Keeping Assistance System With Switchable Assistance Modes. IEEE Trans. Intell. Transp. Syst. 2020, 21, 385–396. [Google Scholar] [CrossRef]
  28. Serban, A.C.; Poll, E.; Visser, J. A standard driven software architecture for fully autonomous vehicles. In Proceedings of the 2018 IEEE International Conference on Software Architecture Companion (ICSA-C), Seattle, WA, USA, 30 April–4 May 2018; pp. 120–127. [Google Scholar]
  29. Mody, M.; Jones, J.; Chitnis, K.; Sagar, R.; Shurtz, G.; Dutt, Y.; Koul, M.; Biju, M.; Dubey, A. Understanding vehicle E/E architecture topologies for automated driving: System partitioning and tradeoff parameters. Electron. Imaging 2018, 2018, 358-1–358-5. [Google Scholar] [CrossRef]
  30. Gyllenhammar, M.J.; Johansson, R.; Warg, F.; Chen, D.; Heyn, H.M.; Sanfridson, M.; Ursing, S. Towards an operational design domain that supports the safety argumentation of an automated driving system. In Proceedings of the European Congress on Embedded Real Time Systems (ERTS), Toulouse, France, 29–31 January 2020. [Google Scholar]
  31. Griffor, E.; Wollman, D.; Greer, C. Automated Driving System Safety Measurement Part I: Operating Envelope Specification; NIST Special Publication, 1900, 301; National Institute of Standards and Technology: Washington, DC, USA, 2021. [Google Scholar]
  32. Euro NCAP. Protocols—General. Retrieved from European New Car Assessment Programme Home. 30 September 2020. Available online: https://www.euroncap.com/en/for-engineers/protocols/general/ (accessed on 26 October 2023).
  33. Pack, R.; Koopmann, J.; Yu, H.; Najm, W.G. Pre-Crash Sensing Countermeasures and Benefits; United States Paper, (05-0202); National Highway Traffic Safety Administration: Washington, DC, USA, 2005. [Google Scholar]
  34. Cho, K.; Choi, S.B.; Shin, K.; Yun, Y. A pre-crash discrimination system for an airbag deployment algorithm. In Proceedings of the 2010 American Control Conference, Baltimore, MD, USA, 30 June–2 July 2010; pp. 6949–6954. [Google Scholar]
  35. Patil, A.; Ginoya, D.; Shendge, P.D.; Phadke, S.B. Uncertainty-Estimation-Based Approach to Antilock Braking Systems. IEEE Trans. Veh. Technol. 2016, 65, 1171–1185. [Google Scholar] [CrossRef]
  36. Dincmen, E.; Guvenc, B.A.; Acarman, T. Extremum-Seeking Control of ABS Braking in Road Vehicles with Lateral Force Improvement. IEEE Trans. Control. Syst. Technol. 2014, 22, 230–237. [Google Scholar] [CrossRef]
  37. Zhou, H.; Liu, Z. Vehicle Yaw Stability-Control System Design Based on Sliding Mode and Backstepping Control Approach. IEEE Trans. Veh. Technol. 2010, 59, 3674–3678. [Google Scholar] [CrossRef]
  38. Oncu, S.; Karaman, S.; Guvenc, L.; Ersolmaz, S.S.; Ozturk, E.S.; Cetin, E.; Sinal, M. Robust Yaw Stability Controller Design for a Light Commercial Vehicle Using a Hardware in the Loop Steering Test Rig. In Proceedings of the 2007 IEEE Intelligent Vehicles Symposium, Istanbul, Turkey, 13–15 June 2007; pp. 852–859. [Google Scholar] [CrossRef]
  39. Wong, J.Y. Theory of Ground Vehicles; John Wiley & Sons: Ottawa, ON, Canada, 2008. [Google Scholar]
  40. Gillespie, T.D. Fundamentals of Vehicle Dynamics; Society of Automotive Engineers: Warrendale, PA, USA, 1992; Volume 400. [Google Scholar]
  41. Mechanical Simulation Corporation. Tire Models; CarSim Version 2021.0; MSC: Ann Arbor, MI, USA, 2020; pp. 1–67. [Google Scholar]
  42. Milliken, W.F.; Milliken, D.L. Race Car Vehicle Dynamics; Society of Automotive Engineers: Warrendale, PA, USA, 1995. [Google Scholar]
  43. Brach, R.; Brach, M. Tire Models for Vehicle Dynamic Simulation and Accident Reconstruction; SAE Technical Paper. (No. 2009-01-0102); SAE: Warrendale, PA, USA, 2009. [Google Scholar]
  44. Brach, R.; Brach, M. The Tire-Force Ellipse (Friction Ellipse) and Tire Characteristics; SAE Technical Paper, (No. 2011-01-0094); SAE: Warrendale, PA, USA, 2011. [Google Scholar]
  45. You, F.; Zhang, R.; Lie, G.; Wang, H.; Wen, H.; Xu, J. Trajectory planning and tracking control for autonomous lane change maneuver based on the cooperative vehicle infrastructure system. Expert Syst. Appl. 2015, 42, 5932–5946. [Google Scholar] [CrossRef]
  46. Mehmood, A.; Liaquat, M.; Bhatti, A.I.; Rasool, E. Trajectory Planning and Control for Lane-Change of Autonomous Vehicle. In Proceedings of the 5th International Conference on Control, Automation and Robotics (ICCAR), Beijing, China, 19–22 April 2019; pp. 331–335. [Google Scholar]
  47. Lowe, E. A Framework for Real-Time Autonomous Road Vehicle Emergency Obstacle Avoidance Maneuvers with Validation Protocol; The Ohio State University: Columbus, OH, USA, 2022. [Google Scholar]
  48. Yi, K.; Hedrick, K.; Lee, S.C. Estimation of tire-road friction using observer based identifiers. Veh. Syst. Dyn. 1999, 31, 233–261. [Google Scholar] [CrossRef]
  49. Hsu, Y.H.; Laws, S.; Gadda, C.D.; Gerdes, J.C. A method to estimate the friction coefficient and tire slip angle using steering torque. In Proceedings of the ASME International Mechanical Engineering Congress and Exposition, Chicago, IL, USA, 5–10 November 2006; Volume 47683, pp. 515–524. [Google Scholar]
  50. Nakao, Y.; Kawasaki, H.; Major, D.J. Estimation of Friction Levels between Tire and Road; SAE Technical Paper, No. 2002-01-1198; SAE: Warrendale, PA, USA, 2002. [Google Scholar]
  51. Svendenius, J. Tire Modeling and Friction Estimation. Ph.D. Thesis, Lund University, Lund, Sweden, 2007. [Google Scholar]
  52. Ahn, C.S. Robust Estimation of Road Friction Coefficient for Vehicle Active Safety Systems. Ph.D. Thesis, University of Michigan, Ann Arbor, MI, USA, 2011. [Google Scholar]
  53. Guvenc, L.; Aksun-Guvenc, B.; Zhu, S.; Gelbal, S. Autonomous Road Vehicle Path Planning and Tracking Control; Wiley IEEE Press: New York, NY, USA, 2022. [Google Scholar]
  54. Wallman, C.G.; Åström, H. Friction Measurement Methods and the Correlation between Road Friction and Traffic Safety: A Literature Review; Swedish National Road and Transport Research Institute (VTI): Linköping, Sweden, 2001. [Google Scholar]
  55. Rossetter, E.J.; Gerdes, J.C. Lyapunov based performance guarantees for the potential field lane-keeping assistance system. J. Dyn. Syst. Meas. Control 2006, 128, 510–522. [Google Scholar] [CrossRef]
  56. Talvala, K.L.; Gerdes, J.C. Lanekeeping at the limits of handling: Stability via Lyapunov functions and a comparison with stability control. In Dynamic Systems and Control Conference; American Society of Mechanical Engineering: Ann Arbor, MI, USA, 2008; Volume 43352, pp. 361–368. [Google Scholar]
  57. Kural, E.; Aksun-Guvenc, B. Model Predictive Adaptive Cruise Control. In Proceedings of the 2010 IEEE International Conference on Systems, Man and Cybernetics, Istanbul, Turkey, 10–13 October 2010; pp. 1455–1461. [Google Scholar]
  58. Emekli, M.E.; Aksun-Guvenc, B. Explicit MIMO model predictive boost pressure control of a two-stage turbocharged diesel engine. IEEE Trans. Control. Syst. Technol. 2016, 25, 521–534. [Google Scholar] [CrossRef]
  59. Aksun-Guvenc, B.; Guvenc, L.; Ozturk, E.; Yigit, T. Model regulator based individual wheel braking control. In Proceedings of the 2003 IEEE Conference on Control Applications, Istanbul, Turkey, 25 June 2003. [Google Scholar]
  60. Du, H.; Zhang, N.; Dong, G. Stabilizing Vehicle Lateral Dynamics With Considerations of Parameter Uncertainties and Control Saturation Through Robust Yaw Control. IEEE Trans. Veh. Technol. 2010, 59, 2593–2597. [Google Scholar] [CrossRef]
  61. Guvenc, L.; Srinivasan, K. Force controller design and evaluation for robot-assisted die and mould polishing. Mech. Syst. Signal Process. 1994, 8, 623–638. [Google Scholar]
  62. Guvenc, L.; Aksun-Guvenc, B.; Demirel, B.; Emirler, M. Control of Mechatronic Systems; IET: London, UK, 2017. [Google Scholar]
  63. Aksun-Guvenc, B.; Guvenc, L. Robustness of disturbance observers in the presence of structured real parametric uncertainty. In Proceedings of the 2001 American Control Conference, Cat. No. 01CH37148, Arlington, VA, USA, 25–27 June 2001; Volume 6, pp. 4222–4227. [Google Scholar]
  64. Aksun-Guvenc, B.; Guvenc, L. Robust steer-by-wire control based on the model regulator. In Proceedings of the International Conference on Control Applications, Glasgow, UK, 18–20 September 2002; Volume 1, pp. 435–440. [Google Scholar]
  65. Emirler, M.T.; Wang, H.; Aksun-Guvenc, B.; Guvenc, L. Automated robust path following control based on calculation of lateral deviation and yaw angle error. In Proceedings of the ASME 2015 Dynamic Systems and Control Conference, Columbus, OH, USA, 28–30 October 2015; Volume 57267, p. V003T50A009. [Google Scholar]
  66. Orun, B.; Necipoglu, S.; Basdogan, C.; Guvenc, L. State feedback control for adjusting the dynamic behavior of a piezoactuated bimorph atomic force microscopy probe. Rev. Sci. Instrum. 2009, 80, 063701. [Google Scholar] [CrossRef] [PubMed]
  67. Demirel, B.; Guvenc, L. Parameter space design of repetitive controllers for satisfying a robust performance requirement. IEEE Trans. Autom. Control. 2010, 55, 1893–1899. [Google Scholar] [CrossRef]
  68. Wang, G.; Liu, Y.; Li, S.; Tian, Y.; Zhang, N.; Cui, G. New Integrated Vehicle Stability Control of Active Front Steering and Electronic Stability Control Considering Tire Force Reserve Capability. IEEE Trans. Veh. Technol. 2021, 70, 2181–2195. [Google Scholar] [CrossRef]
  69. Gelbal, S.Y.; Aksun-Guvenc, B.; Guvenc, L. SmartShuttle: A Unified, Scalable and Replicable Approach to Connected and Automated Driving in a Smart City; Science of Smart City Operations and Platforms Engineering in Partnership with Global City Teams Challenge (SCOPE-GCTC) Workshop: Pittsburgh, PA, USA, 2017. [Google Scholar]
  70. Dincmen, E.; Acarman, T.; Guvenc, B.A. ABS Control Algorithm via Extremum Seeking Method with Enhanced Lateral Stability. In Proceedings of the IFAC Symposium on Advances in Automotive Control, Munich, Germany, 12–14 July 2010; pp. 19–24. [Google Scholar]
  71. Tjonnas, J.; Johansen, T.A. Stabilization of Automotive Vehicles Using Active Steering and Adaptive Brake Control Allocation. IEEE Trans. Control. Syst. Technol. 2010, 18, 545–558. [Google Scholar] [CrossRef]
  72. Varga, B.; Ormándi, T.; Tettamanti, T. EGO-Centric, Multi-Scale Co-Simulation to Tackle Large Urban Traffic Scenarios. IEEE Access 2023, 11, 57437–57447. [Google Scholar] [CrossRef]
  73. Deng, R.; Di, B.; Song, L. Cooperative Collision Avoidance for Overtaking Maneuvers in Cellular V2X-Based Autonomous Driving. IEEE Trans. Veh. Technol. 2019, 68, 4434–4446. [Google Scholar] [CrossRef]
  74. Mukhtar, A.; Xia, L.; Tang, T.B. Vehicle Detection Techniques for Collision Avoidance Systems: A Review. IEEE Trans. Intell. Transp. Syst. 2015, 16, 2318–2338. [Google Scholar] [CrossRef]
  75. Ozcan, D.; Sonmez, U.; Guvenc, L. Optimisation of the Nonlinear Suspension Characteristics of a Light Commercial Vehicle. Int. J. Veh. Technol. 2013, 2013, 562424. [Google Scholar]
Figure 1. Summary EOAM framework system diagram.
Electronics 12 04765 g001
Figure 2. EOAM logic flowchart.
Electronics 12 04765 g002
Figure 3. Free-body diagram representing Newton’s second law with respect to a 3 DOF bicycle model.
Electronics 12 04765 g003
Figure 4. Example fifth-order polynomial output trajectory and corresponding time derivatives.
Electronics 12 04765 g004
Figure 5. Steering road wheel angle, front and rear slip angles, and front and rear force outputs from inverse dynamics calculations.
Electronics 12 04765 g005
Figure 6. Minimum and maximum longitudinal acceleration constraints based on lateral slip angles and forces generated by the steering input.
Electronics 12 04765 g006
Figure 7. Example outputs for the EOAM final y-position, yaw, and yaw rate on a high mu surface ( μ = 1.0 ).
Electronics 12 04765 g007
Figure 8. Sample suboptimal outputs from the longitudinal acceleration optimization at initial speed of 100 km/h.
Electronics 12 04765 g008
Figure 9. Suboptimal trajectory and speed profile outputs for a variety of EOAM initial relative speeds, with surface μ = 1.0 .
Electronics 12 04765 g009
Figure 10. Initial DMM phase diagram output with stopping distance curve, constant speed minimum clearing distance and suboptimal longitudinal acceleration minimum clearing distance.
Electronics 12 04765 g010
Figure 11. Relative lateral distance between AV CG and ARO closest corner, during EOAM.
Electronics 12 04765 g011
Figure 12. Minimum clearing distance coordinates superimposed on target CG trajectory.
Electronics 12 04765 g012
Figure 13. DMM phase diagram with buffers for braking and steering EOAMs.
Electronics 12 04765 g013
Figure 14. DMM phase diagram outputs for various effective road surface friction conditions ( μ = 0.7, 0.3, and 0.1).
Electronics 12 04765 g014
Figure 15. Top-down view of EOAM with sensor FOV and lateral point-of-no-return boundary.
Electronics 12 04765 g015
Figure 16. Illustration of 3D lookup table data for suboptimal longitudinal acceleration profiles at various initial EOAM speeds.
Electronics 12 04765 g016
Figure 17. AV shown with ARO (outside of AV radar range) in its lane of travel, with parked cars to the right side of the marked lanes.
Electronics 12 04765 g017
Figure 18. Longitudinal speed profile for ARO (D-Class Minivan) in front of the AV in each test scenario.
Electronics 12 04765 g018
Figure 19. Rear and top-down stroboscopic views of the AV performing an EOAM at 165 km/h on the dry surface.
Electronics 12 04765 g019
Figure 20. Motion of the AV and ARO, and DMM phase diagram for dry surface and 120 km/h scenario and no oncoming traffic, with phase data labeled as trace 1.
Electronics 12 04765 g020
Figure 21. Various dynamic outputs from the 120 km/h EOAM scenario on a dry surface without oncoming traffic: EOAM mode of operation, FCW flag, target vs. actual longitudinal speed, target vs. actual longitudinal acceleration, target vs. actual lateral position, lateral offset error, lateral lookahead error, and differential x-position during the EOAM (for the 3D lookup tables).
Electronics 12 04765 g021
Figure 22. Steering, lateral acceleration, and yaw rate outputs for the 120 km/h AV EOAM scenario on a dry surface without oncoming traffic.
Electronics 12 04765 g022
Figure 23. Longitudinal vs. lateral acceleration AV outputs with the E-Class sedan parameter-based friction ellipse superimposed, for the 120 km/h AV EOAM scenario on a dry surface without oncoming traffic.
Electronics 12 04765 g023
Figure 24. (Left) Output AV lateral position profiles vs. time for 120 km/h EOAM scenarios on various surface friction values without oncoming traffic and (right) AV lateral position during 120 km/h EOAM with oncoming traffic starting at varying distances from the AV’s initial position (500 m, 400 m, and 300 m away) on the dry surface.
Electronics 12 04765 g024
Table 1. Relevant nomenclature for 3 DOF planar vehicle model used in this paper.
VariableDescription
Fxlongitudinal (tractive) force
Fyflateral force on the front axle
Fyrlateral force on the rear axle
axlongitudinal acceleration
aylateral acceleration
dfdistance from front axle to center of gravity
drdistance from rear axle to center of gravity
mmass of vehicle
Izmass moment of inertia about vehicle z axis
βchassis side slip angle
αffront tire side slip angle
αrrear tire side slip angle
ψvehicle yaw angle
ψ ˙ vehicle yaw rate
ψ ¨ vehicle yaw angular acceleration
δsteering road wheel angle
Ψabsolute (global) AV heading angle
θabsolute (global) path yaw angle
Table 2. AV EOAM all experiments results summary.
TrafficInitial AV Speed (km/h)μ = 1.0μ = 0.7μ = 0.3μ = 0.1
No oncoming165greengreengreenyellow
120greengreengreengreen
90greengreengreenorange
55greengreengreengreen
Oncoming 500 m165greengreenredyellow
120greengreenorangeyellow
90greengreengreenorange
55orangeorangeyellowred
Oncoming 400 m165greengreenredyellow
120greenorangeorangeorange
90orangeorangeyellowyellow
55orangegreengreenyellow
Oncoming 300 m165yellowredredyellow
120yellowyellowyellowyellow
90greengreengreenorange
55greengreengreengreen
red: EOAM SLC performed, oncoming collision occurred; orange: EOAM SLC performed, lateral collision occurred; yellow: limit braking applied with expected front collision; green: Successful EOAM SLC with return to lane.
Disclaimer/Publisher’s Note: The statements, opinions and data contained in all publications are solely those of the individual author(s) and contributor(s) and not of MDPI and/or the editor(s). MDPI and/or the editor(s) disclaim responsibility for any injury to people or property resulting from any ideas, methods, instructions or products referred to in the content.

