Article

Market and Sharing Alternatives for the Provision of Massive Machine-Type and Ultra-Reliable Low-Latency Communications Services over a 5G Network

by
Edison Moreno-Cardenas
* and
Luis Guijarro
Departamento de Comunicaciones, Universitat Politècnica de València, 46022 Valencia, Spain
*
Author to whom correspondence should be addressed.
Electronics 2023, 12(24), 4994; https://doi.org/10.3390/electronics12244994
Submission received: 25 October 2023 / Revised: 9 December 2023 / Accepted: 11 December 2023 / Published: 13 December 2023

Abstract

:
The objective of this paper is to analyze economic alternatives for the provision of ultra-reliable low-latency communication (URLLC) and massive machine-type communication (mMTC) services over a fifth-generation (5G) network. Two business models, a monopoly and a duopoly, are studied and two 5G network scenarios are analyzed: a 5G network where the network resources are shared between the two services without service priority, and a 5G network with network slicing that allows for URLLC traffic to have a higher priority. Microeconomics is used to model the behavior of users and operators, and game theory is used to model the strategic interaction between users and operators. The results show that a monopoly over a 5G network with network slicing is the most efficient way to provide both URLLC and mMTC services.

1. Introduction

The telecommunications industry has experienced a revolution with the implementation of fifth-generation (5G) networks. Likewise, 5G networks have played a transformative role in recent years, bringing about significant changes in the telecommunications sector by enabling the development of business models and organizational structures. Technological advances have driven this digital transformation, which includes the deployment of cloud computing services, the growth of the Internet of Things (IoT), and artificial intelligence [1,2,3]. Unlike previous wireless generations, 5G networks are designed to connect not only people to the Internet but also things to people and other people, as described in [4]. The International Telecommunication Union (ITU) defines three categories of applications that support 5G networks: ultra-reliable low-latency communication (URLLC), massive machine-type communication (mMTC), and enhanced mobile broadband (eMBB) [5,6]. In [7], the authors describe mMTC services as enabling data transmission from a large number of devices with low power consumption, low complexity, and low cost. However, critical mMTC applications, such as advanced vehicle driving assistance systems in smart cities, autonomous vehicles, and delay-sensitive Industry 4.0 for large-scale factory automation, require low latency and high reliability that cannot be compromised [8]. In [9], URLLC is described as a crucial feature of 5G networks that enables the provision of extremely reliable and low-latency communication services. URLLC is designed for applications such as autonomous vehicles, industrial automation, and virtual reality [10,11,12]. eMBB, in turn, provides high data rate communications and supports applications such as video streaming, online gaming, and virtual reality [5]. To support URLLC, mMTC, and eMBB services, 5G networks use various technologies and techniques, such as advanced coding and modulation schemes, efficient resource allocation algorithms, and advanced multiple-input multiple-output (MIMO) techniques. In addition, 5G networks use network slicing (NS) to provide customization and flexibility, allowing different applications and services to be supported over the same network [13]. Network slicing is important in 5G networks because it creates multiple virtual networks with different characteristics and capabilities on a shared physical infrastructure. This enables network operators to offer differentiated services to customers with varying speed, latency, security, and reliability requirements. Network slicing also enables more efficient use of network resources, reduces operational costs, and facilitates the deployment of new services and applications. Overall, the combination of URLLC, eMBB, and mMTC enables 5G networks to support a wide range of applications and services with different requirements for reliability, latency, data rates, and the number of devices. Due to their high versatility, 5G networks can adapt to a wide range of use cases, applications, and business models.
Our work aims to economically assess different alternatives for providing URLLC and mMTC services. The analysis is conducted through a strategic game considering users’ utilities, operators’ benefits, and the strategic interaction between users’ subscription decisions and operators’ pricing decisions. Finally, we compare the alternatives against the social optimum outcome to determine the best option.
The main contributions of this article are as follows:
  • Two business models are proposed to provide URLLC and mMTC services over the same 5G network. Additionally, two network models are proposed to investigate the sharing of network resources between URLLC and mMTC services.
  • Game theory is employed to examine the strategic interactions between operators and users within each business/network model; the equilibrium of each model is studied in relation to the most significant parameters, including service priority, delay sensitivity, and pay-per-user price.
  • Our results suggest that implementing network slicing over a 5G network for sharing network resources between URLLC and mMTC services is an economically viable strategy, allowing for the coexistence of operators and services.
  • This work establishes the essential requirements for business models to be viable.
We apply queueing theory and microeconomic principles to formulate business models and model the quality of service (QoS) perceived by users. Additionally, we use game theory to analyze all scenarios. In [14], the author defines game theory as a subfield of mathematics that seeks to understand interactions among decision makers. It has extensive applications in the telecommunications industry to determine the economic incentives of agents such as users and providers [15,16]. It is also employed in telecommunications and computer networks to optimize routing, resource allocation [17,18], and resource sharing [18,19]. In this study, we employ game theory and optimization schemes [20,21] within the framework of the network slicing taxonomy to analyze the proposed business models. Our work contributes to the ongoing research on 5G services and network slicing by addressing key issues and unanswered questions in these areas [22,23]. Thus, our study aligns with current trends in this field and shares similarities with some of the studies cited in the following subsection.

Related Works

The development of 5G networks has opened up new possibilities for high-speed data transfer, low-latency communication, and a massive number of connected devices (URLLC, eMBB, and mMTC services), as described in [5,6,7]. Two essential cases are URLLC and mMTC services. Researchers have explored different aspects of these use cases, including network architecture, resource sharing, QoS, and business models. Several studies have proposed novel solutions for enabling the coexistence and interaction between URLLC, mMTC, and eMBB services and maximizing the benefits for network users and operators.
The authors of [24] explore how service industries compete on the basis of waiting time and price. Their paper investigates the behavior of service providers’ queueing systems and how the price influences the competitive behavior of the industry. The authors offer an approach to investigating different queueing models and show that the capacity cost function belongs to a specific class of four-parameter functions. They also separately treat cases where firms compete in terms of price, service level, or both. Also, this research presents a general system of equations for firms’ demand rates based on prices and industry waiting time levels. Likewise, in [25], the authors define monetization and pricing and analyze how service providers can generate revenue from URLLC, eMBB, and mMTC services. This includes pricing strategies such as pay-per-use and subscription models, as well as revenue-sharing models such as spectrum sharing and network slicing. Also, in [26], the authors explore how to monetize 5G networks for residential users using network slicing and effective pricing strategies. Our paper provides an economic analysis of URLLC and mMTC services over 5G networks based on previously mentioned studies that have demonstrated the economic feasibility of these services.
The requirements described above that need to be met by a 5G network are based on its leading enabler, network slicing. The authors of [27] discuss the flexibility and rapid deployment of services and applications with network slicing. Also, they explore the advantages of network slicing for 5G networks, which allows network operators to build multiple virtual networks on a shared infrastructure for different use cases. Likewise, they also highlight the challenges and future research directions associated with this emerging technology. In [28], the authors explore the impact of queueing delays and user costs on computing resource management and control. The paper presents a methodology that considers the value of users’ time to determine prices, utilization, and capacity. In [29], the authors analyze the use of priority queueing in pricing to maximize network operators’ revenues. They compare the optimal revenue obtained by the network operator and find that priority queueing is more efficient than a generalized processor sharing (GSP) scheduler and a network without service differentiation in economic terms. Similarly, in [29,30], the authors utilize priority queueing to differentiate between services by applying the Discriminatory Processor Sharing (DPS) discipline to two service models with varying QoS. They determine the optimal prices that can maximize the provider’s profit. The mentioned studies highlight the correlation between price and QoS through user utilities, as demonstrated by previous research. Our work explores pricing using a non-priority queue, where URLLC and mMTC services with varying QoS are treated equally, and a two-priority queue, where URLLC has a higher priority than mMTC, depending on their QoS characteristics.
The authors of [29] employ the game theory framework to examine the issue of maximizing operator revenue, and they consider the Nash equilibrium as the solution. Also, the authors of [31] analyze the provision of services to a homogeneous traffic profile using a priority queue, where a primary operator owns the resources and a secondary operator can alternatively access the said resources. The access priorities of each operator’s users are modeled using a priority queue, employing the Nash equilibrium for resolution. In [32,33], the authors employ game theory to solve the profit maximization problem faced by a group of independent mobile virtual network operators (MVNOs) who request slices from a mobile network operator (MNO). Similarly, several studies have analyzed the application of game theory to solve various scenarios. Specifically, in several works, such as [34,35,36], game theory has been applied to analyze service provision in a competitive telecommunications environment. However, these studies do not analyze different traffic profiles, such as modeling the coexistence of users utilizing URLLC and mMTC services, a focus of our work, or the shared utilization of network resources by both services. In this paper, we propose to analyze two 5G network models using game theory. The first is a 5G network without NS, where the network resources are shared between URLLC and mMTC services without service priority. The second is a 5G network with NS, where the network resources are shared between URLLC and mMTC services, each having its own priority.
Finally, in [35], the authors analyze the provisioning of services for machine-type communications (MTC) and human-type communications (HTC) by modeling a two-priority queue system. Their work presents two games: in the first game, sensors decide whether to subscribe to the network operator to upload sensing data based on a utility function related to the price charged by the operator and the average service time; and in the second game, users decide whether to subscribe to the service provided by the sensor based on a discrete-choice Logit model related to the quality of the collected data and the subscription price. The authors apply game theory to model the strategic interaction between user subscriptions and the mobile network operator’s network capacity decision.
Concretely, we study two business models. In a monopoly, a single operator offers URLLC and mMTC services. In a duopoly, two different operators offer one service each. Also, two 5G network models are analyzed for both business models. Firstly, a 5G network without network slicing, where network resources are shared between the URLLC and mMTC services without service priority. Secondly, a 5G network with network slicing, where URLLC traffic has priority over URLLC traffic. In addition, our analysis considers URLLC and mMTC services defined in 5G networks that have very different QoS requirements, i.e., a low delay for URLLC services and a high number of mMTC users connecting to the network.
The methodology follows the scientific method in [37], which focuses on acquiring new knowledge through systematic and organized observations. It starts by describing the proposed business and network models based on a literature review of business models and the one-queue model with two different services and approaches [31,35]. This facilitates the formulation of new expressions of user utility based on the QoS parameters of URLLC and mMTC services in the provision and interaction of those services over a 5G network with the incorporation of NS [38]. Subsequently, competition scenarios between network operators and users are analyzed. Concepts from queueing theory, microeconomics (game theory, Nash and Wardrop equilibria), and backward induction models [14] are used to explore the interactions between network operators and users. The objective is to establish an equilibrium between these market players. Solutions are found through optimization problems and their analysis, considering different constraints [39]. Finally, numerical calculations of the business and network models are performed to show their respective functioning. These numerical results allow a better understanding of the behavior of each model, which, in turn, enables conclusions to be drawn accordingly.
The rest of this article is organized as follows. In Section 2, we provide a detailed description of the network, business model, game model, socially optimal outcome, the utility of each player, and pricing scheme. In Section 3, we focus on analyzing and resolving the pricing and subscription decisions for the different models. In Section 4, we present and discuss the results obtained. Finally, in Section 5, we present the conclusions of this research and suggest directions for future work.

2. Model Description

In this section, we provide a detailed description of the network models, the business models, and the game model, as well as the results of the social optimum, the utility of each player, and the pricing scheme.
Two business models are proposed for network operators to offer URLLC and mMTC services to end-users, each service with its own subscriber base so that user competition between operators does not take place.
Also, two 5G network models are analyzed.
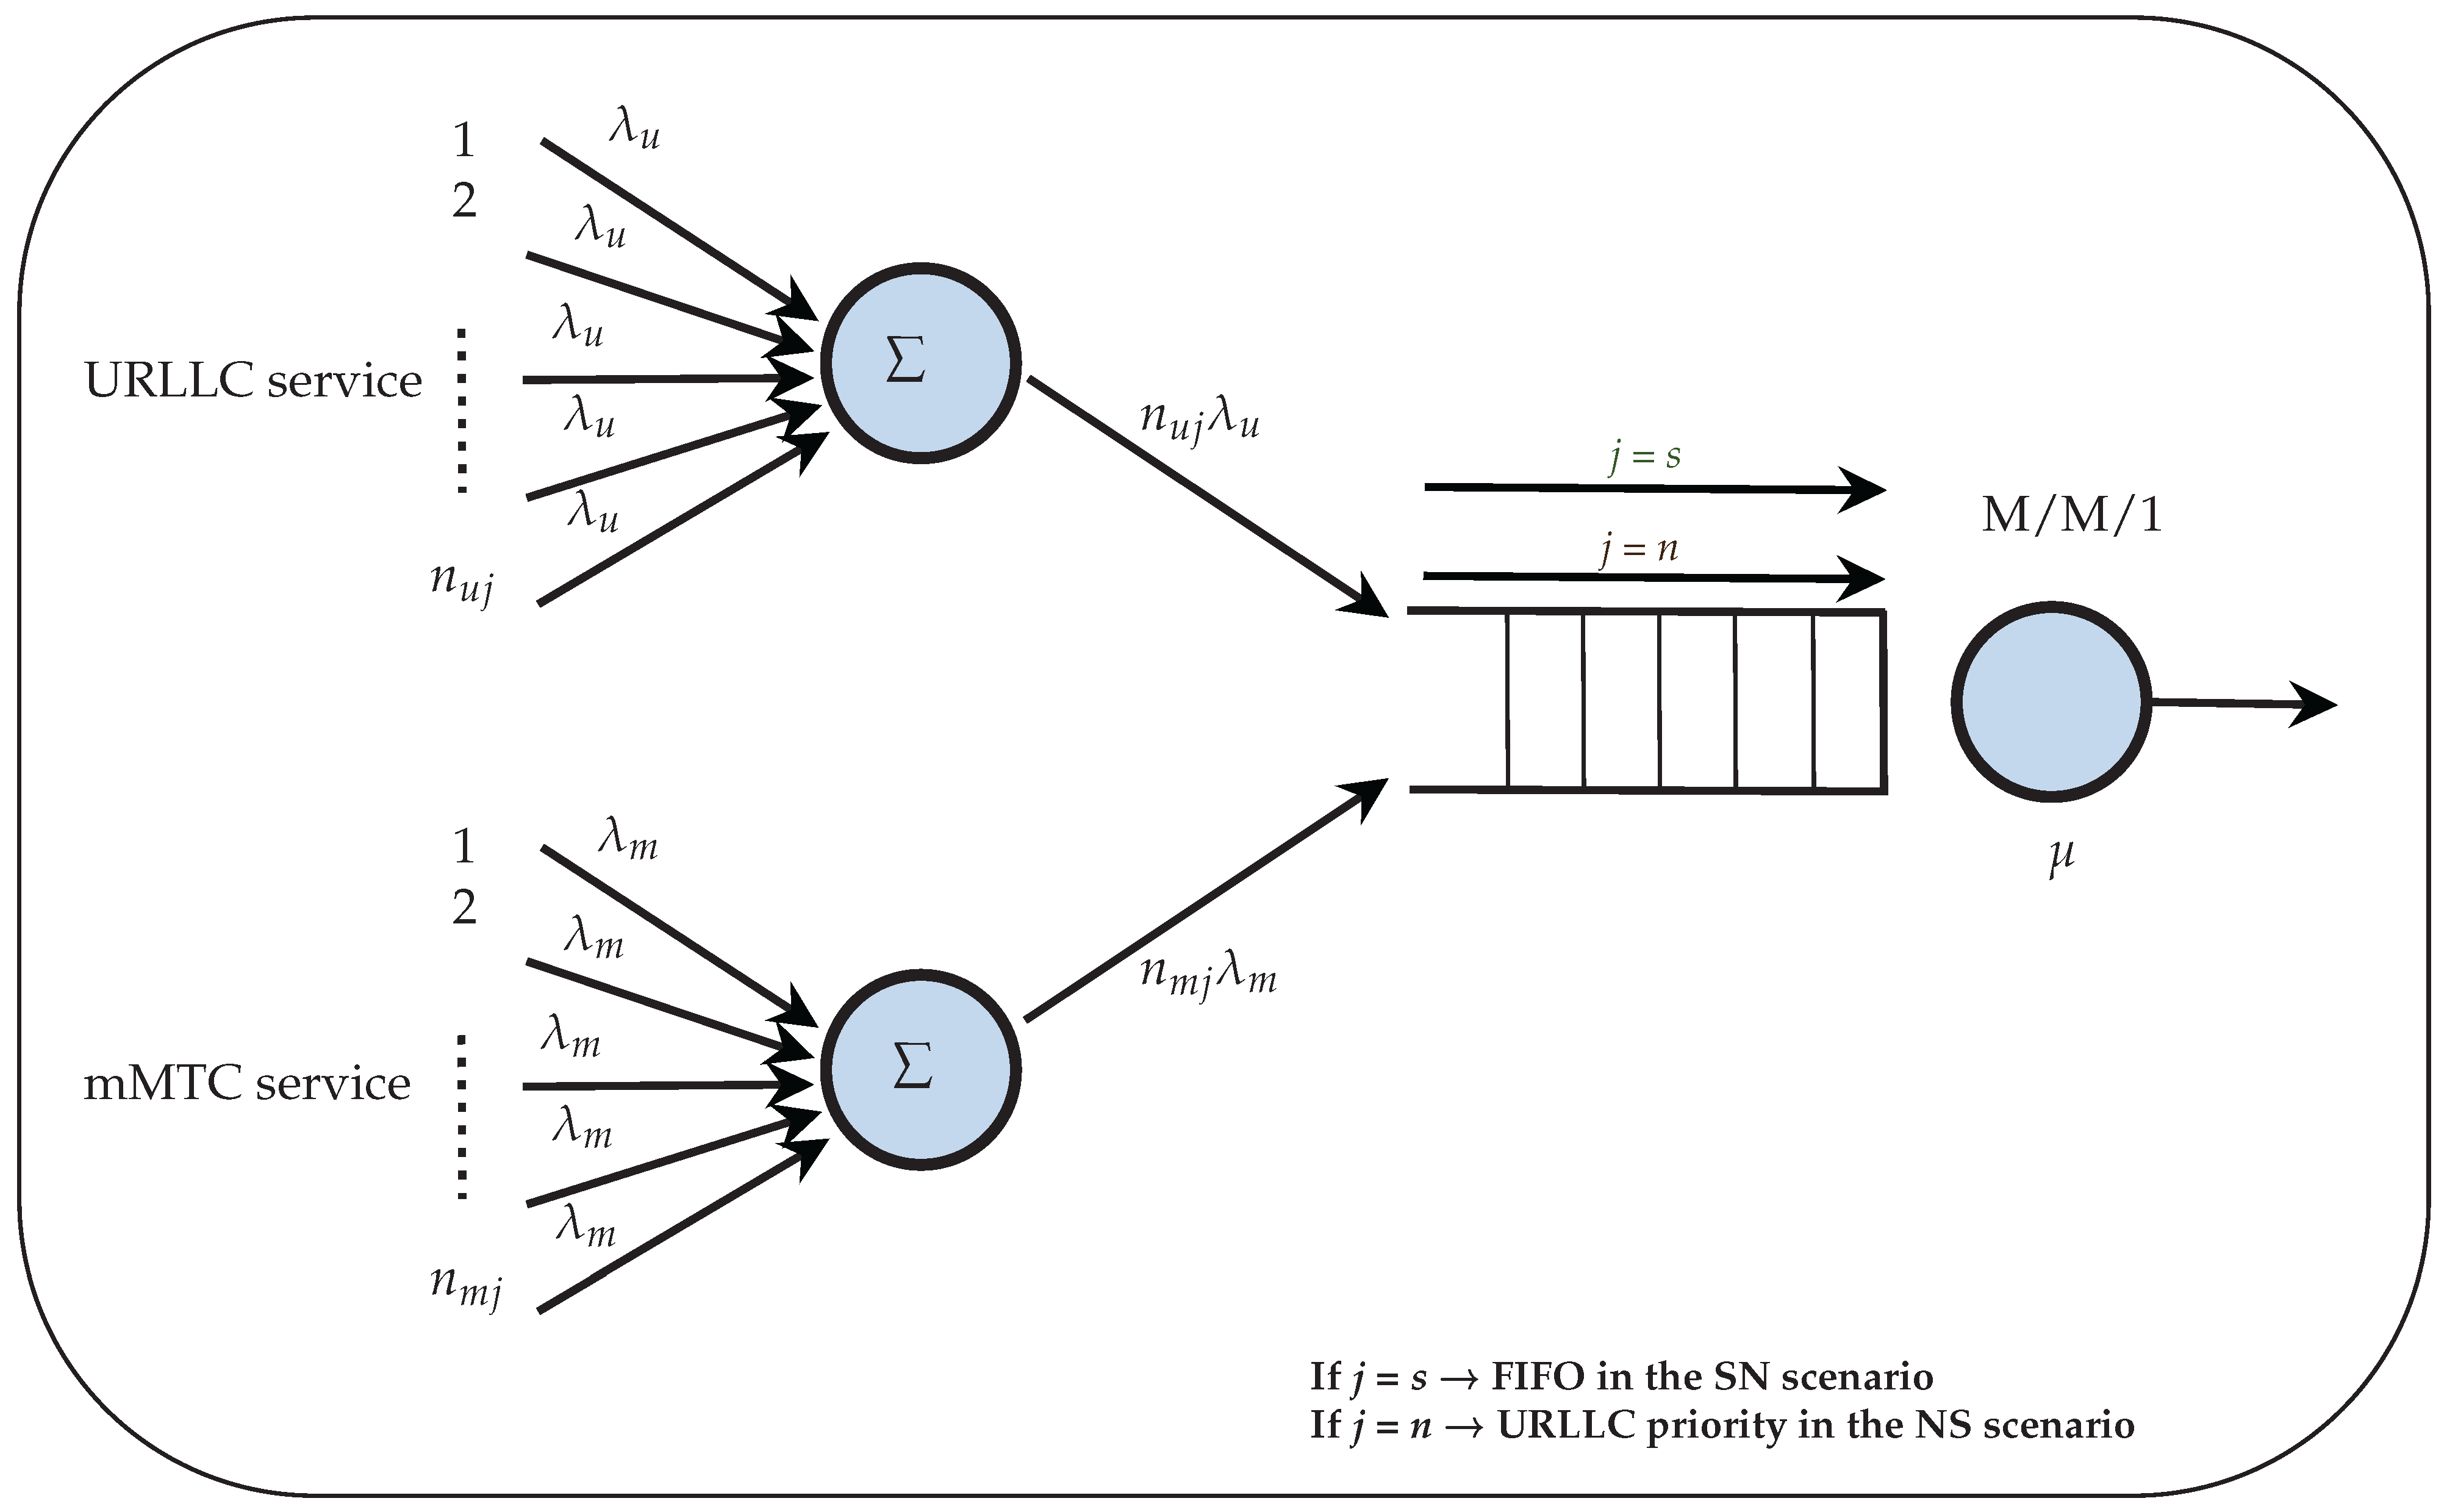
  • A plain 5G network (modeled as a queue without service priority), where network resources are shared between the two services without service priority.
  • A 5G network with network slicing (modeled as a queue with service priority), where network resources are shared between the two services but assigned a higher priority to the URLLC service.
We refer to the first model as the shared network (SN) scenario and the second model as the network slicing (NS) scenario.
The revenue generated by each service depends on the number of users who subscribe, which depends on the QoS and price. The business models and scenarios are shown in Figure 1.
Also, we analyze the social optimum model. We use this model to compare the results with the two business models to evaluate the results of market actors from the point of view of social welfare. We define the specific notations in Figure 2 to help identify the scenarios and the business models analyzed in this article.
We now describe the formal specifications of the business models to establish a solid basis for our analysis. First, we describe the system model governing the provision and interaction of URLLC and mMTC services. Second, we outline the economic model for the market players, i.e., operators and users. In order to carry out this analysis, concepts from queueing theory [40], game theory [41], and microeconomics in telecommunications are employed.
A summary of the notations we use in this article is shown in Table 1.

2.1. System Model

The model for a 5G network providing URLLC and mMTC services to users is an M/M/1 queue, the operation of which is illustrated in Figure 3 and detailed below.
We model a URLLC user as a Poisson packet source with a mean packet generation rate λ u , and we model an mMTC user as a Poisson packet source with a mean packet generation rate λ m . The Poisson model is used to deal with aggregate traffic from multiple sources, considering the independence and low probability of occurrence of each event. This choice is based on the analogy with the Wardrop equilibrium and is theoretically supported in [42], where Poisson is stated to be the limiting form of a binomial distribution. Therefore, if a phenomenon represents the collective sum of several Bernoulli-type events, the overall phenomenon tends to be Poisson. The number of URLLC and mMTC subscribers is denoted by n u j and n m j , respectively. The service times of the packets are exponentially distributed with a mean of 1 μ , where μ represents the network capacity. To ensure stability, we assume that λ < μ , since in delay models, as in our case, M/M/1 or more explicitly, M/M/1/∞, no losses are defined by default, so congestion is simulated by very long queuing times. Therefore, λ < μ is inherently linked to the chosen model, M/M/1/∞. Furthermore, the SN scenario is modeled as an M/M/1 queue without service priority, where packets arriving from URLLC and mMTC users are served with equal priority. The NS scenario is modeled as an M/M/1 queue with service priority, where packets from the URLLC users have higher priority, and packets from the mMTC users have lower priority due to their greater latency tolerance compared to the URLLC service. The system model is illustrated in Figure 3.

2.2. Economic Model

Each URLLC user is asked to pay a price p u j to the operator for the URLLC service and is offered a certain QoS. Similarly, each mMTC subscriber is asked to pay a price p m j to the operator for the mMTC service and is offered a corresponding QoS. Users observe the prices and QoS and make a decision about whether they want to subscribe to the service. In this subsection, we propose expressions for the QoS of URLLC and mMTC services in both the SN and NS scenarios based on queueing theory [40] and the QoS characteristics for each service [7].
For the definition of QoS in the SN and NS scenarios for both services, we consider the probability distribution P [ t ϵ ] of the time t taken for a user packet to traverse the network. Specifically, ( Q u j = k u P [ t > ϵ u ] and Q m j = k m P [ t > ϵ m ] ). The threshold ϵ is different for each service, i.e., ϵ u is the threshold of the URLLC service, and ϵ m is the threshold of the mMTC service. We set ϵ m > ϵ u and λ m < λ u based on the fact that the amount of data sent is lower and the delay tolerance is higher for the mMTC service compared to the URLLC service [7].
Finally, operators’ profits are determined by the difference between their revenue and cost. The amount of revenue and cost of each operator depends on the business model used.

2.2.1. SN Scenario

In this model, both URLLC and mMTC packet flows share the server capacity, so the delay t is affected by both flows, with aggregated rate n u s λ u + n m s λ m , which implies that P [ t ϵ ] = 1 1 e ϵ ( μ n u s λ u n m s λ m ) . Thus, Equation (1) models the QoS of the URLLC service and Equation (2) models the QoS of the mMTC service.
Q u s = k u e ϵ u ( μ n u s λ u n m s λ m )
Q m s = k m e ϵ m ( μ n u s λ u n m s λ m )
The parameters k u and k m are the monetary conversion factors for the QoS, and the parameter α represents the fraction of the network capacity that is effectively used, which is less than the unity to ensure the stability of the M/M/1 queue. In line with standard model analysis procedures, the network is abstracted here as a single bottleneck queue (an M/M/1 queue with service rate μ ), representing the node where congestion occurs [41], where the term “server” refers to the network (network operator) and does not represent a physical server. In our numerical investigations and graphics, we consider the parameter values described in Table 4.

2.2.2. NS Scenario

The QoS of the URLLC and mMTC services depends on their respective delays. In our proposed model, URLLC packets are given a higher preemptive priority over mMTC packets, meaning that the mMTC service does not cause additional delays in the URLLC service. Thus, P [ t ϵ u ] = 1 1 e ϵ u ( μ n u n λ u ) . However, the QoS of the mMTC service is still affected by the presence of the URLLC service. To the best of the authors’ knowledge, there is no closed expression for the delay probability distribution in a priority queue. We propose an approximation for P [ t ϵ m ] that takes into account the fact that, on average, a low-priority arriving packet in the priority queue no longer waits T 2 = 1 / μ per packet in the system, but rather T 2 = 1 / μ ( 1 + n 1 λ 1 T 2 ) , which is T 2 = 1 / ( μ n 1 λ 1 ) since n 1 λ 1 t 2 high-priority packets will arrive during that period, on average. Our approximation posits that ϵ u is multiplied by the factor 1 n u n λ u μ .
Based on the above information, Equation (3) models the QoS of the URLLC service, whereas Equation (4) models the QoS of the mMTC service.
Q u n = k u e ϵ u ( μ n u n λ u )
Q m n = k m e ϵ m ( μ n u n λ u n m n λ m ) 1 n u n λ u μ
The utility that URLLC and mMTC users receive, denoted by U u j and U m j , respectively, is defined as the difference between the perceived QoS in monetary units and the price charged by the operator [34]. We assume that the utility user is zero when users do not subscribe to any service. Based on (1)–(4), the URLLC user utility is expressed as (5), whereas the mMTC user utility is expressed as (6).
U u j = Q u j p u j
U m j = Q m j p m j

2.2.3. Monopoly

The revenue generated by a network operator providing both URLLC and mMTC services comes from subscriptions, and the prices charged by each service are denoted by p u j and p m j , respectively. Assuming that the network operator does not incur any costs, its profit can be expressed as the following mathematical expression.
Π j = n u j p u j + n m j p m j

2.2.4. Duopoly

In a duopoly setting, a URLLC operator (Op-U) charges subscribers a price p u j , whereas an mMTC operator (Op-m) charges subscribers a price p m j . Both operators use the resources according to the network scenario to provide the services to their respective subscribers. Otherwise, neither operator incurs any costs. Therefore, each operator’s profit is given by.
Π u j = n u j p u j
Π m j = n m j p m j
The operator’s profit should decrease by the amount of investment costs and operating costs. However, operating costs have not been considered in the profit expression, as they are not directly related to the price of the service, which makes the expression less explicit. In addition, investment costs are considered a constant value, which simplifies the expression of the profit.

2.3. Game

In this subsection, we describe the strategic interactions between users’ subscription decisions and operators’ pricing decisions.
  • Monopoly
1.
URLLC and mMTC users’ subscription decisions are influenced by the monopoly operator’s pricing decisions.
2.
The subscription decisions of URLLC users depend on the subscription decisions of mMTC users through Q u j . In turn, the subscription decisions of mMTC users depend on the subscription decisions of URLLC users through Q m j .
3.
The monopoly operator’s profit depends on the subscription decisions of both types of users for the corresponding service.
  • Duopoly
1.
The subscription decisions of Op-U and Op-m users are influenced by the respective pricing decisions of each operator.
2.
There is a strategic interaction between the subscription decisions of Op-U and Op-m users, as the subscription decisions of URLLC users depend on the subscription decisions of mMTC users through Q u j , and vice versa through Q m j .
3.
Op-U’s profit depends on the subscription decisions of its users, whereas Op-m’s profit depends on the decisions of its users.
4.
The profit of Op-m is indirectly influenced by Op-U’s pricing decisions through the subscription decisions of Op-U users.
The interactions between URLLC and mMTC users and operators in the monopoly and duopoly business models are analyzed using game theory. The players in the monopoly are URLLC and mMTC users and the monopoly operator, whereas in the duopoly, the players are the URLLC and mMTC users and Op-U and Op-m. The incentives in the game are the utilities for each user and the profit for each operator. The game model proposed in this study is a two-stage game, where the game’s structure differs for each business model. The proposed game model is depicted in Figure 4.
  • Monopoly: Stage I involves a single player (monopoly operator), setting both p u j and p m j .
  • Duopoly: Stage I involves two players, Op-U and Op-m, each determining the price of their respective services.
In both the monopoly and the duopoly models, Stage II involves the URLLC and mMTC users, where each user chooses whether they want to subscribe. The solution to the game is an equilibrium strategy for each player, which is known as a Nash equilibrium. In this equilibrium, no player has an incentive to deviate from his chosen strategy, as long as the other players continue to play their equilibrium strategies. The proposed two-stage game is solved using backward induction, which is common in game theory literature [43]. This means that in Stage I, players anticipate the solution of Stage II. As Stage II players choose their actions based on the choices of Stage I players, Stage I players anticipate the choices of Stage II players. This approach justifies solving the game in two stages by first finding the Stage II equilibrium strategies, given the best responses of Stage I players, and then solving the Stage I equilibrium strategies.

2.3.1. Stage II—User Subscription
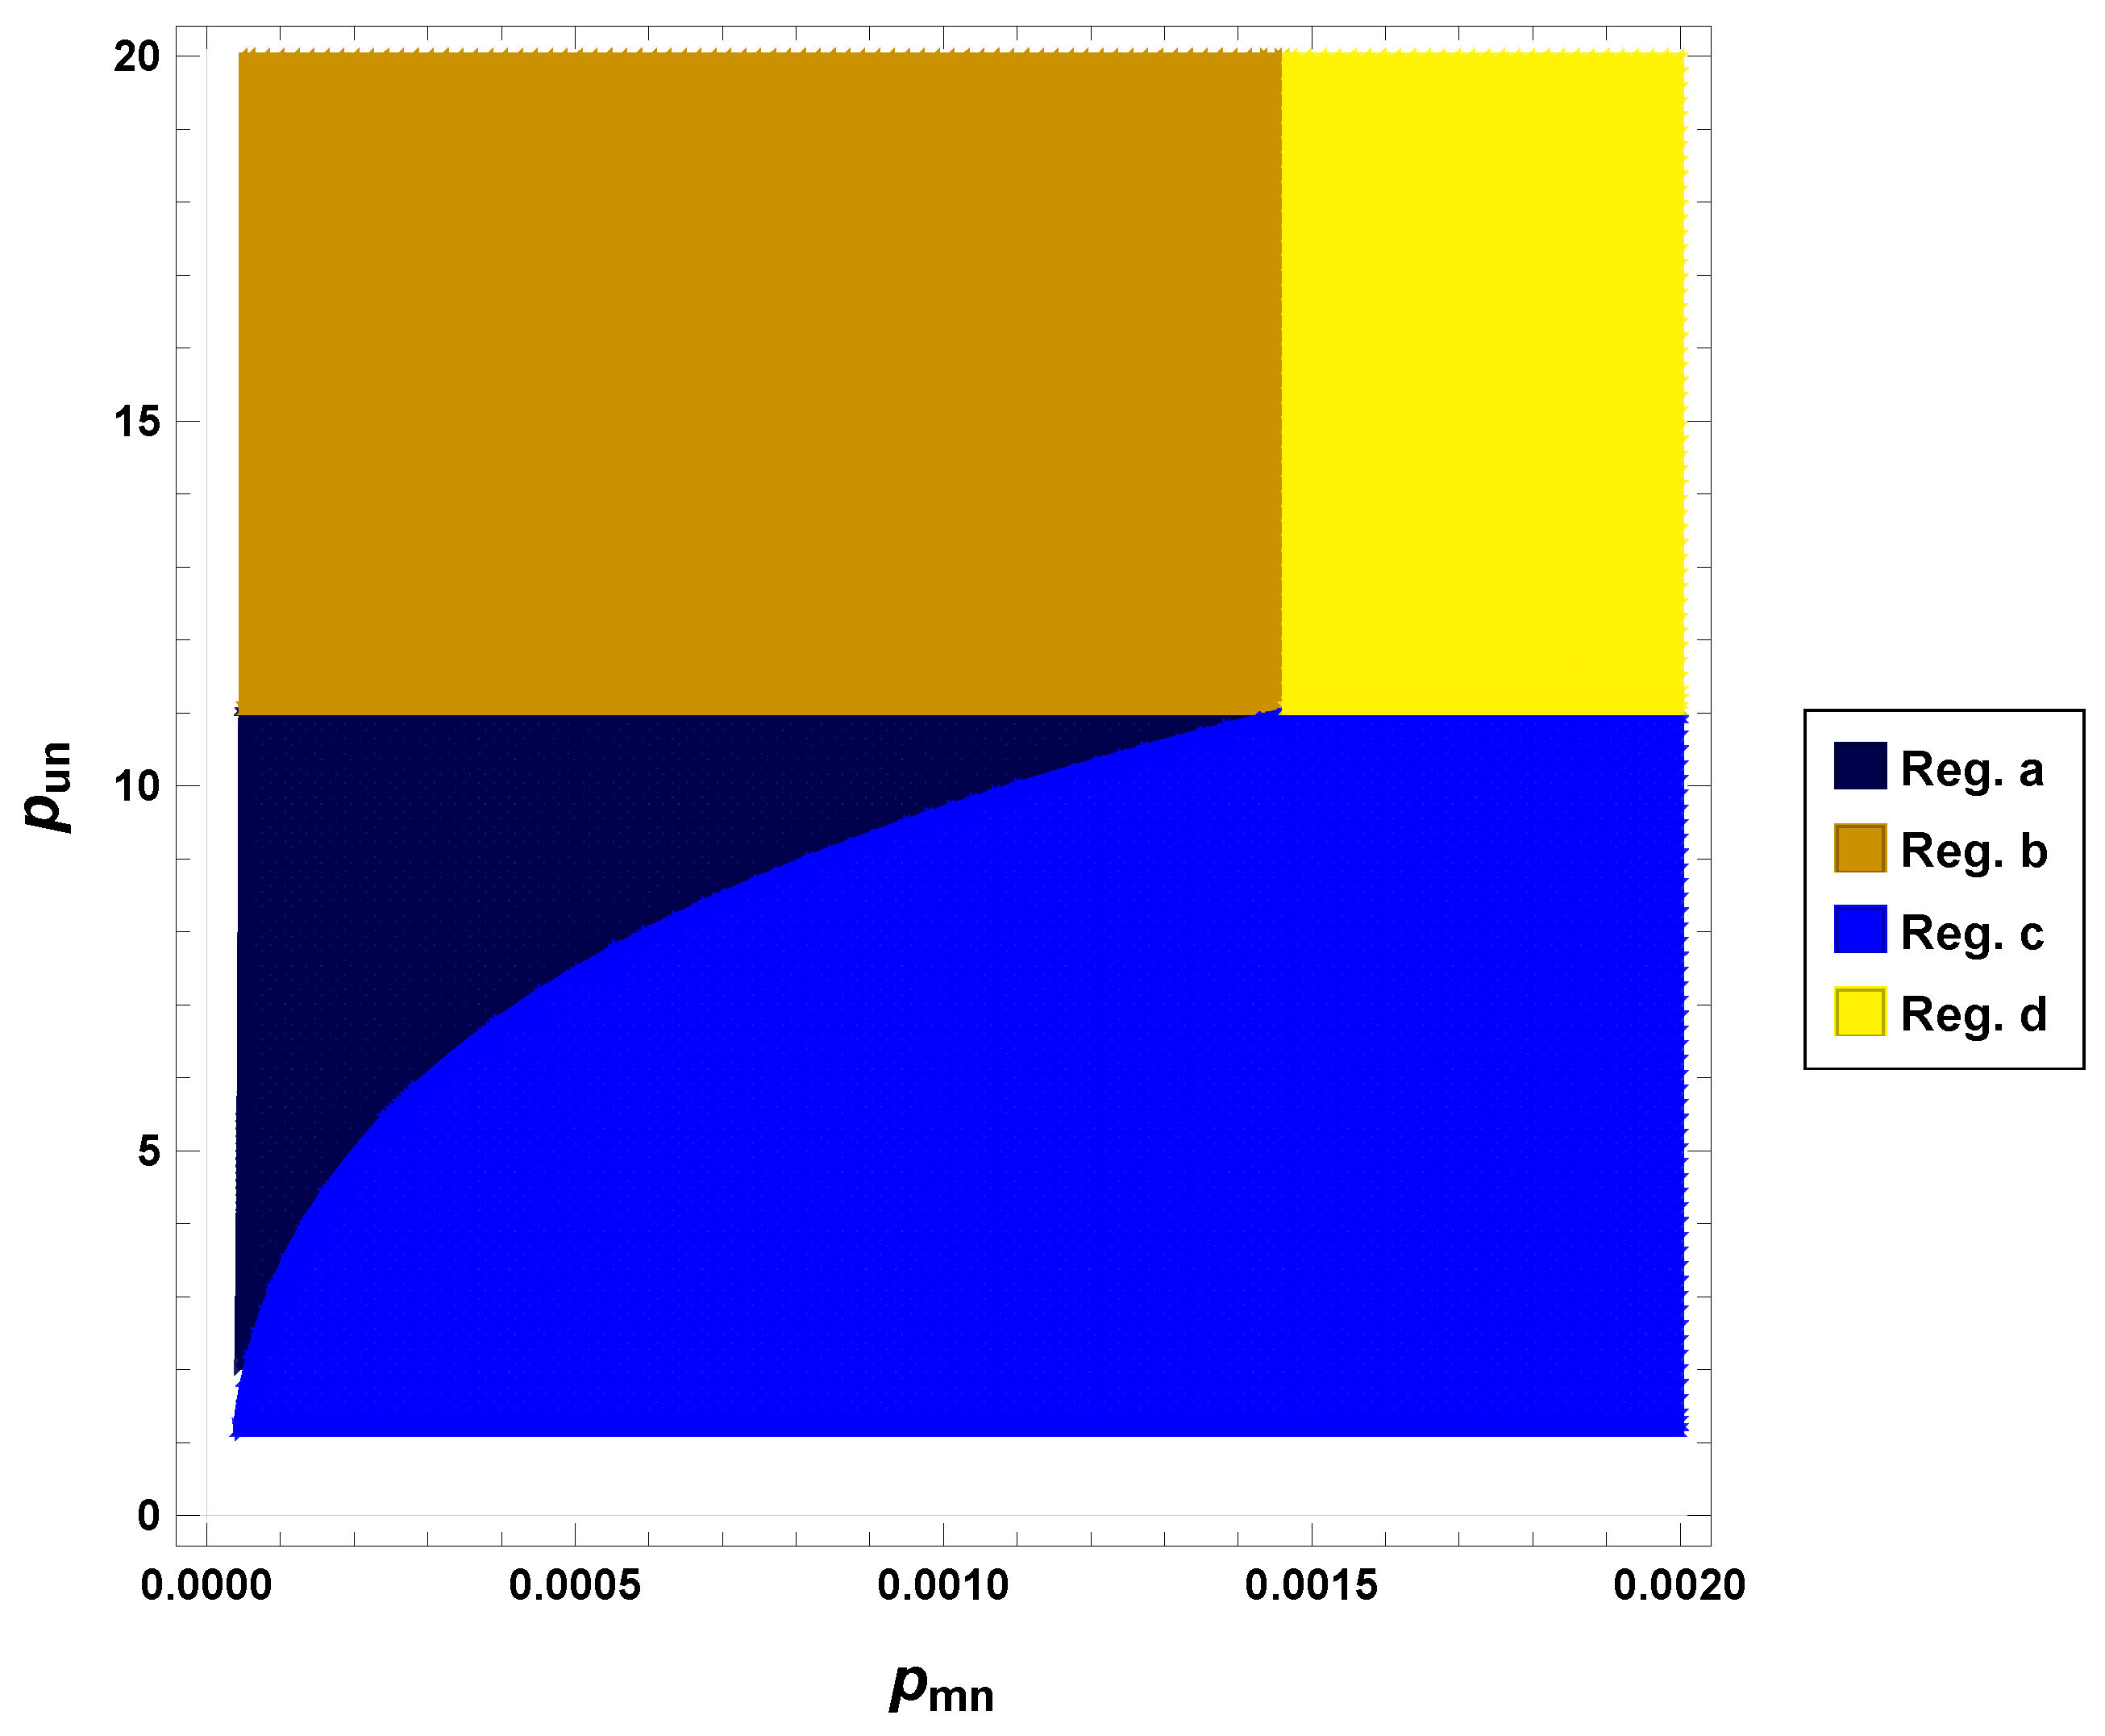
In Stage II of the analysis, URLLC and mMTC users pay subscription prices ( p u j and p m j , respectively) to the network operator in exchange for utilities ( U u j and U m j , respectively). Users take into account the prices set by the operator to decide whether to subscribe to the service. Users subscribe whenever the corresponding utility is strictly positive due to the number of users in each user base being very large. In the analysis of the mMTC service for the SN and NS scenarios, the utility of an mMTC user is affected by the subscription decisions of other users (URLLC users and mMTC users). In addition, the delay in the M/M/1 queue influences the user’s utility, which depends on the decisions of the URLLC and mMTC users since a higher number of subscriptions will result in a higher delay. In the analysis of the URLLC service in the SN scenario, the URLLC user’s utility depends on the delay in the M/M/1 queue and the decisions of the URLLC and mMTC users. In the NS scenario, the URLLC user’s utility depends only on the decisions of the URLLC users since a higher number of URLLC subscriptions will result in a higher delay.
The strategic interactions between the users of both services occur through the congestion effect on the utility, and an equilibrium is sought based on Wardrop’s principle, commonly used for route selection in transport networks. In this equilibrium, all users obtain the same level of utility from the selected alternatives. This principle is used in transport planning and traffic engineering to model user behavior and optimize network performance. We distinguish four possible equilibrium cases based on Wardrop’s principle. Each case depends on the choices made by URLLC users (subscribe or not subscribe) and mMTC users (subscribe or not subscribe), resulting in four cases. Firstly, U u j = 0 (some URLLC users subscribe, and some do not, n u j 0 ). Secondly, U u j < 0 (no URLLC users subscribe, n u j = 0 ). These same cases apply to U m j . We describe the four cases (situations) in (10)–(13).
  • Case a:
    n u j 0 , n m j 0 , U m j = 0 , U u j = 0
  • Case b:
    n u j = 0 , n m j 0 , U m j = 0 , U u j < 0
  • Case c:
    n u j 0 , n m j = 0 , U m j < 0 , U u j = 0
  • Case d:
    n u j = 0 , n m j = 0 , U m j < 0 , U u j < 0
    where the functions n u j ( p u j , p m j ) and n m j ( p u j , p m j ) are expressed in terms of p u j and p m j , as explained in the section that analyzes the models. In addition, we apply the constraint n u j λ u + n m j λ m α μ to guarantee the stability of the network.

2.3.2. Stage I: Operator Pricing

In the monopoly model, the operator determines the prices of both URLLC and mMTC services to maximize its profits. The operator assumes that user subscriptions will reach an equilibrium, as described in (10)–(13), where the Wardrop equilibrium regions have been identified. Therefore, the operator’s profit depends on the prices it sets for URLLC and mMTC services.
( p u j m , p m j m ) arg max p u j , p m j Π j m ( p u j , p m j )
In the duopoly model, each operator prices its own service independently. To determine each operator’s optimal price, it takes into account not only its own profit and the subscription decisions made in Stage II but also the decisions of its competitors. Likewise, to find each operator’s optimal price, the best response (BR) function, which is influenced by the other operators’ decisions, is used.
B R u ( p m j ) = arg max p u j Π u j d ( p u j , p m j d )
B R m ( p u j ) = arg max p m j Π m j d ( p u j d , p m j )
Finally, in the Nash equilibrium in Stage I, each operator determines its best price in response to the other operators’ prices [41], leading to the following system of equations.
p u j d B R u ( p m j d )
p m j d B R m ( p u j d )

2.4. Social Optimum Model

In this subsection, we propose and analyze a social optimum model, which incorporates a market regulator that seeks to maximize social welfare ( S W ). The S W is defined as the sum of all users’ utilities and operators’ profits, i.e., S W j = C S j + Π j . The search for the social welfare optimum ( S W j o ) involves maximizing this sum. Moreover, the value of S W j o is used as a benchmark to compare with the S W values obtained in the monopoly and duopoly models.
In this context, we define consumer surplus ( C S ) as the sum of all URLLC and mMTC users’ utilities ( C S u j + C S m j ), where C S u j = n u j ( Q u j p u j ) and C S m j = n m j ( Q m j p m j ) . It is important to note that in the user equilibrium, the utilities of both types of users are zero. Therefore, C S u j = C S m j = 0 and C S j = 0 . The development of the social optimum model allows us to analyze the relationship between the number of users and social welfare in different scenarios, which is very useful for decision making in the market. Based on the above, we have the following:
S W j = C S j + Π j
= n m j ( Q m j p m j ) + n u j ( Q u j p u j ) + n u j p u j + n m j p m j
= n u j Q u j + n m j Q m j
Therefore, the social welfare maximization problem is:
max n u j , n m j n u j Q u j + n m j Q m j
s . t . n u j 0
n m j 0
n u j λ u + n m j λ m α μ
Obtaining the S W j o and the pair of variables ( n u j o , n m j o ) is carried out through the maximization problem of social welfare.
Therefore, the expressions in (26)–(29) indicate how to find the variable pair ( n u s o , n m s o ) that maximizes the S W s for the SN scenario at the social optimum.
( n u s o , n m s o ) arg max n u s , n m s n u s k u e ϵ u ( μ n m s λ m n u s λ u ) + n m s k m e ϵ m ( μ n m s λ m n u s λ u )
s . t . n u s 0
n m s 0
n u s λ u + n m s λ m α μ
Likewise, the expressions in (30)–(33) indicate how to find the variable pair ( n u n o , n m n o ) that maximizes the S W n for the NS scenario at the social optimum.
( n u n o , n m n o ) arg max n u n , n m n n u n k u e ϵ u ( μ n u n λ u ) + n m n k m e ϵ m ( μ n m n λ m n u n λ u ) 1 n u n λ u μ
s . t . n u n 0
n m n 0
n u n λ u + n m n λ m α μ
In addition, based on (26)–(33), we obtain the graphics shown below.
Figure 5 shows a graphical representation of S W s and the location of its maximum value ( S W s o = 13,517.3 u.m.) for the optimal number of URLLC users ( n u s o = 3333.33 users) and the optimal number of mMTC users ( n m s o = 0 users).
Likewise, Figure 6 shows a graphical representation of S W n and the location of its maximum value ( S W n o = 16,006.9 u.m.) for the optimal number of URLLC users ( n u n o = 2468.24 users) and the optimal number of mMTC users ( n m n o = 1.70941 × 10 7 users).
In the social optimum, the objective is to maximize social welfare through the distribution of users. Thus, prices are no longer a necessary consideration. However, for each set of values of n u j o and n m j o , there is a corresponding price.
The prices induced for the SN scenario are expressed in (34)–(38).
p u s o = k u e ϵ u ( μ n u s o λ u n m s o λ m )
p m s o = k m e ϵ m ( μ n u s o λ u n m s o λ m )
0 < n u s o
0 < n m s o
n u s o λ u + n m s o λ m α μ
Likewise, the prices induced for the NS scenario are expressed in (39)–(43).
p u n o = k u e ϵ u ( μ n u n o λ u )
p m n o = k m e ϵ m ( μ n u n o λ u n m n o λ m ) 1 n u n λ u μ
0 < n u n o
0 < n m n o
n u n o λ u + n m n o λ m α μ
Finally, from (8), (7), and (34)–(43), we can derive the expressions for each operator’s profit and the total profit at the social optimum for both the SN and NS scenarios, i.e., Π u j o , Π m j o , and y Π j o .

3. Analysis

In this section, we conduct a detailed analysis and solve the pricing and subscription decisions for the proposed models and scenarios. We start by analyzing the analytical Wardrop equilibrium for Stage II in both scenarios. Then, the solutions for Stage I in the monopoly and duopoly cases are presented.

3.1. Analysis of Stage II

3.1.1. SN Scenario

The analysis of the SN scenario for the monopoly and duopoly models is conducted based on (10)–(13), resulting in four regions.
Region a:
n u s = 1 2 λ u μ 1 ϵ u ln p u s k u
n m s = 1 2 λ m μ 1 ϵ m ln p m s k m
p u s = k u p m s k m ϵ u ϵ m
p m s = k m p u s k u ϵ m ϵ u
k u e ϵ u μ ( 1 α ) p u s < k u e ϵ u μ
k m e ϵ m μ ( 1 α ) p m s < k m e ϵ m μ
Region b:
n u s = 0
n m s = 1 λ m μ 1 ϵ m ln p m s k m
k u p m s k m ϵ u ϵ m < p u s
k m e ϵ m μ ( 1 α ) p m s < k m e ϵ m μ
Region c:
n u s = 1 λ u μ 1 ϵ u ln p u s k u
n m s = 0
k u e ϵ u μ ( 1 α ) p u s < k u e ϵ u μ
k m p u s k u ϵ m ϵ u < p m s
Region d:
n u s = 0
n m s = 0
k u e ϵ u μ p u s
k m e ϵ m μ p m s
Figure 7 shows a graphical representation of the regions in equilibrium on the plane p u s p m s for specific values of the parameters.

3.1.2. NS Scenario

Similarly, the analysis of the NS scenario for the monopoly and duopoly models is conducted based on (10)–(13), resulting in four regions.
Region a:
n u n = 1 λ u μ 1 ϵ u ln p u n k u
n m n = 1 ϵ u λ m ln p u n k u ϵ u μ ln p m n k m ϵ m λ m ln p u n k u
k u < p u n k u e ϵ u μ
k m p u n k u ϵ m ϵ u ( 1 α ) p m n k m e ϵ m ϵ u 2 μ ln p u n k u 2
Region b:
n u n = 0
n m n = 1 λ m μ 1 ϵ m ln p m n k m
k u e ϵ u μ < p u n
k m e ϵ m ( 1 α ) μ p m n < k m e ϵ m μ
Region c:
n u n = 1 λ u μ 1 ϵ u ln p u n k u
n m n = 0
k u e ϵ u μ ( 1 α ) p u n < k u e ϵ u μ
k m e ϵ m ϵ u 2 μ ln p u n k u 2 < p m n
Region d:
n u n = 0
n m n = 0
k u e ϵ u μ p u n
k m e ϵ m μ p m n
Figure 8 shows a graphical representation of the regions in equilibrium on the plane p u n p m n for specific values of the parameters.
Finally, Table 2 and Table 3 summarize the above expressions for the Wardrop equilibrium in the SN and NS scenarios.

3.2. Analysis of Stage I

In this subsection, we present a detailed analysis and the solutions for Stage I in the proposed models. In particular, the expressions for operator profit in the SN and NS scenarios are analyzed. By understanding these models in detail, the impact of the different parameters on the results can be better assessed.

3.2.1. Monopoly Model in the SN and NS Scenarios

According to (7) and given the Wardrop equilibrium for n u j and n m j obtained from (44)–(77), the profit expressions to be maximized by the monopolistic operator are as follows:
Π s m = p u s 2 λ u μ 1 ϵ u ln p u s k u + p m s 2 λ m μ 1 ϵ m ln p m s k m ( p u s , p m s ) R e g . a p m s λ m μ 1 ϵ m ln p m s k m ( p u s , p m s ) R e g . b p u s λ u μ 1 ϵ u ln p u s k u ( p u s , p m s ) R e g . c 0 ( p u s , p m s ) R e g . d
Π n m = 1 ϵ u λ m p u n ϵ u λ m μ + p m n λ u p u n λ m ln p u n k u λ u p m n ϵ u 2 μ ln p m n k m ϵ m ln p u n k u ( p u n , p m n ) R e g . a p m n λ m μ 1 ϵ m ln p m n k m ( p u n , p m n ) R e g . b p u n λ u μ 1 ϵ u ln p u n k u ( p u n , p m n ) R e g . c 0 ( p u n , p m n ) R e g . d

3.2.2. Duopoly Model in the SN Scenario

According to (8) and (9) and given the Wardrop equilibrium for n u s and n m s obtained from (44)–(61), the profit expressions to be maximized by Op-U and Op-m are as follows:
Π u s d = p u s 2 λ u μ 1 ϵ u ln p u s k u ( p u s , p m s ) R e g . a 0 ( p u s , p m s ) R e g . b R e g . d p u s λ u μ 1 ϵ u ln p u s k u ( p u s , p m s ) R e g . c
Π m s d = p m s 2 λ m μ 1 ϵ m ln p m s k m ( p u s , p m s ) R e g . a p m s λ m μ 1 ϵ m ln p m s k m ( p u s , p m s ) R e g . b 0 ( p u s , p m s ) R e g . c R e g . d
The resolution of the BRs is based on the restrictions and regions analyzed in Section 3.1.1, and the following are obtained.
B R u ( p m s ) = k u p m s k m ϵ u ϵ m ϕ k m e ϵ m μ ( 1 α ) p m s < k m e ϵ m μ 1 ϵ u k u e ϵ u μ 1 k m e ϵ m μ 1 ϵ u p m s
B R m ( p u s ) = k m p u s k u ϵ m ϵ u ϕ k u e ϵ u μ ( 1 α ) p u s < k u e ϵ u μ 1 ϵ m k m e ϵ m μ 1 k u e ϵ u μ 1 ϵ m p u s
where ϕ is a sufficiently small but positive quantity.
Figure 9 shows a graphical representation of B R u ( p m s ) and B R m ( p u s ) , where we can see that the BRs do not cross since B R u ( p m s ) is in region c, whereas B R m ( p u s ) is in region b. Therefore, a Nash equilibrium does not exist.

3.2.3. Duopoly Model in the NS Scenario

According to (8) and (9) and given the Wardrop equilibrium for n u n and n m n obtained from (62)–(77), the profit expressions to be maximized by Op-U and Op-m are as follows:
Π u n d = p u n λ u μ 1 ϵ u ln p u n k u ( p u n , p m n ) R e g . a R e g . c 0 ( p u n , p m n ) R e g . b R e g . d
Π m n d = p m n 1 ϵ u λ m ln p u n k u ϵ u μ ln p m n k m ϵ m λ m ln p u n k u ( p u n , p m n ) R e g . a p m n λ m μ 1 ϵ m ln p m n k m ( p u n , p m n ) R e g . b 0 ( p u n , p m n ) R e g . c R e g . d
The resolutions of the BRs are obtained based on the restrictions and regions analyzed in Section 3.1.2, and the following are obtained.
B R u ( p m n ) = k u e ϵ u μ 1 k m e ϵ m ( 1 α ) μ 1 ϵ u p m n
B R m ( p u n ) = k m p u n k u ϵ m ( 1 α ) ϵ u k u e ϵ u μ ( 1 α ) p u n k u e 1 2 ϵ u μ ( 1 α ) + ϵ u 2 μ 4 + ϵ m μ ( 1 α ) 2 ϵ m k m e ϵ m ln p u n k u 2 ϵ u 2 μ 1 k u e 1 2 ϵ u μ ( 1 α ) + ϵ u 2 μ 4 + ϵ m μ ( 1 α ) 2 ϵ m p u n < k u e ϵ u μ k m e ϵ m μ 1 k u e ϵ u μ p u n
Finally, Figure 10 shows a graphical representation of B R u ( p m n ) and B R m ( p u n ) based on the parameter values listed in Table 4. The figure shows that the BRs cross at a point where a unique Nash Equilibrium exists, which is ( p u n d , p m n d ), where:
p u n d = k u e ϵ u μ 1
p m n d = k m e ϵ m ( ϵ u μ 1 ) 2 ϵ u 2 μ 1
n u n d = 1 ϵ u λ u
n m n d = ϵ u μ ϵ m λ m ( ϵ u μ 1 )
Π u n d = k u e ϵ u μ 1 ϵ u λ u
Π m n d = ϵ u μ k m e ϵ m ( ϵ u μ 1 ) 2 ϵ u 2 μ 1 ϵ m λ m ( ϵ u μ 1 )

4. Results and Discussion

In this section, we present some numerical results obtained from the above models. The setting of the value of each parameter is based on the consistency of these values with the QoS characteristics of the URLLC and mMTC services, as URLLC requires extremely low delays (0.25–0.3 ms/packet) [6,44]. The delay threshold for the URLLC service ( ϵ u ) is set to 0.3 ms/packet, so μ takes values about μ > ( 1 / ϵ u ) . The setting of the values of the other parameters is also determined. On the other hand, the purpose of setting the interval of μ is to present some numerical results obtained from the proposed models. In particular, we calculate the numerical values for the prices. We present the two scenarios for each business model: the SN scenario and the NS scenario. Finally, we conduct a series of numerical experiments to obtain a better understanding of the scenarios from the economic interactions, and the results are computed using Wolfram Mathematica 12.3.
Unless otherwise stated, the parameter values in Table 4 are used.

4.1. Monopoly Business Model

Price. Figure 11 shows the effect of μ on the prices of URLLC and mMTC services. In the SN scenario, we can see that p u s m and p m s m increase as μ increases. Similarly, in the NS scenario, we can see that p u n m and p m n m also increase as μ increases. However, we can see that in both scenarios, p u j m > > p m j m , which makes sense, given that URLLC users would be willing to pay a higher price than mMTC users due to their stricter QoS requirements.
Number of subscribers. Figure 12 shows the relationship between the number of subscribers and μ . In the SN scenario, we can see that n m s m is equal to zero. This indicates that the operator is not interested in offering the mMTC service due to its negative impact on the QoS of the URLLC service. Therefore, the operator only offers the URLLC service. In contrast, in the NS scenario, we can see that both n u n m and n m n m are non-zero, indicating that it is in the operator’s interest to offer both services. Now, the mMTC service does not affect the QoS of the URLLC service. Furthermore, the higher value of n m n m compared to n u n m is consistent with the low packet generation rate of the mMTC devices.
Operator’s total profit. Figure 13 shows the operator’s total profit as a function of μ in the SN and NS scenarios. We can see that the total profits in both scenarios increase as μ increases since an increase in μ allows more traffic from the users. We also note that Π n m > Π s m due to the fact that in the NS scenario, the operator can offer services not only to URLLC subscribers but also to mMTC subscribers.
Social welfare. As we argued in Section 2.4, social welfare is equal to the total profit, so the above discussion is also applicable here.
The conclusion is that the best option for a monopoly to offer the URLLC and mMTC services is to support them over a 5G network with network slicing. This conclusion is based on the fact that social welfare is higher and that both services can be provided.

4.2. Duopoly Business Model

In this subsection, the results from the duopoly business model are discussed only for the NS scenario because there is no equilibrium in the SN scenario. Figure 14, Figure 15 and Figure 16 are also used in the discussion in the next subsection.
Figure 14 shows the effect of μ on p u n d and p m n d . Figure 15 shows the influence of μ on n u n d and n m n d . Figure 16 shows Π n d as a function of μ . Figure 17 shows the relationship between S W n d and μ . Overall, the same conclusion for the monopoly business model in the NS scenario in the previous subsection can be drawn here.

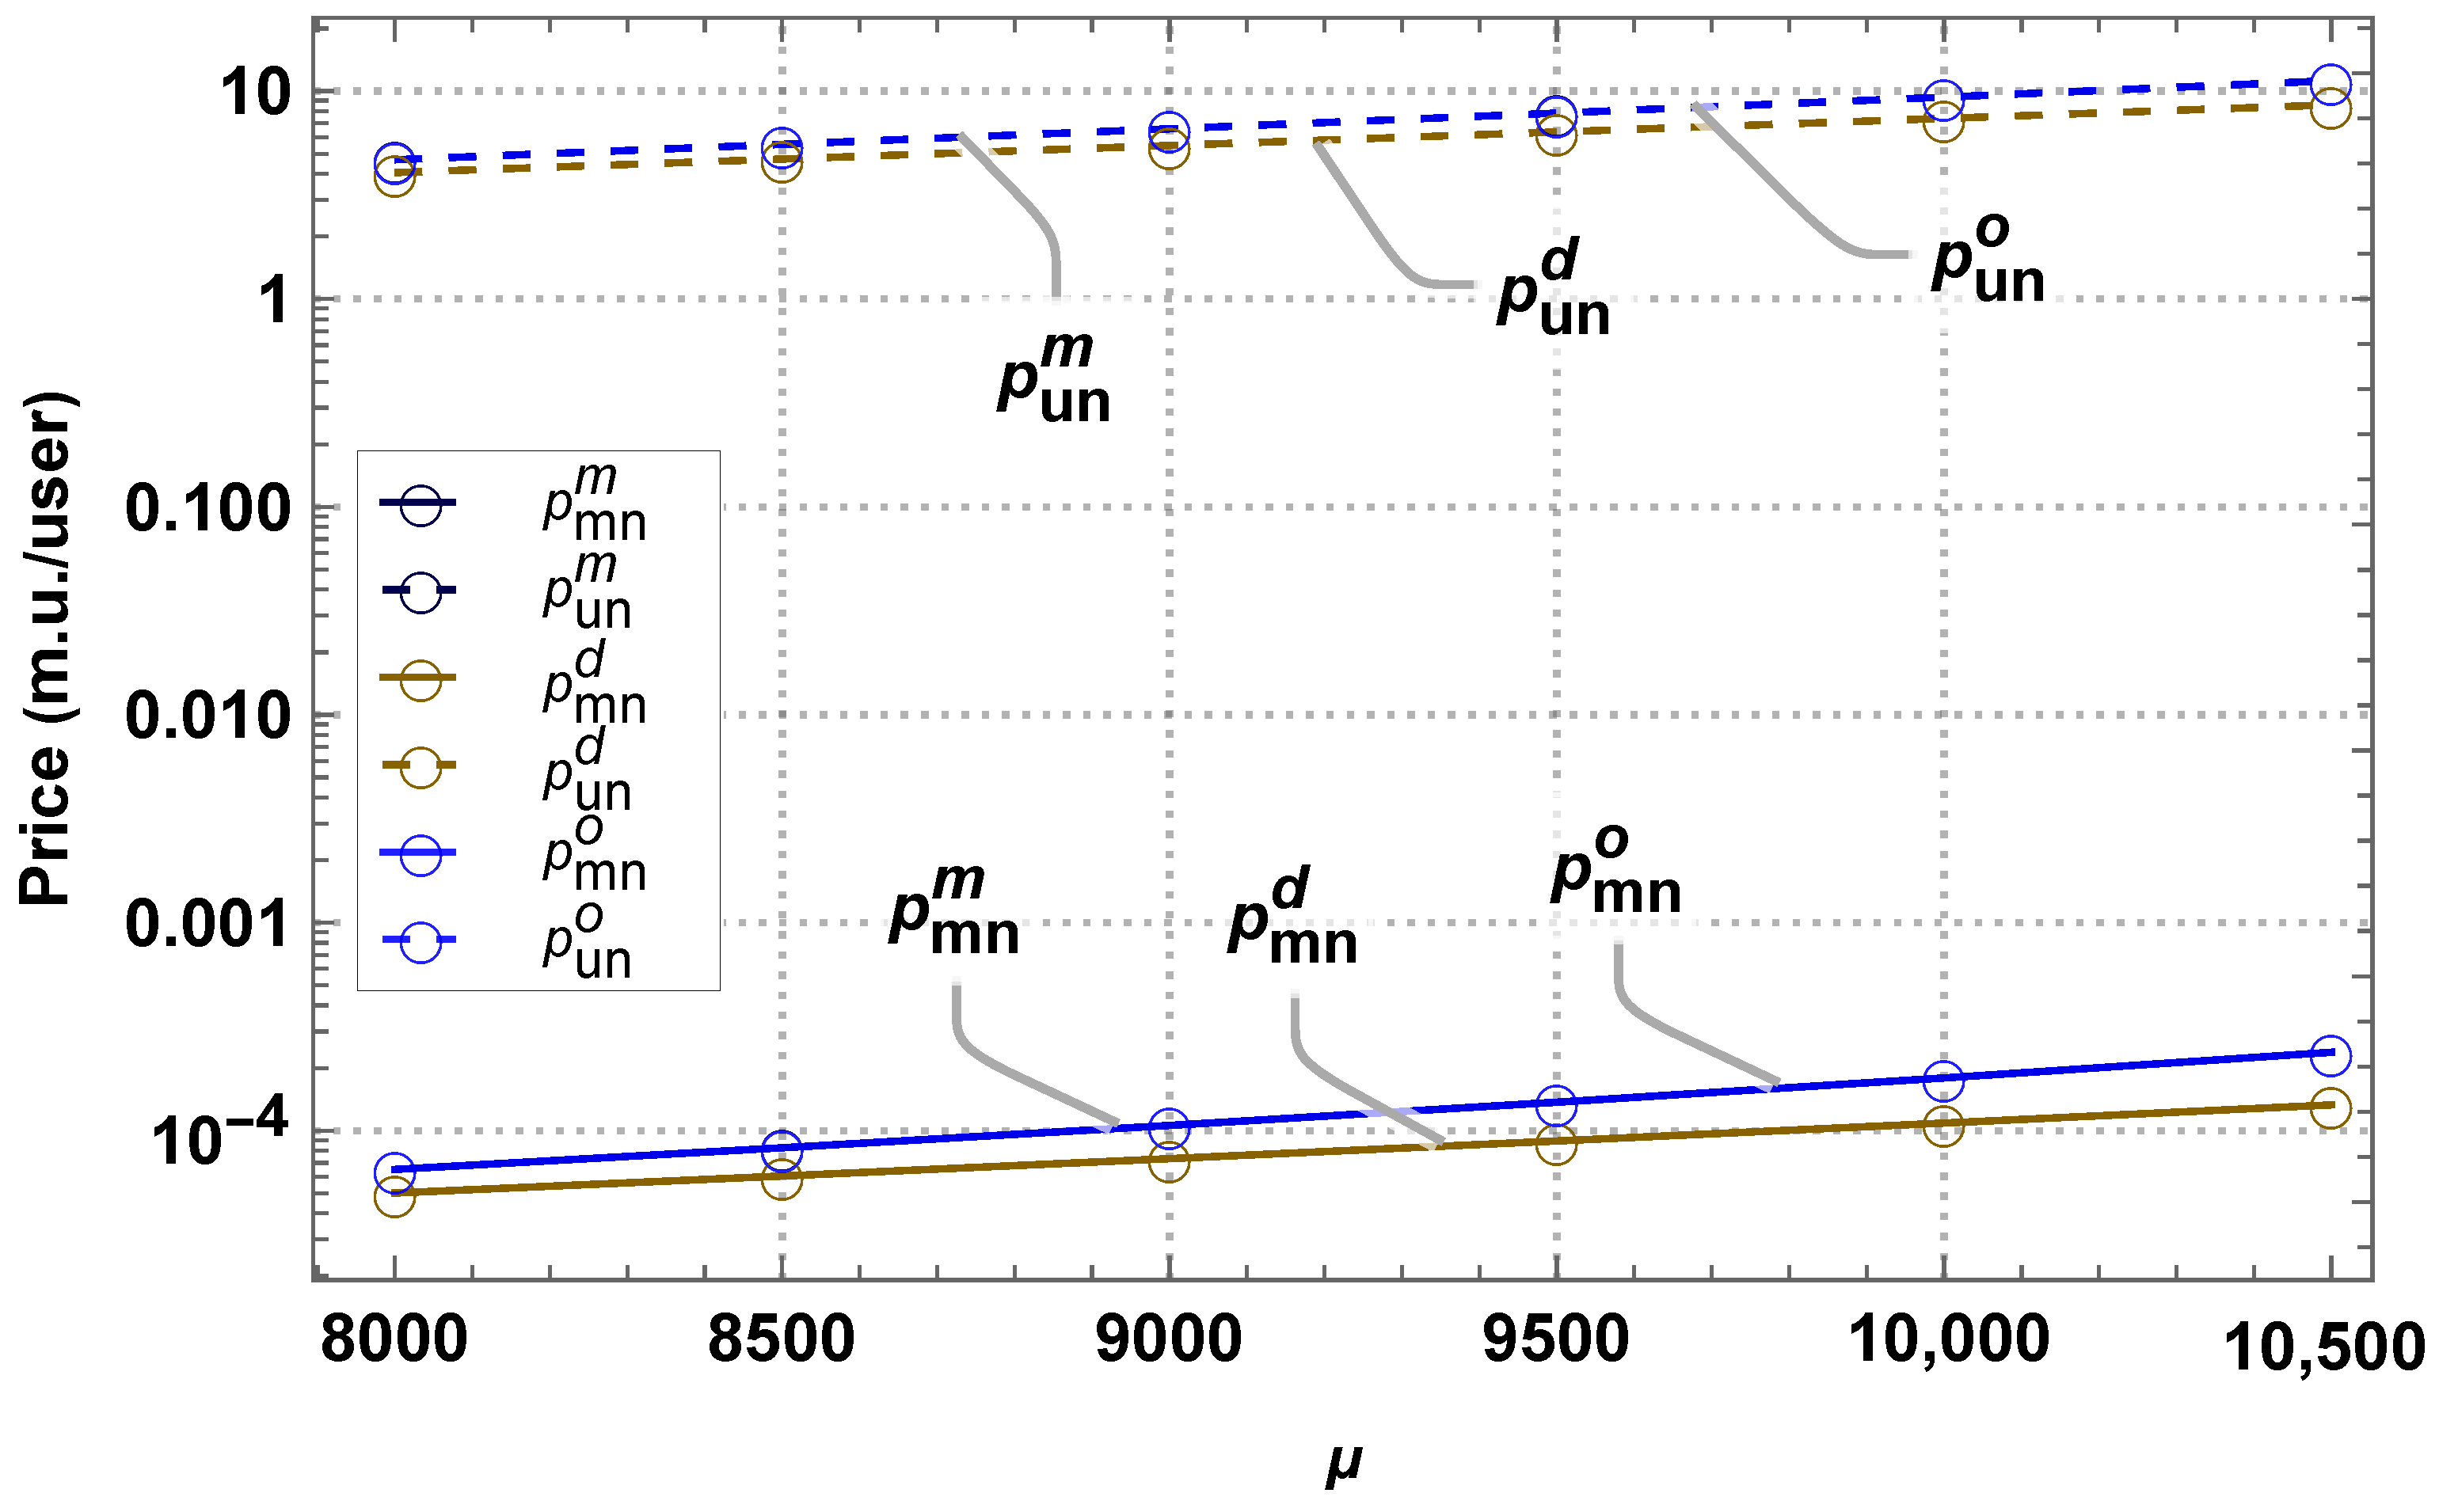
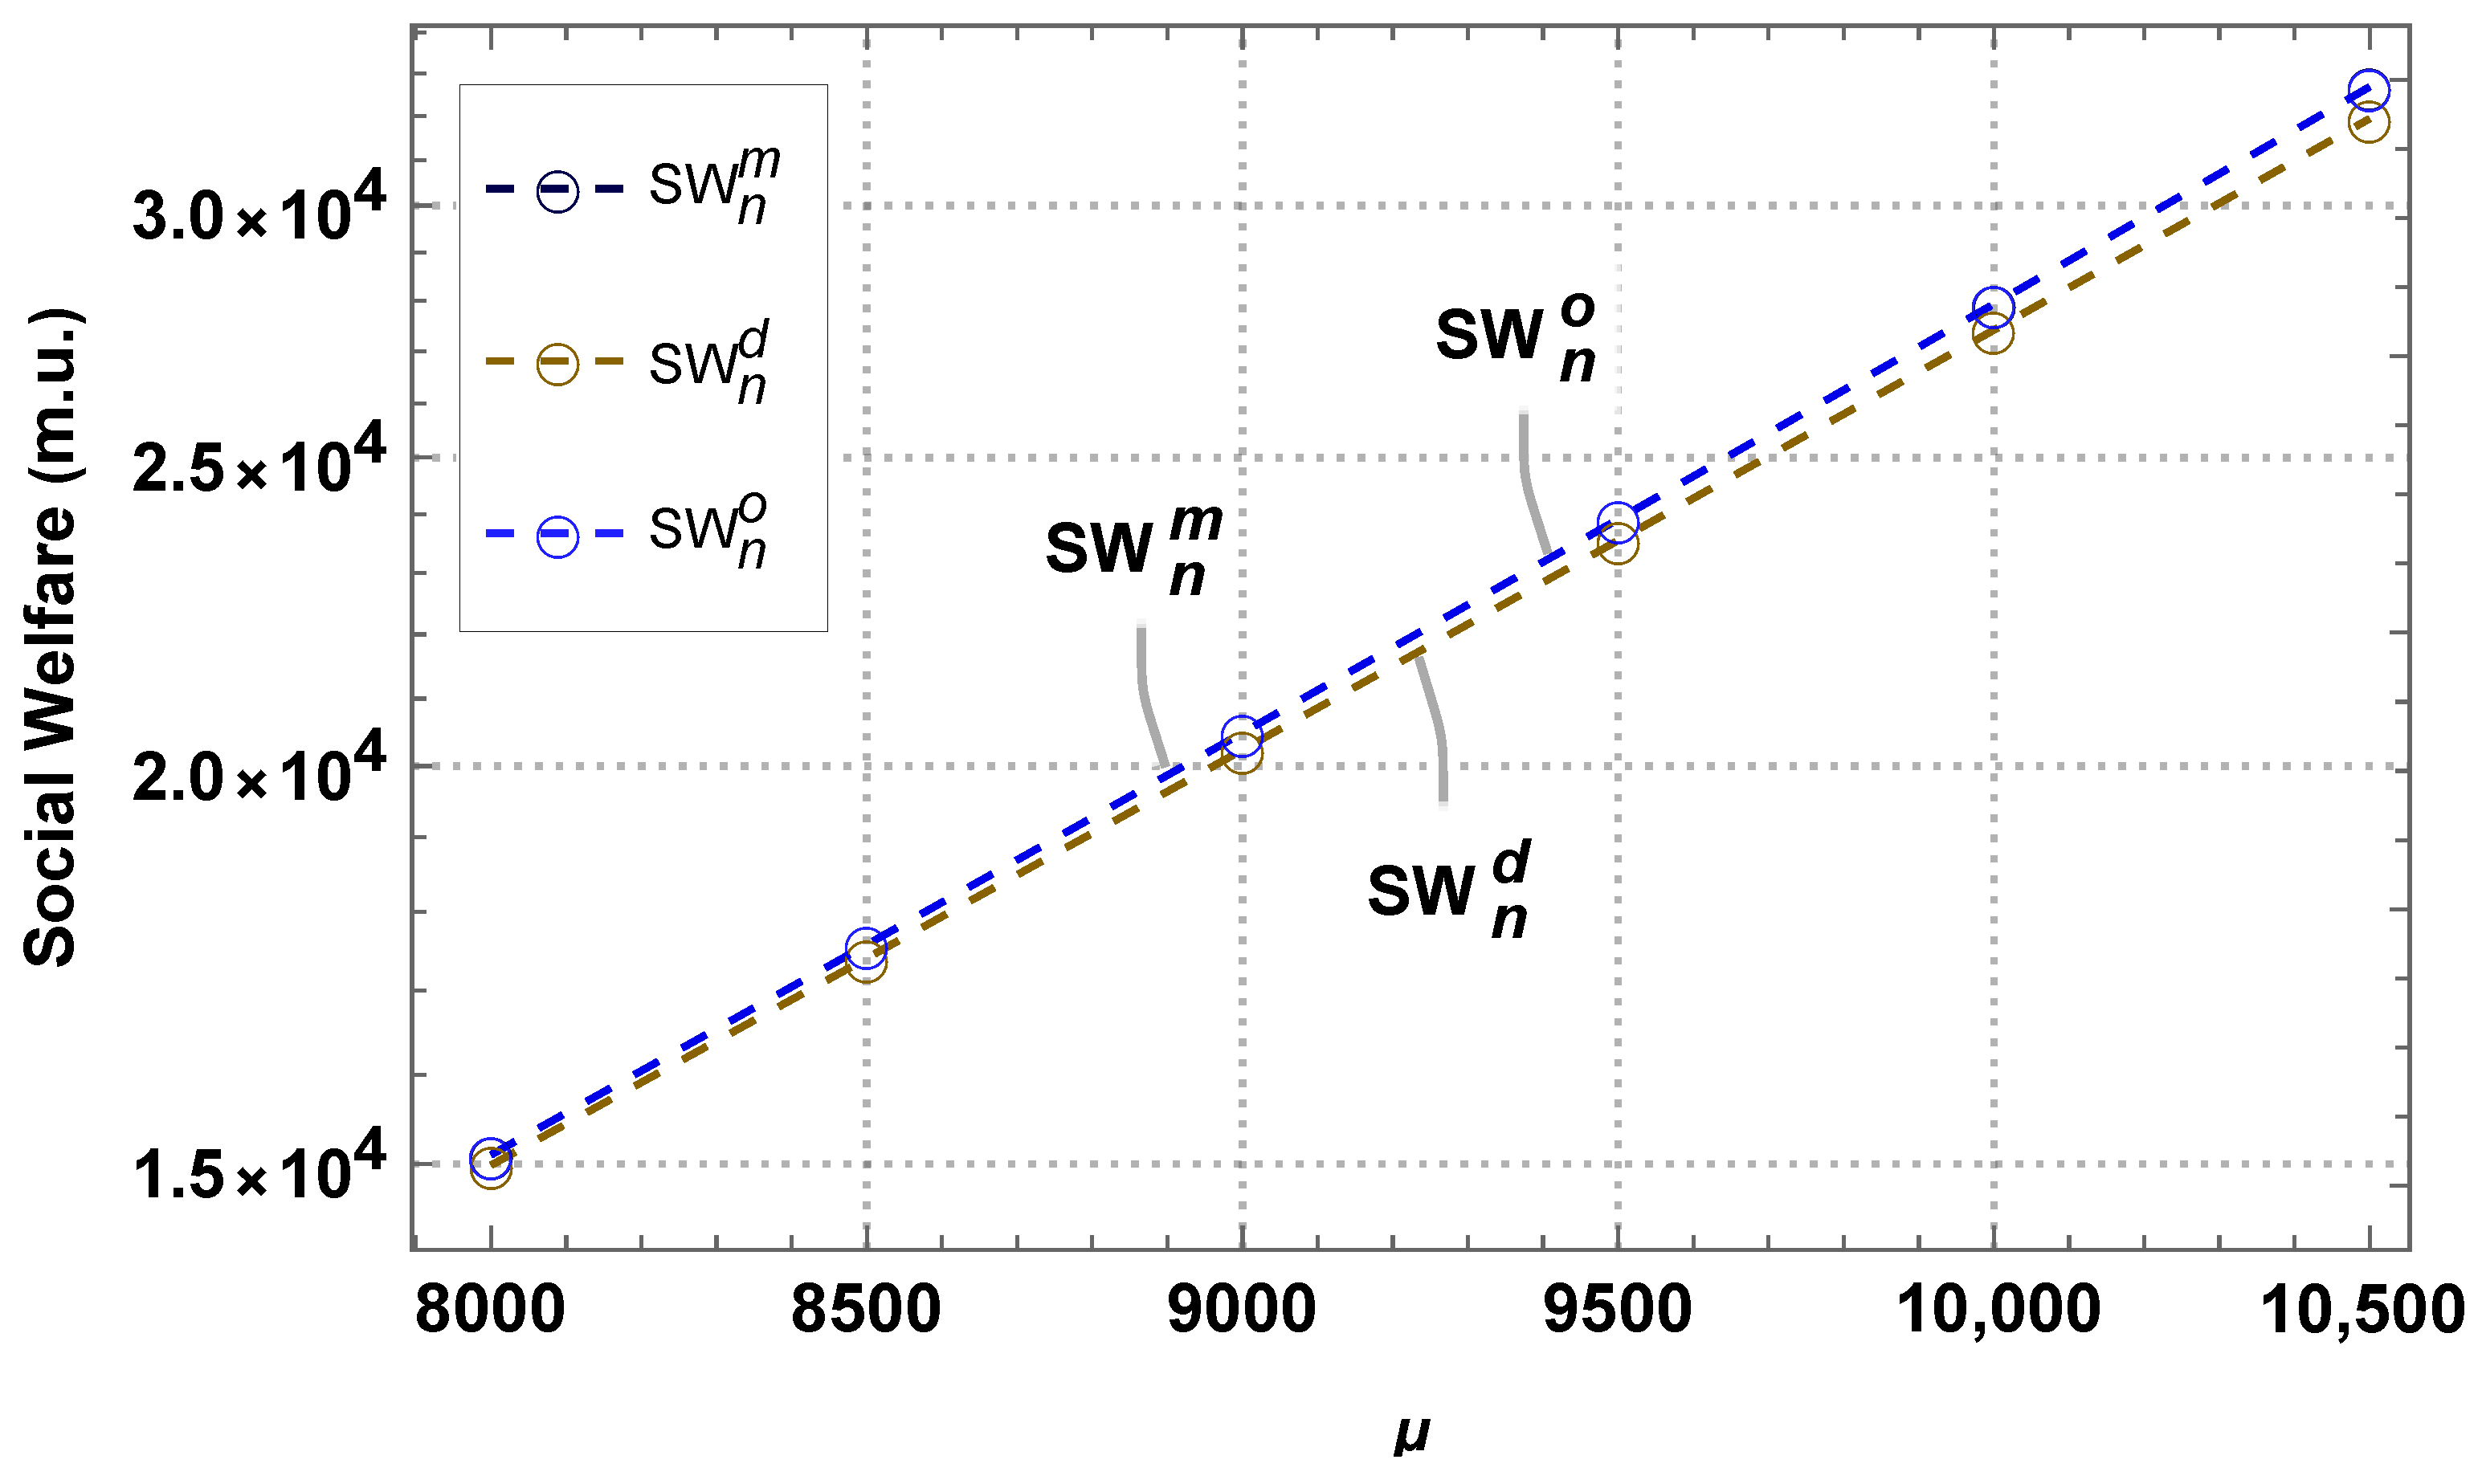
4.3. Comparison of Models in the NS Scenario

In this section, we compare the results obtained from the two business models, monopoly and duopoly, against the results from the social optimum model. Specifically, we discuss in terms of service prices, the number of subscribers per service, the operator’s profit, and social welfare. The discussion refers to the NS scenario since the duopoly only yielded results for this scenario.
The relationship between the service prices and the value of μ is shown in Figure 14. First, as μ increases, all prices increase. The prices offered in the duopoly are lower than those in the monopoly and social optimum models. And, the prices in the monopoly model are similar to those in the social optimum model, i.e., p u n o = p u n m > p u n d and p m n o = p m n m > p m n d .
Figure 15 shows a comparison of the number of subscribers. We can see that the numbers of URLLC and mMTC subscribers in the duopoly model, n u n d and n m n d , are higher compared to those in the social optimum model, n u n o and n m n o , which are similar to the results from the monopoly model, n u n m and n m n m .
Figure 16 shows a comparison of the profits, and we can see that all profits increase as μ increases. Furthermore, the results show that Π n m is equal to Π n o and greater than Π n d .
Finally, as shown in Figure 17, S W n o is larger than S W n d , whereas S W n m is equal to S W n o . This indicates that a monopoly is the most efficient way to provide URLLC and mMTC services in the NS scenario.
The fact that S W n o is equal to S W n m suggests that the monopolist operator is not exercising its market power to increase its profits, and therefore, there is no welfare deadweight loss. One possible reason for this is that the monopolist operator is practicing price discrimination to some extent. Through price discrimination, the monopolist operator charges higher prices to URLLC users who are willing to pay more and lower prices to mMTC users who are willing to pay less. This allows the monopolist operator to generate higher profits without reducing the overall social welfare.
Based on all the results, we conclude that the NS scenario is more favorable compared to the SN scenario, i.e., the best option is for a single operator to offer URLLC and mMTC services over a 5G network with network slicing. This conclusion is supported because the results obtained from the monopoly model in terms of the service price, operator profit, and social welfare are similar to those obtained from the social optimum model, indicating that the provision of URLLC and mMTC services through network slicing leads to better results for both users and operators.

5. Conclusions

This paper investigates and analyzes two business and network models for the provision of URLLC and mMTC services utilizing a common network infrastructure. Regarding the business models, in the monopoly model, only one network operator provides both URLLC and mMTC services, whereas in the duopoly model, two operators provide one service each. In addition, we analyze the feasibility and profitability of both models from the perspective of all actors involved. Regarding the network models, two 5G network scenarios for sharing network resources are analyzed. In the 5G network without network slicing (the SN scenario), network resources are shared between URLLC and mMTC services without service priority. In the 5G network with network slicing (the NS scenario), network resources are shared between URLLC and mMTC services with service priority, with high priority for the URLLC service.
Based on the results, which show the functioning of each model, we conclude that the best option from a social welfare point of view is for a single operator to offer both URLLC and mMTC services over a 5G network with network slicing. This conclusion is supported by the similarity of the results from both the monopoly (service price, operator profit, and social welfare) and social optimum models, indicating better outcomes for both users and operators.
Overall, this article provides a detailed and rigorous analysis of business models for the provision of critical and high-speed communication services over 5G networks, thereby making a significant contribution to this field. Also, these findings could have important implications for decision making when designing and managing services in telecommunication network environments. An open question for future research could be to assess the economic viability of network operators providing services such as URLLC, eMBB, and mMTC and compare the findings of this study with current market data.

Author Contributions

Conceptualization, L.G.; Validation, L.G.; Formal analysis, E.M.-C. and L.G.; Investigation, E.M.-C. and L.G.; Writing—original draft, E.M.-C.; Writing—-review and editing, L.G. and E.M.-C. All authors have read and agreed to the published version of the manuscript.

Funding

This work received support from various sources, including Grant PID2021-123168NB-I00 funded by MCIN/AEI, Spain/10.13039/501100011033; the European Union’s A way of making Europe/ERDF, Grant TED2021-131387B-I00 funded by MCIN/AEI, Spain/10.13039/501100011033; the European Union’s NextGenerationEU/RTRP; and Grant AICO/2021/138 funded by the Generalitat Valenciana, Spain. This work was also partially financed by the Government of Peru through the Bicentennial Generation Scholarship granted to the first author.

Data Availability Statement

Data are contained within the article.

Conflicts of Interest

The authors declare no potential conflict of interest.

References

  1. Banda, L.; Mzyece, M.; Mekuria, F. 5G Business Models for Mobile Network Operators—A Survey. IEEE Access 2022, 10, 94851–94886. [Google Scholar] [CrossRef]
  2. Yang, W.; Li, C.P.; Fakoorian, A.; Hosseini, K.; Chen, W. Dynamic URLLC and eMBB multiplexing design in 5G new radio. In Proceedings of the 2020 IEEE 17th Annual Consumer Communications & Networking Conference (CCNC), Las Vegas, NV, USA, 10–13 January 2020; pp. 1–5. [Google Scholar]
  3. Aranda, J.; Sacoto Cabrera, E.J.; Haro Mendoza, D.; Astudillo Salinas, F. 5G networks: A review from the perspectives of architecture, business models, cybersecurity, and research developments. Novasinergia 2021, 4, 6–49. [Google Scholar]
  4. Miladić-Tešić, S.; Marković, G.; Peraković, D.; Cvitić, I. A review of optical networking technologies supporting 5G communication infrastructure. Wirel. Netw. 2022, 28, 459–467. [Google Scholar] [CrossRef]
  5. Popovski, P.; Trillingsgaard, K.F.; Simeone, O.; Durisi, G. 5G wireless network slicing for eMBB, URLLC, and mMTC: A communication-theoretic view. IEEE Access 2018, 6, 55765–55779. [Google Scholar] [CrossRef]
  6. Xiang, W.; Zheng, K.; Shen, X.S. 5G Mobile Communications; Springer: London, UK, 2016. [Google Scholar]
  7. Chen, W.E.; Fan, X.Y.; Chen, L.X. A CNN-based Packet Classification of eMBB, mMTC and URLLC Applications for 5G. In Proceedings of the 2019 International Conference on Intelligent Computing and Its Emerging Applications (ICEA), Tainan, Taiwan, 30 August–1 September 2019; pp. 140–145. [Google Scholar]
  8. Pokhrel, S.R.; Ding, J.; Park, J.; Park, O.S.; Choi, J. Towards enabling critical mMTC: A review of URLLC within mMTC. IEEE Access 2020, 8, 131796–131813. [Google Scholar] [CrossRef]
  9. Le, T.K.; Salim, U.; Kaltenberger, F. An overview of physical layer design for Ultra-Reliable Low-Latency Communications in 3GPP Releases 15, 16, and 17. IEEE Access 2020, 9, 433–444. [Google Scholar] [CrossRef]
  10. Li, Z.; Uusitalo, M.A.; Shariatmadari, H.; Singh, B. 5G URLLC: Design challenges and system concepts. In Proceedings of the 2018 15th International Symposium on Wireless Communication Systems (ISWCS), Lisbon, Portugal, 28–31 August 2018; pp. 1–6. [Google Scholar]
  11. Nwakanma, C.I.; Anantha, A.P.; Islam, F.B.; Lee, J.M.; Kim, D.S. 3GPP release-16 for industrial Internet of Things and mission critical communications. In Proceedings of the 2020 International Conference on Information and Communication Technology Convergence (ICTC), Jeju, Republic of Korea, 21–23 October 2020; pp. 403–406. [Google Scholar]
  12. Nwadiugwu, W.P.; Nwakanma, C.I.; Lee, J.M.; Kim, D.S. Achieving reliable URLLC-based network in industrial and military embedded systems. In Proceedings of the 2019 International Conference on Information and Communication Technology Convergence (ICTC), Jeju, Republic of Korea, 16–18 October 2019; pp. 642–645. [Google Scholar]
  13. Foukas, X.; Patounas, G.; Elmokashfi, A.; Marina, M.K. Network slicing in 5G: Survey and challenges. IEEE Commun. Mag. 2017, 55, 94–100. [Google Scholar] [CrossRef]
  14. Osborne, M.J. An Introduction to Game Theory; Oxford University Press: New York, NY, USA, 2004; Volume 3. [Google Scholar]
  15. Antoniou, J. Game Theory, the Internet of Things and 5G Networks; Springer: London, UK, 2020. [Google Scholar]
  16. Guijarro, L.; Pla, V.; Vidal, J.R.; Naldi, M. Competition in data-based service provision: Nash equilibrium characterization. Future Gener. Comput. Syst. 2019, 96, 35–50. [Google Scholar] [CrossRef]
  17. Dhanare, R.; Nagwanshi, K.K.; Varma, S. A Study to Enhance the Route Optimization Algorithm for the Internet of Vehicle. Wirel. Commun. Mob. Comput. 2022, 2022, 1453187. [Google Scholar] [CrossRef]
  18. Yan, X.; Huang, C.; Gan, J.; Wu, X. Game Theory-Based Energy-Efficient Clustering Algorithm for Wireless Sensor Networks. Sensors 2022, 22, 478. [Google Scholar] [CrossRef]
  19. Sadreddini, Z.; Masek, P.; Cavdar, T.; Ometov, A.; Hosek, J.; Gudkova, I.; Andreev, S. Dynamic resource sharing in 5G with LSA: Criteria-based management framework. Wirel. Commun. Mob. Comput. 2018, 2018, 7302025. [Google Scholar] [CrossRef]
  20. Khan, L.U.; Yaqoob, I.; Tran, N.H.; Han, Z.; Hong, C.S. Network slicing: Recent advances, taxonomy, requirements, and open research challenges. IEEE Access 2020, 8, 36009–36028. [Google Scholar] [CrossRef]
  21. Wong, S.; Han, B.; Schotten, H.D. 5G Network Slice Isolation. Network 2022, 2, 153–167. [Google Scholar] [CrossRef]
  22. Alliance, N. 5G Mobile Network Sharing Security 2022. Available online: https://www.ngmn.org/wp-content/uploads/221026-NGMN-5G-Mobile-Network-Sharing-Security-v1.02-2.pdf (accessed on 1 May 2023).
  23. Samdanis, K.; Costa-Perez, X.; Sciancalepore, V. From network sharing to multi-tenancy: The 5G network slice broker. IEEE Commun. Mag. 2016, 54, 32–39. [Google Scholar] [CrossRef]
  24. Allon, G.; Federgruen, A. Service competition with general queueing facilities. Oper. Res. 2008, 56, 827–849. [Google Scholar] [CrossRef]
  25. Smail, G.; Weijia, J. Techno-economic analysis and prediction for the deployment of 5G mobile network. In Proceedings of the 2017 20th Conference on Innovations in Clouds, Internet and Networks (ICIN), Paris, France, 7–9 March 2017; pp. 9–16. [Google Scholar]
  26. Stojanović, M. Monetization and pricing of the 5G-enabled smart residential services. E-Bus. Technol. Conf. Proc. 2022, 2, 70–73. [Google Scholar]
  27. Li, X.; Samaka, M.; Chan, H.A.; Bhamare, D.; Gupta, L.; Guo, C.; Jain, R. Network slicing for 5G: Challenges and opportunities. IEEE Internet Comput. 2017, 21, 20–27. [Google Scholar] [CrossRef]
  28. Mendelson, H. Pricing computer services: Queueing effects. Commun. ACM 1985, 28, 312–321. [Google Scholar] [CrossRef]
  29. Hayel, Y.; Ros, D.; Tuffin, B. Less-than-best-effort services: Pricing and scheduling. In Proceedings of the IEEE INFOCOM 2004, Hong Kong, China, 7–11 March 2004; Volume 1. [Google Scholar]
  30. Sacoto Cabrera, E.J.; Guijarro, L.; Maillé, P. Game Theoretical Analysis of a Multi-MNO MVNO Business Model in 5G Networks. Electronics 2020, 9, 933. [Google Scholar] [CrossRef]
  31. Guijarro, L.; Pla, V.; Tuffin, B. Entry game under opportunistic access in cognitive radio networks: A priority queue model. In Proceedings of the 2013 IFIP Wireless Days (WD), Valencia, Spain, 13–15 November 2013; pp. 1–6. [Google Scholar]
  32. Han, B.; Tayade, S.; Schotten, H.D. Modeling profit of sliced 5G networks for advanced network resource management and slice implementation. In Proceedings of the 2017 IEEE Symposium on Computers and Communications (ISCC), Heraklion, Greece, 3–6 July 2017; pp. 576–581. [Google Scholar]
  33. Han, B.; Feng, D.; Ji, L.; Schotten, H.D. A profit-maximizing strategy of network resource management for 5G tenant slices. arXiv 2017, arXiv:1709.09229. [Google Scholar]
  34. Sacoto-Cabrera, E.J.; Sanchis-Cano, A.; Guijarro, L.; Vidal, J.R.; Pla, V. Strategic interaction between operators in the context of spectrum sharing for 5G networks. Wirel. Commun. Mob. Comput. 2018, 2018, 4308913. [Google Scholar] [CrossRef]
  35. Sanchis-Cano, A.; Guijarro, L.; Pla, V.; Vidal, J.R. Economic viability of HTC and MTC service provision on a common network infrastructure. In Proceedings of the 2017 14th IEEE Annual Consumer Communications & Networking Conference (CCNC), Las Vegas, NV, USA, 8–11 January 2017; pp. 1044–1050. [Google Scholar]
  36. Sacoto-Cabrera, E.J.; Guijarro, L.; Vidal, J.R.; Pla, V. Economic feasibility of virtual operators in 5G via network slicing. Future Gener. Comput. Syst. 2020, 109, 172–187. [Google Scholar] [CrossRef]
  37. Cohen, M.F. An Introduction to Logic and Scientific Method; Read Books Ltd.: Redditch, UK, 2011. [Google Scholar]
  38. Afolabi, I.; Taleb, T.; Samdanis, K.; Ksentini, A.; Flinck, H. Network slicing and softwarization: A survey on principles, enabling technologies, and solutions. IEEE Commun. Surv. Tutor. 2018, 20, 2429–2453. [Google Scholar] [CrossRef]
  39. Pardalos, P.M.; Rassias, T.M.; Khan, A.A. Nonlinear Analysis and Variational Problems; Springer: New York, NY, USA, 2010. [Google Scholar]
  40. Hassin, R.; Haviv, M. To Queue or Not to Queue: Equilibrium Behavior in Queueing Systems; Springer: Luxembourg, 2003; Volume 59. [Google Scholar]
  41. Maillé, P.; Tuffin, B. Telecommunication Network Economics: From Theory to Applications; Cambridge University Press: Cambridge, UK, 2014. [Google Scholar]
  42. Papoulis, A.; Unnikrishna Pillai, S. Probability, Random Variables and Stochastic Processes; McGraw-Hill: Boston, MA, USA, 2002. [Google Scholar]
  43. Maschler, M.; Zamir, S.; Solan, E. Game Theory; Cambridge University Press: Cambridge, UK, 2020. [Google Scholar]
  44. Anand, A.; De Veciana, G.; Shakkottai, S. Joint scheduling of URLLC and eMBB traffic in 5G wireless networks. IEEE/ACM Trans. Netw. 2020, 28, 477–490. [Google Scholar] [CrossRef]
Figure 1. Business models and scenarios.
Electronics 12 04994 g001
Figure 2. Specific notations.
Electronics 12 04994 g002
Figure 3. System model: URLLC and mMTC users mean arrival rate ( λ u , λ m ), network capacity utilization factor ( α ), network capacity ( μ ), price charged by URLLC and mMTC services ( p u j , p m j ), network traffic flow (⟶).
Electronics 12 04994 g003
Figure 4. Description of the stages of the game.
Electronics 12 04994 g004
Figure 5. S W s in the SN scenario.
Electronics 12 04994 g005
Figure 6. S W n in the NS scenario.
Electronics 12 04994 g006
Figure 7. Wardrop equilibrium regions in the SN scenario for k u = 1, k m = 0.00004, μ = 8000 packets/s, α = 0.95, ϵ u = 0.00030 s, ϵ m = 0.00045 s, λ u = 1 packet/s, λ m = 0.00013 packet/s.
Electronics 12 04994 g007
Figure 8. Wardrop equilibrium regions in the NS scenario for k u = 1, k m = 0.00004, μ = 8000 packets/s, α = 0.95, ϵ u = 0.00030 s, ϵ m = 0.00045 s, λ u = 1 packet/s, λ m = 0.00013 packet/s.
Electronics 12 04994 g008
Figure 9. Best responses (BRs) in the SN scenario.
Electronics 12 04994 g009
Figure 10. Best responses (BRs) in the NS scenario.
Electronics 12 04994 g010
Figure 11. Prices of URLLC and mMTC services as functions of μ (monopoly).
Electronics 12 04994 g011
Figure 12. Numbers of URLLC and mMTC subscribers as functions of μ , where n m s m = 0 (monopoly).
Electronics 12 04994 g012
Figure 13. Total profit as a function of μ (monopoly).
Electronics 12 04994 g013
Figure 14. Price as a function of μ (NS scenario).
Electronics 12 04994 g014
Figure 15. Number of subscribers as a function of μ (NS scenario).
Electronics 12 04994 g015
Figure 16. Total profit as a function of μ (NS scenario).
Electronics 12 04994 g016
Figure 17. Social welfare as a function of μ (NS scenario).
Electronics 12 04994 g017
Table 1. General notation.
DescriptionNotationEquation
URLLC user utility in scenario j U u j (5)
mMTC user utility in scenario j U m j (6)
URLLC QoS over scenario j Q u j (1), (3)
mMTC QoS over scenario j Q m j (2), (4)
Delay threshold for URLLC service ϵ u (1)
Delay threshold for mMTC service ϵ m (2)
Number of URLLC users in scenario j for business model i n u j i -
Number of mMTC users in scenario j for business model i n m j i -
Conversion factor for URLLC service k u (1)
Conversion factor for mMTC service k m (2)
Mean service rate μ (1)
Network capacity utilization factor α (10)
Individual arrival rate of URLLC packets in the system λ u (1)
Individual arrival rate of mMTC packets in the system λ m (2)
Price of URLLC service in scenario j for business model i p u j i -
Price of mMTC service in scenario j for business model i p m j i -
Best response from the URLLC operator B R u (15)
Best response from the mMTC operator B R m (16)
Profit obtained by URLLC service in scenario j Π u j i (8)
Profit obtained by mMTC service in scenario j Π m j i (9)
Total benefit of business model i in scenario j Π j i (7)
Social welfare in scenario j for business model i S W j i (21)
Table 2. Wardrop equilibrium of user subscriptions in the SN scenario.
Reg. n us n ms p us p ms
a 1 2 λ u μ 1 ϵ u ln p u s k u 1 2 λ m μ 1 ϵ m ln p m s k m (46), (48)(47), (49)
b0 1 λ u μ 1 ϵ u ln p u s k u k u p m s k m ϵ u ϵ m < p u s k m e ϵ m μ ( 1 α ) p m s < k m e ϵ m μ
c 1 λ u μ 1 ϵ u ln p u s k u 0 k u e ϵ u μ ( 1 α ) p u s < k u e ϵ u μ k m p u s k u ϵ m ϵ u < p m s
d00 k u e ϵ u μ p u s k m e ϵ m μ p m s
Table 3. Wardrop equilibrium of user subscriptions in the NS scenario.
Reg. n un n mn p un p mn
a 1 λ u μ 1 ϵ u ln p u n k u 1 ϵ u λ m ln p u n k u ϵ u μ ln p m n k m ϵ m λ m ln p u n k u k u < p u n k u e ϵ u μ (65)
b0 1 λ m μ 1 ϵ m ln p m n k m k u e ϵ u μ < p u n k m e ϵ m ( 1 α ) μ p m n < k m e ϵ m μ
c 1 λ u μ 1 ϵ u ln p u n k u 0 k u e ϵ u μ ( 1 α ) p u n < k u e ϵ u μ k m e ϵ m ϵ u 2 μ ln p u n k u 2 < p m n
d00 k u e ϵ u μ p u n k m e ϵ m μ p m n
Table 4. Parameter values.
ParameterValue
k u 1
k m 0.00004
μ 8000 packets/s
α 0.95
ϵ u 0.00030 s
ϵ m 0.00045 s
λ u 1 packets/s
λ m 0.00013 packets/s
Disclaimer/Publisher’s Note: The statements, opinions and data contained in all publications are solely those of the individual author(s) and contributor(s) and not of MDPI and/or the editor(s). MDPI and/or the editor(s) disclaim responsibility for any injury to people or property resulting from any ideas, methods, instructions or products referred to in the content.

