Article

FPGA/AI-Powered Architecture for Anomaly Network Intrusion Detection Systems

by
Cuong Pham-Quoc
1,2,*,
Tran Hoang Quoc Bao
1,2 and
Tran Ngoc Thinh
1,2
1
Computer Engineering Department, Ho Chi Minh City University of Technology (HCMUT), 268 Ly Thuong Kiet Street, District 10, Ho Chi Minh City 72506, Vietnam
2
Computer Engineering Department, Vietnam National University Ho Chi Minh City, Thu Duc, Ho Chi Minh City 700000, Vietnam
*
Author to whom correspondence should be addressed.
Electronics 2023, 12(3), 668; https://doi.org/10.3390/electronics12030668
Submission received: 7 January 2023 / Revised: 25 January 2023 / Accepted: 26 January 2023 / Published: 29 January 2023

Abstract

:
This paper proposes an architecture to develop machine learning/deep learning models for anomaly network intrusion detection systems on reconfigurable computing platforms. We build two models to validate the framework: Anomaly Detection Autoencoder (ADA) and Artificial Neural Classification (ANC) in the NetFPGA-sume platform. Three published data sets NSL-KDD, UNSW-NB15, and CIC-IDS2017 are used to test the deployed models’ throughput, latency, and accuracy. Experimental results with the NetFPGA-SUME show that the ADA model uses 20.97% LUTs, 15.16% FFs, 19.42% BRAM, and 6.81% DSP while the ANC model requires 21.39% LUTs, 15.19% FFS, 14.59% BRAM, and 3.67% DSP. ADA and ANC achieve a bandwidth of up to 28.7 Gbps and 34.74 Gbps, respectively. In terms of throughput, ADA can process at up to 18.7 Gops, while ADA can offer 10 Gops with different datasets. With the NSL-KDD dataset, the ADA model achieves 90.87% accuracy and a false negative rate of 4.86%. The ANC model with UNSW-NB15 and CIC-IDS2017 obtains accuracy of 87.49% and 98.22%, respectively, with the false negative rates achieving 2.0% and 6.2%, respectively.

1. Introduction

During the past years, the number of devices connected to the internet has increased dramatically with the rapid increase in data volume over the internet. For example, researchers in [1] predict that up to 25 billion IoT devices will be connected to the internet in 2030. However, along with this fast development, many network attacks for various purposes, especially DoS/DDoS, have also increased in recent years. Therefore, the need for flexible and robust network intrusion detection systems (NIDS) is an essential demand.
In NIDS, two well-known approaches, pattern-based (signature-based) and anomaly-based, have been exploited for the most modern NIDS systems. Although pattern-based NIDS approaches provide high-throughput and high accuracy rate [2], they suffer from inflexibility, data storage for attacking rules, and processing overhead for extracting rules, especially when the number of stored patterns becomes large and is frequently updated. Meanwhile, with the impressive achievements in deep learning, the anomaly-based approach, which mainly relies on deep neural networks (DNN), offers more advantages than the signature-based one, e.g., it efficiently prevents unknown attack types and does not require massive storage resources [3].
Moreover, during the past years, researchers have shown the success of DNN development on FPGA [4]. As a successful implementation, FPGA-based DNN for the inference stage is currently attracting more and more studies [5]. Therefore, this platform is also a good candidate for exploiting an anomaly-based NIDS due to its high performance through parallelism computation of FPGA devices. Hence, this paper focuses on designing an FPGA-based architecture for deploying NIDS systems that can detect and classify anomalous data by applying neural network models. The main contributions of our article include three primary folds:
  • We propose an FPGA-based architecture to deploy neural network models for anomaly-based NIDS systems. The ultimate goal of the architecture is to achieve high performance and accuracy.
  • We present the implementation of two neural network models, the Anomaly Detection Autoencoder (ADA) and Artificial Neural Classification (ANC), for detecting different attacks on the proposed architecture to verify. While the NSL-KDD dataset accompanies the ADA model, the ANC is built based on the UNSW-NB15 and CIC-IDS2017 datasets. The three datasets exploited in this research are used by most NIDS research in the literature.
  • We conduct experiments with the proposed architecture and the implemented models to compare with related work in the literature. Our results can be used as references for other studies and help designers choose a suitable model for a dataset or attack types.
The rest of the paper is organized as follows. First, the necessary background information and related work in our study field are presented in Section 2. Then, we discuss our proposed architecture for deploying DNN-based NIDS systems in Section 3. Next, Section 4 introduces our NIDS implementation with two neural network models, ADA and ANC. Next, Section 5 describes the experimental results of our system and compares them with other related work in the literature. Finally, we conclude our paper in Section 6.

2. Background and Related Work

In this section, we first present intrusion detection systems and approaches used for protecting networks. Secondly, we summarize datasets used in the literature for the NIDS research direction. Finally, we survey related work published in recent years in the literature.

2.1. Network Intrusion Detection Systems

Network Intrusion Detection Systems (NIDS) [6] are comprehensive systems for identifying malicious threats through monitoring network traffic and analyzing behaviors of network packets to reduce hazards and secure target networks. Based on the volume of the dangers, NIDS can respond by alerting administrators or blocking network access. The two primary categorization techniques of the NIDS are signature-based and anomaly-based. While the signature-based approach performs detection using previous knowledge or collected abnormal behaviors, the anomaly-based strategy utilizes normal activities for classifying anomaly behaviors. One of the methods used for anomaly detection that many studies have recently applied is machine learning/deep learning. Applying machine learning/deep learning for NIDS can help systems quickly adapt to the constantly changing environment and cope with the potential risks of cyberattacks since administrators can train machine learning models from normal network activities to identify anomalous intrusions. Therefore, anomaly-based detection may produce significantly more false positives, generating many alarms in the monitoring system. However, this issue will be safe for protected systems because these alerts are not actual attacks.

2.2. Datasets

Research on abnormal intrusion detection has attracted more and more attention and effort. As a result, several data sets have been constructed to achieve research outcomes and protect real-world networks. The survey in [7] summarizes data sets published in the literature for this research field in recent years. The distribution of datasets used for intrusion detection systems research is depicted in Figure 1. According to the figure, the three most datasets used for training and testing are KDD Cup99, NSL-KDD, and UNSW-NB15. Although KDD Cup99 and NSL-KDD are pretty old compared to the others, they are used a lot in research for comparison. In contrast, the newly introduced datasets are updated with additional incursion features, especially for IoT, sensor nodes, and extensive data network processing systems. In this work, we use NSL-KDD, UNSW-NB15, and CIC-IDS2017 for training and testing our work because they are updated with new features and attacking types that are more suitable for our proposed approaches.

2.3. Related Work

This section summarizes state-of-the-art work on machine learning (ML) and deep learning (DL) NIDS systems. CART, C4.5, and ID3 algorithms [8] are three examples of the most popular machine learning models that use the decision tree (DT) approach for an intrusion detection system. Several models, including RF (Random Forest) [9], and XGBoost [10], have been used in studies to enhance the decision tree approach by mixing several decision trees. Research in [11] uses the KNN (K-Nearest Neighbor) algorithm to build a NIDS and compares it to other techniques with the CIC-IDS2018 dataset. The SVM (Support Vector Machine) technique, which is successful in accuracy when predicting usual features and harmful codes, is also integrated into NIDS in [12,13]. By using ANN (Artificial Neural Network) models, authors in [14] propose a variant of the neural network as FLN (Fast Learning Network).
Consequently, research in [15] has relied on this architecture to design an IDS system and tested it on the KDD-Cup99 dataset, which increases accuracy compared to the basic ANN architecture. Overcoming the neural network limitations, authors in [16] use ELM (Extreme Learning Machine) technique based on the ANN network architecture with only one hidden layer. Then, the work in [17] combines the ELM techniques (the ensemble method) to improve the learning ability with higher accuracy of NIDS. This research uses multiple datasets, including KDD-Cup99, NSL-KDD, and Kyoto, for training and testing the proposed method. In addition, research in [18] presents a combination of many algorithms, including DT, RF, KNN, and DNN, and uses the voting method to evaluate the classification ability of the NSL-KDD dataset.
RNN (Recurrent Neural Network) methods, particularly LSTM (Long Short-Term Memory) [19] and GRU (Gated Recurrent Unit) [20,21], are typical models of deep learning. Based on the NSL-KDD dataset, the study in [22] builds an experimental IDS using an RNN model. The hidden layer of this approach contains 80 nodes for the most optimized accuracy, while the binary learning rates for the case of multi-classes are 0.1 and 0.5. In [23], GRU is investigated using the multilayer perceptron and the softmax function with the KDD-Cup99 and NSL-KDD datasets. However, this approach is limited when identifying specific attack classes, such as U2R and R2L. The work in [24] builds an improved IDS for validation with the NSL-KDD dataset using the GPU platform and the LSTM method. AutoEncoder is a DL algorithm that is frequently used for unsupervised learning. Authors in [25] use this technique along with the Seq2Seq (Sequence-to-Sequence) model and two RNN architectures with various datasets (including Kyoto, UNSW-NB15, and CIC-IDS2017) for building their NIDS system. The study in [26] also examines the NSL-KDD and UNSW-NB15 datasets using the RNN model. The experimental results show the ability to identify novel attack types but with low working frequency. Combining the two techniques CNN and gcForest, to create the multiple IDS security layers proposed in [27] demonstrates the potential to increase accuracy with the UNSW-NB15 and CIC-IDS2017 datasets. Research in [28] also reports promising results with the UNSW-NB15 and NSL-KDD datasets when merging the CNN and LSTM models. The scale-hybrid-IDS-AlertNet framework [29] is employing the DNN approach to develop an IDS system targeting hosting servers and networks for adequate accuracy by combining various devices with the KDD-Cup99, NSL-KDD, Kyoto, UNSW-NB15, and CIC-IDS2017 datasets.
According to the study in [30], the authors propose DDoS detection system achieves an accuracy rate of 99.95% with the CAIDA dataset when implemented with Xilinx Virtex-5 FPGA device and convolution operators. Based on the reconfigurable technology, an ANN is used in [31] to identify attacks with an accuracy rate of 99.82%. To maximize the system performance, researchers in several approaches exploit the hardwaresoftware co-designs on various hardware accelerator platforms. For example, the study in [32] integrates a neural network on software with an FPGA for data preprocessing to identify attacks with an accuracy of more than 80%. Additionally, the study in [33,34] constructs neural networks with the NSL-KDD dataset on an FPGA platform to obtain an accuracy rate of 87.3% that, is better processing capacity than GPU and CPU. The main drawbacks of these works are the limitations of the neural networks on FPGA and the low overall processing bandwidth when compared with the other devices. Moreover, these approaches require a lot of hardware resources for building the systems.

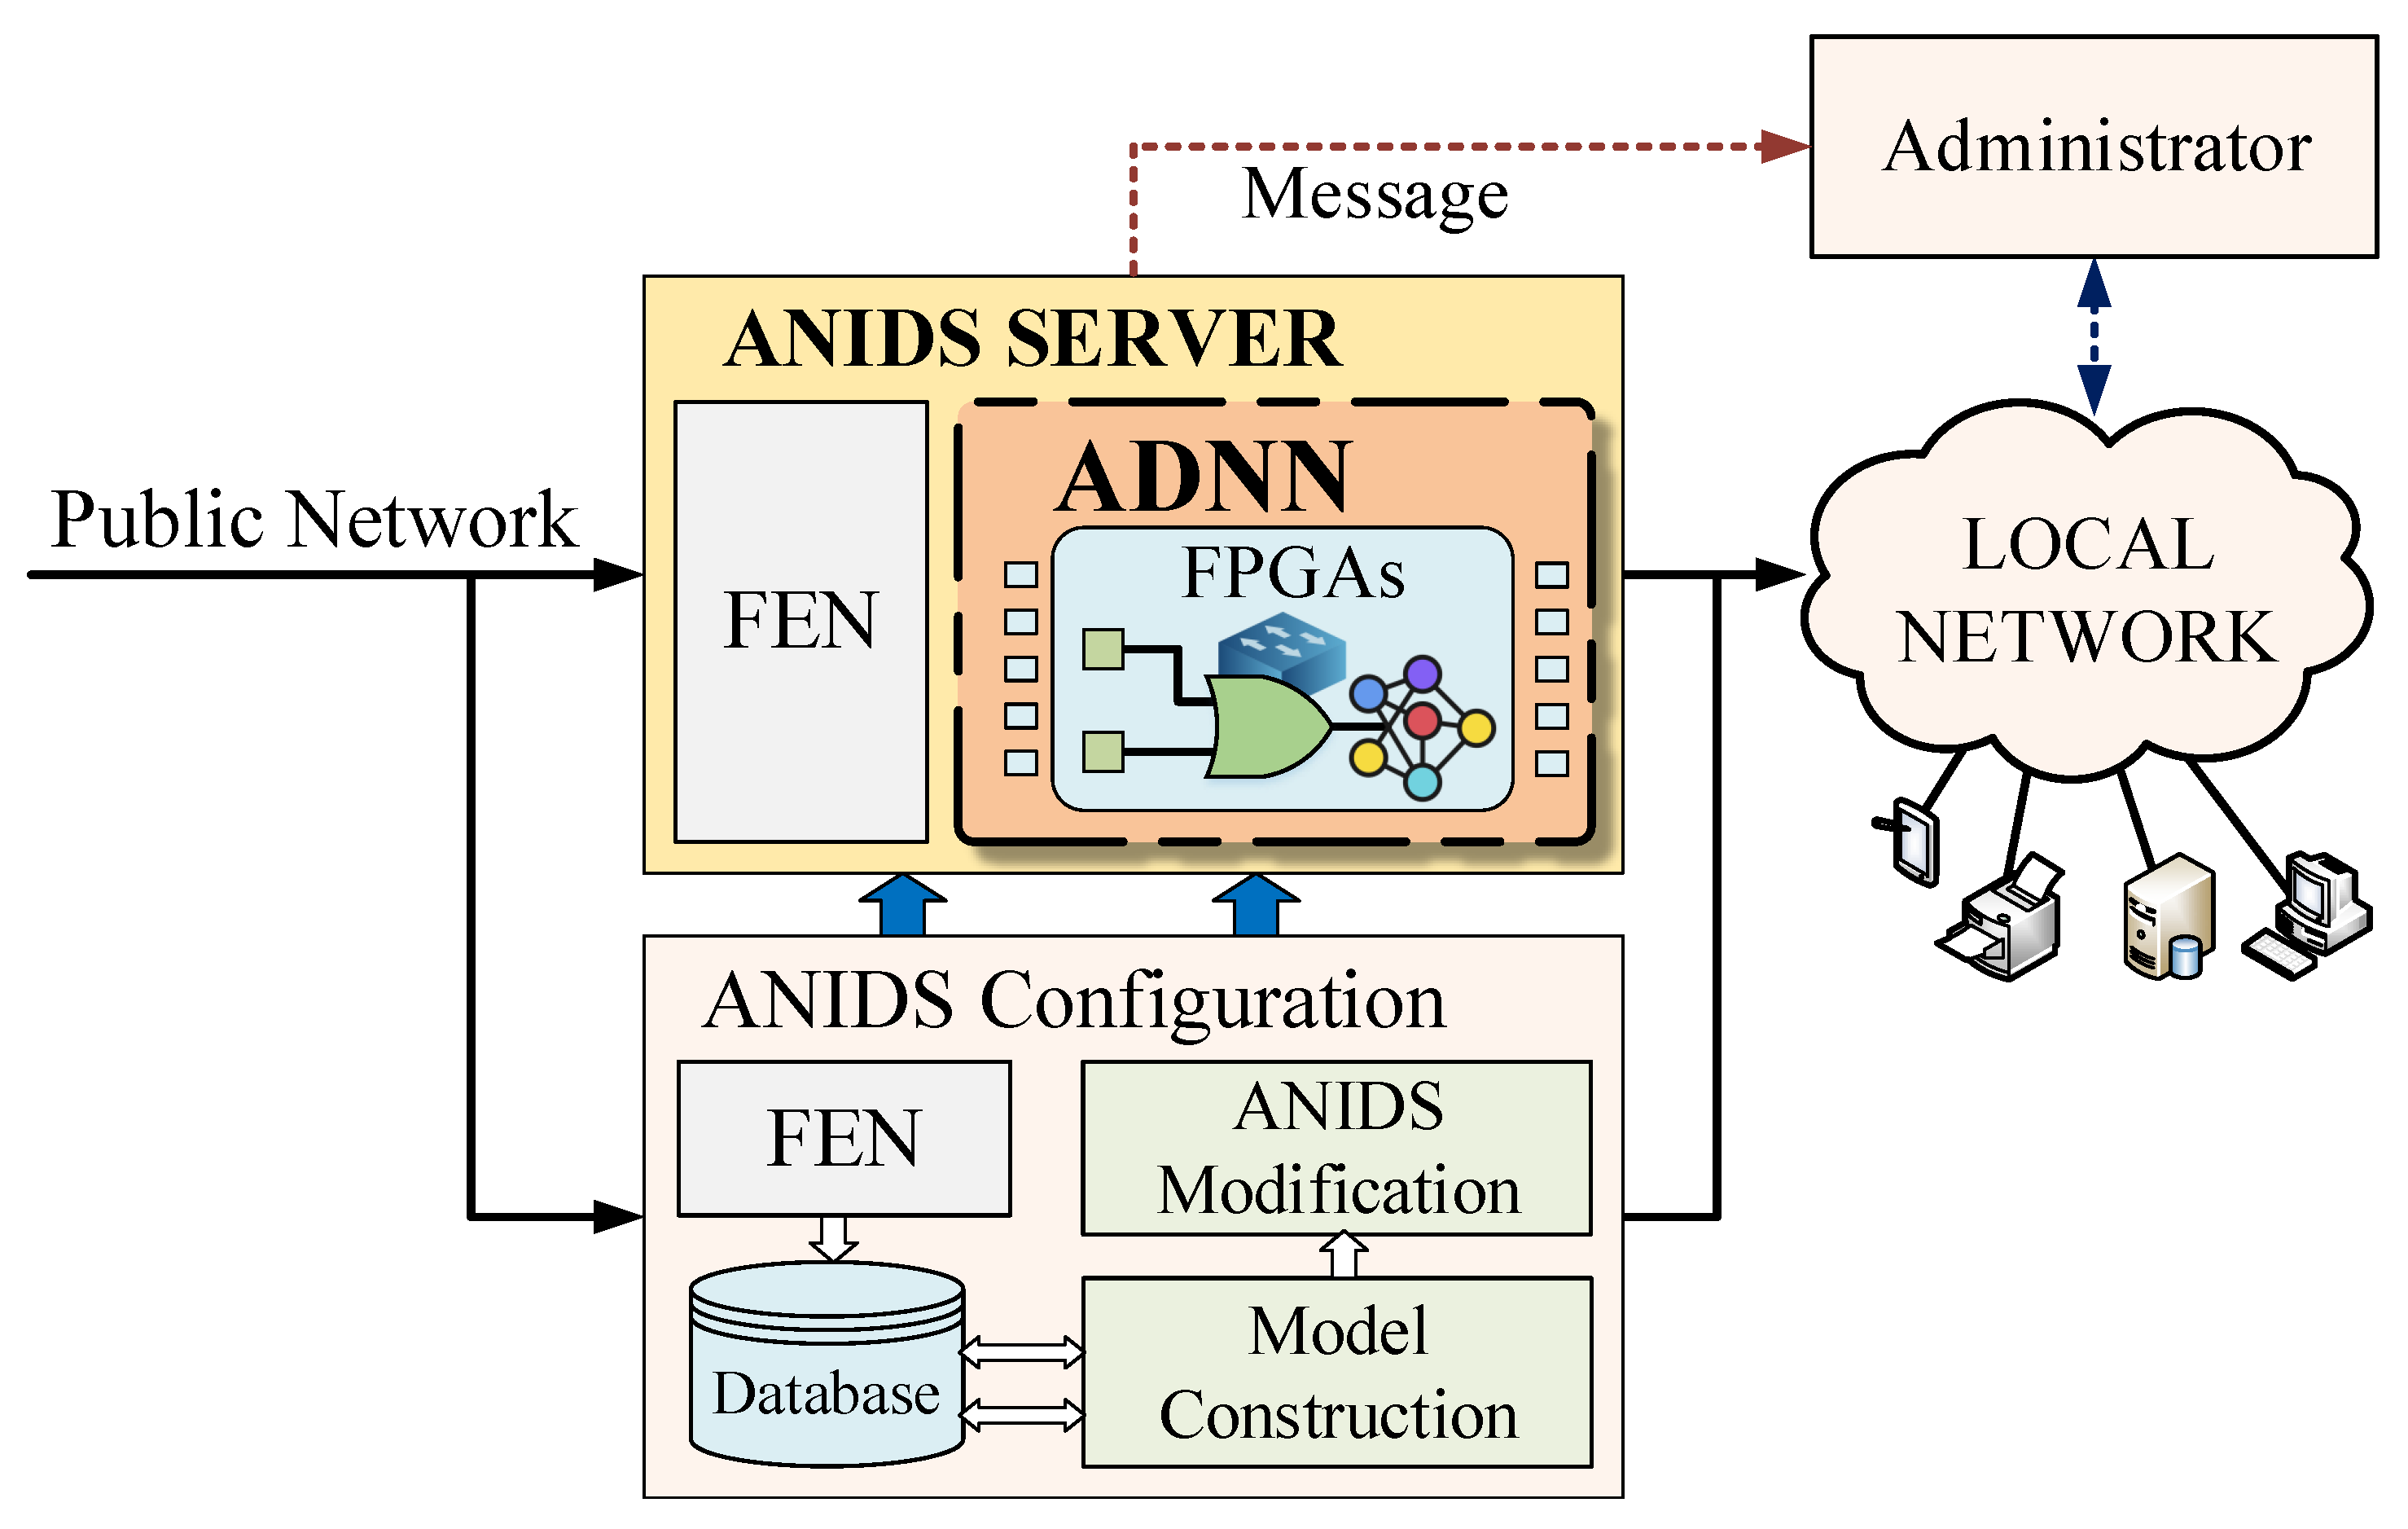
3. Proposed Architecture

In this section, we propose an architecture to build our anomaly network intrusion detection (ANIDS), called NIDS, on FPGA platforms. The NIDS system is located in the middle of the local (protected resources) and public networks. This structure allows the system to monitor network traffics and detect external intrusion behaviors to preserve the local resources (link, devices, etc.) from cyberattacks. The proposed NIDS architecture, as shown in Figure 2, is divided into two main components deployed on different platforms: ANIDS Server built on FPGA devices and ANIDS Configuration hosted by GPU or CPU. While the ANIDS Server is the main contribution of our work, the ANIDS Configuration includes software services executed on GPU or CPU. The primary purpose of this component is to support administrators and developers in customizing or updating neural network models in ANIDS Server. ANIDS Configuration includes the following main functions Feature Extraction and Normalization (FEN), Database, Model Construction, and ANIDS Modification. The main functionality of FEN is similar to FEN in ANIDS Server (explained later). Database, ANIDS modification, and Model Construction services are used for training and adjusting models for system improvement. The following sub-sections present in detail the organization of the proposed ANIDS Server and its main modules.

3.1. The ANIDS Server

ANIDS Server is responsible for investigating all network packets arriving at the system from public networks to counteract anomaly behaviors that may harm the local resources. The primary technique used to detect anomaly packets is deep learning. To deploy this ability, the ANIDS Server comprises two main modules, FEN (Feature Extraction & Normalization) and ADNN (Anomaly Detection Neural Networks).
Firstly, the FEN module receives and preprocesses raw network packets coming from public networks. The main functions of FEN are feature extraction, data transformation, and normalization. The feature extraction collects various features from network packets so that ANN models can classify the behaviors of the packets. Table 1 illustrates some standard features in most datasets. According to network protocols, those packets contain two primary components: the header and the payload. Due to the complex structure of the raw network data, deep learning models cannot directly categorize data without being standardized to a specific dimension. Therefore, the transformation and normalization steps in FEN will convert features into numbers in some range with particular techniques for further processing by deep learning models (both training and inference phases).
Secondly, the ADNN module hosts neural network models on FPGA fabrics for the inference phase to detect and classify anomaly attacks based on parameters generated by the FEN. This is the main contribution of our work. The following section presents a general architecture of the ADNN module.

3.2. Anomaly Detection Neural Networks

Figure 3 depicts the generic architecture of the ADNN module. The ADNN architecture is divided into several computational layers, including hidden and output. In addition, a Loss Function block will be integrated into the final layer depending on models for determining the final results of the computational layers. Finally, Outlier Detection decides whether the input data is abnormal or normal by comparing the calculated results of models with a threshold value.
The FPGA-based architecture of a computing layer is shown in Figure 4, including processing elements (PEs), Memory, Counter, and Activation Function (AF). The input of the first hidden layer is the features (x) of packets (one feature per cycle) and the parameter vector of the model ( W = ( w 1 , w 2 , , w n ) ). The next layer receives the output of the previous layer for further processing. Each PE in a layer, representing a neuron, processes input features (x) and a particular parameter value ( w i ). As shown in the figure, outputs of PEs are stored in Memory at a specific location managed by the Ring Counter register. All PEs in a layer execute in parallel. The Ring Counter register is used to control the results of PEs stored in Memory. A multiplexer, handled by the value of the Ring Counter, finally selects a result from Memory for AF. The final value of the AF block is the final result of a neural layer, which is denoted by Z. All of the layers in the model will be executed in a pipeline model.
Processing Element (PE), illustrated in Figure 5, conducts multiply–accumulate (MAC) operations, i.e., performing arithmetic multiplier and adder operators. Each PE is responsible for a neuron in one layer. At first, a product of an input feature (x) and a value of the weight vector ( w i ) is computed by the × block in Figure 5. Then, this product is added with the result of the previous cycle (product of another feature with the weight value), currently stored in the register (denoted by R in the figure). This addition’s result is saved to the register (R). Since each PE (a neuron) computes multiple MAC operators with several input features and the number of features x may vary for various datasets, a Counter input value (representing how many features have been processed) and N (describing the total number of features) are required for handling PEs. Finally, the comparator circuit (denoted by = in Figure 5) will inspect the Counter and N values to activate the reset signal when they are equal. Once all input features x and the weight vector W have been completely computed, the reset signal will be triggered to stop accumulating and start adding the bias. This results in the MAC operation output denoted by Y and will be stored in Memory for further processing by the activation function.
Figure 6 depicts the architecture of the Loss Function block and its operations. In this work, we choose Mean Square Error (MSE) as our loss function ( | Z x | 2 N ). The structure of the Loss Functions block and its operations are similar to the processing element. Output Z of the final layer in Figure 4 will be subtracted from the input features x. The subtraction results are squared by a multiplier (×block). Those values will be accumulated similarly to the PEs for N input features. When the accumulation process is done, the reset signal of the register will trigger the divider (÷block) to complete the square mean error calculation. The output result of the loss function will be placed into the Outlier Detection block. The main functionality of the Outlier block is to compare the outputs of the Loss Function to a threshold value to determine if a packet is legitimate or abnormal.

4. System Implementation

In this section, we show the implementation of the proposed ADNN architecture on the NetFPGA-sume board. We first briefly introduce the structure of NetFPGA-sume. Then, we present the implementation with two different neural network models, Anomaly Detection Autoencoder (ADA) and Artificial Neural Classification (ANC). While the ANIDS Server is built on the NetFPGA-sume board, ANIDS Configuration is deployed on a host processor (general purpose processor) to run software-level services.

4.1. The NetFPGA-Sume Platform

The NetFPGA-sume platform [35] is a configurable hardware device specializing in high-speed processing networks. It is an upgraded version of the NetFPGA-10G platform, which was developed by the research team at the University of Cambridge [36]. The device system is equipped with the Xilinx FPGA Virtex-7 XC7V690T chip that hosts a lot of reconfigurable hardware resources (FPGA fabrics) for building computing modules. In addition, the circuit board is packaged by Digilent [37]. We chose the NetFPGA-sume platform for deploying our ANIDS because NetFPGA-sume is dedicated to high throughput network processing with massive resources for building computing cores and high-speed network interfaces.
The NetFPGA-sume platform architecture is shown in Figure 7 where the core FPGA chip Virtex-7 XC7VX690T is connected to I/O components including:
  • Third-generation 8 lanes PCI Express interface with a throughput of 8Gbps/lane and a frequency up to 13.1 GHz. Therefore, configuration data can be transferred between the host processor (ANIDS Configuration) and hardware computing cores in ANIDS Server with a high-bandwidth connection.
  • Four external SFP+ ports with a 10-Gigabit Ethernet Connection to communicate with the public and secure local networks.
  • Three parallel banks of 72 MBit QDRII+ SRAM up to 500 MHz memory and two DDR3-SoDIMM modules 93 MHz (1866 MT/s).
  • Expansion Interfaces with ten high-speed serial links fully compliant VITA-57 FMC-HPC connector, eight high-speed serial links SAMTEC QTH-DP connector.
Figure 7. High level block diagram of the NetFPGA-sume board.
Electronics 12 00668 g007

4.2. Datasets

As mentioned above, we plan to build two neural network models for our ANDIS system, Autodecoder and a traditional neural network model. While NSL-KDD dataset is suitable for Autodecoder, the two new updated datasets UNSW-NB15 and CIC-IDS2017 are used for the conventional neural network model. According to the survey in [7] presented in Table 2, they are popular datasets to test IDS systems and compare different methods. The statistics of each attack types of these datasets are shown in Table 2, Table 3 and Table 4.
Features in these datasets are also preprocessed and transformed for building neural networks. The results of the preprocessed features in each dataset are as follows:
  • The NSL-KDD dataset consists of 41 features. We use the one-hot technique to encode these features. Hence, the number of spatial data dimensions has increased to 122. Since all features are essential in the training and inference processes, we use all of them when building and executing the related neural networks.
  • The UNSW-NB15 dataset consists of 47 features; after encoding the features quantity increases to 196. However, some are reduced because of duplication or unrelated to intrusion detection approaches. Hence, we only used 40 features (like other systems in the literature) for building our neural network models.
  • The CIC-IDS2017 dataset collected rawvnetwork packets from the CICFlowMeter [38] tool including 84 features. After cleaning the numerical data, there are only 68 features left. Because they are calculated by the CICFlowMeter tool, the features are represented in digital form already. Therefore, data preprocessing is not required.

4.3. Adnn Implementation on NetFPGA-Sume

As mentioned above, this study develops the entire ANIDS in which neural network models can be deployed so that local networks can be protected from network attacks. A general-purpose processor (Intel processor) is used as a host processor to build the ANIDS Configuration (software level) and communicates with ANIDS Server through the PCI Express interface. This subsection presents our ADNN implementation to hosting two different neural network models, ADA and ANC. Figure 8 shows the logic view of our ADNN implementation on the NetFPGA-sume board.
The entire FPGA-based ADNN includes the following modules for handling and cooperating with the processing of the ADNN core:
  • Input Arbiter: receiving network packets from the public network through the four input ports (10 G Rx).
  • Output Queue: transmitting packets to the corresponding port if packets are legitimate or removing them from the system if ADNN considers them as illegitimate.
  • Host Monitor: communicating with the host processor to receive updated neuron network models of sending statistic data to administrators via the host processor.
The primary processing component of the ANIDS Server is the ADNN module. As stated above, the main purpose of this module is to host neuron network models for detecting anomaly network packets. The ADNN module is implemented by four engines as follows.
  • Input Parser functions like the input layer for the neuron network models deployed. This engine receives network packets and extracts required features from those packets so that the neuron network models can be executed by processing elements, as explained in the previous section. After extracted and normalized, Features are stored in the Memory engine (FIFO) for processing by PEs in the Neural Layer Core engine.
  • Neural Layer Core implements the architecture shown in Figure 3. This is the main part of the work, i.e., the heart of the system. In this implementation, two neuron network models, ADA and ANC, are deployed and processed by the PEs, as explained in the previous section. The next subsection explains the details of the two models.
  • Memory, in the form of a FIFO, stores input packets received from the Input Parser to process by the neurons networks. These packets are then forwarded to the Output Queue for delivery to corresponding output ports or removal from the system according to the decision from Classification Result
  • Classification Result receives outputs from the neuron network models and determines if a network packet and its data stream are normal or abnormal.

4.4. Anomaly Detection Autoencoder-ADA

Autoencoder (AE) [39] is a neuron network model following the unsupervised learning technique. The model regenerates data input from encoding after validating and refining. The Autodecoder can be applied to NIDS due to its dimensionality reduction ability. Figure 9 shows the processing flow of the Autoencoder approach of our ANIDS system, including the training and inference phases. At first, datasets are divided into two sub-datasets, training and testing. Both of them are preprocessed in the same way. Then, during the training phases, the datasets are continually divided into two subsets, data for training and data for validating the model. The primary purpose of the training and validation phases is to find the most optimized number of hidden layers and the threshold value for later use in the inference phase. In this phase, the trained model will regenerate input packets based on features to compute anomaly score (AS). This score is compared to the threshold value to determine if packets are normal or abnormal.
We conduct the training phase for the ADA model with the NSL-KDD dataset on general-purpose processors to determine the most optimized neuron network configuration and the threshold value. Table 5 depicts some structures of AutoEncoder. As shown in the table, the model of 122 × 64 × 122 (1 hidden layer with 64 neurons, 122 inputs, and 122 outputs) achieves the most optimized result of 90.87% compared to the other configurations in terms of accuracy. Therefore, we use this configuration for our implementation of FPGA. Table 6 presents all configuration parameters of our ADA model when built on our hardware ADNN platform.

4.5. Artificial Neural Classification-ANC

Along with the Autodecoder technique, we also build a traditional neural network model for detecting anomaly attacks (ANC). Similar to ADA, we use two datasets, UNSW-NB15 and CIC-IDS2017, for training, validating, and testing to build the most optimized neural network model on FPGA. The two mentioned datasets are used because they are updated with new attack types compared to KDD-Cup 99 and NSL-KDD as analyzed in Section 2. Table 7 compares the accuracy of some traditional neural network configurations after validating. The table shows that the model of two hidden layers with 40 neurons each offers the most optimized accuracy. The input layer consists of 40 neurons since both datasets provide 40 features for intrusion detection purposes. Table 8 presents all configuration parameters of our ANC model when built on our hardware ADNN platform.

5. Experiments

In this section, we present our experiments with the above system and compare our results with other studies in the literature. We first introduce the way we set up our experiments. Secondly, we synthesize our system to report resource usage and power consumption. Thirdly, we analyze the processing bandwidth and throughput of our system. Finally, we compare the accuracy of our work and other proposals.

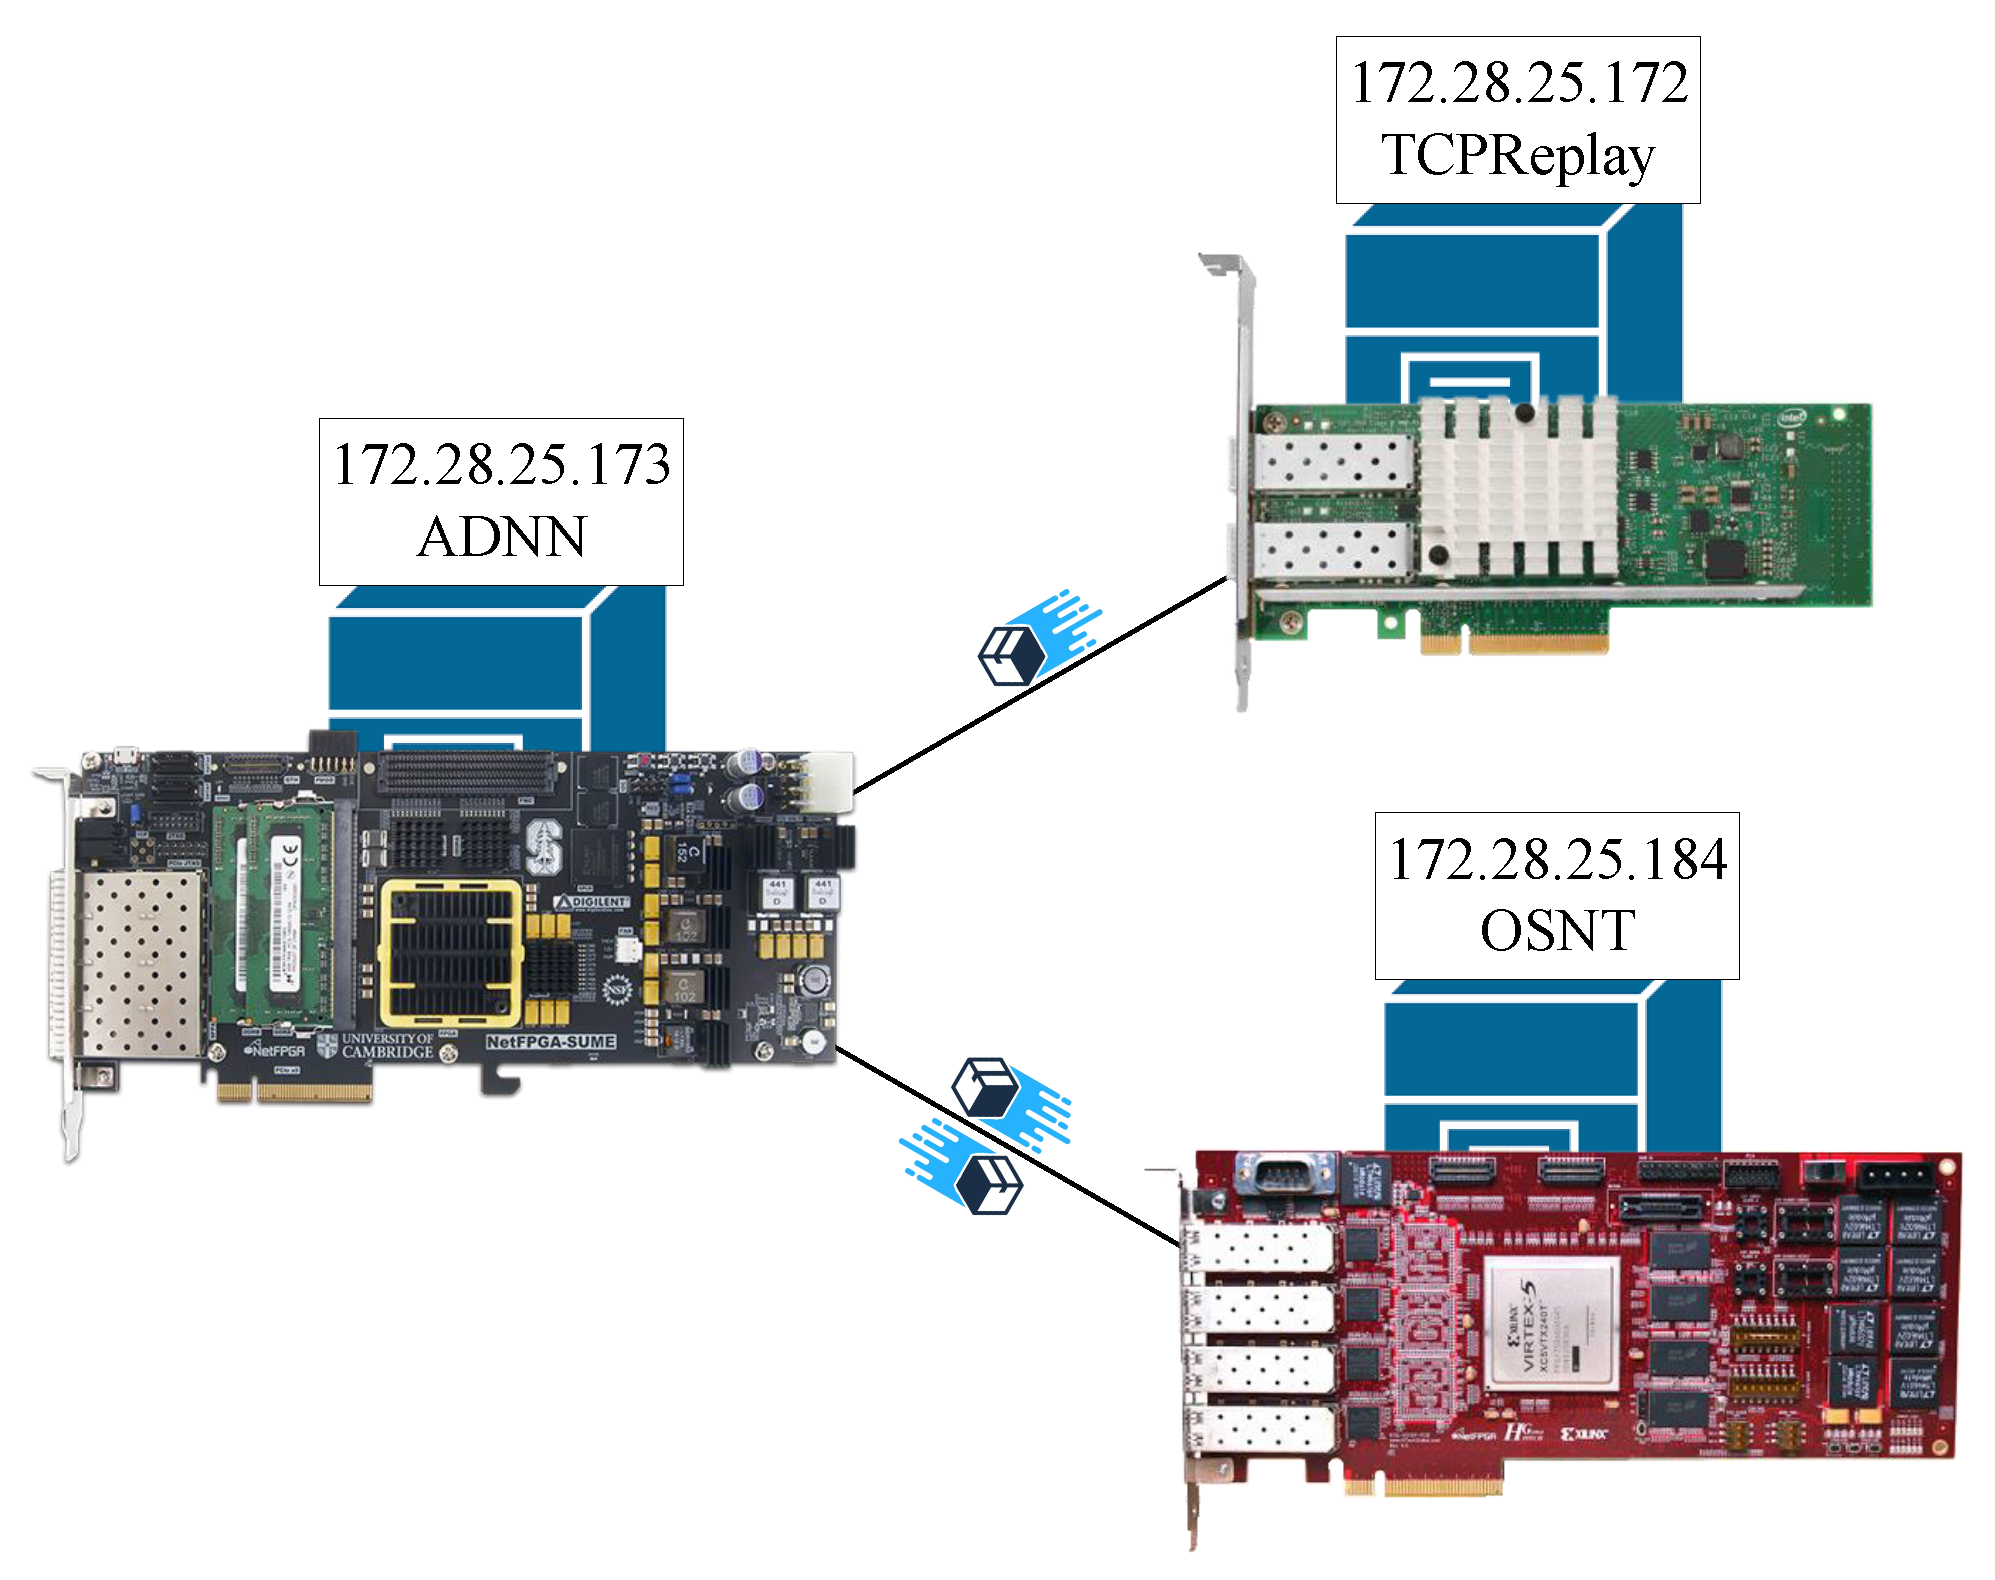
5.1. Experimental Setup

To verify the proposed ANDIS, we build a testbed system as shown in Figure 10 to analyze the processing bandwidth and detection accuracy.
The tested system includes three main components as follows.
  • First, the proposed ANIDS is installed on the NetFPGA-sume board handled by an Intel Core i5 processor with 8 GB of RAM running Ubuntu 16.04. The system is connected with a high-speed switch and assigned an IP address of 172.28.25.173.
  • Second, an Intel Core i5 processor with 8 GB of RAM running Ubuntu 12.04 hosts one NetFPGA-10G board installed with OSNT to measure the bandwidth of the proposed ADNN system. This computer is assigned an IP address of 172.28.25.184.
  • Third, the last Intel Core i5 processor with the same configuration hosts one Intel-10G network card to install a testing agent (the tcpreplay tool [40]) with IP address 172.28.25.172. This computer is used to measure the accuracy of the proposed system.

5.2. Synthesis Results

The proposed system is developed with Hardware Description Language (Verilog-HDL) and synthesized with the support tools Vivado [41,42,43]. Table 9 presents the synthesis results with the Virtex 7 xc7vx690tffg1761-3 FPGA chip of Xilinx on the NetFPGA-sume board. The second and fourth columns show the number of hardware resources used for each model, while the third and fifth columns show the percentage of resources used. The last column illustrates each type of FPGA device’s total available resource. As shown in the table, the system currently uses up to 21.39% of the Look-up table (LUT) when deploying ADA or ANC model. The ADA model requires more DSP and BRAM than ANC since the ADA model is more extensive than ANC. Regarding the working frequency, the ADA and ANC models can function at a maximum of 206.7 MHz and 204.2 MHz, respectively. Finally, the system’s power consumption is 11.27 W for the ADA model and 10.32 W for the ANC model.

5.3. Throughput and Bandwidth Analysis

The ultimate goal of developing machine learning models on FPGA platforms is to improve the processing speed of the inference phase. Hence, to evaluate the ability to accelerate the ANIDS system when deployed on hardware devices, the bandwidth of the system (regarding the amount of network data processed per second-Gigabit per second-Gbps) and processing throughput (in terms of the number of multiply-accumulate operators calculated in one second-Gops) are measured and compared with other platforms (CPU and GPU). These results will demonstrate the feasibility and efficiency of the ANIDS with the machine learning approach on reconfigurable hardware devices.
Figure 11 shows the results of the processing bandwidth and latency of our ANIDS on FPGA with different datasets. ADA-KDD, ANC-NB15, and ANC-CIC represent the ADA model with the NSL-KDD dataset, the ANC model with the UNSW-NB15 dataset, and ANC with the CIC-IDS2017 dataset, respectively. For each dataset, the left column shows the sending speed of the OSNT system, while the left column represents the processing bandwidth of our system with the corresponding dataset. As the figure shows, the processing bandwidth is always less than the sending bandwidth. This is because when ANIDS cannot process incoming packets, they are dropped to protect the local network.
As shown in the figure, our ANIDS deployed with the ANC model with the UNSW-NB15 dataset offers the highest bandwidth of 34.74 Gbps. On the other hand, the processing bandwidth for the ADA model with the NSL-KDD dataset and the ANC model with CIC-IDS2017 is 28.7 Gbps and 31.08 Gbps, respectively. The ADNN deployed with the ADA approach achieves lower bandwidth than the ANC approach because the ADA model is more complicated than traditional neuron networks. In addition, the NSL-KDD dataset has more features (122 features) to process than the other datasets (40 features). Consequently, the packet latency of ADA (2.08 μs) is longer than ANC with UNSW-NB15 (1.14 μs) and CIC-IDS2017 (1.29 μs) datasets.
Figure 12 depicts the processing throughput of our ADNN with different approaches in terms of Giga operations per second (Gops) or, in other words, the number of multiply-accumulate (MAC) operators processed per second. As shown in the figure, the number of computed MAC operations per second in ADA-KDD is about 2× larger than the ANC with UNSW-NB15 and with CIC-IDS2017 datasets (18.7 Gops compared to 9.1 Gops and 10 Gops). With the optimization of the pipeline processing and the significantly higher number of MAC operations, the throughput of ADA-KDD dominates the others. However, as the bandwidth values show, due to the massive amount of MAC operations needed to be processed, ADA requires longer processing time than the others, although its throughput is higher. The ADA model with NSL-KDD processes in total 15,600 MAC operations that is 4× and 3× larger than the ANC model with UNSW-NB15 and CIC-IDS2017 datasets, respectively.
Along with the above throughput comparisons, we also compare our system throughput with traditional CPU and GPU. Figure 12 also shows the results of the two CPU and GPU platforms. As shown in the figure, GPU and CPU offer very low throughput regarding the number of operations processed per second. Meanwhile, our FPGA-based computing system provides significantly higher throughput than CPU and GPU. We obtain this high throughput because data input of the FPGA platform is encapsulated in packets and transmitted directly to the processing core inside the FPGA chip of the NetFPGA-sume board.
In contrast, GPU is not dedicated to network packet processing. Therefore, data inputs are loaded from the main memory of the host processor and then transferred through the PCIe connection to GPU. Consequently, the GPU-based system needs to account for this data communication overhead. Regarding the CPU-based system, data inputs are stored in the main memory and CPU’s cache for processing the CPU. In other words, data transfer overhead is reduced compared to the GPU-based system. However, the parallel level of the CPU-based system is worse than our FPGA-based system and GPU. According to the figure, we obtain up to 12.46× and 31.16× speed-ups compared to CPU and GPU, respectively.

5.4. Accuracy Analysis

In this sub-section, we present the accuracy analysis of our ADNN system with the ADA approach and ANC approach with UNSW-NB15 and CIC-IDS2017 datasets.

5.4.1. Evaluation Metrics

To evaluate our system with different models and datasets deployed and to compare with other proposals in the literature, we use the evaluation metrics, including accuracy, false positive rate, and false negative rate, as defined in Equation (1). These values are computed according to True Positive (TP), True Negative (TN), False Positive (FP), and False Negative (FN). Definitions of the terms are explained in [44].
Accuracy = T P + T N T P + T N + F P + F N False positive rate ( FPR ) = F P F P + T N False negative rate ( FNR ) = F N F N + T P
We also use the following metrics for comparison with state-of-the-art proposals. Precision, a.k.a positive predictive value, is the fraction of total attacking packets recognized by the system (TP) and the number of packets claimed as anomaly packets (TP + FP) as shown in Equation (2).
Precision = T P T P + F P
Meanwhile, Recall, representing how sensitive the system can be, is the fraction of total attacking packets recognized by the system (TP) and the total number of attacking packets (TP + FN) as shown in Equation (3).
Recall = T P T P + F N

5.4.2. Ada Approach with NSL-KDD Dataset

Table 10 depicts the classification results of our ADNN system when deploying the ADA approach with the NSL-KDD dataset. The table shows that our system recognizes 8277 regular packets (i.e., True Negative) among 9711 packets labeled normal. In other words, 1434 packets are false positives. In addition, the system can detect 12,209 attacking packets (i.e., True Positive) among 12,833 packets labeled as an anomaly, i.e., 624 false negatives. According to Equation (1), the accuracy rate of our system when deploying the ADA approach with the NSL-KDD dataset is 90.87%. In contrast, the false negative rate (attacking packets are recognized as regular packets) and the false positive rate (normal packets are recognized as attacking packets) are 4.86% and 14.76%, respectively.
Figure 13 compares the accuracy, false negate rate, and false positive rate of our ADNN system with the ADA technique and of some ML-based algorithms for NIDS, including Isolated Forest [45], XGBoost [10], and our ANC technique. We build these algorithms on the software level and apply the same dataset NSL-KDD for a fair comparison. As shown in the table, when implemented on FPGA, our ADA technique obtains better accuracy than all the others with the NSL-KDD dataset. Although our false positive rate is higher than the others (14.76% compared to 1.61%, 3.44%, and 4.34%), we achieve the lowest false negative rate. Compared to FP, FN is more harmful to the protected system because false negative packets (attacking packets) are allowed to arrive at local networks. According to the figure, in terms of accuracy and FNR, our ADA approach with the NSL-KDD dataset outperforms all the referenced approaches when built inside the ADNN system.

5.4.3. Anc Approach with UNSW-NB15 Dataset

The results of testing the ANC model with the UNSW-NB15 dataset are illustrated in Table 11. According to the table, our system correctly recognizes 27,785 normal (TN) and 42,775 attacking (TP) packets with only 9215 false positives and 875 false negative packets. That results in an accuracy of 87.49%, FNR of 2%, and FPR of 24.9%. Compared to the ADA approach with the NSD-KDD dataset above, this technique is worse in accuracy but better regarding the FNR 2×. However, as analyzed in Section 2, newly updated datasets like UNSW-NB15 help NIDS systems deal with new types of attacks.
Figure 14 compares our ANC technique and UNSW-NB15 dataset deployed in the FPGA-based ADNN system with the algorithms mentioned above (Isolated Forest, XGBoost, and our ADA technique on the software level). As shown in the figure, our ANC with UNSW-NB15 dataset outperforms all the other algorithms in terms of accuracy and FNR, the two most important parameters. Regarding the FPR, our ANC technique with UNSW-NB15 dataset is worse than the XGBoost algorithm and the ADA technique, but this parameter does not reduce the system’s security level.

5.4.4. Anc Approach with the CIC-IDS2017 Dataset

Similar to the two previous techniques (ADA with NSL-KDD and ANC with UNSW-NB15 datasets), we evaluate the ANC technique’s accuracy, FNR, and FPR with the CIC-IDS2017 dataset. Table 12 presents the classification results of the technique. As shown in the table, our technique, when deployed in the FPGA-based ADNN system with the CIC-IDS2017 dataset, can recognize 410,866 usual and 79,690 attacking packets with only 3627 FP and 5270 FN packets. That results in an accuracy of 98.22%, FNR of 6.2%, and FPR of 0.8%. Compared to data in Table 10 and Table 11, the ANC technique with the CIC-IDS2017 dataset achieves the highest accuracy result but produces higher FNR than the two others (6.2% compared to 4.86% and 2.0%).
Like ADA with the NSL-KDD dataset and ANC with the UNSW-NB15 dataset, we also compare our ANC with CIC-IDS2017 dataset on FPGA-based ADNN system with Isolated Forest, XGBoost, and ANC algorithms on the software level. Figure 15 presents this comparison result. As shown in the figure, we are slightly lower accuracy than the XGBoost algorithm (98.22% compared with 99.81%) but are better than the two rest algorithms. On the other hand, in terms of FNR, we only outperform the Isolated Forest algorithm but are worse than the two others.

5.5. State-of-the-Art Comparison

In addition to comparing with some anomaly detection algorithms on the software level mentioned above, the system is also compared with other state-of-the-art proposals in the literature, thereby having a more objective view of the research. We make comparisons with systems using the same datasets only for fairness. Table 13, Table 14 and Table 15 compares our system results with studies that use NSL-KDD, UNSW-NB15, and CIC-IDS2017 datasets, respectively. For these comparisons, we use the accuracy, precision, and recall parameters.
Table 13 compares our ADA technique with systems in the literature that use the same NSL-KDD dataset. As shown in the table, our system outperforms all others in terms of accuracy. Regarding the precision, the ADA approach in our FPGA-based ADNN system is slightly worse than work in [46] (85.23% compared to 96.74%) and in [47] (96.24%), but we are better than them in term of recall (92.99% compared with 85.93% and 76.57%, respectively).
The Table 14 shows the anomaly detection ability of some studies tested on the UNSW-NB15 dataset. In particular, the 2-Stage Ensemble [18], the LogAE-XGBoost [48], and MSCNN-LSTM-AE [49] achieve higher accuracy results (91.27%, 95.11%, and 89%, respectively) than our ANC with the UNSW-NB15 dataset (87.49%). However, our system outperforms the rest. Regarding the precision parameters, our system is better than studies in [50] only. In contrast, the ANC with UNSW-NB15 technique on the FPGA-based ADNN system achieves a higher recall value than work in [18,29,49,50].
Table 14. Compare ANC with other research in UNSW-NB15 dataset.
SystemAccuracyPrecisionRecall
Our proposed ANC87.4975.0996.95
DNN by Vinayakumar et al. [29]76.1095.1068.40
2-Stage Ensemble by Tama et al. [18]91.2791.6091.30
MSCNN-LSTM-AE [49]89.0088.0089.00
SVM by Jing et al. [50]75.7750.9084.74
LogAE-XGBoost by Xu et al. [48]95.1195.4997.43
Finally, for the CIC-IDS2017 dataset, most of the machine learning and deep learning algorithms achieve impressive results, as shown in Table 15. Our ANC model with the CIC-IDS2017 dataset obtains an accuracy of 98.22%, higher than other studies, including Autoencoder+CNN [51] and SVM [52]. However, our system is slightly worse than Stack Ensemble in [53] (accuracy of 99.95%). In terms of precision, our work is the highest compared to the others, while we are the second best regarding the recall parameter.
Table 15. Compare ANC with other research in CIC-IDS2017 dataset.
SystemAccuracyPrecisionRecall
Our proposed ANC98.2299.1298.73
Autoencoder+CNN [51]97.9N/A94.93
SVM by Azizan et al. [52]98.1898.7495.63
Stack Ensemble by Zhang et al. [53]99.9598.799.95

6. Conclusions

In this work, we proposed an FPGA-based ADNN architecture for deploying various machine learning-based models to prevent anomaly network attacks. The proposed architecture is implemented on the NetFPGA-sume board, a dedicated board for high-speed network processing. We test the system with three machine learning models: Autoencoder (ADA) with the NSL-KDD dataset and traditional artificial neuron networks (ANC) with the UNSW-NB15 and CIC-IDS2017 datasets. The ADA model performing anomaly detection achieves an accuracy of 90.87%, a processing bandwidth of 28.7 Gbps, and throughput of 18.7 Gops with a latency of 2.08 μs. For the ANC model, with the UNSW-NB15 and CIC-IDS2017 datasets, our system achieves an accuracy of 87.5% and 98.2%, respectively. Furthermore, the system with these datasets offers a processing bandwidth of 34.74 Gbps and 31.08 Gbps, respectively. Regarding the throughput, the system can process up to 9.1 Gops with the UNSW-NB15 dataset and up to 10 Gops with the CIC-IDS2017 dataset. Compared to CPU and GPU, our FGPA-based system offers much higher throughput for all datasets. Regarding resource usage, the ADA model requires 20.97% LUTs and functions at 206.7 MHz, while the ANC model uses 21.39% LUTs and works at 204.2 MHz.

Author Contributions

Methodology, C.P.-Q., T.N.T. and T.H.Q.B.; Architecture design, C.P.-Q. and T.H.Q.B.; System implementation, T.H.Q.B.; Testing and validation, C.P.-Q., T.N.T. and T.H.Q.B.; Writing—original draft, T.H.Q.B.; Writing—review & editing, C.P.-Q. All authors have read and agreed to the published version of the manuscript.

Funding

This research is funded by Vietnam National University-Ho Chi Minh City (VNU-HCM) under grant number B2021-20-02.

Data Availability Statement

The data presented in this study are available on request from the corresponding author.

Acknowledgments

The authors acknowledge Ho Chi Minh City University of Technology (HCMUT), VNU-HCM for supporting this study.

Conflicts of Interest

The authors declare no conflict of interest.

References

  1. Vailshery, L. Number of Internet of Things (IoT) Connected Devices Worldwide from 2019 to 2030. Available online: https://www.statista.com/statistics/1183457/iot-connected-devices-worldwide/ (accessed on 27 November 2022).
  2. Ahmed, M.; Naser Mahmood, A.; Hu, J. A survey of network anomaly detection techniques. J. Netw. Comput. Appl. 2016, 60, 19–31. [Google Scholar] [CrossRef]
  3. García-Teodoro, P.; Díaz-Verdejo, J.; Maciá-Fernández, G.; Vázquez, E. Anomaly-based network intrusion detection: Techniques, systems and challenges. Comput. Secur. 2009, 28, 18–28. [Google Scholar] [CrossRef]
  4. Guo, K.; Zeng, S.; Yu, J.; Wang, Y.; Yang, H. [DL] A Survey of FPGA-Based Neural Network Inference Accelerators. ACM Trans. Reconfigurable Technol. Syst. 2019, 12, 1–26. [Google Scholar] [CrossRef]
  5. Mittal, S. A survey of FPGA-based accelerators for convolutional neural networks. Neural Comput. Appl. 2020, 32, 1109–1139. [Google Scholar] [CrossRef]
  6. Axelsson, S. Intrusion Detection Systems: A Survey and Taxonomy. 2000. Available online: http://www.cse.msu.edu/~cse960/Papers/security/axelsson00intrusion.pdf (accessed on 27 November 2022).
  7. Ahmad, Z.; Shahid Khan, A.; Wai Shiang, C.; Abdullah, J.; Ahmad, F. Network intrusion detection system: A systematic study of machine learning and deep learning approaches. Trans. Emerg. Telecommun. Technol. (ETT) 2021, 32, e4150. [Google Scholar] [CrossRef]
  8. Rai, K.; Devi, M.S.; Guleria, A. Decision tree based algorithm for intrusion detection. Int. J. Adv. Netw. Appl. 2016, 7, 2828. [Google Scholar]
  9. Farnaaz, N.; Jabbar, M. Random forest modeling for network intrusion detection system. Procedia Comput. Sci. 2016, 89, 213–217. [Google Scholar] [CrossRef] [Green Version]
  10. Dhaliwal, S.S.; Nahid, A.A.; Abbas, R. Effective intrusion detection system using XGBoost. Information 2018, 9, 149. [Google Scholar] [CrossRef] [Green Version]
  11. Karatas, G.; Demir, O.; Sahingoz, O.K. Increasing the performance of machine learning-based IDSs on an imbalanced and up-to-date dataset. IEEE Access 2020, 8, 32150–32162. [Google Scholar] [CrossRef]
  12. Yan, B.; Han, G. Effective feature extraction via stacked sparse autoencoder to improve intrusion detection system. IEEE Access 2018, 6, 41238–41248. [Google Scholar] [CrossRef]
  13. Ghanem, K.; Aparicio-Navarro, F.J.; Kyriakopoulos, K.G.; Lambotharan, S.; Chambers, J.A. Support vector machine for network intrusion and cyber-attack detection. In Proceedings of the 2017 Sensor Signal Processing for Defence Conference (SSPD), London, UK, 6–7 December 2017; pp. 1–5. [Google Scholar]
  14. Li, G.; Niu, P.; Duan, X.; Zhang, X. Fast learning network: A novel artificial neural network with a fast learning speed. Neural Comput. Appl. 2014, 24, 1683–1695. [Google Scholar] [CrossRef]
  15. Ali, M.H.; Al Mohammed, B.A.D.; Ismail, A.; Zolkipli, M.F. A new intrusion detection system based on fast learning network and particle swarm optimization. IEEE Access 2018, 6, 20255–20261. [Google Scholar] [CrossRef]
  16. Huang, G.B.; Zhu, Q.Y.; Siew, C.K. Extreme learning machine: Theory and applications. Neurocomputing 2006, 70, 489–501. [Google Scholar] [CrossRef]
  17. Shen, Y.; Zheng, K.; Wu, C.; Zhang, M.; Niu, X.; Yang, Y. An ensemble method based on selection using bat algorithm for intrusion detection. Comput. J. 2018, 61, 526–538. [Google Scholar] [CrossRef]
  18. Gao, X.; Shan, C.; Hu, C.; Niu, Z.; Liu, Z. An adaptive ensemble machine learning model for intrusion detection. IEEE Access 2019, 7, 82512–82521. [Google Scholar] [CrossRef]
  19. Hochreiter, S.; Schmidhuber, J. Long short-term memory. Neural Comput. 1997, 9, 1735–1780. [Google Scholar] [CrossRef]
  20. Chung, J.; Gulcehre, C.; Cho, K.; Bengio, Y. Empirical evaluation of gated recurrent neural networks on sequence modeling. arXiv 2014, arXiv:1412.3555. [Google Scholar]
  21. Mittal, M.; Iwendi, C.; Khan, S.; Rehman Javed, A. Analysis of security and energy efficiency for shortest route discovery in low-energy adaptive clustering hierarchy protocol using Levenberg-Marquardt neural network and gated recurrent unit for intrusion detection system. Trans. Emerg. Telecommun. Technol. (ETT) 2021, 32, e3997. [Google Scholar] [CrossRef]
  22. Yin, C.; Zhu, Y.; Fei, J.; He, X. A deep learning approach for intrusion detection using recurrent neural networks. IEEE Access 2017, 5, 21954–21961. [Google Scholar] [CrossRef]
  23. Xu, C.; Shen, J.; Du, X.; Zhang, F. An intrusion detection system using a deep neural network with gated recurrent units. IEEE Access 2018, 6, 48697–48707. [Google Scholar] [CrossRef]
  24. Naseer, S.; Saleem, Y.; Khalid, S.; Bashir, M.K.; Han, J.; Iqbal, M.M.; Han, K. Enhanced network anomaly detection based on deep neural networks. IEEE Access 2018, 6, 48231–48246. [Google Scholar] [CrossRef]
  25. Malaiya, R.K.; Kwon, D.; Kim, J.; Suh, S.C.; Kim, H.; Kim, I. An empirical evaluation of deep learning for network anomaly detection. In Proceedings of the 2018 International Conference on Computing, Networking and Communications (ICNC), Maui, HI, USA, 5–8 March 2018; pp. 893–898. [Google Scholar]
  26. Yang, Y.; Zheng, K.; Wu, B.; Yang, Y.; Wang, X. Network intrusion detection based on supervised adversarial variational auto-encoder with regularization. IEEE Access 2020, 8, 42169–42184. [Google Scholar] [CrossRef]
  27. Zhang, X.; Chen, J.; Zhou, Y.; Han, L.; Lin, J. A multiple-layer representation learning model for network-based attack detection. IEEE Access 2019, 7, 91992–92008. [Google Scholar] [CrossRef]
  28. Yu, Y.; Bian, N. An Intrusion Detection Method Using Few-Shot Learning. IEEE Access 2020, 8, 49730–49740. [Google Scholar] [CrossRef]
  29. Vinayakumar, R.; Alazab, M.; Soman, K.; Poornachandran, P.; Al-Nemrat, A.; Venkatraman, S. Deep learning approach for intelligent intrusion detection system. IEEE Access 2019, 7, 41525–41550. [Google Scholar] [CrossRef]
  30. Hoque, N.; Kashyap, H.; Bhattacharyya, D. Real-time DDoS attack detection using FPGA. Comput. Commun. 2017, 110, 48–58. [Google Scholar] [CrossRef]
  31. P N, S.; KT, M. Neural Network based ECG Anomaly Detection on FPGA. Asian J. Converg. Technol. (AJCT) 2019, 5, 1–4. Available online: https://asianssr.org/index.php/ajct/article/view/883 (accessed on 27 November 2022).
  32. Tran, C.; Vo, T.N.; Thinh, T.N. HA-IDS: A heterogeneous anomaly-based intrusion detection system. In Proceedings of the 2017 4th NAFOSTED Conference on Information and Computer Science, Hanoi, Vietnam, 24–25 November 2017; pp. 156–161. [Google Scholar] [CrossRef]
  33. Ngo, D.M.; Tran-Thanh, B.; Dang, T.; Tran, T.; Thinh, T.N.; Pham-Quoc, C. High-Throughput Machine Learning Approaches for Network Attacks Detection on FPGA. In Proceedings of the Context-Aware Systems and Applications, and Nature of Computation and Communication, My Tho City, Vietnam, 28–29 November 2019; Springer International Publishing: Cham, Switzerland, 2019; pp. 47–60. [Google Scholar]
  34. Ngo, D.M.; Pham-Quoc, C.; Thinh, T.N. Heterogeneous Hardware-based Network Intrusion Detection System with Multiple Approaches for SDN. Mob. Netw. Appl. 2020, 25, 1178–1192. [Google Scholar] [CrossRef]
  35. Zilberman, N.; Audzevich, Y.; Covington, G.; Moore, A. NetFPGA SUME: Toward 100 Gbps as research commodity. Micro IEEE 2014, 34, 32–41. [Google Scholar] [CrossRef]
  36. NetFPGA. NetFPGA SUME. Available online: https://netfpga.org/NetFPGA-SUME.html (accessed on 30 May 2022).
  37. Digilent. NetFPGA-SUME Virtex-7 FPGA Development Board. Available online: https://digilent.com/shop/netfpga-sume-virtex-7-fpga-development-board/ (accessed on 30 May 2022).
  38. Arash Habibi, L.; Amy, S.; Gerard Drapper, G.; Ali, G. CIC-AB: An Online Ad Blocker for Browsers. In Proceedings of the 2017 International Carnahan Conference on Security Technology (ICCST), Madrid, Spain, 23–26 October 2017; pp. 1–7. [Google Scholar] [CrossRef]
  39. Goodfellow, I.; Bengio, Y.; Courville, A. Deep Learning; MIT Press: Cambridge, MA, USA, 2016; Available online: http://www.deeplearningbook.org (accessed on 27 November 2022).
  40. Home, T. Tcpreplay-Pcap Editing and Replaying Utilities. Available online: https://tcpreplay.appneta.com/ (accessed on 30 May 2022).
  41. Xilinx, A. Get Started with Vivado. Available online: https://www.xilinx.com/developer/products/vivado.html (accessed on 30 May 2022).
  42. Xilinx, A. Vivado Overview. Available online: https://www.xilinx.com/products/design-tools/vivado.html (accessed on 30 May 2022).
  43. netfpga-sume github. NetFPGA-SUME Vivado Reference Operating System Setup Guide. Available online: https://github.com/NetFPGA/NetFPGA-SUME-public/wiki/Reference-Operating-System-Setup-Guide (accessed on 30 May 2022).
  44. Hossin, M.; Sulaiman, M.N. A review on evaluation metrics for data classification evaluations. Int. J. Data Min. Knowl. Manag. Process 2015, 5, 1. [Google Scholar]
  45. Liu, F.T.; Ting, K.M.; Zhou, Z.H. Isolation Forest. In Proceedings of the 2008 Eighth IEEE International Conference on Data Mining, Pisa, Italy, 15–19 December 2008; pp. 413–422. [Google Scholar] [CrossRef]
  46. Zhang, G.; Wang, X.; Li, R.; Song, Y.; He, J.; Lai, J. Network intrusion detection based on conditional Wasserstein generative adversarial network and cost-sensitive stacked autoencoder. IEEE Access 2020, 8, 190431–190447. [Google Scholar] [CrossRef]
  47. Al-Qatf, M.; Lasheng, Y.; Al-Habib, M.; Al-Sabahi, K. Deep learning approach combining sparse autoencoder with SVM for network intrusion detection. IEEE Access 2018, 6, 52843–52856. [Google Scholar] [CrossRef]
  48. Xu, W.; Fan, Y. Intrusion Detection Systems Based on Logarithmic Autoencoder and XGBoost. Secur. Commun. Netw. 2022, 2022, 1–8. [Google Scholar] [CrossRef]
  49. Singh, A.; Jang-Jaccard, J. Autoencoder-based Unsupervised Intrusion Detection using Multi-Scale Convolutional Recurrent Networks. arXiv 2022, arXiv:2204.03779. [Google Scholar]
  50. Jing, D.; Chen, H.B. SVM Based Network Intrusion Detection for the UNSW-NB15 Dataset. In Proceedings of the 2019 IEEE 13th International Conference on ASIC (ASICON), Chongqing, China, 29 October–1 November 1 2019; pp. 1–4. [Google Scholar] [CrossRef]
  51. Andresini, G.; Appice, A.; Mauro, N.D.; Loglisci, C.; Malerba, D. Multi-Channel Deep Feature Learning for Intrusion Detection. IEEE Access 2020, 8, 53346–53359. [Google Scholar] [CrossRef]
  52. Azizan, A.H.; Mostafa, S.A.; Mustapha, A.; Foozy, C.F.M.; Wahab, M.H.A.; Mohammed, M.A.; Khalaf, B.A. A machine learning approach for improving the performance of network intrusion detection systems. Ann. Emerg. Technol. Comput. (AETiC) 2021, 5, 201–208. [Google Scholar] [CrossRef]
  53. Zhang, H.; Li, J.L.; Liu, X.M.; Dong, C. Multi-dimensional feature fusion and stacking ensemble mechanism for network intrusion detection. Future Gener. Comput. Syst. 2021, 122, 130–143. [Google Scholar] [CrossRef]
Figure 1. Statistics on the percentage of research on published datasets in the field of anomaly-based network intrusion detection system [7].
Electronics 12 00668 g001
Figure 2. Overview of the proposed NIDS architecture.
Electronics 12 00668 g002
Figure 3. Overview structure of ADNN module.
Electronics 12 00668 g003
Figure 4. The detail structure of each neural layer.
Electronics 12 00668 g004
Figure 5. The design architecture of PE core.
Electronics 12 00668 g005
Figure 6. Loss Function: Core processor calculates the Mean Squared Error (MSE).
Electronics 12 00668 g006
Figure 8. Logic view of the ANIDS Server implementation on the NetFPGA-sume board.
Electronics 12 00668 g008
Figure 9. The anomaly detection flow of AutoEncoder model.
Electronics 12 00668 g009
Figure 10. The testbed system for evaluate the proposed ADNIS.
Electronics 12 00668 g010
Figure 11. Bandwidth of our ADNN system with different approaches and datasets.
Electronics 12 00668 g011
Figure 12. Measurements of throughput and number of MACs of models in the ADNN system.
Electronics 12 00668 g012
Figure 13. Comparison of anomaly detection between ADA and other techniques in NSL-KDD dataset.
Electronics 12 00668 g013
Figure 14. Comparison of classification between ANC and other algorithms in UNSW-NB15 dataset.
Electronics 12 00668 g014
Figure 15. Comparison of classification between ANC and other algorithms in CIC-IDS2017 dataset.
Electronics 12 00668 g015
Table 1. Common features for NIDS datasets.
Feature TypesFeature Meaning
src_ip, dst_ipIP address of source and destination
src_port, dst_portPort number of source and destination
pkt_countNumber of packets in an interval
pkt_lengthThe length of packets
flagThe flag value in the header field of a packet
protocolNetwork protocol, for example TCP, ICMP, or UDP
appnameName of the application where packets come
Table 2. Distribution of data on NSL-KDD (the number of packets).
LabelTrainingTesting
Normal67,3439711
Dos45,9277458
Probe11,6562421
U2R52200
R2L9952754
Total125,97322,544
Table 3. Distribution of data on UNSW-NB15 (the number of packets).
LabelTrainingTesting
Normal56,00037,000
Analysis2000677
Backdoor1746583
DoS12,2644089
Exploits33,39311,032
Fuzzers18,1845680
Generic40,00018,071
Reconnaissance10,4913096
Shellcode1133378
Worms13044
Total175,34180,650
Table 4. Distribution of data on CIC-IDS2017 (the number of packets).
LabelTrainingTesting
Benign1,657,165414,493
Bot1549399
Brute Force73051845
DoS257,34164,292
Infiltration279
PortScan72,71917,975
Web Attack1703440
Total125,973499,453
Table 5. Comparison of ADA configurations with the NSL-KDD dataset.
ModelMax AccuracyThreshold
122 × 64 × 32 × 16 × 32 × 64 × 12286.26%0.0005
122 × 64 × 12290.87%0.0010
122 × 32 × 12287.48%0.0005
122 × 8 × 12286.98%0.0005
Table 6. The parameters for building the Autoencoder model on FPGA.
ParameterValue
The number of input122
The number of node hidden64
The number of output node122
Batch Size5
Epoch20
Activation function hidden layerRelu
Activation function output layerSigmoid
Loss FunctionMean Squared Error
Table 7. Comparison of ANC configurations with the UNSW-NB15 and CIC-IDS2017 datasets.
ModelMax AccuracyLoss
40 × 8 × 48 × 8 × 32 × 8 × 16 × 8 × 10.8510.1025
40 × 8 × 40 × 8 × 40 × 8 × 10.87490.0907
40 × 8 × 32 × 8 × 10.8450.0960
Table 8. The parameters for building ANC on FPGA.
ParameterValue
The number of hidden layer2
The number of node first hidden layer40
The number of node second hidden layer40
The number of node in output layer1
Batch Size5
Epoch20
Activation function hidden layerRelu
Activation function output layerSigmoid
Loss FunctionMean Squared Error
Table 9. Synthesis result of each model design on Virtex 7 XC7V690T Xilinx.
ResourceADA ModelANC ModelAvailable
AmountPercentageAmountPercentage
LUT90,85920.9792,66121.39433,200
LUTRAM51852.9881064.65174,200
FF131,34115.16131,59215.19866,400
BRAM285.519.42214.514.591470
DSP2456.811323.673600
Power (W)11.2710.32
Max Frequency (MHz)206.7204.2
Table 10. Classification results of the ADA approach with the NSL-KDD dataset.
LabelTotal PacketsPredict NormalPredict Anomaly
Label Normal97118277 (TN)1434 (FP)
Label Anomaly12,833624 (FN)12,209 (TP)
Table 11. Classification results of the ANC approach with the UNSW-NB15 dataset.
LabelTotal PacketsPredict NormalPredict Anomaly
Label Normal37,00027,785 (TN)9215 (FP)
Label Anomaly43,650875 (FN)42,775 (TP)
Table 12. Classification results of the ANC approach with the CIC-IDS2017 dataset.
LabelTotal packetsPredict NormalPredict Anomaly
Label Normal414,493410,866 (TN)3627 (FP)
Label Anomaly84,9605270 (FN)79,690 (TP)
Table 13. Compare ADA with other research in NSL-KDD dataset.
SystemAccuracyPrecisionRecall
Our proposed ADA90.8785.2392.99
CWGAN-CSSAE by Zhang et al. [46]90.3496.7485.93
DNN by Vinayakumar et al. [29]80.1069.296.9
Ensemble Voting MultiTree [18]85.286.484.23
SAE-SVM by Al-Qatf et al. [47]84.9696.2476.57
Disclaimer/Publisher’s Note: The statements, opinions and data contained in all publications are solely those of the individual author(s) and contributor(s) and not of MDPI and/or the editor(s). MDPI and/or the editor(s) disclaim responsibility for any injury to people or property resulting from any ideas, methods, instructions or products referred to in the content.

