This section presents the EMG signal classification task, taking the five movement modes of walking on the flat ground, going upstairs, going downstairs, sitting down and standing up as the classification objects, and comparing the changes in the classification ability of the various classification models before and after data generation to verify the effectiveness of the data generation method, the data quality of the generated samples and the universality of the generated samples to different models.
5.3.1. Quality and Universality of the Generated Sample Data
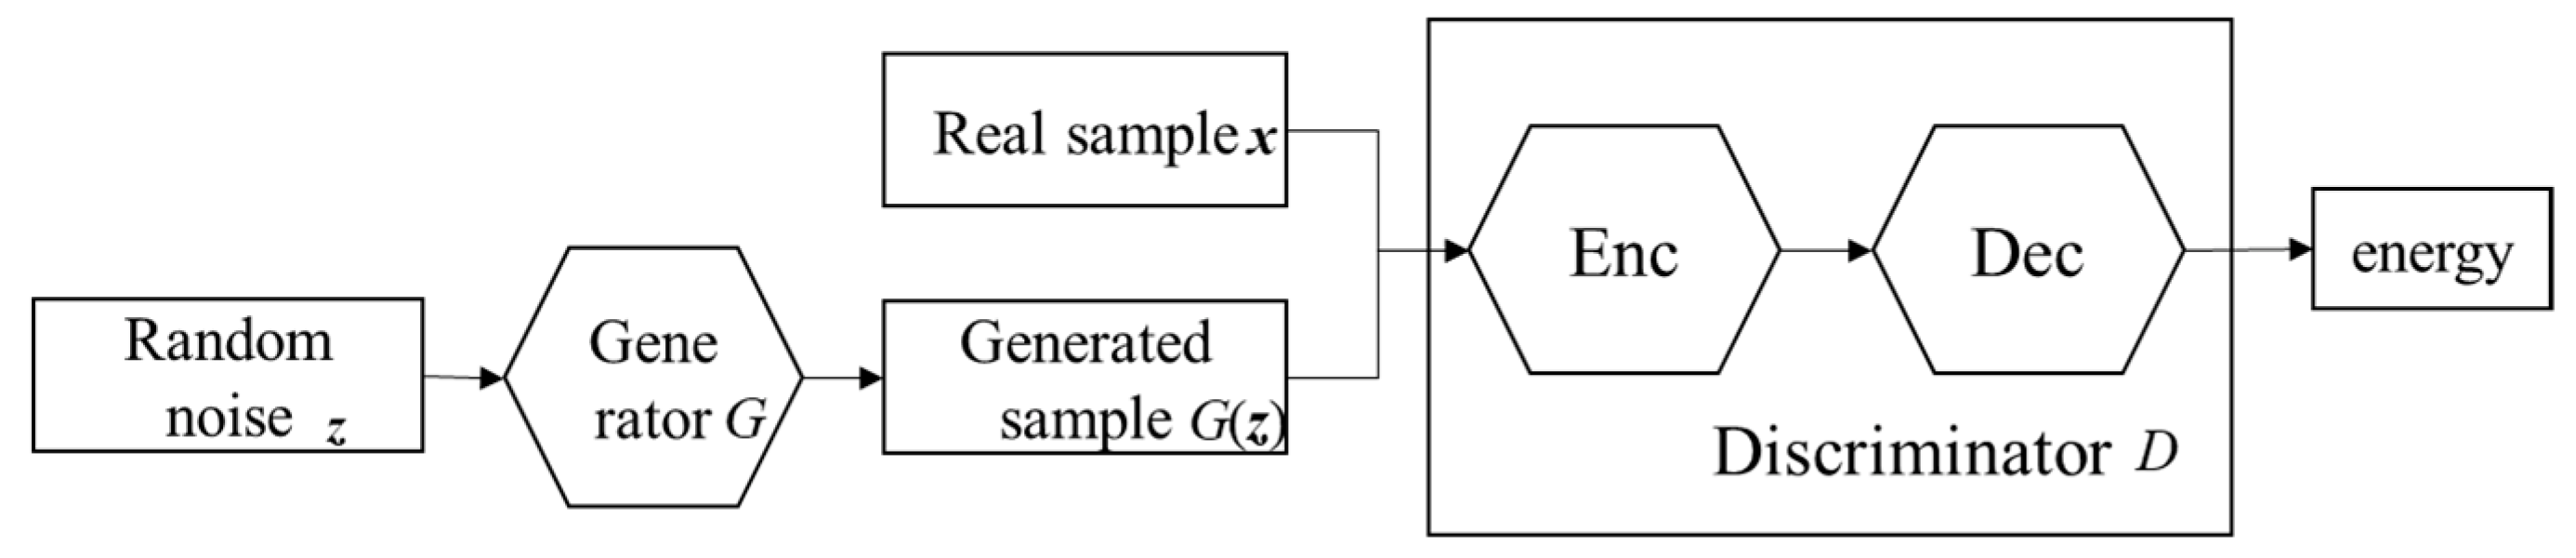
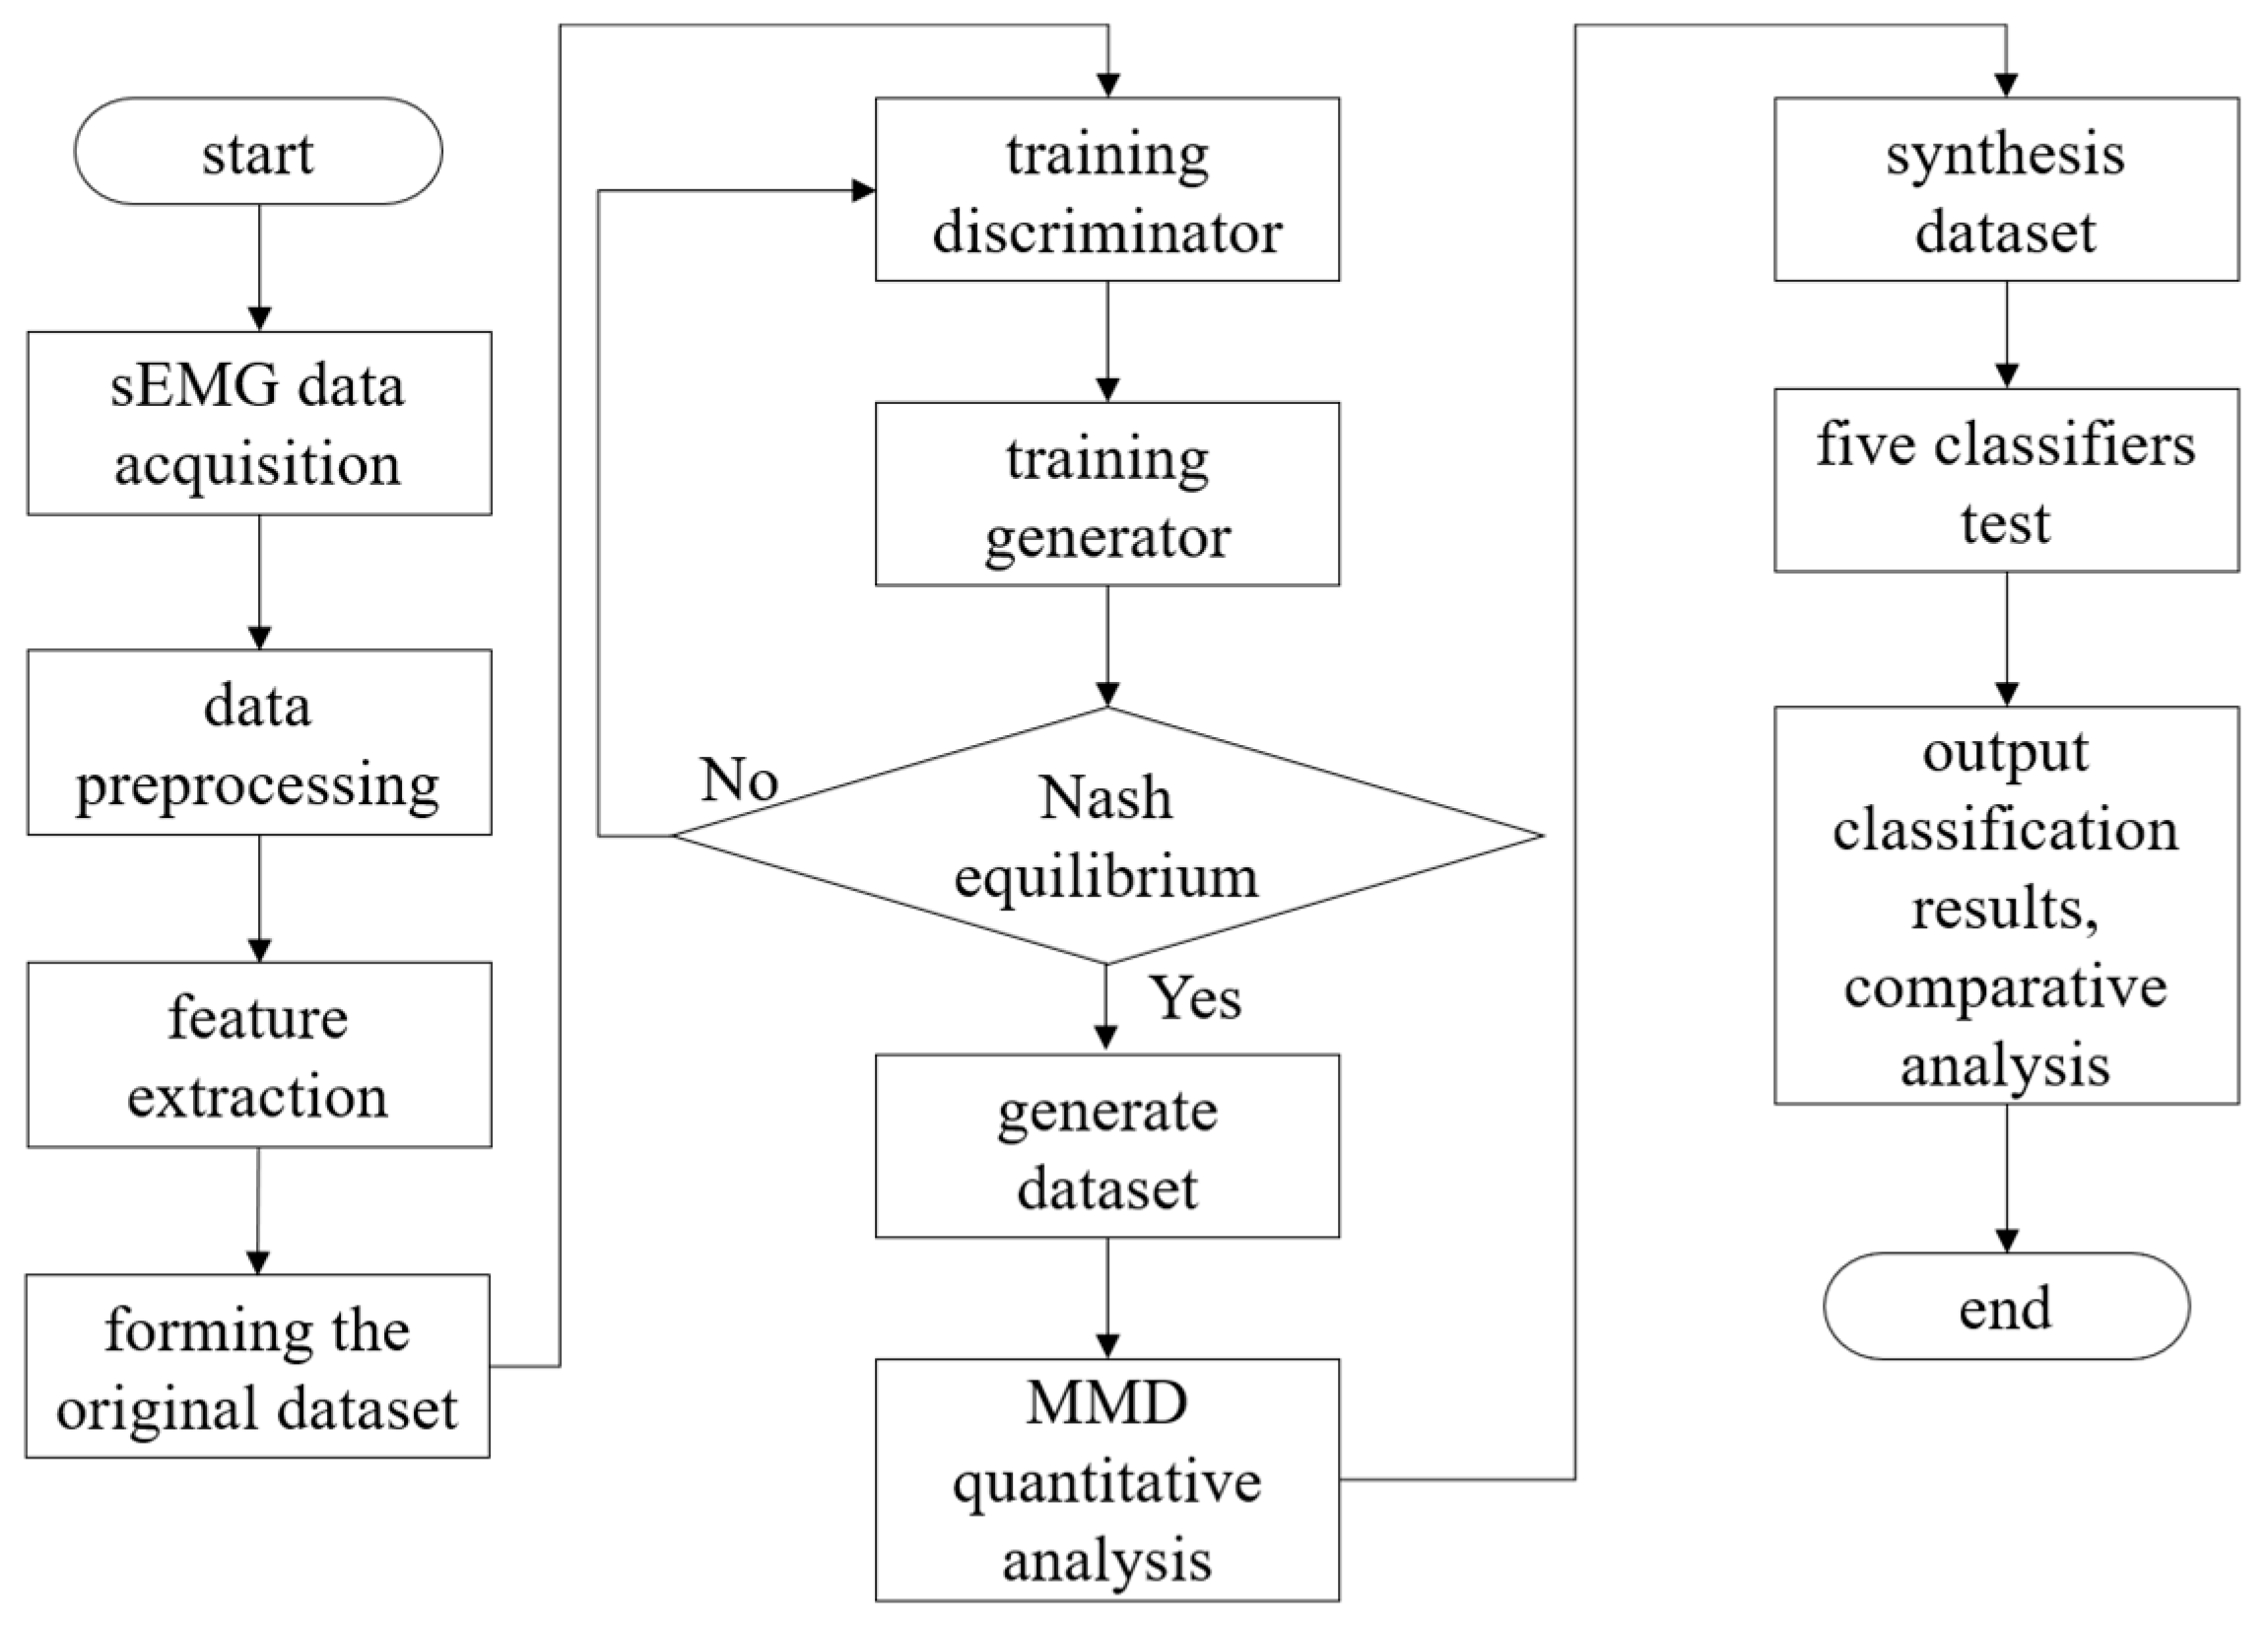
Firstly, according to the parameter setting of EBGAN in the previous section, the model was applied to the EMG feature dataset and adversarial training was carried out, so that the G network model had the ability to generate EMG features. Secondly, the G−network model was used to generate synthetic sample sets comparable to the scale of the EMG feature dataset and they were labeled. These generated samples, together with the original EMG feature data samples, constitute the EBGAN synthetic dataset. Further, this paper selected five typical classification models, including linear discriminant analysis (LDA), Gaussian Naive Bayes (GNB), support vector machine (SVM), k−nearest neighbor (KNN) and multilayer perceptron, MLP), trained on the original dataset and the synthetic dataset [
26]. Then, the trained model was applied to the test set for the classification test; among them, the training samples accounted for 80% and the test samples accounted for 20%. The classification accuracy is shown in
Table 4.
The basic information of each classification model is as follows:
LDA is used to project multi−dimensional sample data into a low−dimensional space to minimize the point variance of each category after projection, while maximizing the variance between different categories. It has the advantages of not needing to adjust learning parameters and having a high efficiency.
GNB, which is applicable to continuous variables, assumes that each feature is subject to a normal distribution under each category y. The probability density function of normal distribution is used to calculate the probability inside the algorithm.
SVM, which has many unique advantages in solving small sample, nonlinear and high−dimensional pattern recognition, can be extended to other machine learning problems, such as function fitting. In SVM, the hyperplane is selected to optimally separate the points in the input variable space from their classes.
KNN is centered on the fact that, if most of the k−nearest samples in the feature space belong to a certain category, the sample also belongs to this category and has the characteristics of the samples in this category. In this method, only the category of the nearest sample or several samples is used to determine the classification decision.
MLP is a forward structure artificial neural network. In addition to the input and output layers, it can have multiple hidden layers in the middle, mapping a group of input vectors to a group of output vectors. It can solve nonlinear problems and conduct real−time learning.
As shown in
Table 4, each classification model achieved better classification results than the original training set by being trained on the EBGAN synthetic dataset, with the accuracy rate improving by 1~5%. The KNN algorithm has the highest accuracy, reaching 93.4%. Among them, the improvement effect of the MLP model is the most obvious. We believe that this is because the MLP model adopts a full connection structure, with a large parameter scale, and it is very easy to over fit small−scale original data training sets. The experimental results show that the data generation method is helpful to improve the training effect of typical machine learning models, which verifies the effectiveness of the data generation method and the generalization ability of the synthetic samples. At the same time, it also proves that the synthetic samples and real samples have similar characteristics and high data quality.
5.3.2. Influence of Sample Generation Size on Classification Accuracy
For machine learning models, in addition to the quality of the data samples, the size of the training set samples will also significantly affect the training effect of the model. This section explores the changes in the classification accuracy of each classification model under different sample generation scales to reveal the impact of sample generation scales on machine learning models. Specifically, the trained EBGAN model was obtained by referring to the steps in the previous section, which was used to generate the EMG feature data samples and limit the size of the original data to 0.5~3.0 times. The scale of the newly generated data in the mixed set was 0.5~3 times that of the original dataset, so the synthetic data ratios in differently mixed sets were 33%, 50%, 66% and 75%. Secondly, these generated samples were mixed with the original dataset to form a synthetic dataset. The symbols “synthetic dataset * 0.5~synthetic dataset * 3.0” were used to represent these datasets. The asterisk * represents a multiple of the dataset. Then, we applied the five typical classification models, mentioned in the previous section, to the original dataset and the synthetic dataset for classification training, and conducted classification tests on the test set. The classification accuracy of each model is shown in
Table 5. According to the analysis results, most classification models achieved good training results on the “synthetic dataset * 1.0~synthetic dataset * 2.0” synthetic dataset, and the test classification accuracy was the highest. This shows that the relationship between the model training effect and the data generation scale is not linear. The excessive introduction of synthetic data samples changes the sample subject in the augmented dataset from real data to synthetic data, and the characteristics of synthetic samples cannot be infinitely close to the real samples, which leads to the decline in classification accuracy.
5.3.3. Applicability and Superiority of the EBGAN Model Structure for EMG Feature Enhancement
In order to fully verify the applicability and superiority of the EBGAN model structure to EMG characteristics, this section applies the composite datasets of traditional GAN, WGAN, DCGAN, WGAN−GP and EBGAN to the above five classification models, such as LDA. In this paper, we compared the change in the classification ability of several typical classification models on different synthetic datasets to quantify the effectiveness of the proposed EBGAN model for EMG feature generation methods. Specifically, in this section, we selected the GAN, WGAN, DCGAN, WGAN−GP and EBGAN models to train on the dataset [
27], and doubled the size of the original dataset. Secondly, the typical classification models were applied to the datasets constructed by each generation model for classification training, and the classification results were compared with the test set. As shown in
Table 6, the classification model trained under the EBGAN augmented set achieved optimal classification results.


