Article

Development of a Methane-Detection System Using a Distributed Feedback Laser Diode and Hollow-Core Photonic Crystal Fiber

1
College of Computer Science and Technology, Jilin University, Changchun 130012, China
2
Department of Electrical and Computer Engineering, Jilin Jianzhu University, Changchun 130012, China
*
Author to whom correspondence should be addressed.
Electronics 2023, 12(4), 838; https://doi.org/10.3390/electronics12040838
Submission received: 1 January 2023 / Revised: 23 January 2023 / Accepted: 31 January 2023 / Published: 7 February 2023
(This article belongs to the Special Issue Applications of Optical Fiber Sensors)

Abstract

:
A highly integrated methane-detection system was experimentally established by using a distributed feedback laser diode and hollow-core photonic crystal fiber. The self-developed circuits with a laser diode and essential optical devices were integrated into an instrument that generated a modulated optical signal in a fiber-coupled gas cell that contained the hollow-core photonic crystal fiber. The instrument could also process the return optical signal that contained the gas concentration information. The experiments demonstrated the good performance of the developed system. In the spectrum tests, the center wavelength of the laser diode could be tuned linearly by controlling the laser’s working temperature and driving current. The second harmonic signal could be extracted in order to reflect the gas concentration. According to the Allan deviation method, the low limit of detection of the system was determined to be 29.52 ppm. In addition, a long-term stability test demonstrated that the system has a good stable performance. The proposed system can be further optimized in order to be applied in paddy fields to detect and monitor the methane concentration in a large area by using the optical fibers.

1. Introduction

Rice paddy fields are the most important food source in China and in many other countries. However, paddy fields are also considered to be one of the largest methane (CH4) emission sources in agriculture [1,2,3]. It is widely known that CH4 is an important type of greenhouse gas with a global warming potential that is 28 times higher than that of carbon dioxide [4,5,6]. According to recent studies, the quantification of CH4 emissions from rice fields has increased in recent years [7,8]. Therefore, it is essential to detect and monitor the methane concentration in paddy fields.
Traditional methods of methane detection in paddy fields include the chamber technique, the micrometeorological method, the soil profile method, and the isotope method. The chamber technique has a good measurement accuracy and is widely applied in many countries, but it is not efficient enough to detect and monitor the large areas of paddy fields in real time. The rest of the methods also have drawbacks that include a low detection accuracy, intrusive detection, and strict requirements for the experimental process [9,10,11,12,13]. Therefore, it is necessary to apply optimized methods to achieve a high accuracy and real-time detection in large-area paddy fields.
The optical gas detection method has been studied worldwide in recent years. In 2021, Catia et al. proposed a new immunosensor based on a plasmonic tilted fiber Bragg grating (TFBG) to achieve rapid and ultrasensitive cortisol detection. In 2022, Maxime et al. proposed an electro-plasmonic biosensor to attract proteins and cells on the surface of a fiber optic probe via controlled biomolecular migration. Compared to the traditional methods of gas detection, this method has numerous advantages that include a high accuracy, good selection, non-toxicity, and non-contact measurement features. In order to detect methane in a large area, optical fibers can also be applied in the detection system [14,15,16,17,18,19]. Hollow-core photonic crystal fiber (HC-PCF) can be applied in signal transmission and gas absorption because gas molecules can be diffused inside the fiber. Among the light sources of lasers, the distributed feedback (DFB) laser diode is suitable for generating an optical signal due to its good tunable features and fiber-coupled structure. Therefore, a methane-detection system containing HC-PCF and a DFB laser diode can be applied to meet the requirements.
This paper proposes a highly integrated methane-detection system that involves a DFB laser diode, HC-PCF, and other self-developed key modules. Compared to our previous work, the hardware and software of the developed circuits were optimized, including the laser temperature control circuit and the algorithm. The photovoltaic conversion circuit containing InGaAs photo diodes was also redesigned to achieve a better performance and greater cost-effectiveness. Meanwhile, the HC-PCF was applied in the system to replace the previous optical reflective parts. By using the wavelength modulation spectroscopy (WMS) technique, second-harmonic signals were extracted to determine the gas concentration. The proposed system can be applied for large-area methane detection in paddy fields or in other applications.

2. Theory and System Structure

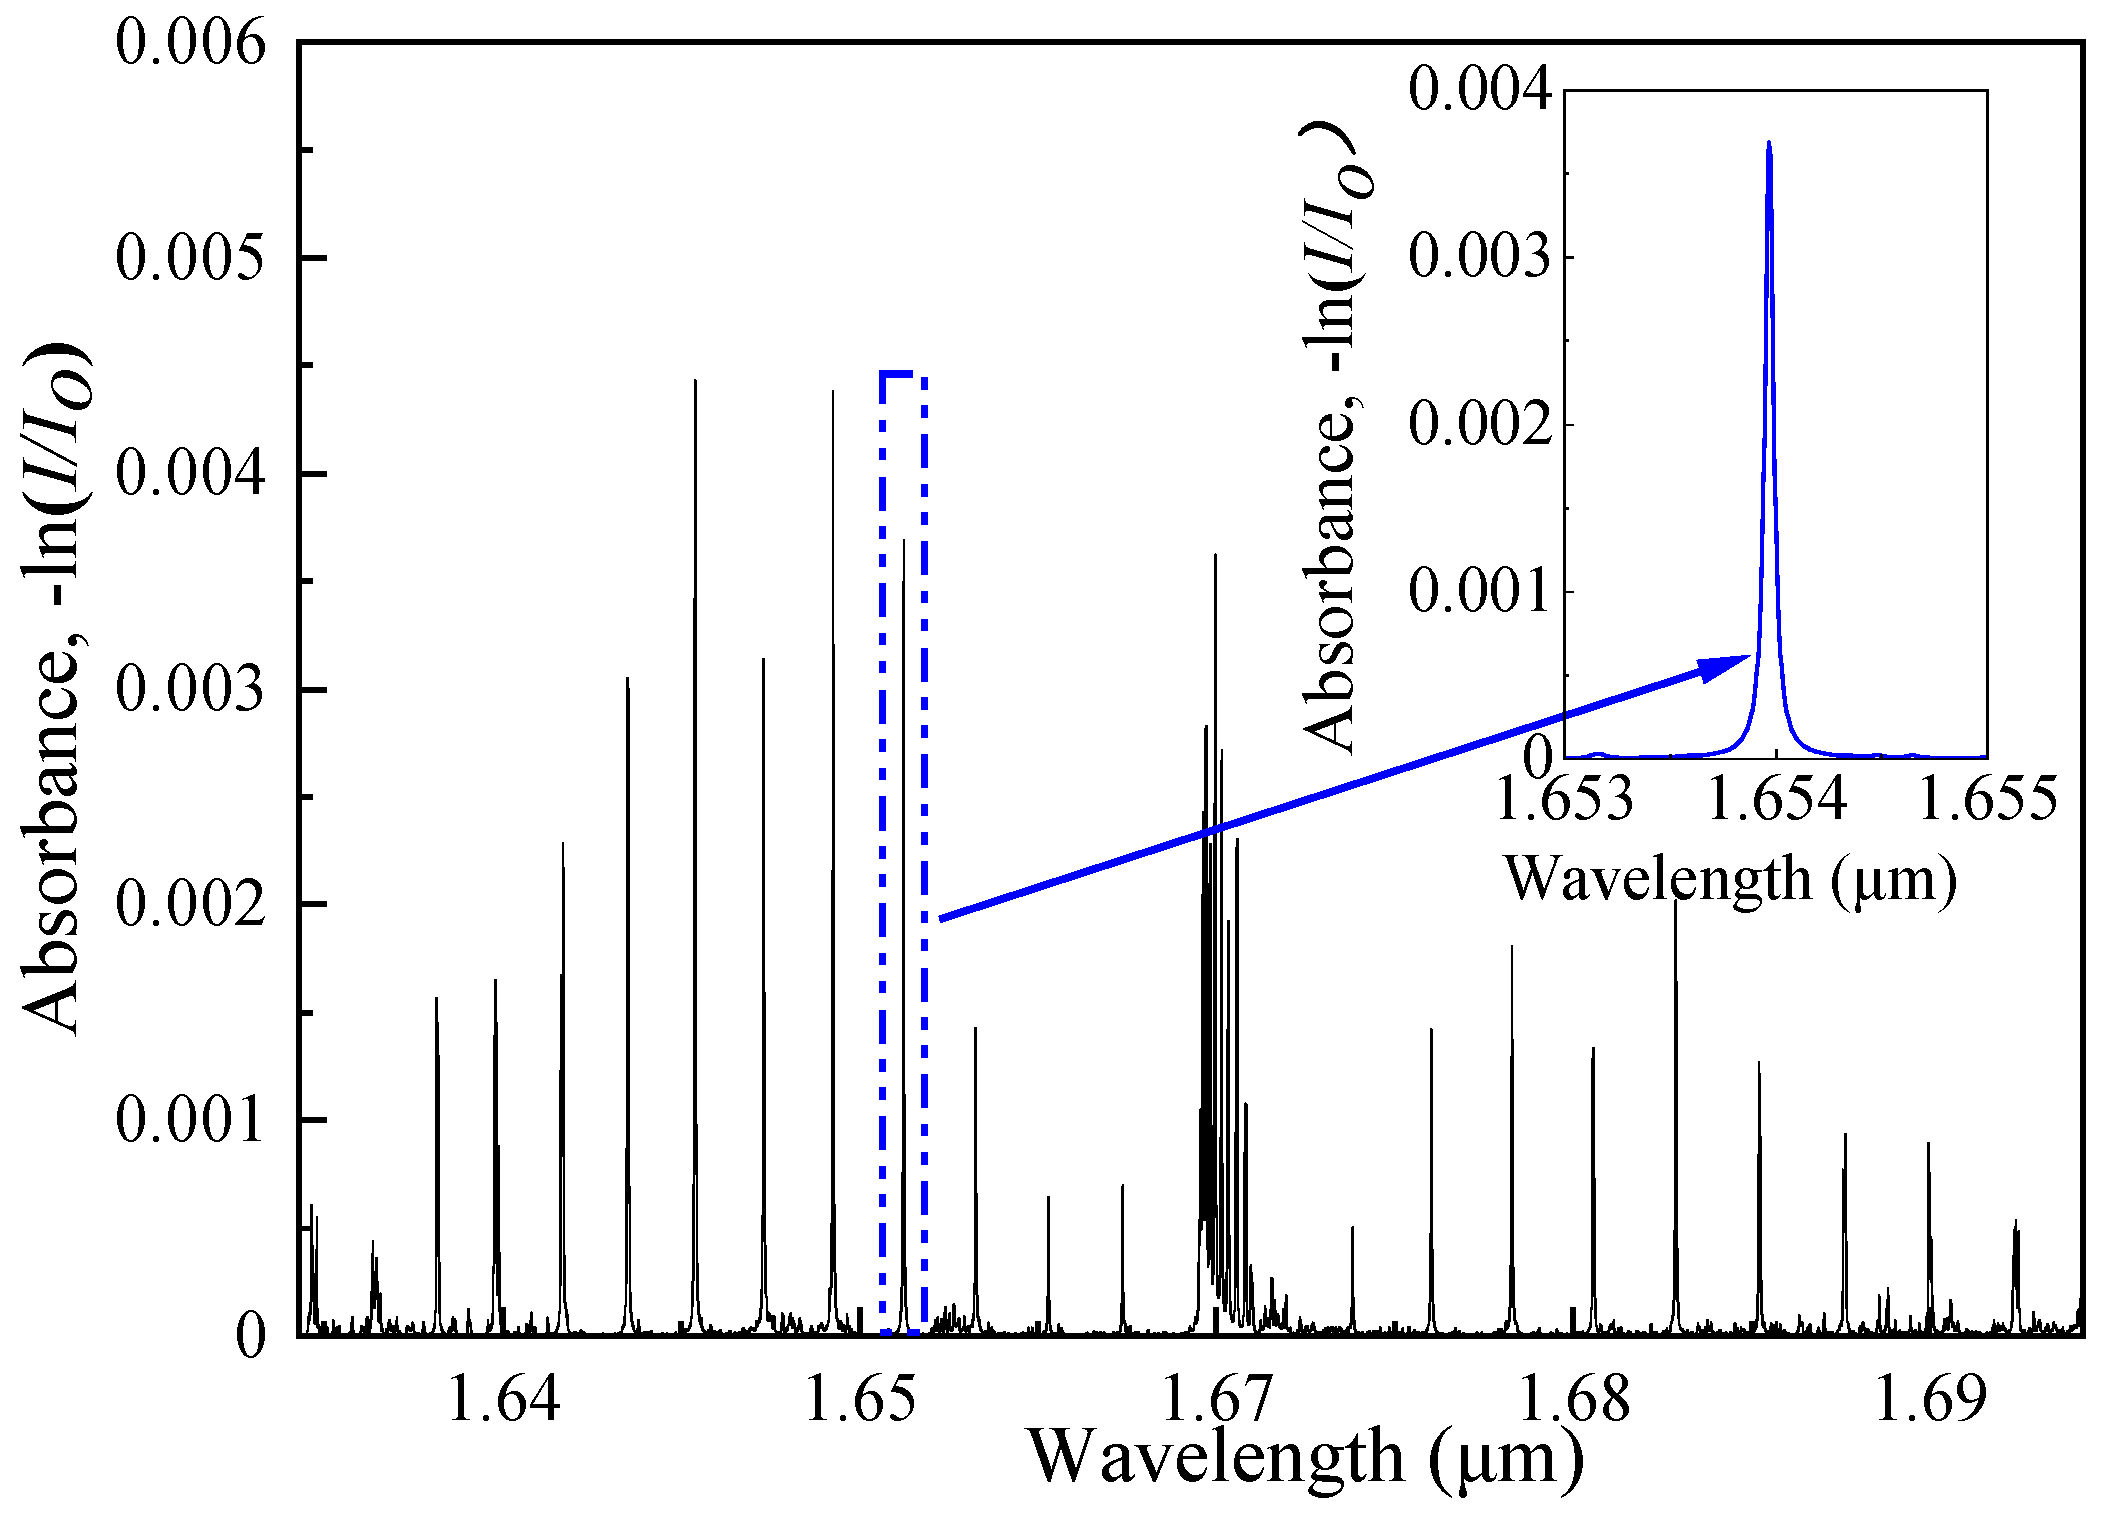
2.1. Infrared Absorption of CH4

According to the Beer–Lambert law, infrared absorption phenomenon will occur when the particulate frequency wavelength of light radiates through the corresponding gas [20,21,22]. In this study, the light source had a center wavelength at 1654 nm where there was an absorption line of methane, as shown in Figure 1. This absorption line was located in the near-infrared region, and the optical signal could be transmitted through fibers in this waveband. Therefore, the remote sensing of methane could be achieved by using fibers due the good transmission performance. In addition, H2O and CO2 could also be ignored at this absorption line. According to the HITRAN database, the absorption intensity of such gases is much weaker than CH4 at this absorption line [23,24,25]. Therefore, the accuracy of the methene detection could be guaranteed.

2.2. System Structure

The experimental schematic of the proposed methane-detection system is shown in Figure 2. There are two parts in this system, which are the self-developed instrument and the gas cell. First, the electrical circuits, DFB laser, and partial optical parts are integrated in this standalone instrument. Its power consumption was measured as about 7 W during the experiments. Then, there is a hollow-core photonic crystal fiber inside the gas cell. The optical signal is transmitted to the gas cell and is back to the instrument after absorption. The gas cell can be filled in standard methane gas through the gas inlet and gas outlet terminals.
The self-developed instrument contains many circuits and optical parts. A digital signal processor (DSP) is applied as the main controller to set the laser’s temperature through a temperature controller. Meanwhile, it also controls the current modulator circuit to drive the DFB laser. In this current modulator circuit, a digital-to-analog (DAC, AD5541) and a direct digital synthesizer (DDS, AD9851) are applied to generate ramp wave and sine wave signals, respectively. Under the temperature and current control, the emitting beam of the DFB laser is split by a fiber optic beam splitter (FOBS). The two power-equaled beams are identified as the reference signal, which is directly fiber linked to the photodiode (PD) module via an optical attenuator (OA), and the absorbed signal, which propagates through the gas cell and returns to the PD module. The PD module contents two of the same InGaAs photodiodes. The photovoltaic conversion circuit is self-developed by using amplifier circuits. The subtraction of the reference signal and the absorbed signal is then performed and the result is sent to the DSP through an analog-to-digital (ADC) chip. Finally, the DSP presents the relevant information on an LCD screen embedded on the front panel of the instrument.
The comparisons of this system and our previous work [26] are listed in Table 1. The laser temperature control programs and circuits were optimized in this paper. The stability of this circuit has been promoted. Then, new photodiodes were applied in this system and the active diameter became bigger than before. In the gas cell, there was an optical device with a mirror for light reflecting in our previous work. It is replaced with HC-PCF in the gas cell for light transmission. Additionally, the absorption length becomes 100 cm, which is longer than the previous 40 cm one. Both of the two systems depend on gas diffusion without the need for a gas pump in the gas cell.

2.3. Theories and Equations

The WMS technique has been adopted in this paper. As described in many articles [27,28,29,30,31,32], the fundamental theory of this technique has been described in detail in these articles. In this paper, briefly, the derivation and proof of WMS technique applied in our system has been shown in this section. In the experiments, the DFBL has been stabilized to the absorption peak of the CH4 molecule and a periodic sawtooth signal is generated to tune the frequency of the laser to scan the target absorption line within a certain spectrum. The sawtooth signal can be expressed in one period as:
u s a w t = A s a w + A s a w T s a w t T s a w ,   0 t T s a w
where  A s a w  and  T s a w  are the amplitude and the period of the sawtooth signal, respectively. Additionally, a sinewave signal is expressed as:
u s i n t = A s i n 2 sin ω s i n t
is used to modulate the laser, where  A s i n  and  ω s i n  are the amplitude and the angular frequency of the sinewave signal, respectively. The total driving signal of the DFBL is:
u t = u s a w t + u s i n
Under the operation of  u t , the variation in emitting a wavelength leads to the change in the absorption coefficient  α t , which is dependent on the emitting wavelength of DFBL, expressed as:
α t = α 0 1 + υ 0 + δ u t υ g γ 2
where  υ 0  is the central emitting light wave-number of the laser (determined by its operation temperature),  υ g  is the central absorption wave-number of methane molecule,  α 0  is the light absorption coefficient at  υ 0 γ  is the half-width of the absorption peak at  υ 0 , and  δ  is light wavelength modulation coefficient.
Without absorption, the light intensity received by the NIR detector belonging to the reference channel is:
I r t = n I 0 1 + m u t
where m, n, and I0 are the light modulation coefficient, attenuation coefficient of OA, and the central emitting light intensity, respectively. According to Beer–Lambert law, the light intensity received by the NIR detector belonging to the detection channel can be expressed as follows:
I t t = I 0 1 + m u t e x p [ α t L C ] I 0 1 + m u t 1 α t L C
where L is the optical path length of the open reflective sensing probe, and  C  is the CH4 concentration. After optical-to-electrical conversion and amplification, two electric signals are obtained and can be written as:
u t t = K t D oe t I 0 1 + m u t 1 α t L C
u r t = K r D oe r n I 0 1 + m u t
where  K t  and  D oe t  are the amplifying factor and optical-to-electrical conversion coefficient for the detection channel, respectively, and  K r D oe r  are those for the reference channel. Then, through the subtraction circuit, the differential signal of the absorption signal and the reference signal can be obtained:
u d t = u r t u t t = I 0 1 + m u t K r D oe r n K t D oe t + K t D oe t α t L C
By tuning the value of n of OA, we can obtain  K r D oe r n = K t D oe t . In this case, we obtain:
u d t = I 0 1 + m u t K t D o e t α t L C .
Then, we can use the self-developed orthogonal lock-in amplifier to extract the 1f and the 2f harmonic signals from  u d t . For the 1f harmonic signal, its two orthogonal components can be written as:
A 1 f , t = t T i n t   1 t u d τ s i n ω s i n τ ) d τ A 1 f , t = t T i n t   1 t u d τ c o s ω s i n τ ) d τ
where  T i n t   1  is the integral time, determined by the cutoff frequency of the related low-pass filter. So, the 1f signal can be expressed as:
A 1 f t = A 1 f , 2 + A 1 f , 2
Similarly, the 2f harmonic signal can be achieved as:
A 2 f t = A 2 f , 2 + A 2 f , 2
where
A 2 f , t = t T i n t   2 t u d τ s i n 2 ω s i n τ d τ ,   A 2 f , t = t T i n t   2 t u d τ c o s 2 ω s i n τ d τ
and  T i n t   2  is the integral time, determined by the cutoff frequency of the related low-pass filter. Define the amplitudes of the 1f and 2f harmonic signals as:
Amp A 1 f t = max A 1 f t min A 1 f t
Amp A 2 f t = max A 2 f t min A 2 f t
Generally, the amplitude of the 1f signal is proportional to the mean optical power and that of the 2f signal is determined by both the gas concentration and mean optical power. In order to reduce the effect of the laser current’s variation, the ratio between  Amp A 2 f t  and  Amp A 1 f t  is usually used to characterize the concentration, which can be expressed as:
Amp A 2 f t Amp A 1 f t = F C
where the expression of F can be achieved through a calibration experiment. In the following experiment, the frequencies of the sawtooth signal and sinewave signal are set to be  T s a w = 10  Hz and  T s i n = 5  kHz.

3. Materials and Methods

Compared to our previous work, several key modules, including electrical and optical parts, have been optimized and are proposed in this section. First, for the DFB laser diode, its temperature control circuit has been optimized both in the hardware and algorithm. Then, the photovoltaic conversion circuit with new InGaAs photo diodes are proposed. Finally, the hollow-core photonic crystal fiber is introduced to this detection system. Its features and experiment results are proposed as well.

3.1. Developed Instrument

The self-developed instrument is proposed in the previous section and the internal key modules is shown in Figure 2. This instrument contains a DFB laser which can be tuned to scan across the absorption line at 1654 nm by controlling its temperature and injection current. The laser’s temperature can be set in the control program of the DSP chip and DAC circuit. The temperature control circuit is performed by the AND8831 chip with a peripheral circuit. This controller chip is a highly accurate thermoelectric cooler (TEC) controller. It sets the direction and value of the driving current of the TEC module embedded in the DFB laser in order to increase and decrease its temperature according to the Peltier effect [33,34,35]. By changing the TEC module which is embedded in the DFB laser, the temperature control circuit is able to increase or decrease the heat of the laser diode.
Temperature control for the DFB laser is crucial. First, the center wavelength of the DFB laser is different when temperature varies. The center wavelength of the DFB laser is determined by the refractive index of the grating reflection region inside the DFB laser. Additionally, the refractive index of the grating reflection region is controlled by the temperature. In this way, it is necessary to control the laser’s temperature in order to tune the center wavelength. In addition, the laser’s temperature also needs to be controlled to protect the laser from damage of heat accumulate after long time working or large current injection. In this way, it is necessary to control the laser’s working temperature. In order to control the laser’s temperature accurately, there is a thermistor embedded in the laser to reflect the value of the laser’s temperature. Additionally, a TEC module is also embedded in the laser to heat or cool the laser diode. Therefore, the relationship between the thermistor and temperature needs to be obtained to achieve accurate temperature control.
The relationship between the laser’s temperature and the NTC resistance inside the DFB laser is shown in Equation (18). In this equation,  R T H  is the value of the resistance at temperature T2 and R is the value of the resistance at room temperature, expressed as T1. The value of B, which is 3930 K, is a kelvin temperature and is provided by the laser’s supply company. In the temperature control program, all of the temperature values are expressed in centigrade temperature. In this way, the kelvin temperature needs to be converted as shown in Equation (19). Meanwhile, the relationship between the resistance and temperature was also obtained by using the R-T conversion table of the thermistor inside the laser. The relationship is shown in Figure 3 in this way from 10 °C to 60 °C. By using the software of Origin, the relationship equation is obtained as shown in Equation (20). These equations are applied in the program to control the laser’s temperature through analog and digital circuits. The performance of the laser’s temperature control was evaluated by experiments of spectral tests, which are shown in the next section, and the results demonstrate a good performance.
R T H = R × E X P B × 1 T 1 1 T 2
t = T 273.15
R = 31.07534 × E X P 0.04925 × T + 0.95597

3.2. Photovoltaic Conversion

The photovoltaic conversion circuit has been optimized in the paper compared to our previous work. First, there were two photodiodes which were supplied by JUDSON company (Type J22-18I-500U) in the system to perform photovoltaic conversion. The active size diameter of each photodiode is 0.5 mm and the peak responsivity is 0.9 A/W. In this paper, the two photodiodes were replaced by two InGaAs photodiodes supplied by a local brand. The cost decreases about 91% and the performance are almost the same. The active size diameter is bigger than before, which is 0.8 mm. There is only one drawback of the new photodiodes, which is the dark current. It is still acceptable because the difference is only 0.5 nA between the new photodiodes and the old ones. The common input noise of the two channels can be eliminated by the difference circuit.
The circuit of photovoltaic conversion has been optimized as well to ensure a good stability. Two accurate amplifiers, which are AD810, are applied in this circuit to perform a photovoltaic conversion with the two InGaAs photodiodes. The optimized circuit has been tested to evaluate the performance, as shown in Figure 4a. The programed optical signal with frequencies of 1 kHz and 2 kHz was converted by this circuit to an electrical signal in order to be processed in the following circuits. It can be seen in Figure 4a that the oscilloscope shows the obtained signal of the photovoltaic conversion circuit.
There are two optical channels in the system. One is the absorption signal, which contains gas concentration information, the other is the adjustable reference channel, which contains an optical part to the weakened reference signal to the power level of the absorption signal. The difference in the two signals can be obtained by using a subtracter circuit. Then, the difference signal, which is an analog signal, is converted to a digital signal by using an analog–digital converter circuit. Then, the converted digital signal can be processed and be stored by the main controller chip (TMS320F28335). The main controller chip can be programed by using Code Composer Studio, which was provided by Texas Instrument. There is another pulse signal generated by the laser-driving module to the main controller chip. The frequency of this signal is equal to the laser modulation signal in order to extract the harmonic signals which contains information of the gas concentration. In this system, the frequency of this modulation is set as 5 kHz. There are also several peripheries’ circuits, including the screen, keys, and the serial interface connected to the main controller chip. In the future, software based on LabVIEW will be developed in order to achieve a more convenient and clearer interface. Additionally, the essential data can be displayed and stored on a PC as well. The current process of a photovoltaic conversion and signal processing schematic is shown in Figure 4b.

3.3. Hollow-Core Photonic Crystal Fiber

The HC-PCF is applied in this system for optical signal transmission and gas absorption. Its effective spectrum scope is 1490–1680 nm. Due to the center wavelength of the DFB laser diode being 1654 nm, the fiber is suitable for the system. The separation distance of the holes on this fiber is about 3.8 μm and the transmission loss of the optical signal is 25 dB/km. Over 95% of the optical power is located in the core, which can be filled with trace gas. Additionally, the bend loss can be negligible. The core diameter is 10 μm and the diameter of the PCF region is 70 μm. The cladding pitch, cladding diameter, and coating diameter are 3.8 μm, 120 μm, and 220 μm, respectively. The coating material is single layer acrylate.
The fiber is fixed in the gas cell as shown in Figure 2. It is connected to a fiber terminal device which is also linked to the common single-mode optical fiber outside of the gas cell. The optical signal loss caused by this connection is about −0.8 dB by the experiments. In this way, the common single-mode optical fiber links the proposed instrument and the gas cell together in the laboratory. The simulation experiment was carried out to evaluate the performance of this optical structure, including the optical power loss in numerous nodes as shown in Figure 5a. It can be seen that most of the optical power can be maintained in the fiber. However, on the other side, the diffusion speed of methane from the gas cell to the HC-PCF is slow, as shown in Figure 5b. The gas concentration is balanced in a period of 70 min by using the dynamic gas supplementation method of standard gas. In order to decrease the diffusion time, the fiber can drill small holes by using special devices. In this way, the optical power loss needs to be tested to satisfy the system requirement of the signal strength.

4. Results and Discussion

4.1. Spectrum Tests

The DFB laser diode needs to be controlled accurately in order to guarantee that the center wavelength can meet the requirements of the detection system. Therefore, its working temperature and current must be tested corresponding to the center wavelength. One the one hand, a laser’s working temperature determines the wavelength significantly. Meanwhile, the stability of the temperature is also very important to the laser to avoid wavelength shifting. One the other hand, the driving current can also shift the center wavelength in a small scope. Therefore, the laser’s working temperature is set at first and then the current is determined by spectrum tests.
The CH4 DFB laser was tested by using Fourier transform infrared spectroscopy (NICOLET 6700 FT-IR), which was provided by the Thermo Scientific company, as shown in Figure 6. It can be seen that the center wavelength of the DFB laser can be controlled linearly by changing the temperature while the current is stable, depicted in Figure 6a. The laser driving current is set as 70 mA and the coefficient is about 0.115 nm/°C. It also can be seen that the optical power slightly decreases while the temperature increases. The unit of the wavenumber, which is the reciprocal of the wavelength, is adopted in the software of the spectrometer. It is adopted for the X-axis in the software as shown in the figure. Then, the current increases while the laser’s working temperature is stable; the results are shown in Figure 6b. There are five sets of spectrum tests, the temperature was set from 18 to 26 °C, and the step was 2 °C. Then, the current increases from 40 mA to 80 mA. It can be seen that the center wavelength increases linearly as well in this range. The coefficient is about 0.014 nm/mA at 25 °C through tests and a calculation. Therefore, the temperature can determine the wavelength greater than the current’s effort. The spectrum tests also prove the stability and effectiveness of the self-developed circuits.

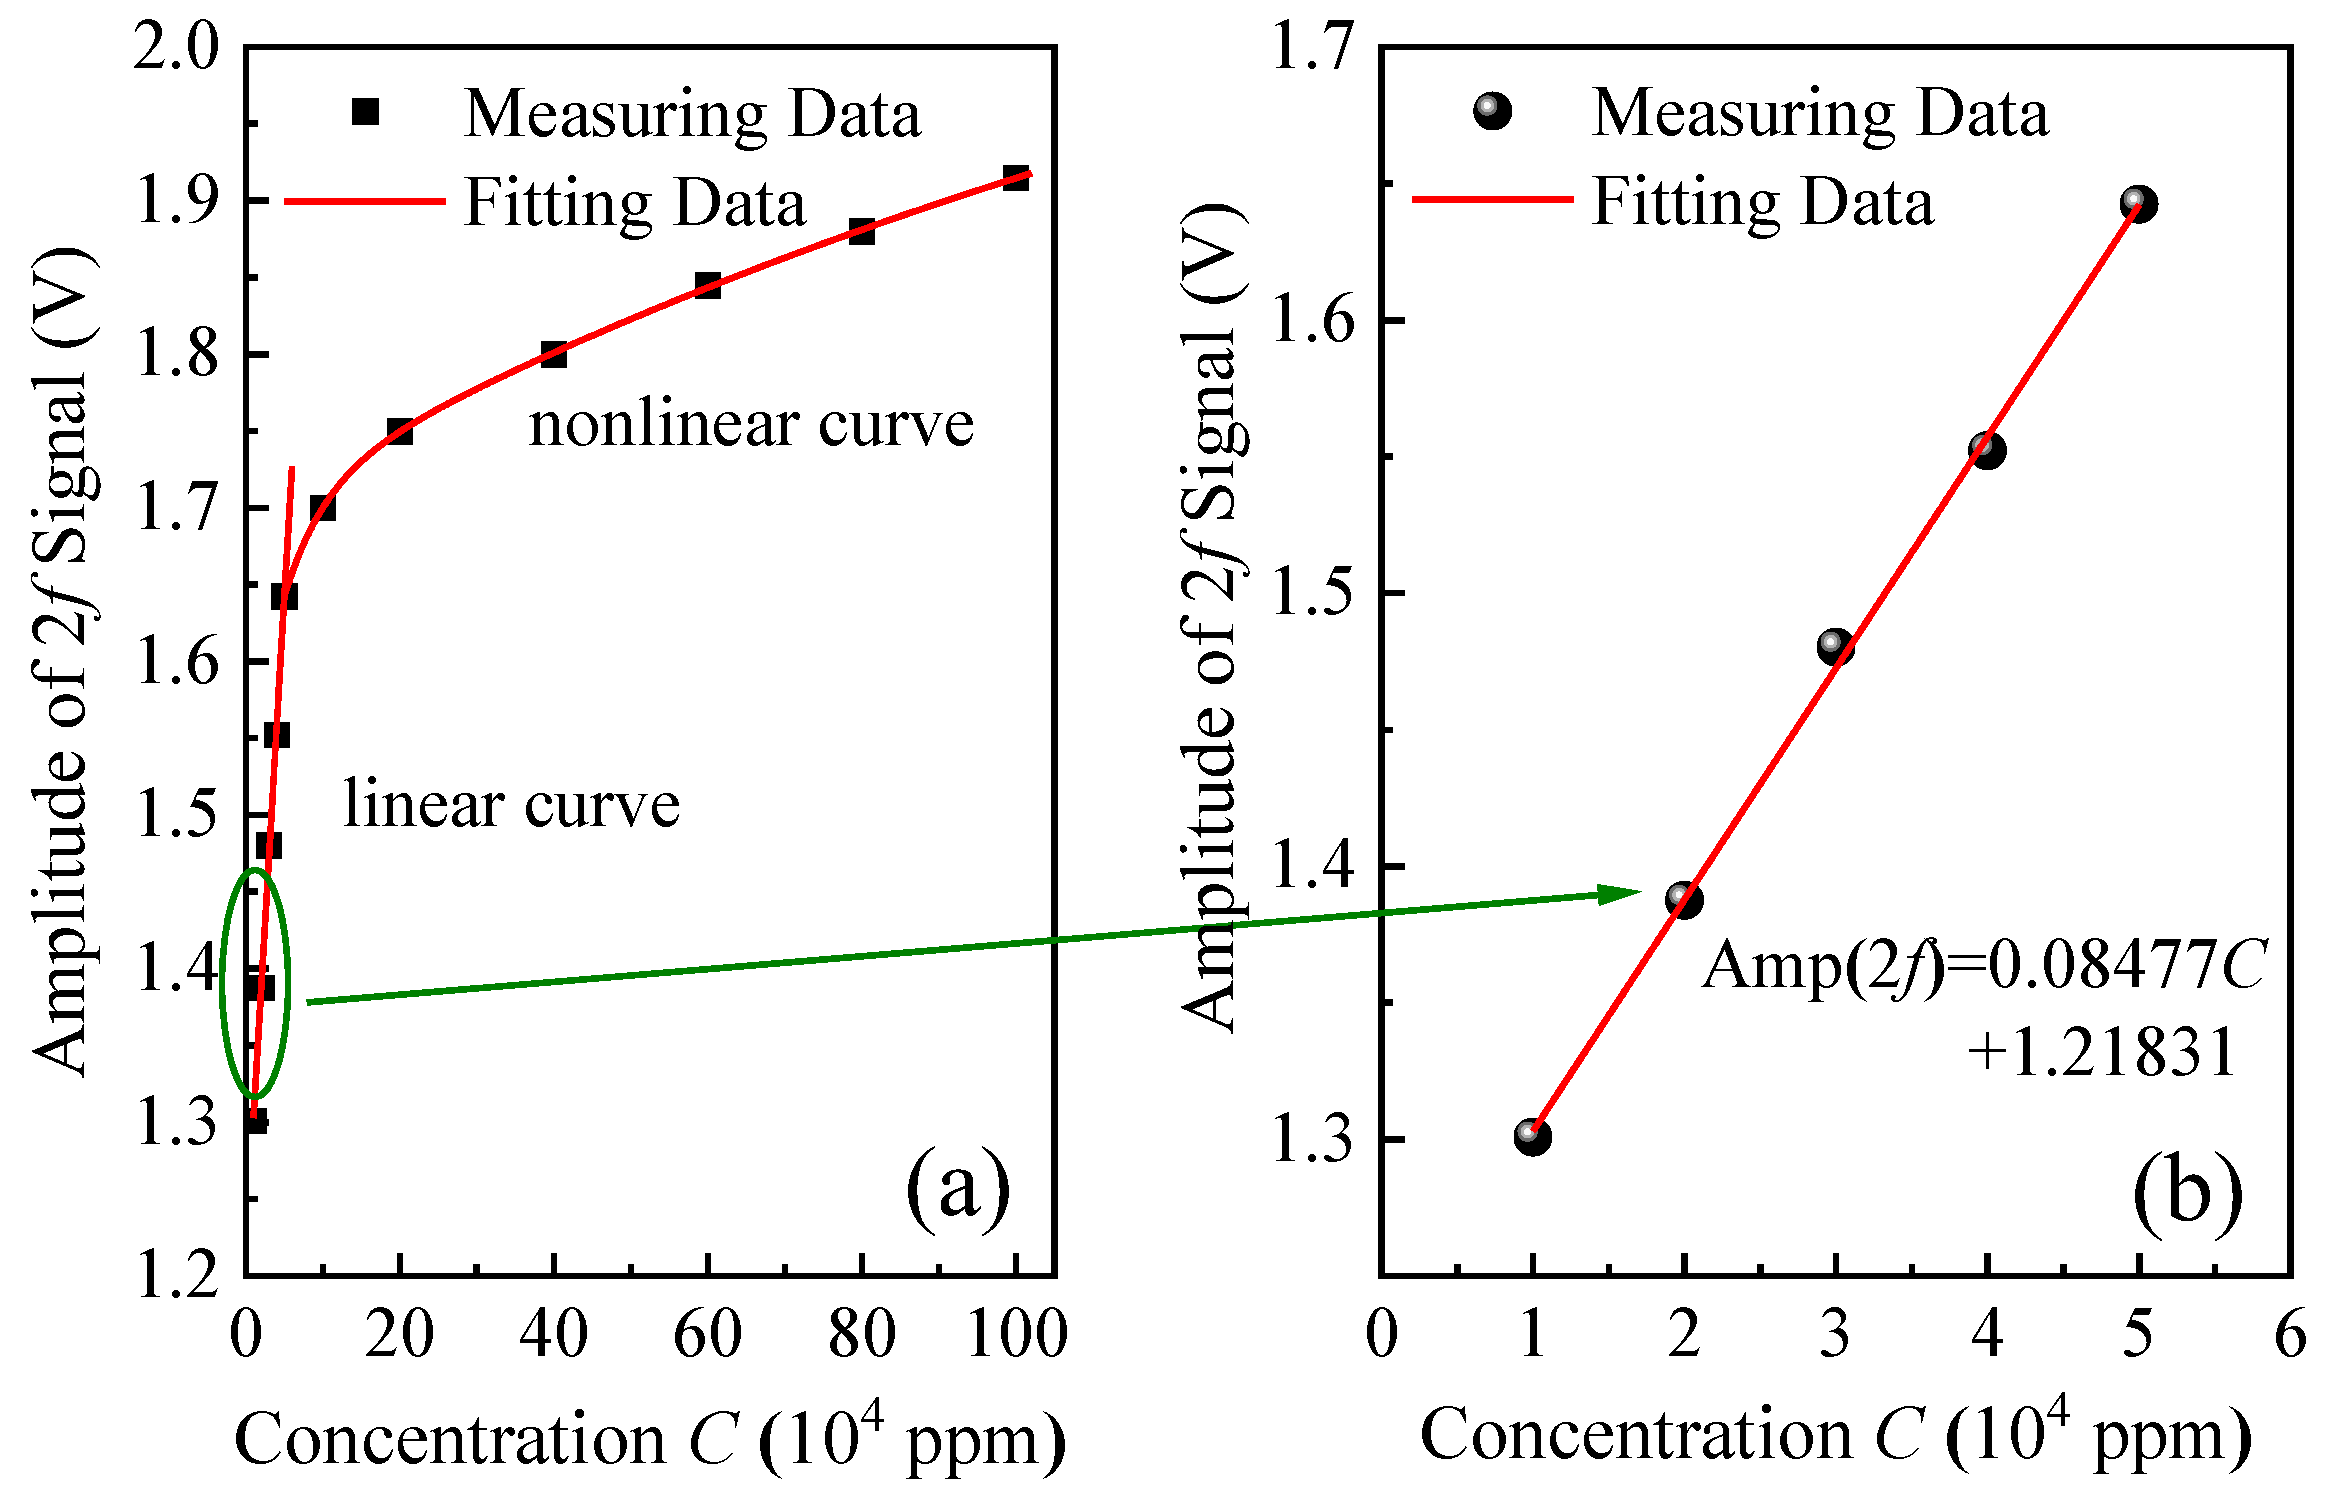
4.2. Calibration Tests

The calibration of the developed system is very important for several reasons. First, the relationship of the gas concentration and the key electrical signal, which is the 2nd harmonic signal in this system, can be obtained. In this way, the unknown concentration can be calculated by using the corresponding electrical signal. Then, the dynamic gas supply system can be tested during the calibration tests. In this system, highly pure N2 gas and standard methane gas were mixed by using special instruments. The stability of the gas supply system was tested by monitoring the stability of the obtained harmonic signals. Finally, the relationship equation was obtained and has been programed on the DSP chip. Therefore, a further calculation and analysis can be performed based on the experiments and simulations.
The calibration tests were carried out to match the harmonic signal and the standard gas concentration as shown in Figure 7. The total calibration scope is from 0 to 100% of the methane concentration. It can be seen in the figure that there are a linear zone and a nonlinear zone in the whole scope. In the calibration process, the detection error was measured in different concentration scopes. In the low concentration scope from 0 ppm to 1000 ppm, the average system error is about 2.3%. This is caused by numerous reasons, including the gas flow, sampling accuracy, and system noise. The relative error becomes smaller in the high concentration scope. The relative error decreases to 1% and it is even lower when it is measured in the concentration scope from 1 × 10⁴ ppm to 2 × 10⁴ ppm. In the low concentration scope, the relationship between the harmonic signal and the standard gas concentration is linear, as shown in Figure 7b. Additionally, the curve becomes nonlinear when the concentration increases, as shown in Figure 7a. In this way, the relationship can be obtained by using the software of Origin and the equation is shown in the figure. This equation can be applied in the following experiments in order to determine the gas concentration by using the detected harmonic signals.

4.3. Stablity Tests

The stability tests were carried out to investigate the performance of the detection system after calibration. Standard methane gas of 2 × 10⁴ ppm was supplied to the system for the stability tests. In 1000 s, the 2nd harmonic signal was obtained 1000 times and the results are shown in Figure 8a. It can be seen that the voltage is fluctuated in the range from −3.8 to + 4.8 mV. According to the relationship equation in this zone, the slope of the function can be obtained as 0.4801 mv/10 ppm, so the following equation can be obtained as shown in Equation (21). In this equation, the fluctuation in the gas can be calculated by the obtained harmonic signal.
Δ C = Δ Amp [ A 2 f t ] ( 0.4081   mV / 10   ppm ) ,   C = 2 × 10 4   ppm
The fluctuation in the gas concentration is shown in Figure 8b. It can be seen that the fluctuation scope is from −92 to +118 ppm at the standard gas of 2 × 10⁴ ppm. Therefore, the maximum fluctuation value can be calculated as 0.59%, which is acceptable for the system. The experiment results suggest the good stability performance of the developed detection system.

4.4. Standard Gas Tests

Based on the calibration tests, the relationship between the gas concentration and harmonic signals can be obtained. During the experiments, the standard methane gas and the pure nitrogen gas were mixed by using the mass flowmeter, precision gas valve, and seal tubes. The mass flowmeter needs to be warmed up before the detection experiments in order to ensure the accuracy of the mixed gas. The nitrogen gas was firstly applied to wash the gas cell and lined tubes. Then, the mixed gas was piped to the gas cell and some of the mixed gas diffuses into the HC-PCF through litter holes. The harmonic signal was maintained to a certain value while the gas concentration became stable in the gas cell.
In the concentration range from 0 to 104 ppm, the relationship can be expressed in Equation (22). In this equation, C is the gas concentration. In the experiment, the gas concentration decreases and the harmonic signals were measured continually. The relationship between the gas concentration and the harmonic signal is in agreement with this equation in this range.
Amp [ A 2 f t ] = 1749.07 + 0.04081 C ( mV ) ,   0   ppm C 10 4   ppm
The gas concentration decreases continually by using the dynamic gas supply method and the 2nd harmonic signal curve is obtained at 600 ppm, as shown in Figure 9. It can be seen that the noise becomes large but the harmonic signal can be extracted as well. In order to evaluate the detection performance of the system, the gas cell was filled in pure N2 gas and the standard deviation was calculated as 31.2 ppm.

4.5. Allan Deviation

The Allan deviation test was carried out to evaluate the detection limit of the system as shown in Figure 10. The environmental factors were measured with the experimental parameters in order to grantee the repeatability of the developed detection system. The room temperature was 22 °C at 1 atm of standard atmosphere pressure. The driving current of the DFB laser is from 40 to 80 mA. The laser’s working temperature was set as 22 °C by using the developed temperature control circuit. The integral time is 1~700 s. The Allan deviation is 29.52 ppm at the integral time of 1 s. This result is very close to the 31.2 ppm which was obtained by the standard deviation. The low detection limit is about 5 ppm while the integral time is 40~70 s. During the experiments, the center wavelength of the DFB laser diode scans across the absorption line at 10 Hz and the modulation sine signal is 5 kHz. Average harmonic results were obtained every 10 s. The main noise of the system is determined as the temperature shifts of the system and environmental noise. The low detection limit can be further enhanced while the environmental noise is low. The Allan deviation results proves the accuracy and effectiveness of the developed system.

5. Conclusions

The integrated methane-detection system is proposed in this paper. This system involves a distributed feedback laser, two InGaAs photodiodes, hollow-core photonic crystal fiber, and essential self-developed circuits, including a laser temperature control circuit and photovoltaic conversion circuit. The electrical parts and most optical parts are integrated in one instrument with screen and keys for the operation. This standalone instrument can also process the return optical signal which contains gas concentration information. The experiments demonstrate the good performance of the developed system. In the spectrum tests, the center wavelength of the laser diode can be tuned linearly by controlling the laser’s working temperature and driving current. The second harmonic signal can be extracted in order to reflect the gas concentration. According to the Allan Deviation method, the low limit of detection of the system is determined as 29.52 ppm. The stability tests show that the fluctuation of the system is about 0.59%, which demonstrates that the system has a good stability performance. The proposed system can be further optimized in order to be applied in the paddy field to detect and monitor the methane concentration in a large area by using the optical fibers.

Author Contributions

Conceptualization, B.L. and Q.W. (Qingpeng Wang); methodology, B.L.; software, Q.W. (Qizheng Wang); validation, Q.W. (Qizheng Wang) and Y.H.; formal analysis, B.L.; investigation, Q.W. (Qingpeng Wang); resources, Y.H.; data curation, B.L.; writing—original draft preparation, Q.W. (Qingpeng Wang); writing—review and editing, B.L.; visualization, Q.W. (Qizheng Wang); supervision, B.L.; project administration, B.L.; funding acquisition, B.L. All authors have read and agreed to the published version of the manuscript.

Funding

B.L. receives fundings via a contribution agreement with the National Natural Science Foundation of China (No. 51672103), the Science and Technology Department of Jilin Province of China (S202110191131), Changchun Development and Reform Commission (2022C045), and the Education Department of Jilin Province of China (JJKH20230334KJ).

Data Availability Statement

The data presented in this study are available on request from the corresponding author. The data are not publicly available due to restrictions from the university.

Acknowledgments

The authors wish to express their gratitude to Jilin University, Jilin Jianzhu University, the National Key Technology R&D Program of the Ministry of Science and Technology of China for the generous support of this work.

Conflicts of Interest

The authors declare no conflict of interest.

References

  1. Gupta, P.K.; Gupta, V.; Sharma, C.; Das, C.; Purkait, N.; Adhya, T.K.; Pathak, H.; Ramesh, R.; Baruah, K.K.; Venkatratnam, L.; et al. Development of methane emission factors for indian paddy fields and estimation of national methane budget. Chemosphere Environ. Toxicol. Risk Assess. 2009, 74, 590–598. [Google Scholar] [CrossRef]
  2. Mujiyo, M.; Sunarminto, B.H.; Hanudin, E.; Widada, J.; Syamsiyah, J. Methane production potential of soil profile in organic paddy field. Soil Water Res. 2017, 12, 212–219. [Google Scholar]
  3. Xie, B.H.; Zhou, Z.X.; Zheng, X.H.; Zhang, W.; Zhu, J.G. Modeling methane emissions from paddy rice fields under elevated atmospheric carbon dioxide conditions. Adv. Atmos. Sci. 2010, 27, 100–114. [Google Scholar] [CrossRef]
  4. Rizzo, A.; Boano, F.; Revelli, R. Groundwater impact on methane emissions from flooded paddy fields. Adv. Water Resour. 2015, 83, 340–350. [Google Scholar]
  5. Ma, J.L.; Chen, W.Y.; Niu, X.J.; Fan, Y.M. The relationship between phosphine, methane, and ozone over paddy field in Guangzhou, China. Glob. Ecol. Conserv. 2019, 17, e00581. [Google Scholar] [CrossRef]
  6. Palmer, P.I.; Feng, L.; Lunt, M.F.; Parker, R.J.; Bosch, H.; Lan, X.; Lorente, A.; Borsdorff, T. The added value of satellite observations of methane for understanding the contemporary methane budget. Philos. Trans. R. Soc. A 2021, 379, 20210106. [Google Scholar] [CrossRef]
  7. Yang, S.S.; Chang, H.L. Methane emission from paddy fields in Taiwan. Biol. Fertil. Soils 2001, 33, 157–165. [Google Scholar] [CrossRef]
  8. Xu, X.Y.; Zhang, M.M.; Xiong, Y.S.; Yuan, J.F.; Shaaban, M.; Zhou, W.; Hu, R.G. The influence of soil temperature, methanogens and methanotrophs on methane emissions from cold waterlogged paddy fields. J. Environ. Manag. 2020, 264, 110421. [Google Scholar] [CrossRef]
  9. Wang, J.M.; Murphy, J.G.; Geddes, J.A.; Winsborough, C.L.; Basiliko, N.; Thomas, S.C. Methane fluxes measured by eddy covariance and static chamber techniques at a temperate forest in central Ontario, Canada. Biogeosciences 2013, 10, 4371–4382. [Google Scholar]
  10. Zou, J.W.; Huang, Y.; Zheng, X.H.; Wang, Y.S.; Chen, Y.Q. Static opaque chamber-based technique for determination of net exchange of CO2 between terrestrial ecosystem and atmosphere. Chin. Sci. Bull. 2004, 49, 81–388. [Google Scholar] [CrossRef]
  11. Gao, Z.R.; Ni, J.Z.; Yan, J.Q.; Cao, W.X. Water-efficient sensing method for soil profiling in the paddy field. Int. J. Agric. Biol. Eng. 2018, 11, 207. [Google Scholar] [CrossRef]
  12. Zhang, G.B.; Zhang, W.X.; Yu, H.Y.; Ma, J.; Xu, H.; Yagi, K. Fraction of CH4 oxidized in paddy field measured by stable carbon isotopes. Plant Soil 2015, 389, 349–359. [Google Scholar]
  13. Zhang, G.B.; Ji, Y.; Liu, G.; Ma, J.; Xu, H. Carbon isotope fractionation during CH4 transport in paddy fields. Sci. China Earth Sci. 2014, 57, 1664–1670. [Google Scholar] [CrossRef]
  14. Bai, Y.R.; Yu, H.J.; He, C.J.; Miao, Z.W.; Dou, R.; Zhang, Y.T.; Lin, X.C. A numerical simulation of a near-infrared three-channel trace ammonia detection system using hollow core photonic crystal fiber. Optik 2021, 227, 166006. [Google Scholar] [CrossRef]
  15. Dar, S.A.; Qazi, G. Investigation and comparison of sensitivity of LiDAR to laser physical parameters at 750 m using different detection techniques. Optik 2020, 219, 165281. [Google Scholar]
  16. Davis, N.M.; Hodgkinson, J.; Francis, D.; Tatam, R.P. Sensitive detection of methane at 3.3 µm using an integrating sphere and Interband Cascade Laser. InOptical Sens. Detect. IV 2016, 9899, 133–138. [Google Scholar]
  17. Jiao, Y.X.; Fan, H.J.; Gong, Z.F.; Yang, K.; Shen, F.Y.; Chen, K.; Mei, L.; Peng, W.; Yu, Q.X. Trace CH4 Gas Detection Based on an Integrated Spherical Photoacoustic Cell. Appl. Sci. 2021, 11, 4997. [Google Scholar]
  18. Catia, L.; Sonia, O.P.; Nelia, A.; Maxime, L.; Mederic, L.; Florinda, M.C.; Joao, L.P.; Christophe, C.; Carlos, M. Cortisol in-fiber ultrasensitive plasmonic immunosensing. IEEE Sens. J. 2021, 21, 3028–3034. [Google Scholar]
  19. Maxime, L.; Mederic, L.; Marc, D.; Karima, C.; Erik, G.; Christophe, C. Electro-plasmonic assisted biosensing of proteins and cells at the surface of optical fiber. Biosens. Bioelectron. 2023, 220, 114867. [Google Scholar]
  20. Battuvshin, G.; Menzel, L. Adjusting line quantum sensing to improve leaf area index measurements and estimations in forests. MethodsX 2022, 9, 101805. [Google Scholar]
  21. Han, S.W.; Kim, M.W. An information entropy interpretation of photon absorption by dielectric media. Opt. Commun. 2020, 454, 124447. [Google Scholar] [CrossRef]
  22. Lizama, C.; Murillo-Arcila, M.; Trujillo, M. Fractional Beer-Lambert law in laser heating of biological tissue. AIMS Math. 2022, 7, 14444–14459. [Google Scholar]
  23. Krainova, V.P.; Smirnov, B.M. Description of Emission Processes in Molecular Gases Based with the HITRAN Database. J. Exp. Theor. Phys. 2019, 129, 9–18. [Google Scholar]
  24. Stankiewicz, K.; Stolarczyka, N.; Jóźwiak, H.; Thibault, F.; Wcisło, P. Accurate calculations of beyond-Voigt line-shape parameters from first principles for the He-perturbed HD rovibrational lines: A comprehensive dataset in the HITRAN DPL format. J. Quant. Spectrosc. Radiat. Transf. 2021, 276, 107911. [Google Scholar] [CrossRef]
  25. Skinner, F.M.; Gordon, L.E.; Hill, C.; Hargreaves, R.J.; Lockhart, K.E.; Rothman, L.S. Referencing Sources of Molecular Spectroscopic Data in the Era of Data Science: Application to the HITRAN and AMBDAS Databases. Atoms 2020, 8, 16. [Google Scholar] [CrossRef]
  26. Bin, L.; Chuantao, Z.; Huifang, L.; Qixin, H.; Weilin, Y.; Yu, Z.; Jiaoqing, P.; Yiding, W. Development and measurement of a near-infrared CH4 detection system using 1.654 m wavelength-modulated diode laser and open reflective gas sensing probe. Sens. Actuators B Chem. 2016, 225, 188–198. [Google Scholar]
  27. Wen, Y.P.; Strand, C.L.; Hanson, R.K. Analysis of laser absorption gas sensors employing scanned-wavelength modulation spectroscopy with 1f-phase detection. Appl. Phys. B 2020, 126, 17. [Google Scholar]
  28. Li, G.L.; Dong, E.; Ji, W.H. A Near-Infrared Trace CO2 Detection System Based on an 1,580 nm Tunable Diode Laser Using a Cascaded Integrator Comb (CIC) Filter-Assisted Wavelength Modulation Technique and a Digital Lock-in Amplifier. Front. Phys. 2019, 7, 199. [Google Scholar]
  29. Cong, M.L.; Zhang, S.S.; Wang, Y.D.; Liang, D.C.; Zhou, K.P. Design of a Laser Driver and Its Application in Gas Sensing. Appl. Sci. 2022, 12, 5883. [Google Scholar] [CrossRef]
  30. Roy, A.; Chakraborty, A.L. AIntensity modulation-normalized calibration-free 1f and 2f wavelength modulation spectroscopy. IEEE Sens. J. 2020, 20, 12691–12701. [Google Scholar] [CrossRef]
  31. Qiao, S.D.; Ma, Y.F.; He, Y.; Yu, X.; Zhang, Z.H.; Tittel, F.K. A Sensitive Carbon Monoxide Sensor Based on Photoacoustic Spectroscopy with a 2.3 µm Mid-Infrared High-Power Laser and Enhanced Gas Absorption. Sensors 2019, 19, 3202. [Google Scholar]
  32. Genner, A.; Martín-Mateos, P.; Moser, H.; Lendl, B. A Quantum Cascade Laser-Based Multi-Gas Sensor for Ambient Air Monitoring. Sensors 2020, 20, 1850. [Google Scholar]
  33. Abbas, Z.; Shah, A.N.; Hassan, M.T.; Ali, M.S.; Din, Q.U.; Naseem, B.; Asghar, A.; Haider, A. Performance evaluation of novel solar-powered domestic air cooler with Peltier modules. J. Mech. Sci. Technol. 2020, 34, 4797–4807. [Google Scholar]
  34. Umberto, L.; Giulia, G. Seebeck–Peltier Transition Approach to Oncogenesis. Appl. Sci. 2020, 10, 7166. [Google Scholar]
  35. Wang, J.; Cao, P.G.; Li, X.J.; Song, X.X.; Zhao, C.; Zhu, L. Experimental study on the influence of Peltier effect on the output performance of thermoelectric generator and deviation of maximum power point. Energy Convers. Manag. 2019, 200, 112074. [Google Scholar]
Figure 1. Selected CH4 absorption line at 1654 nm in the near-infrared region.
Electronics 12 00838 g001
Figure 2. Developed near-infrared methane-detection system with HC-PCF gas cell.
Electronics 12 00838 g002
Figure 3. The relationship between the resistance and laser temperature is obtained by using the R-T conversion table of the thermistor inside laser.
Electronics 12 00838 g003
Figure 4. Performance test of the optimized photovoltaic conversion circuit with two InGaAs photodiodes (a) and the schematic of the photovoltaic conversion and signal processing (b).
Electronics 12 00838 g004
Figure 5. Simulation test of the optical structure (a) and the diffusion test of standard gas (b).
Electronics 12 00838 g005
Figure 6. Spectrum tests of temperature shifting while current is stable (a) and current changing while temperature is fixed (b).
Electronics 12 00838 g006
Figure 7. The calibration tests are shown in the whole scope (a). The linear part in the low concentration zone, which is pointed by a green line, can be fitted by an equation shown in (b).
Electronics 12 00838 g007
Figure 8. Stability test of the system by obtaining the harmonic signal from −3.8 to 4.8 mV shown as stars (a). Gas concentration fluctuation calculation can be obtained by calculations from −92 to 118 ppm shown as stars (b).
Electronics 12 00838 g008
Figure 9. Standard gas tests of the detection system while the methane concentration is 600 ppm.
Electronics 12 00838 g009
Figure 10. Allan deviation of the developed system under N2 gas in the gas cell.
Electronics 12 00838 g010
Table 1. Comparison between the proposed system and the previous system.
RefsTemperature Control MethodActive Size Diameter of PhotodiodesAbsorption LengthGas Cell
[26]Analog PID ControlInGaAs 0.5 mm40 cmOpen and reflective, without the need of gas-pump
This paperOptimized programs and circuitsInGaAs 0.8 mm100 cmHC-PCF fixed in a gas cell
Disclaimer/Publisher’s Note: The statements, opinions and data contained in all publications are solely those of the individual author(s) and contributor(s) and not of MDPI and/or the editor(s). MDPI and/or the editor(s) disclaim responsibility for any injury to people or property resulting from any ideas, methods, instructions or products referred to in the content.

