Article

Accuracy of Using a New Semi-Automated Software Package to Diagnose Osteoporotic Vertebral Fractures in Adults

by
Fawaz F. Alqahtani
1,2,* and
Paul A. Bromiley
3
1
Department of Radiological Sciences, College of Applied Medical Sciences, Najran University, Najran P.O. Box 1988, Saudi Arabia
2
Health Research Centre, Najran University, Najran P.O. Box 1988, Saudi Arabia
3
Division of Informatics, Imaging Sciences Research Group, University of Manchester, Manchester M13 9PL, UK
*
Author to whom correspondence should be addressed.
Electronics 2023, 12(4), 847; https://doi.org/10.3390/electronics12040847
Submission received: 3 January 2023 / Revised: 3 February 2023 / Accepted: 6 February 2023 / Published: 8 February 2023
(This article belongs to the Special Issue Role of Artificial Intelligence in Healthcare and Biomedical Systems)

Abstract

:
We evaluate the accuracy of a semi-automated software package for annotating landmark points on vertebral body outlines in dual-energy X-ray absorptiometry (DXA) images of adults. The aim of the study was to determine the accuracy with which a non-expert radiographer could use the software to annotate vertebrae in support of osteoporotic vertebral fracture diagnosis and grading. In this study, 71 GE Lunar iDXA vertebral fracture assessment (VFA) images were used. Annotations of landmark points on vertebral body outlines were performed by four observers. Annotations consisted of 33 points on each vertebra between T4 and L4 inclusive; 11 on the upper end-plate, 8 on the anterior side, 11 on the lower end-plate, and 3 on the pedicle (429 points for each image). There were a total of 19 (26%) cases in which the non-expert radiographer made vertebral level assignment errors. All of them were one level too high (with L1 identified as T12). Their median error for landmark annotation was 1.05 mm, comparable to the 0.8 mm error achieved by the expert radiographers. Normative mean vertebral body heights vary between approximately 22 mm at T4 and 36 mm at L4 in females. Mild, moderate, and severe vertebral fragility fractures are defined through vertebral body height reductions of 20%, 25%, and 40%, respectively. Therefore, the annotation accuracy of the software when used by a non-expert was 14–23% of the height reduction indicative of a mild fracture. We conclude that, even when used by non-experts, the software can annotate vertebral body outlines accurately enough to support vertebral fragility fracture diagnosis and grading.

1. Introduction

Osteoporosis is a metabolic bone disorder characterised by reductions in bone mineral density and microarchitectural quality, with a consequent reduction in bone strength and increase in the risk of fractures [1]. It is relatively common, with one-in-three women and one-in-five men worldwide over the age of 50 years suffering osteoporotic fractures at some stage in their life [1]. Osteoporotic vertebral fractures (VFs) are a common early manifestation of the disease, but are under-diagnosed compared with fractures in other parts of the body such as the wrist, hip, and legs. Patients with the latter typically present clinically with severe pain and deformity, often following a fall. Conversely, VFs may be asymptomatic, which may mean that a number of patients do not present clinically [2]. Techniques to detect and analyse vertebral fractures include conventional radiography, computed tomography (CT), magnetic resonance imaging (MRI), and dual energy X-ray absorptiometry DXA [3,4]. Semi-automated software programs provide a quick and easy method for identifying and reporting vertebral deformities from radiographs and other X-ray-based technology such as DXA images [5,6,7,8,9]. AVERT® is a new semi-automated software package made available through a collaboration between Optasia Medical Ltd. (www.optasiamedical.com, access on 1 January 2023), a medical image analysis company who developed and distributed the earlier SpineAnalyzer package, a software tool for VF diagnosis in adults, and the University of Manchester (UoM). Currently, the software is in use at the UoM (for adults) and the University of Sheffield (for children) for development purposes. Ultimately, all parties aim to develop a fully automated computer-aided system for identifying VFs, in both adults and children, in dual X-ray absorptiometry vertebral fracture assessment (DXA VFA) images. Optasia Medical provided the author with a license for AVERT® for training purposes.
Before software that automates or semi-automates the diagnosis and grading of VFs can be used in practice, a health economic study demonstrating that the utility of such software outweighs its costs will be required. One consideration will be the costs associated with end-user training. Previous literature (e.g., [5,6,7,10,11,12,13]) has focused on the ultimate accuracy limits of such software when used by experts. To the best of our knowledge, the topic of training requirements has not previously been addressed. Therefore, in this study, we evaluated the accuracy with which a non-expert radiographer, with minimal training, could use the software for vertebral body height measurement in DXA VFA images of adults in order to support vertebral fracture diagnosis and grading using the Genant definitions for mild, moderate, and severe fractures [14]. The aim was to provide baseline data on training requirements, by determining whether an inexperienced user, with minimal training, could achieve accuracy comparable to expert users, or whether they achieved a significantly lower accuracy, demonstrating a need for significant (and potentially expensive) training programmes.

2. Materials and Methods

2.1. Ethical Approval

Local Research Ethics Committee approval was obtained for the main study [15] from which the images were drawn. Informed patient consent was not separately required for this study because the data were analysed retrospectively and anonymously.

2.2. Subjects

Herein, 71 anonymised DXA VFA (Lunar iDXA: GE Healthcare, Madison, WI, USA) images from a previous study [14] were used retrospectively. All images enrolled for this study were from females attending a local clinic for DXA BMD measurement at the Manchester Royal Infirmary, for whom the referring physician had requested VFA, from August to October 2014.

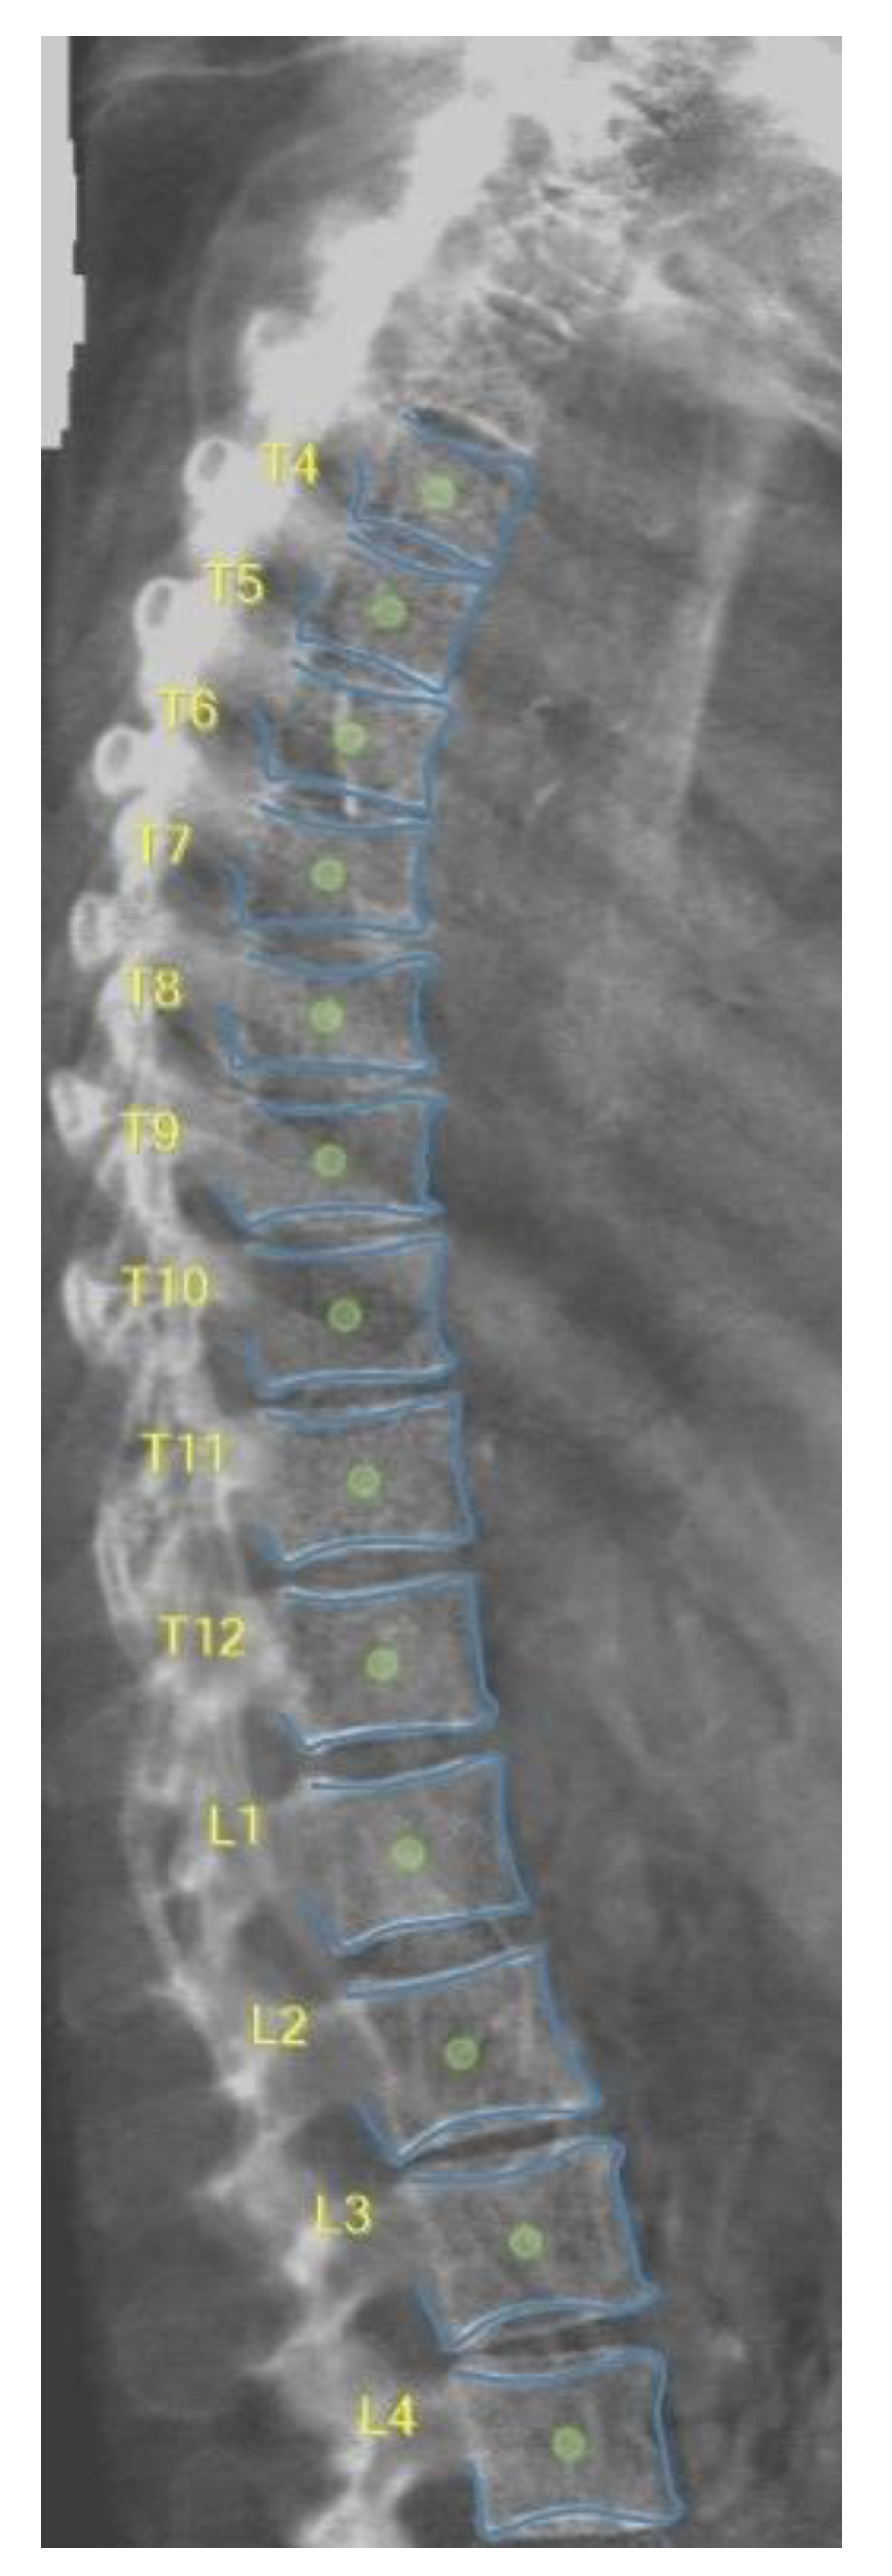
2.3. DXA-VFA Image Annotation

The AVERT software partially automated the process of vertebral body outline annotation. All annotators used laptops with 17-inch screens and consumer grade laptop mice to prevent any effects from using different hardware. The user began the process by manually annotating the centre of each vertebral body from T4 to L4 inclusive. The user identified the relevant vertebral levels through comparison with other structures including the iliac crest and the ribs. The software used the vertebral body centre points as an initialisation for the fitting of a random forest regression voting constrained local model (RFRV-CLM), producing a high-resolution annotation of 33 landmark points defining a contour on the outline of each vertebra; 11 on the upper end-plate, 8 on the anterior side, 11 on the lower end-plate, and 3 on the pedicle (429 points for each image; see Figure 1). A full description of the model and its training is provided in [15].
A manual correction process was then implemented in order to correct any fitting failures. To make the correction process easier, the software includes two levels of automation during correction. First, five of the points, including the points on the corners of the vertebral body, act as reference points (Figure 2). Moving a reference point applies a scaled movement to the positions of all points between that and the neighbouring reference points. Second, the RFRV-CLM model is refitted after each manual point movement, updating the contour to the best fit that passes through any points the user has manually identified; these remain fixed during this process. Therefore, by correcting the reference points to obtain an approximate alignment of the contour defined by the landmark points to the edges of the vertebral body, and then correcting any remaining misalignments, an accurate outline can be obtained without having to manually annotate every point.
Following annotation of the outline, the user entered a diagnosis for each annotated vertebra. The software provides an interface to simplify this, with a drop-down list allowing the user to identify the presence of an osteoporotic VF or a number of common non-fracture deformities including Schmorl’s nodes, Scheuermann’s disease, Cupid’s bow, diffuse idiopathic skeletal hyperostosis (DISH), and spondylosis, although free-text entry is also supported. In the case of a VF, the user also enters a fracture type (biconcave, wedge, or crush) and grade (mild, moderate, or severe) according to the Genant definitions [16] (Figure 3). All diagnoses default to “Normal”, so diagnoses need to be entered only for abnormal vertebrae. The average time to perform the annotation and diagnosis for each image was approximately 30 min.
Four independent observers participated in the study, performing the annotation and diagnosis procedure described above. Three (two radiographers, M.M. and I.H., and one radiologist, E.K.) were expert users of the software and provided a baseline for annotation accuracy. One, a radiographer (F.A.), was provided only with basic training in how to operate the software, comprising two hours of instruction on the operation of the software itself. The aim of the study was to assess the accuracy achieved by this non-expert observer. In order to support an assessment of diagnostic accuracy, diagnoses were provided for all vertebrae between T4 and L4, inclusive, by an expert radiologist.

2.4. Statistical Analysis

Data analysis was performed using Python 2.7 through the SageMath 8.8 software.

3. Results

3.1. Vertebral Level Assignment

Level assignment errors in the FA annotations were identified through comparison with assignments provided by the expert radiologist (J.A.). There were a total of 19 (26%) cases with vertebral level assignment errors, and all of them were one too high (with L1 identified as T12). In a further two cases, they failed to annotate T4. F.A. used a different method for vertebral level identification compared with the other annotators, focusing on the position of the 12th rib to identify L1 rather than using the iliac crest to identify L3, and this may account for the decrease in accuracy (see Figure 4).

3.2. Point-Wise Landmark Annotation Accuracy

To evaluate the accuracy of landmark point annotation, the annotations from each observer were compared to the centroid calculated from the other three observers, as well as to the mean for each point taken over all images. In order to allow direct comparison between all observers, images with vertebral level assignment errors or incomplete annotations were omitted from the analysis. The results are shown in Figure 5 and Figure 6, which show the results for all observers and the results for F.A. and E.K only. The peaks in the figures represent the points on the pedicle, which were less accurately annotated by all observers. As the distribution of annotation errors across points was non-Gaussian, the average error was calculated as the median, across all points in all images for each observer, and is shown in Table 1. The two experienced radiographers had median errors of 0.8 and 0.81 mm, while the inexperienced radiographer had a median error of 1.05 mm. To determine whether these differences were significant, a Mann–Whitney U-test was applied to compare the results of F.A. to each of the other sets of results (Table 2). The F.A. results were used to calculate U1; in comparisons of U1 and U2, larger values indicate a smaller annotation error. The p-value gives the probability that the two lists of results are drawn from the same distribution. The inexperienced radiographer was not significantly more accurate than the radiologist, but was significantly less accurate than the experienced radiographers. However, the effect size was small. The difference in median error between the best and worst observer was 0.27 mm, corresponding to approximately 1 pixel in these images (scalings were 4.05 pixels/mm in both dimensions).

3.3. Image-Wise Annotation Accuracy

To determine whether training effects increased the accuracy of the inexperienced radiographer during the annotation process, the image-wise errors were also analysed. Furthermore, images with disagreements in the vertebral level assignments might represent lower-quality images or those with pathology, so it was undesirable to exclude these. Therefore, all images were included in the analysis, by matching vertebrae across annotators. The radiologist’s level assignments were used as the gold standard, and the centroid of each vertebra was calculated from their annotations. These were compared to the annotations from M.M., I.H., and F.A. using a point-in-polygon algorithm; the vertebrae in each of these sets of annotations that contained the E.K. centroid represented the set of matched vertebrae. Where disagreements in vertebral level assignment or incomplete annotation occurred, a full set of annotations did not exist for one of the vertebrae in the corresponding image. These vertebrae were omitted from the analysis for that image; otherwise, the error calculation was the same as described above, comparing the F.A. annotations for each point to the centroid of the other observers. The results are shown in Figure 7. A Kruskal–Wallis test comparing the first and last images indicated no significant difference in annotation accuracy (H = 3.07, p = 0.0798).

3.4. Diagnostic Accuracy

Table 3 shows the confusion matrix comparing the diagnoses produced by F.A. to the gold-standard diagnoses from J.A., the expert radiologist. The Genant et al. definitions [16] are used to define mild, moderate, and severe VFs. Disagreements between the normal and non-fracture deformity classes can be ignored in most cases, owing to the lack of a clear definition of when to explicitly classify spondylosis. The results indicate a slight tendency to under-diagnose fracture grade. Nevertheless, for simple fracture (mild, moderate and severe) versus non-fracture (normal or non-fracture deformity) diagnosis, the inexperienced radiographer achieved a sensitivity of 77.1%, a specificity of 93.5%, and an accuracy of 97.0%. The Cohen’s kappa for the agreement on diagnosis of fracture versus non fracture, and moderate or severe fracture versus other classes, is given in Table 4 for each observer compared with the gold standard diagnoses.

4. Discussion

For the purposes of vertebral level assignment by F.A., the first vertebral body not associated with ribs was labelled as L1, while the lowermost vertebral body associated with ribs was labelled as T12. However, the other annotators focused on checking the position of the iliac crest and sacrum, as the 12th rib cannot always be seen (Figure 4). As stated in the study of Alqahtani et al., this limitation can be solved by having a marker placed adjacent to an agreed vertebra so that all observers recognise the same vertebral levels [7].
Analysis of the point-wise errors showed that the inexperienced radiographer was significantly less accurate than the experienced radiographers, but had similar accuracy to the radiologist. However, the difference in median error between the best and worst observer corresponded to 0.27 mm or approximately 1 pixel. Normative mean vertebral body heights vary between approximately 22 mm at T4 and 36 mm at L4 in females [11]. Mild, moderate. and severe vertebral fragility fractures are defined through vertebral body height reductions of 20%, 25%, and 40%, respectively, in the Genant et al. grading scheme (Figure 3) [16]. Therefore, the annotation accuracy of the software when used by a non-expert was 14–23% of the height reduction indicative of a mild fracture, and the difference in annotation accuracy between expert and non-expert annotators was 3.75–6.0%. Although this difference was statistically significant, the effect size was small compared with the height changes being measured. Analysis of the image-wise errors indicated no training effects on the F.A. results during the course of the study, which may be accounted for by the limited number of images included in the study, and thus the limited scope for such effects to become apparent.
In terms of diagnostic accuracy, measured using Cohen’s kappa, all observers had substantial agreement with the gold-standard (k > 0.61) when diagnosing moderate or severe fractures, although the radiologist achieved almost perfect agreement (k > 0.81). Agreement was worse when mild fractures were included in the fracture class, demonstrating the difficulty of differentiating between these fractures and non-fracture deformity. As expected, the inexperienced radiographer performed worse than the radiologist or the experienced radiographers, indicating that training on differentiating between fractures and non-fracture deformity is more important than training on vertebral body outline identification and subsequent height measurement.
The study had two main limitations. First, the rating of only one expert radiologist was used as a reference, rather than a consensus of multiple radiologists. Ideally, the latter would be used to minimise the possibility of errors in the gold-standard annotation. More significantly, the analysis was based on annotations of a limited number of images by a single inexperienced user. The results are thus preliminary and further work will be required with a much larger group of inexperienced users to fully evaluate the utility of semi-automated annotation packages in osteoporotic VFs. However, the results presented in this study indicate that the inexperienced user was able to achieve an accuracy that was minimally different to that achieved by expert users. This indicates that the end-user training requirements imposed by the deployment of such software packages will be minimal and limited to the operation of the software itself, rather than the process of identifying the vertebral body outline. The one exception to this conclusion identified in the study was the issue of vertebral level identification. If the use case for the software requires accurate identification of the vertebral level of any fracture, as opposed to identification of the presence of a fracture, then end-user training on the identification of vertebral levels will be required.

5. Conclusions

In conclusion, this study evaluated the annotation and diagnostic accuracies achieved by an inexperienced radiographer using the AVERT® software on DXA images of adults. Annotation accuracies were comparable to those achieved by experienced users, indicating that sufficient accuracy can be achieved for vertebral fracture grading with minimal training. The results indicate that training on vertebral level identification and initial fracture identification is more important than training on vertebral outline annotation if such software is to be used in clinical practice. While preliminary, the results provide baseline data for future health economic studies on semi-automated software packages for the identification and grading of osteoporotic vertebral fractures.

Author Contributions

Conceptualization, F.F.A. and P.A.B.; methodology, F.F.A. and P.A.B.; software, P.A.B.; validation, F.F.A. and P.A.B.; formal analysis, P.A.B.; investigation, P.A.B.; resources, P.A.B.; data curation, F.F.A. and P.A.B.; writing—original draft preparation, F.F.A.; writing—review and editing, F.F.A. and P.A.B.; visualization, P.A.B.; supervision, F.F.A.; project administration, F.F.A.; funding acquisition, F.F.A. All authors have read and agreed to the published version of the manuscript.

Funding

This research was funded by the Deanship of Scientific Research at Najran University under the National Research Priorities funding program (grant no NU/NRP/MRC/11/2). Part of this research was funded by the NIHR Invention for Innovation (i4i) programme (grant no. II-LB-0216-20009). This study also presents independent research supported by the Health Innovation Challenge Fund (grant no. HICF-R7-414/WT100936), a parallel funding partnership between the Department of Health and Wellcome Trust. The views expressed are those of the author and not necessarily those of the NHS, NIHR, Department of Health, or Wellcome Trust.

Data Availability Statement

The datasets generated or analyzed during the study are available from the corresponding author upon reasonable request.

Acknowledgments

The authors are thankful to the Deanship of Scientific Research at Najran University for funding this work under the National Research Priorities funding program (grant no NU/NRP/MRC/11/2). The authors also would like to thank all observers who have annotated these images. Part of this research was funded by the NIHR Invention for Innovation (i4i) programme (grant no. II-LB-0216-20009). This study also presents independent research supported by the Health Innovation Challenge Fund (grant no. HICF-R7-414/WT100936), a parallel funding partnership between the Department of Health and Wellcome Trust. The views expressed are those of the author and not necessarily those of the NHS, NIHR, Department of Health, or Wellcome Trust.

Conflicts of Interest

The authors declare no conflict of interest.

References

  1. A Clynes, M.; Harvey, N.C.; Curtis, E.M.; Fuggle, N.R.; Dennison, E.M.; Cooper, C. The epidemiology of osteoporosis. Br. Med. Bull. 2020. [Google Scholar] [CrossRef]
  2. Cooper, C.; Atkinson, E.J.; O'Fallon, W.M.; Melton, J.L., III. Incidence of clinically diagnosed vertebral fractures: A population-based study in Rochester, Minnesota. J. Bone Miner. Res. 1992, 7, 221–227. [Google Scholar]
  3. Guglielmi, G.; Diacinti, D.; van Kuijk, C.; Aparisi, F.; Krestan, C.; Adams, J.E.; Link, T.M. Vertebral morphometry: Current methods and recent advances. Eur. Radiol. 2008, 18, 1484–1496. [Google Scholar] [CrossRef] [PubMed]
  4. Alqahtani, F.F.; Offiah, A.C. Diagnosis of osteoporotic vertebral fractures in children. Pediatr. Radiol. 2018, 49, 283–296. [Google Scholar] [CrossRef] [PubMed]
  5. Kim, Y.M.; Demissie, S.; Eisenberg, R.; Samelson, E.J.; Kiel, D.P.; Bouxsein, M.L. Intra-and inter-reader reliability of semi-automated quantitative morphometry measurements and vertebral fracture assessment using lateral scout views from computed tomography. Osteoporos. Int. 2011, 22, 2677–2688. [Google Scholar] [CrossRef] [PubMed]
  6. Birch, C.; Knapp, K.; Hopkins, S.; Gallimore, S.; Rock, B. SpineAnalyzer™ is an accurate and precise method of vertebral fracture detection and classification on dual-energy lateral vertebral assessment scans. Radiography 2015, 21, 278–281. [Google Scholar] [CrossRef]
  7. Alqahtani, F.; Messina, F.; Kruger, E.; Gill, H.; Ellis, M.; Lang, I.; Broadley, P.; Offiah, A. Evaluation of a semi-automated software program for the identification of vertebral fractures in children. Clin. Radiol. 2017, 72, 904.e11–904.e20. [Google Scholar] [CrossRef]
  8. Crabtree, N.; Chapman, S.; Högler, W.; Hodgson, K.; Chapman, D.; Bebbington, N.; Shaw, N. Vertebral fractures assessment in children: Evaluation of DXA imaging versus conventional spine radiography. Bone 2017, 97, 168–174. [Google Scholar] [CrossRef] [PubMed]
  9. Cawthon, P.M.; Haslam, J.; Fullman, R.; Peters, K.W.; Black, D.; Ensrud, K.E. Methods and reliability of radiographic vertebral fracture detection in older men: The osteoporotic fractures in men study. Bone 2014, 67, 152–155. [Google Scholar] [CrossRef] [PubMed]
  10. Alqahtani, F.F.; Crabtree, N.J.; Bromiley, P.A.; Cootes, T.; Broadley, P.; Lang, I.; Offiah, A.C. Diagnostic performance of morphometric vertebral fracture analysis (MXA) in children using a 33-point software program. Bone 2020, 133, 115249. [Google Scholar] [CrossRef] [PubMed]
  11. Leidig-Bruckner, G.; Minne, H. The spine deformity index (SDI): A new approach to quantifying vertebral crush fractures in patients with osteoporosis. In Vertebral; Wiley: San Francisco, CA, USA, 1988. [Google Scholar]
  12. Osteoporosis Research Group. Fracture in Osteoporosis; University of California: Los Angeles, CA, USA, 1995; pp. 235–252. [Google Scholar]
  13. Alqahtani, F.F.; Messina, F.; Offiah, A.C. Are semi-automated software program designed for adults accurate for the identification of vertebral fractures in children? Eur. Radiol. 2019, 29, 6780–6789. [Google Scholar] [CrossRef] [PubMed] [Green Version]
  14. Bromiley, P.A.; Kariki, E.P.; Adams, J.E.; Cootes, T.F. Classification of Osteoporotic Vertebral Fractures Using Shape and Appearance Modelling. In Proceedings of the Computational Methods and Clinical Applications in Musculoskeletal Imaging: 5th International Workshop, MSKI 2017, Held in Conjunction with MICCAI 2017, Quebec City, QC, Canada, 10 September 2017. [Google Scholar] [CrossRef]
  15. Bromiley, P.A.; Adams, J.E.; Cootes, T. Automatic Localisation of Vertebrae in DXA Images Using Random Forest Regression Voting. In Proceedings of the Computational Methods and Clinical Applications for Spine Imaging: Third International Workshop and Challenge, CSI 2015, Held in Conjunction with MICCAI 2015, Munich, Germany, 5 October 2015. [Google Scholar] [CrossRef]
  16. Genant, H.K.; Wu, C.Y.; van Kuijk, C.; Nevitt, M.C. Vertebral fracture assessment using a semiquantitative technique. J. Bone Miner. Res. 1993, 8, 1137–1148. [Google Scholar] [CrossRef]
Figure 1. Lateral DXA VFA illustrating all 33 semi-automatically identified points used to outline each vertebral body produced by AVERT®.
Electronics 12 00847 g001
Figure 2. The five reference points, one on each corner and the fifth one on the pedicle of the vertebra.
Electronics 12 00847 g002
Figure 3. Selected lateral spine dual energy X-ray absorptiometry scans from a series of patients demonstrate the semiquantitative visual grading system of Genant et al. [16]: (a) normal vertebrae, (b) deformed vertebrae (spondylosis), (c) grade 1 (mild fracture, 20–25% reduction of vertebral height), (d) grade 2 (moderate fracture, 25–40% reduction of vertebral height), (e) grade 3 ( severe fracture, >40% reduction of vertebral height), and (f) vertebra where beginner radiographer misdiagnosed (giving grade 2 instead of 3).
Electronics 12 00847 g003
Figure 4. An example DXA VFA image that had an expert disagreement in the identification of T12 and/or L1.
Electronics 12 00847 g004
Figure 5. Mean point-wise errors for all observers.
Electronics 12 00847 g005
Figure 6. Mean point-wise errors for only E.K. and F.A.
Electronics 12 00847 g006
Figure 7. Box-and-whisker plots of errors by image for F.A., comparing each landmark to the centroid of the other annotators and taking the median across each image.
Electronics 12 00847 g007
Table 1. Median errors for each observer across all points.
ObserverMedian Error (mm)
E.K.1.07
I.H.0.81
M.M.0.80
F.A.1.05
Table 2. Comparison between F.A. and the other observers (E.K., I.H., and M.M.) using Mann–Whitney U-test.
U1U2UU_muU_sdZp
F.A. vs. E.K.98,90985,13285,13292,020.53629.61.900.029
F.A. vs. I.H.43,380140,66143,38092,020.53629.613.4<0.001
F.A. vs. M.M.36,238147,80336,23892,020.53629.615.4<0.001
Table 3. The confusion matrix for F.A. diagnoses, compared to the gold-standard from J.A.
F.A.
J.A.NormalNon-Fracture DeformityMild VFModerate VFSevere VF
Normal48123936120
Non-Fracture Deformity1322220
Mild VF34370
Moderate VF13162
Severe VF000810
Table 4. Inter-rater agreement (Cohen’s kappa) for each observer compared to the gold standard, for the diagnosis of mild, moderate, and severe fractures vs. non-fractured vertebrae (normal or non-fracture deformity).
ObserverFracture vs. Non-FractureModerate/Severe Fracture vs. Other Classes
E.K.0.7670.829
I.H.0.6460.753
M.M.0.7160.709
F.A.0.5040.651
Disclaimer/Publisher’s Note: The statements, opinions and data contained in all publications are solely those of the individual author(s) and contributor(s) and not of MDPI and/or the editor(s). MDPI and/or the editor(s) disclaim responsibility for any injury to people or property resulting from any ideas, methods, instructions or products referred to in the content.

