Article

A Novel Hybridoma Cell Segmentation Method Based on Multi-Scale Feature Fusion and Dual Attention Network

1
School of Computer Science and Technology, Hangzhou Dianzi University, Hangzhou 310018, China
2
Key Laboratory of Public Security Information Application Based on Big-Data Architecture, Ministry of Public Security, Zhejiang Police College, Hangzhou 310000, China
3
Faculty of Artificial Intelligence, Menoufia University, Shebin El-Koom 32511, Egypt
*
Authors to whom correspondence should be addressed.
Electronics 2023, 12(4), 979; https://doi.org/10.3390/electronics12040979
Submission received: 16 January 2023 / Revised: 6 February 2023 / Accepted: 8 February 2023 / Published: 16 February 2023
(This article belongs to the Section Computer Science & Engineering)

Abstract

:
The hybridoma cell screening method is usually done manually by human eyes during the production process for monoclonal antibody drugs. This traditional screening method has certain limitations, such as low efficiency and subjectivity bias. Furthermore, most of the existing deep learning-based image segmentation methods have certain drawbacks, due to different shapes of hybridoma cells and uneven location distribution. In this paper, we propose a deep hybridoma cell image segmentation method based on residual and attention U-Net (RA-UNet). Firstly, the feature maps of the five modules in the network encoder are used for multi-scale feature fusion in a feature pyramid form and then spliced into the network decoder to enrich the semantic level of the feature maps in the decoder. Secondly, a dual attention mechanism module based on global and channel attention mechanisms is presented. The global attention mechanism (non-local neural network) is connected to the network decoder to expand the receptive field of the feature map and bring more rich information to the network. Then, the channel attention mechanism SENet (the squeeze-and-excitation network) is connected to the non-local attention mechanism. Consequently, the important features are enhanced by the learning of the feature channel weights, and the secondary features are suppressed, hence improving the cell segmentation performance and accuracy. Finally, the focal loss function is used to guide the network to learn the hard-to-classify cell categories. Furthermore, we evaluate the performance of the proposed RA-UNet method on a newly established hybridoma cell image dataset. Experimental results show that the proposed method has good reliability and improves the efficiency of hybridoma cell segmentation compared with state-of-the-art networks such as FCN, UNet, and UNet++. The results show that the proposed RA-UNet model has improvements of 0.8937%, 0.9926%, 0.9512%, and 0.9007% in terms of the dice coefficients, PA, MPA, and MIoU, respectively.

1. Introduction

Recently, monoclonal antibody drugs have played an important role in the field of medicine. The production of these monoclonal antibodies mainly depends on the hybridoma cells [1]. Many hybridoma cells can be obtained by fusing the B lymphocytes of immunized animals with myeloma cells, so that monoclonal antibodies can be produced in large quantities. The screening step of the hybridoma cells is a key step during the preparation process of these hybridoma cells. The traditional screening step is always done by human eyes, which is stressful, time-consuming, and affected by subjectivity. Therefore, there is a need for an automated method that can effectively segment hybridoma cells to improve screening efficiency.
Image segmentation is an important task in the field of computer vision. Furthermore, the accuracy of computer vision tasks, such as object recognition, depends on the quality of image segmentation [2]. Image segmentation in computer vision is the process of splitting a digital image into various segments with the goal of simplifying or changing the representation of an image into something that is more meaningful and simpler to analyze. Image segmentation is typically used to identify objects and boundaries in images (such as lines, dots, curves, etc.). Furthermore, image segmentation is the process of giving each pixel in an image a label so that pixels with the same label share some pictorial characteristics. Many classical image segmentation algorithms based on image processing and machine learning have been proposed [2]. However, these algorithms have their own shortcomings.
The segmentation of medical images aids in regulating the amount of medications and radiation exposure, as well as in monitoring the progression of diseases such as tumors. With the continuous improvements in the computational power of computers, deep learning is becoming more and more extensive for image segmentation tasks. The various artifacts presented in medical images make medical image segmentation a challenging task. Deep neural network models have recently been demonstrated for their use in a variety of image segmentation applications [3]. This significant growth is due to the accomplishments and excellent performance of the deep learning algorithms.
Araujo et al. [4] proposed a deep learning method for abnormal cell segmentation for digitized images of conventional Pap smears. They ranked outputs based on the likelihood that the images contained abnormal cells. Al-Kofahi et al. [5] presented a deep learning-based method for cell segmentation in 2-D cellular microscopy images, including nuclei and the cytoplasm. Their method was robust for images that show hyperintense cytoplasm and nuclei with little or no staining. Song et al. [6] proposed a multiscale convolutional network (MSCN) and a graph-partitioning-based method for the segmentation of cervical cytoplasm and nuclei. Their method extracted features and then segmented regions centered at each pixel. This method aimed to segment all of the nuclei in an image, and it did not differentiate between normal and abnormal patterns. Kothari et al. [7] proposed a semi-automatic cell segmentation method that can detect the concavity of the cell edge and then use the ellipse fitting technique to segment the concavity. In the literature, Malhotra et al. [3] introduced a detailed review and statistical analysis comparison for several kinds of deep neural networks for medical image segmentation.
Most of the deep learning-based methods in the literature can achieve good results for medical image segmentation, but they also have certain limitations [3]. Due to different shapes of hybridoma cells and uneven location distribution, the above-mentioned methods suffer from over- and under-segmentation during segmenting the complex cell images. Therefore, this paper proposes a hybridoma cell segmentation algorithm based on a convolutional neural network. The main contributions of this paper can be summarized as follows:
  • We construct a new hybridoma cell image segmentation dataset. We accurately label the hybridoma cells in the image and design a tool to enhance the original data. Furthermore, we use three data enhancement methods—rotation reflection transformation, contrast transformation, and brightness transformation—to enhance the datasets and improve the generalization ability of the deep learning network.
  • In order to further improve the segmentation accuracy, we propose multi-scale feature fusion and dual attention mechanisms for hybridoma cell image segmentation based on non-local and SENet attention mechanisms.
  • We improve the traditional image segmentation network, U-Net. Moreover, we use the residual network to optimize the loss function. A focal loss function is used instead of the traditional cross-entropy loss function to overcome the class imbalance problem.

2. Related Works

2.1. Traditional Image Segmentation

Traditional image segmentation is mainly divided into three main categories: region-based segmentation [8], edge-based segmentation [9], and threshold-based segmentation [10].
The region-based segmentation algorithms usually calculate the similarity between different pixels in the image according to certain criteria and then divide the image into different regions. Wong et al. [11] proposed a region-growing method that inserts adjacent and similar pixels into the same set to segment the image. Generally, the watershed method segments the image through the idea of topology. First, the image is clustered according to the gray value of each pixel in it. It starts to grow from the pixel with the smallest gray value and then calculates the distance between the surrounding pixels and the current pixel. If the calculated distance is less than a preset threshold, it continues to grow. The area formed after the growth stopped is called the catchment basin, and the area surrounding the catchment basin constitutes a watershed. The local features of the target region appear discontinuous, and the gray values appear faulty. The Markov random field model (MRF) showed good performance for image segmentation tasks. It can be pixel-based or region-based [12]. The pixel-based or region-based MRF models have their own merits and shortcomings. In order to make use of each other, Chen et al. [12] presented a unified Markov random field (UMRF) model. They combined the benefits of the pixel-based and region-based MRF models by decomposing the likelihood function into the product of the pixel and regional likelihood functions. They also designed a regional feature for the UMRF model to describe macrotexture patterns. A principled probabilistic inference was introduced to combine different types of likelihood information and the spatial constraint by updating the posterior probability of the model iteratively [12].
Moreover, edge-based segmentation methods use edge detection operators to achieve segmentation, such as the Roberts operator [13] and the Sobel operator [14]. The Roberts operator is a gradient algorithm that extracts the edge part of the image by calculating the difference between two diagonally adjacent pixels whereas, the Sobel operator combines differential derivation and Gaussian smoothing, and it can extract the edge of the image to achieve the purpose of image sharpening. Additionally, partial differential equations (PDE) can selectively solve the problem of image segmentation [15]. PDE-based image segmentation techniques do not require any prior information about the number of objects or their topology. These techniques use an active contour model for segmentation purposes. They are widely used in medical imaging applications such as cardiac scanners, as well as in robotic devices on assembly lines [16].
Furthermore, threshold-based segmentation methods analyze the spatial correlation characteristics of the gray in the image and obtain a gray threshold to segment the target area.The histogram bimodality method [17] applied segmentation by first drawing the gray-level histogram of the input image, determining the two maximum values in the histogram, and then taking the gray level corresponding to their minimum value as a segmentation threshold. Then, using the segmentation threshold to convert the image into a binary image, we achieve the segmentation of the target region. Moreover, the maximum between-class variance method [18] segmented the image by using the grayscale characteristics of the image and then dividing the image into two parts by thresholding. The threshold-based segmentation methods are usually suitable for images with obvious gaps between the target and the background in the gray space. It is the most widely used technique for cell image segmentation due to its simplicity of use [19]. However, the threshold-based segmentation method only uses the features of the gray value of the image, which are easily disturbed by noise, and the segmentation results are not ideal in the case of the complex structures of the image.
Overall, due to the complex backgrounds and smoothness of the images, they have a large amount of noise, which makes them challenging to be segmented by the traditional image segmentation techniques, which are time-consuming. Consequently, it is required to develop efficient and accurate segmentation techniques to improve the segmentation accuracy in complex backgrounds.

2.2. Deep Learning-Based Image Segmentation

Compared with the human eye, the traditional image segmentation algorithms have been greatly improved, but there are still some challenges due to the complex backgrounds and smoothness of the images. Recently, deep learning techniques have been widely used for computer vision tasks, especially image segmentation.
Fully convolutional networks (FCN) are widely used for image segmentation tasks, which allow pixel-level prediction, and many depth neural networks have been proposed based on their basis [20]. In addition, different from traditional convolutional neural networks, the FCN network abandons the use of the fully connected layer and instead uses upsampling for the final feature map and then uses the softmax activation function to predict the category of each pixel in the image [20]. Therefore, it can be applied to pixel-wise tasks such as image segmentation tasks. In order to obtain the same size as the original image, an upsampling operation is required after feature extraction from the input image. However, only upsampling the feature map of the last convolution layer can restore the features in the image well. Therefore, in the FCN network, the feature maps obtained from the third and fourth layers are deconvoluted to supplement the details and obtain more accurate results. However, the FCN-based model has some drawbacks because it does not consider global context information efficiently [3]. Additionally, FCN has low resolution predictions with hazy object boundaries due to the downsampled resolution of the feature maps generated at the output [3].
The U-Net network [21] is an improved segmentation network based on FCN, which is often used for medical image segmentation due to its high segmentation accuracy. It uses an encoder-decoder symmetric network structure and a skip connection structure. The entire network structure forms a symmetrical U-shaped structure, with an encoder on the left and a decoder on the right. In the middle, the jump connection is used for channel splicing between feature images. In the encoder, the resolution of the feature image is reduced layer by layer to extract feature information. In the decoder, the resolution of the feature image is enlarged layer by layer by upsampling until it has the same size as the input image. In the middle of the network, the feature map of the corresponding level in the encoder and the feature map obtained by the up-sampling in the decoder are spliced into the channel through skip connections, and the feature information in the decoder is supplemented, thereby improving the segmentation performance of the network. The U-Net model, however, has some limitations, such as the fact that learning generally slows down in the middle layers, which results in ignoring the layers with abstract features. Additionally, the skip connections impose a restrictive fusion method, which causes accumulation of the same scale feature maps of the encoder and decoder [3].
Furthermore, the UNet++ network, with a mesh structure [22], improves its jump connection mode based on the U-Net network. Additionally, the UNet++ network integrates different levels of features through feature superposition and enriches the features that can be extracted from the network. The FD-UNet network [23] uses dense connections in the U-Net network. It can reduce the learning of redundant features and improve the performance of the network by enhancing the flow of information.
These deep learning-based architectures achieved good performances for image segmentation, although there are a number of issues, such as difficulty in the training process due to the bloated structure and the existence of multiple unnecessary columns in multi-column-based architectures [3,24].

2.3. Attention Mechanism-Based Methods

The attention mechanism simulates the thinking mode of the human brain. Since the speed at which the brain processes information is relatively limited, humans need to focus on important areas to obtain more detailed information in key areas and filter out the information that is not important in the surrounding context. By using the attention mechanism in neural networks, the network can extract features with important and valuable information in the case of limited resources, so that the network can get better performance on the corresponding task [25]. Jaderberg et al. [26] designed a module called “spatial transformer” (ST). The spatial transformer network (STN) is a common classical neural network model that uses spatial domain attention. It searches the key areas in the image by performing the corresponding spatial transformation on the spatial domain information in the image. The channel attention mechanism (CAM) follows the mode of encoder–decoder. In the encoder, two identical deep residual networks are both divided into multiple levels and acted on spectral images and auxiliary data, respectively. Additionally, in the decoder, the CAM automatically weighs the channels of feature maps to perform feature selection. Squeeze-and-Excitation Networks (SENet) [27] is a typical neural network model that uses channel domain attention. The SENet module can intersperse between different networks, and it has been applied to multiple classification networks and achieved good classification results. The SENet module uses the feature re-calibration strategy to model the relationship between channels, which allows the network model to obtain the weight parameters of each feature channel through continuous learning and give the effective feature channels a greater weight so that the model training achieves better results. For image data, long-distance dependencies are obtained through the large receptive field formed by stacking multi-layer convolutions, which cannot obtain global information. The non-local block [28] integrates global information, expands the receptive field to the full image, and brings richer semantic information to feature extraction behind the network. The Convolutional Block Attention Module (CBAM) [29] in the convolution module is composed of a spatial attention module and a channel attention module. By guiding the network to learn at the spatial and channel levels, the network can focus on important features while restraining unimportant ones, enhancing its performance.

2.4. Feature Pyramid Networks

In a convolutional neural network, feature maps of different depths correspond to different degrees of semantic features. For the shallow feature map, it has a higher resolution and learns more detailed features. For deep feature maps, the resolution is smaller, and more abstract semantic features are learned. Single Shot MultiBox Detector (SSD) is one of the object detection algorithms that can provide high accuracy and speed in real time [30]. The SSD uses multi-scale convolutional bounding box outputs attached to multiple feature maps at the top of the network. It combines predictions from multiple layers with different scales. However, SSD has poor performance on small object detection (i.e., cell size in the hybridoma cell images) due to its shallow prediction layer, which lacks enough semantic information [31]. The feature pyramid networks (FPN) [32] are mainly composed of three paths: (1) The bottom-up path, which is used to extract features, and the output results of feature maps with the same scale in the path are of the same stage. According to the different output scales of feature maps in different stages, each stage corresponds to a level of the feature pyramid, and the feature map corresponding to each stage is the final feature map output obtained in this stage. The higher the feature pyramid level, the stronger the semantic representation of the features obtained. (2) The top-down path, which is used to pass down the abstract semantic information obtained from the deep feature map. In this path, the resolution of the current-level feature map is increased by upsampling to make it match the next level. The feature maps in the layers have the same resolution and size. In this way, both the rich semantic information of the top layer and the high-resolution detailed information of the bottom layer are utilized. (3) The function of the lateral connection path is feature fusion. For the feature map output at each stage, a 1 × 1 convolution kernel is used for the dimensionality reduction operation, and the feature map after dimensionality reduction is upsampled from the previous layer. The feature map is fused, and the fused feature map needs to be processed by a 3 × 3 convolution kernel to eliminate the aliasing effect caused by discontinuity of features during the upsampling process. After feature fusion, the feature map of each layer fuses the features with different semantic levels from the top layer, so that it has rich semantic information and location information. The traditional convolutional neural network uses a single high-level feature for detection, which often leads to a poor prediction effect due to the lack of shallow detail features, and the use of feature pyramid networks can well solve this problem.

3. The Proposed Hybridoma Cell Segmentation Method

Due to the continuous application of CNNs in computer vision tasks, CNNs with different topological structures and connection methods have been proposed one after another so that CNNs can achieve good performance with limited data. In the field of medical image segmentation, neural networks with skip-connected encoder-decoder architectures are the most commonly used for image segmentation algorithms [33]. In this paper, we establish a dataset for hybridoma cell image segmentation under the guidance of related literature. During the analysis step, we find that the hybridoma cells have different shapes and complex distribution positions. At the beginning, we applied the U-Net network to segment the hybridoma cells from images, but unfortunately, we found that the segmentation results were not ideal and that there were some limitations, such as over-, under-segmentation and an under-fitting of the segmented shape compared with the real shape. In this paper, we propose the RA-UNet network based on the improvement of the U-Net network for hybridoma cell image segmentation to improve these limitations. The structure of the proposed RA-Unet network is shown in Figure 1. Overall, the proposed RA-Unet network improves the network structure and loss function of the U-Net network. The specific improvements of the proposed RA-UNet network can be summarized as follows:
(1)
Improving each module in the encoder and decoder to a residual structure with skip connections. Furthermore, the ability to extract cell features is enhanced through residual learning.
(2)
Improving the cross-entropy loss function in the U-Net network by the focal loss function, increase the proportion of cell categories in the total loss, and alleviate the category imbalance problem in the dataset.
(3)
Adding a batch normalization layer before the activation function layer so that the training loss can converge faster, and also effectively prevent the network from overfitting. In order to strengthen the extraction of cell features from the network, we perform feature fusion on the feature maps in the encoder and then apply a dual-attention mechanism.
(4)
Adjusting the structure of the encoder and using the feature pyramid to fuse the feature maps of the final output of different modules in the encoder to obtain a variety of semantic expression capabilities, and then obtaining the feature map of the corresponding level in the decoder.
(5)
In the first module of the decoder, the global attention mechanism (non-local) is injected into the feature map after channel splicing so as to expand the receptive field of the feature map fusion and improve the network’s ability to perceive the spatial information.
(6)
Adding channel attention SENet. We adjust the importance of each channel by learning the dependencies between channels, enhance the ability to obtain semantic information about key features, and improve the segmentation effect of the network.

3.1. Feature Fusion Module Design

The U-Net network consists of three main parts. The left side of the network is an encoder, which is mainly used to extract deep abstract semantic features. It has five modules; each module contains two convolutional layers. The convolution operation is performed by using a 3 × 3 convolution kernel. In the first four modules of the encoder, a 2 × 2 max-pooling layer is used for downsampling after two convolutional layers. On the right side of the U-Net network is a decoder that uses a deconvolution operation to upscale the feature maps of each layer. The decoder has four modules, which also use two 3 × 3 convolution kernels for convolution operations and deconvolution for upsampling operations. The feature map obtained by the encoder is spliced into the corresponding module of the decoder by using skip connections in the middle of the network, which brings more detailed information to the decoder. In the U-Net network, the decoder directly concatenates the feature map corresponding to the resolution in the encoder and the feature map obtained by upsampling on the channel.
In order to allow the network to reduce the loss of spatial details while extracting high-level abstract semantic information, the proposed RA-Unet in this paper first fuses the feature maps of different scales in the encoder and then upsamples them with the decoder. Then, the feature maps of the channel are stitched together. At the same time, the idea of a residual network is applied to each module of the encoder and decoder. Hence, the extraction of cell features is enhanced through residual learning.
As shown in Figure 2, there are five modules in the encoder. The final feature map obtained by each module is denoted as: p 1 , p 2 , p 3 , p 4 and p 5 ; and the corresponding feature map channel numbers are 64, 128, 256, 512, and 1024; respectively. The specific operation of feature fusion is done as follows:
  • Firstly, for the final feature map of each module in the encoder, we use 256 1 × 1 convolution kernels for performing convolution operations to obtain 256-dimensional feature maps c 1 , c 2 , c 3 , c 4 , c 5 .
  • Secondly, the obtained feature maps after layer upsampling are then fused by element-wise addition to obtain the four fused feature maps.
  • Finally, the four fused feature maps are spliced into the decoder.
Additionally, by performing feature fusion on the feature map on the encoder side, the feature map of each layer fuses the features with different semantic levels from the top layer, which can reduce the loss of feature information in the convolution process, hence improving the segmentation performance of the proposed network.

3.2. Dual Attention Mechanism Module

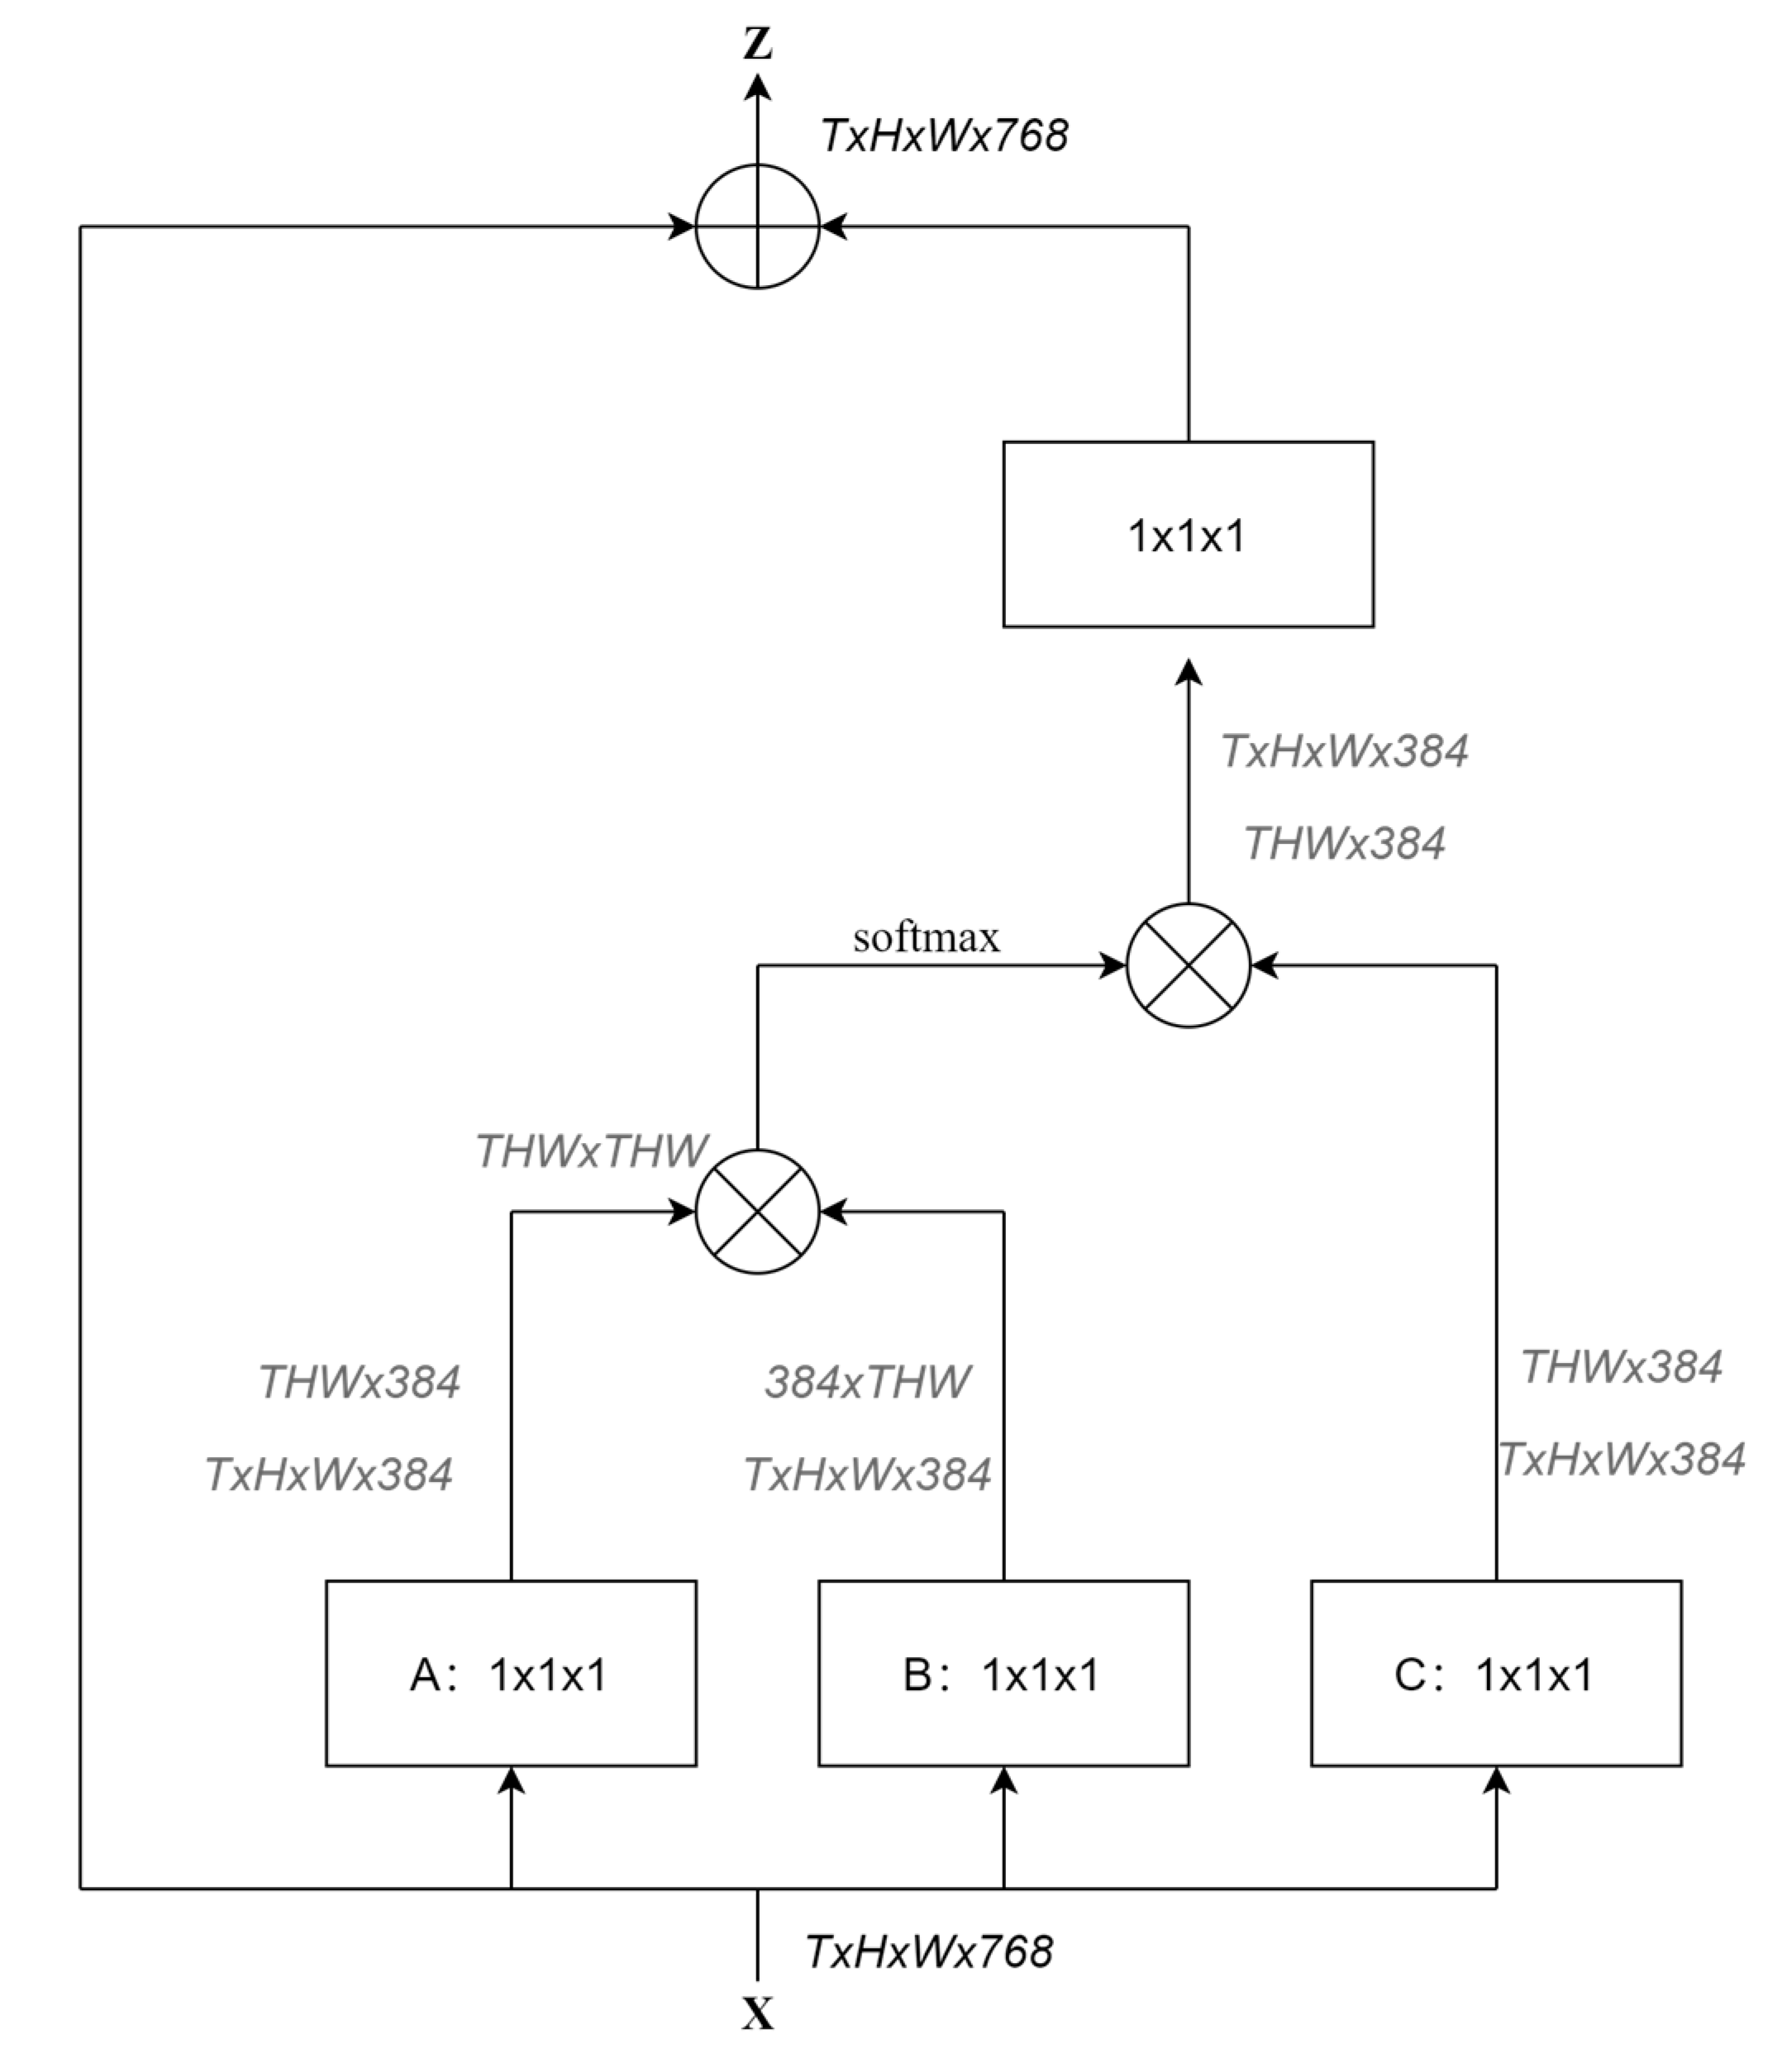
3.2.1. Global Attention Mechanism

As shown in Figure 3, the proposed RA-Unet injects the non-local attention mechanism into the first module of the decoder. The feature map and feature fusion with 512 channels obtained by deconvolution of the encoder side are obtained. Then, the channel stitching is performed on the feature map with a channel number of 256, and the non-local module is then used to calculate the relationship between pixels in the image.
The whole process of the non-local block is shown in Figure 4, which can be divided into three main steps as follows:
  • Linear mapping: For an input feature matrix X where, T represents the number of samples selected for one training, H and W represent the height and width of the input feature map; respectively, and 768 is the feature fusion map passed into the encoder. After stitching, we convolve the input matrix with a 1 × 1 × 1 convolution kernel, and then linearly map it to three different types of feature spaces, obtaining three new feature matrices, A, B, and C, with a size of T × H × W × 384.
  • Autocorrelation calculation: First, we reduce the dimension of the two feature matrices A and B from a four-dimensional matrix to a two-dimensional matrix by the reshape operation. After dimension reduction, the size of the feature matrices A and B is (T × H × W, 384). Second, we transpose the feature matrix B, and perform matrix multiplication on the processed feature matrix A and the transposed feature matrix B to obtain a matrix of size (T × H × W, T × H × W), which represents the input feature matrix. Then, the autocorrelation inside X is calculated, where, the dependence of each pixel on all other pixels in the image is normalized by using softmax. Similarly, the dimension reduction process is also applied to the feature matrix C, and the size of C will be (T × H × W, 384).
  • Attention coefficient calculation: The obtained feature matrix after softmax processing and the feature matrix C after dimension reduction are multiplied together to obtain a feature matrix of size (T × H × W, 384), that is, the attention mechanism coefficient is applied to all the feature maps of the channel corresponding to the pixel. Finally, a 1 × 1 × 1 convolution kernel is used to perform the convolution operation. After adding the obtained result to the input feature matrix X point by point, the output feature matrix Z of the non-local module is finally obtained. The size of the output matrix Z is the same as the size of the input feature matrix X.

3.2.2. Channel Attention Mechanism

The second attention mechanism used in the dual attention mechanism for the proposed network is the channel attention SENet (Squeeze-Excitation Network). The proposed RA-Unet injects the SENet attention mechanism into the first module of the decoder side, behind the non-local attention mechanism. The SENet attention mechanism in the first module of the decoder is shown in Figure 5.
Next, the process of injecting SENet attention mechanisms is introduced, as shown in Figure 6. For the input feature map, h represents the height, w represents the width, and c represents the number of channels. The input feature map is first compressed on the channel through the squeeze operation. In this operation, the global pooling method is used to extract all the information from each channel, as shown in Equation (1):
z c = 1 H × W i = 1 H j = 1 W u c i , j
where, H represents the height of the feature map corresponding to a channel, W represents the width, and u c i , j represents a pixel in the feature map. Then, add all the values in the feature map corresponding to a channel and average them to get the value after global pooling, which represents the unique response of the corresponding channel. After performing the queeze operation, the input of c × h × w is converted into the output of c × 1 × 1, and the result shows the numerical distribution of the feature maps of the current layer.
In the excitation operation, in order to model the relationship between channels, two fully connected layers are used. The function of these two fully connected layers is to fuse the channels and learn the dependencies between them. The dimension of the first fully connected layer is c r × 1 × 1, where r is the scaling parameter, which is generally smaller than the number of the input feature channels, so that the calculation cost can be effectively reduced by reducing the dimension first and then increasing the dimension. In this paper, we set r to 16. After the two fully connected layers are determined, the corresponding attention weight of each feature channel is obtained through the sigmoid activation function. Then, the input feature map X is multiplied by the obtained attention weight through the Reweight operation, and the output feature map Z with self-attention ability is finally obtained.

3.3. Loss Function Optimization

During the preparation of the hybridoma cell image segmentation dataset and labeling the samples, we notice that the proportion of the area occupied by cells in many test tube images is smaller than the background, which leads to a sample imbalance problem. The class imbalance problem arises when the number of negative samples is too large in the training process of the network model, which accounts for most of the loss. Consequently, the optimization of the network model may deviate from the expected direction.
In the proposed RA-UNet network, we use the focal loss function instead of the traditional cross-entropy loss function. The use of focal loss can alleviate class imbalance problems to a certain extent. Focal loss was first proposed in the network RetinaNet [34], which is mainly used to solve the problem of a serious imbalance between the positive and negative sample ratios in one-stage target detection. It can be calculated using the following Equation (2):
FL ( p t ) = 1 p t y   log ( p t )
where 1 p t y is the modulation coefficient, and y ∈ [0, 5] is the focusing parameter. When a sample is misclassified, p t is very small, the modulation coefficient 1 p t y tends to 1, and the loss is not affected. Whereas, if a sample is well-classified, p t is close to 1, and the modulation coefficient 1 p t y tends to 0. Then, the sample weight is adjusted down, and the contribution to the total loss is very small. Therefore, focal loss increases the training of difficult samples and reduces the training of simple samples during the training process of the network model. The loss formula of the focal loss function gives different weights to the loss of different samples, but the manual design is more obvious. The loss weighting can be automatically learned by using the meta-learning method.
As shown in Equation (3), we proposed to use α as a balance weight for focal loss to control the shared weight of positive and negative samples for the total loss, α [0, 1]. Therefore, using the proposed focal loss can alleviate the class imbalance problem for network training. By adjusting the proportion of cell category and background category to total loss, the learning focus of the network is guided to cell category, thus improving the segmentation performance of the network.
FL ( p t ) = α 1 p t y   log ( p t )

4. Experimental Results and Analysis

4.1. Dataset Preparation

The construction process of the hybridoma cell image segmentation dataset is shown in Figure 7. Firstly, the hybridoma cell image is evenly divided into test tube sub-images, then the cells in each sub-image are labeled, and finally the data is expanded to enhance the network training process. Some sample images from the dataset are shown in Figure 8. The whole process of the dataset preparation can be introduced in detail as follows:
Firstly, the collected hybridoma cell plate contains 96 testtubes that have hybridoma cells to be segmented. Each test tube hole is evenly divided into sub-images, and the size of each sub-image is set to 160 × 160 pixels, which can facilitate the labeling of the subsequent dataset images and training the network. The data labeling tool “LabelMe” is then used to label the image samples as shown in Figure 9. The pixels of each sub-image are then classified into two categories: hybridoma cells and background. Therefore, the resulted label image has only two pixel values, either 0 or 1, where pixel value 0 represents the background and pixel value 1 represents hybridoma cells, and the labeled results can be displayed by visualizing the label image. Overall, we obtain 960 hybridoma cell images, from which 864 cell images are randomly selected as a training sample set and the remaining 96 cell images are used as a testing set. Finally, due to the limited dataset samples that were obtained and the high cost of manual labeling, data augmentation was used to expand the dataset and enhance the training process. In this paper, data augmentation is achieved by using three different transformation methods: rotation reflection transformation, contrast transformation, and brightness transformation. The number of the training sample set is expanded to 3456 images by using data augmentation. The constructed hybridoma cell image dataset is available t the public repository at (https://github.com/pickablewalker/rhp_img_database.git, accessed on 6 February 2023). Figure 10 and Figure 11 show some examples of hybridoma cell images after applying rotation reflection transformation and contrast transformation, respectively.

4.2. Experiments Environment

In this paper, all the experiments are carried out on the same platform, using a Linux operating system and a graphics card from NVIDIA, the GeForce RTX 2080 Ti. The code is written in the Python programming language, and the selected deep learning framework is PyTorch. The specific experiment’s environment configuration is shown in Table 1.

4.3. Evaluation Metrics

In order to evaluate the performance of the proposed RA-UNet, we use accuracy, which is a commonly used measure in image segmentation. The accuracy can be divided into pixel accuracy (PA), mean pixel accuracy (MPA), intersection over union (IoU), mean intersection over union (MIoU), and dice coefficient (Dice), all of which are based on confusion matrices as shown in the following Equations (4)–(8):
PA = i = 0 k p ii i = 0 k j = 0 k p ij
MPA = 1 k + 1 i = 0 k p ii j = 0 k p ij
IoU = TP TP + fP + FN
MIoU = 1 k + 1 i = 0 k p ii j = 0 k p ij + j = 0 k p ji p ii
DiceCoefficient = 2 X Y X + Y

4.4. Attention Mechanism Comparison and Verification

In this section, four experiments are conducted to verify the impact of the proposed RA-UNet network on hybridoma cell image segmentation tasks after adding different attention mechanisms. The experimental settings are as follows:
  • Experiment 1 is conducted without adding any attention mechanisms to the RA-UNet network.
  • Experiment 2 employs a non-local attention mechanism for the RA-UNet network.
  • Experiment 3 employs a channel attention mechanism (SENet) for the RA-UNet network.
  • In experiment 4, both attention mechanisms (non-local and SENet) are added to the RA-UNet network.
The experimental results and comparison of the four experiments are shown in Table 2.
Furthermore, by showing the experimental comparison of the segmentation accuracy of the proposed RA-UNet network using different attention mechanisms, the results obtained by using both attention mechanisms with the RA-UNet network outperform the others. The evaluation metrics obtained by experiment 4 are also the highest among the others. Compared with experiment 1 (no attention mechanism is added to RA-UNet), the dice coefficient index is increased by 1.13%, the PA index is increased by 0.09%, the MPA index is increased by 0.86%, and the MIoU index is also increased by 0.97%. Overall, the experimental results in this section show that the integration of two attention mechanisms into the network at the same time allows the network to obtain more feature information, and by adjusting the weights of each feature, the ability of the entire network model to segment hybridoma images is further improved.

4.5. Feature Fusion Module Comparison and Verification

The main purpose of this section is to verify the influence of the feature fusion and feature map for each module in the encoder on the hybridoma image segmentation. Two experiments are conducted to verify the impact of feature fusion on the proposed RA-UNet network. The experimental settings are as follows:
  • Experiment 1 is performed without feature fusion on the feature map on the encoder side, but directly performs channel splicing with the feature map of the corresponding resolution in the decoder.
  • In experiment 2, the feature map of each module in the encoder is fused. Then, the fused feature map and the feature map of the corresponding resolution on the decoder side are channel-spliced.
The experimental results and comparison of the two experiments are shown in Table 3.
Through the comparison results, it can be noted that with the feature fusion of the feature maps in each module of the encoder, the various evaluation metrics of the network have been improved. The dice coefficient index is increased by 1.17%, the PA index is increased by 0.09%, the MPA index is increased by 0.6%, and the MIoU indicator is also increased by 1.06%. Furthermore, Table 3 shows that the feature fusion of the feature map in the encoder and the channel splicing with the decoder can enrich the semantic level of the feature map while reducing the loss of feature information, which improves the feature extraction ability in the decoder. Consequently, the proposed method improves the segmentation ability of the entire network for the hybridoma cell images.

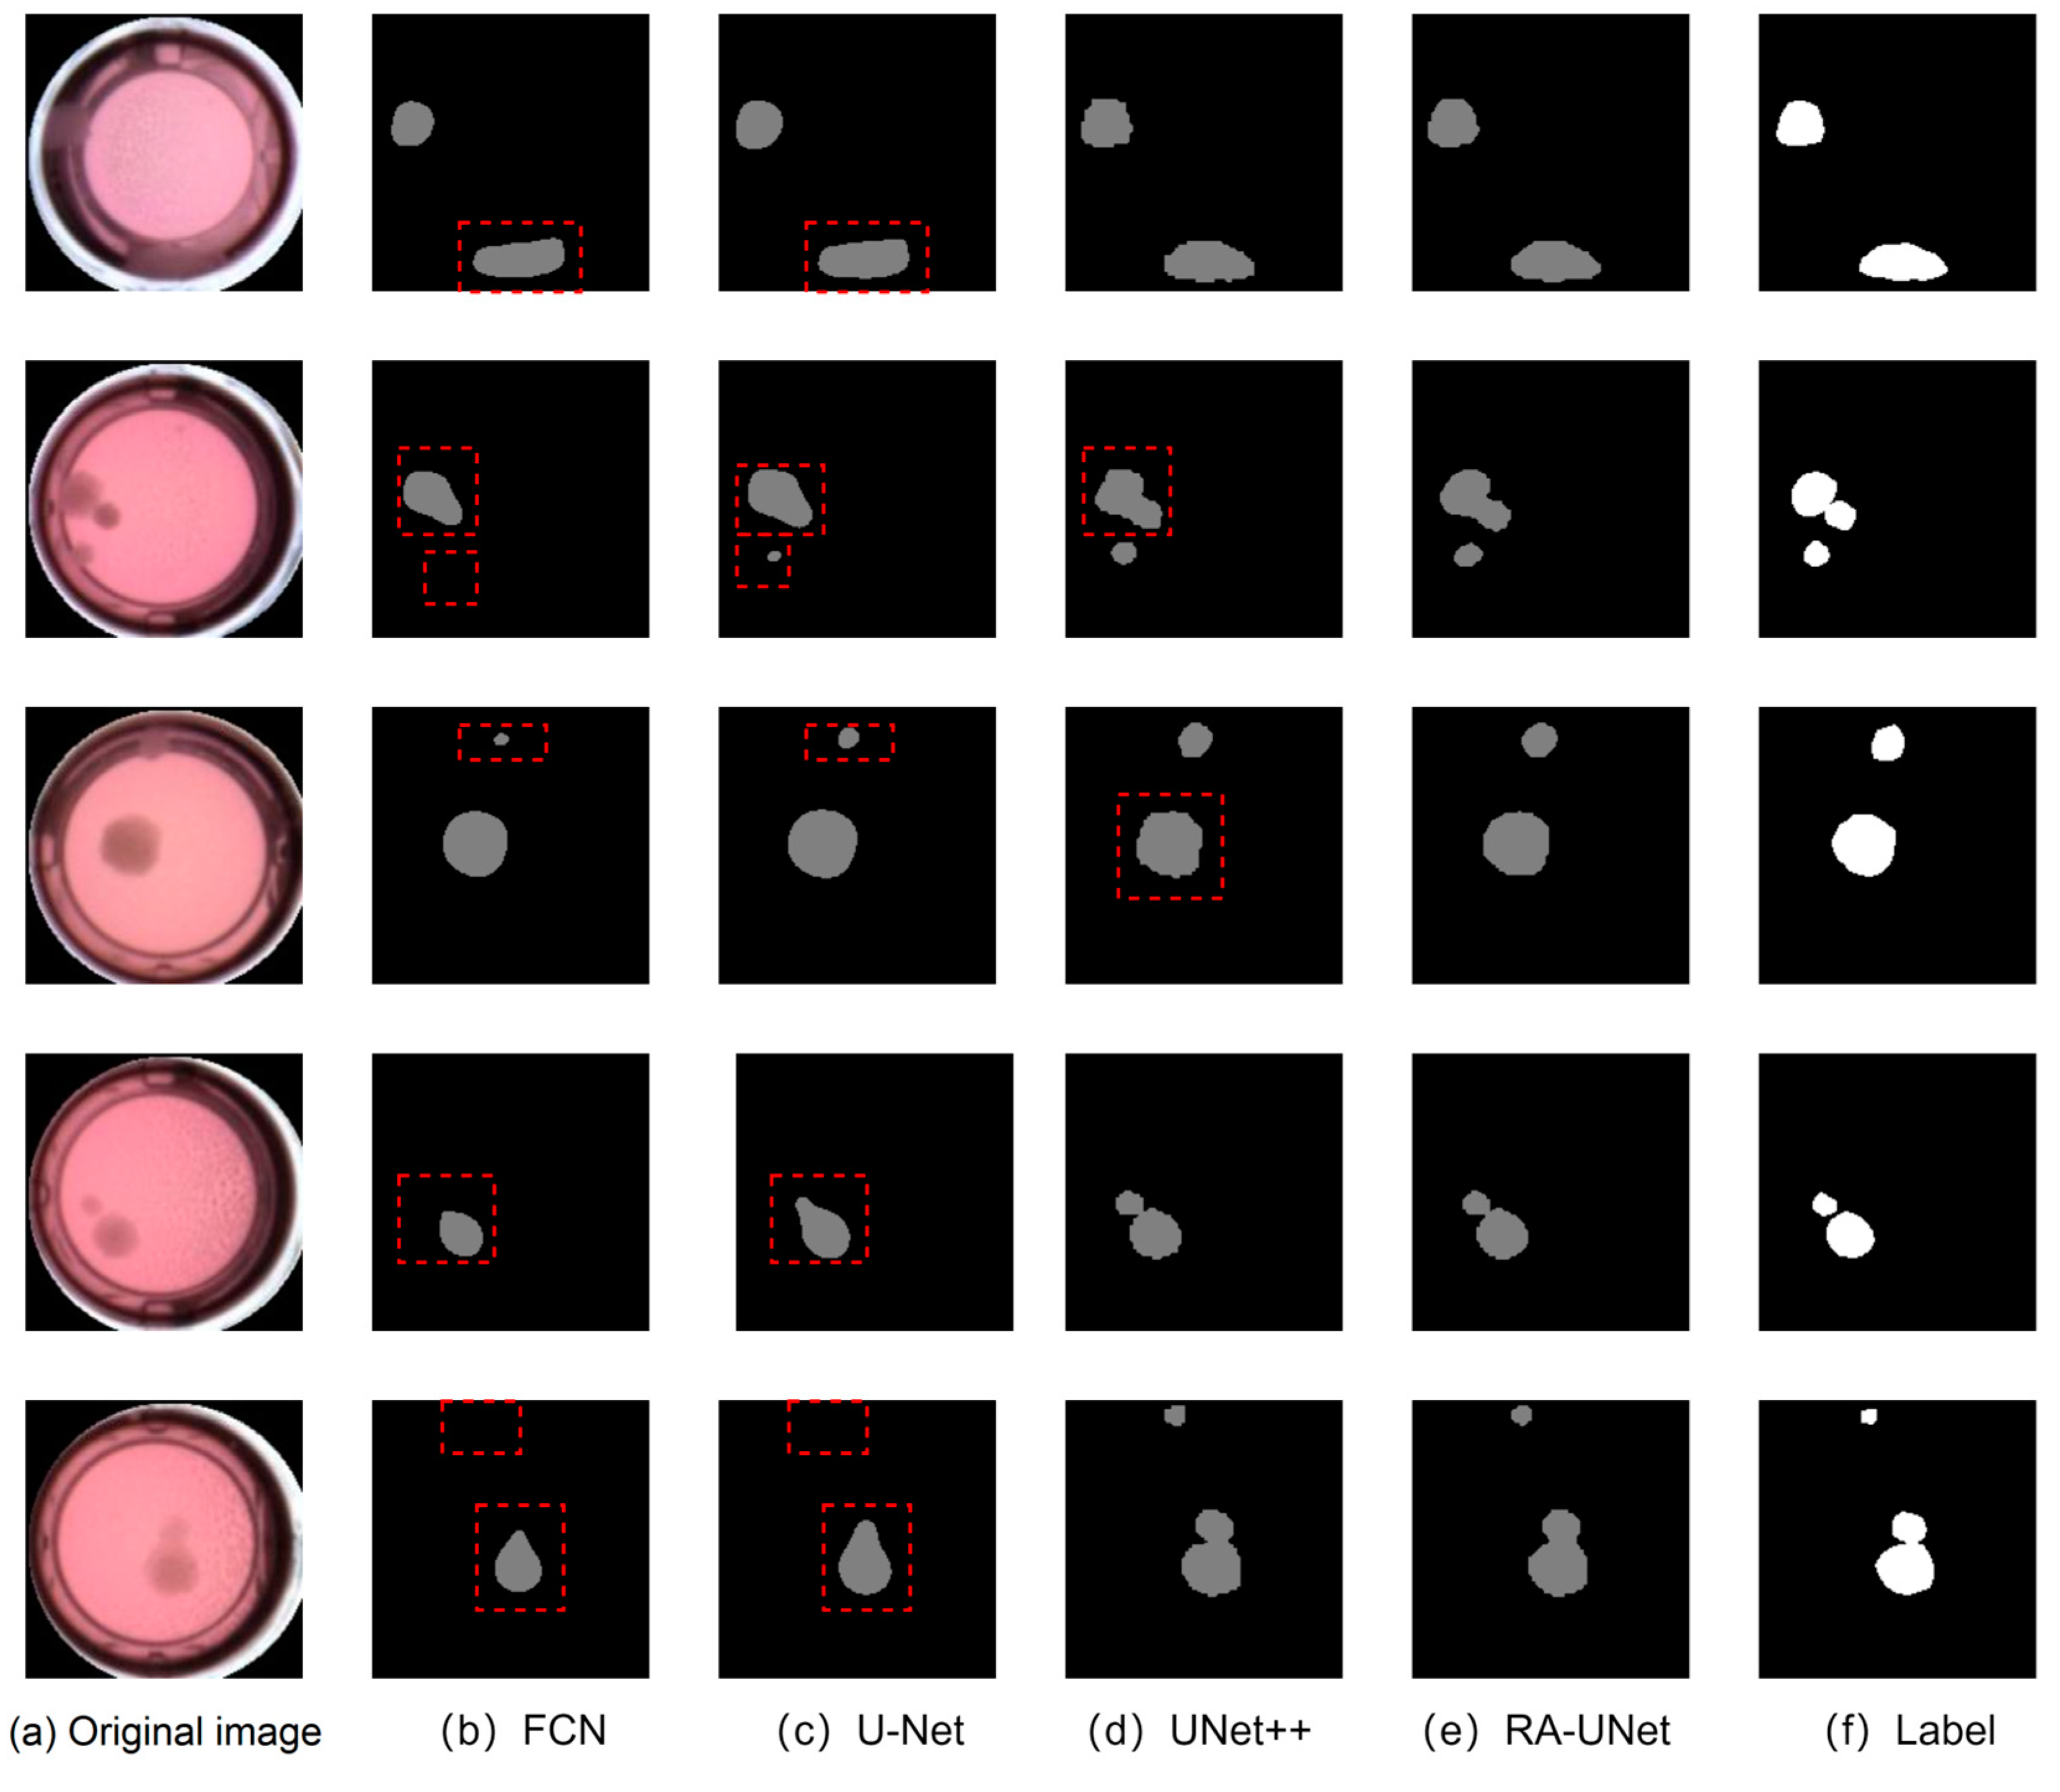
4.6. Segmentation Accuracy Comparison

In this section, we compare the performance of the proposed RA-UNet network with that of the FCN network [20], U-Net network [21], and UNet++ network [22] on the constructed hybridoma cell image segmentation dataset. Some visual results of the segmentation effects for the three compared networks on the hybridoma cell image segmentation dataset are shown in Figure 12. Figure 12a represents the original images of the test tube, which contains the hybridoma cells to be segmented, Figure 12b represents the segmentation results using the FCN network [20], Figure 12c represents the segmentation results of the U-Net network [21], Figure 12d represents the segmentation result of the UNet++ network [22], Figure 12e shows the segmentation results of the proposed RA-UNet network, and Figure 12f shows the visual label after manual annotation.
As shown in Figure 12, the proposed RA-UNet achieves the best results on the hybridoma cell image segmentation task. In the first row of comparative experiments, all networks can accurately segment the two cells in the original image, but the shapes segmented by the FCN [20] and U-Net [21] networks are far from the annotated shapes. In the second row, FCN shows under-segmentation results. Although U-Net segments an approximate shape of the hybridoma cells, the adhesion between cells is significant, and the area of the segmented cells is also relatively small. In the third row of Figure 12, the area of the cells segmented by FCN and U-Net is smaller, and the shape of the segmented cells by U-Net is not smooth. In the fourth and fifth rows of Figure 12, the cell adhesion phenomenon segmented by FCN and U-Net is significant, and the under-segmentation phenomenon appears in the fifth row of the visual results shown in Figure 12. Generally, the segmentation results obtained by the proposed RA-UNet indicate the best segmentation results of the hybridoma cells.
The comparison of the segmentation accuracy for the three state-of-the-art networks on the constructed hybridoma cell image segmentation dataset is shown in Table 4. The proposed RA-UNet network has the best segmentation performance compared with the other networks. Compared with the UNet++ network, the dice coefficient index is increased by 3%, the PA index is increased by 0.17%, the MPA index is increased by 3.06%, and the MIoU index is also increased by 2.51%.
The training loss curve comparison between the U-Net network and the proposed RA-UNet network is shown in Figure 13. The two networks are trained on the same platform, 400 epochs are used by using the small batch gradient descent algorithm, and the batch size is set to 16. It can be seen that the loss curve of the proposed RA-UNet network decreases dramatically compared with the U-Net network and tends to converge after 200 epochs. However, the U-Net network has a large jitter in the loss curve during the training process, and the convergence effect of the training loss is not ideal. Consequently, the convergence speed of the training loss for the proposed RA-UNet is faster, and the training time of the whole model is shorter than the U-Net model. Furthermore, the segmentation efficacy and accuracy are significantly improved.

5. Conclusions and Future Direction

Monoclonal antibody drugs have a high specificity and low cost for a wide range of applications in drug research and development. It can be produced in large quantities by using hybridoma cells. Traditional hybridoma cell screening is done manually by human eyes, which may be affected by low efficiency and subjectivity. In this paper, we propose the RA-UNet network based on the improvement of the U-Net network for hybridoma cell image segmentation. The proposed method is based on multi-scale feature fusion and a dual attention module to improve the segmentation results and correct over-segmentation, under-segmentation, and under-fitting problems of the segmented hybridoma cells. Firstly, we establish a hybridoma cell image dataset. Secondly, the feature maps of the five modules in the network encoder are used for multi-scale feature fusion and then spliced into the network decoder to enrich the semantic level of the feature maps in the decoder. Then, a dual attention mechanism based on global (non-local) and channel (SENet) attention mechanisms was developed to expand the receptive field of the feature map and bring more rich information to the network. Finally, the focal loss function is used instead of the traditional cross entropy loss function to overcome the class imbalance problem. Experimental results show that the proposed method has good reliability and improves the efficiency of hybridoma cell segmentation compared with the state-of-the-art networks. For the future, we will focus on processing different types of hybridoma cell images using another method besides test tubes to study the performance of different types of cell images in real time. Additionally, obtaining many different types of hybridoma cell images to create a large-scale dataset and publish the dataset to the public repository. Another alternative direction is to optimize the performance of the proposed network to improve its efficacy and accuracy in real time.

Author Contributions

Conceptualization, J.L., H.R. and L.L.; data curation, H.R., M.S. and M.E.; formal analysis, J.L., H.R., M.S., C.C., M.E. and L.L.; investigation, H.R., M.S. and C.C.; methodology, J.L., H.R. and M.S.; project administration, L.L.; resources, C.C., S.Z. and L.L.; software, C.C. and S.Z.; supervision, L.L.; validation, J.L., C.C., S.Z. and M.E.; visualization, C.C., S.Z., M.E. and L.L.; writing—original draft, J.L., H.R., M.S. and M.E.; writing—review & editing, J.L., S.Z., M.E. and L.L. All authors have read and agreed to the published version of the manuscript.

Funding

This research was funded by the Public Welfare Technology Research Project of Zhejiang Province (No. LGF21F020014), the Opening Project of the Key Laboratory of Public Security Information Application Based on Big-Data Architecture, Ministry of Public Security of Zhejiang Police College (No. 2021DSJSYS002) and National Natural Science Foundation of China (No. 62172132).

Data Availability Statement

The data were prepared and analyzed in this study and are available upon request to the corresponding author.

Acknowledgments

The authors would like to thank all anonymous reviewers for their helpful comments and suggestions.

Conflicts of Interest

The authors declare no conflict of interest.

References

  1. Moraes, J.Z.; Hamaguchi, B.; Braggion, C.; Speciale, E.R.; Cesar, F.B.V.; da Silva Soares, G.D.F.; Osaki, J.H.; Pereira, T.M.; Aguiar, R.B. Hybridoma technology: Is it still useful? Curr. Res. Immunol. 2021, 2, 32–40. [Google Scholar] [CrossRef]
  2. Minaee, S.; Boykov, Y.; Porikli, F.; Plaza, A.; Kehtarnavaz, N.; Terzopoulos, D. Image Segmentation Using Deep Learning: A Survey. IEEE Trans. Pattern Anal. Mach. Intell. 2022, 44, 3523–3542. [Google Scholar] [CrossRef]
  3. Malhotra, P.; Gupta, S.; Koundal, D.; Zaguia, A.; Enbeyle, W. Deep neural networks for medical image segmentation. J. Healthc. Eng. 2022, 2022, 9580991. [Google Scholar] [CrossRef]
  4. Araujo, F.H.; Silva, R.R.; Ushizima, D.M.; Rezende, M.T.; Carneiro, C.M.; Bianchi, A.G.C.; Medeiros, F.N. Deep learning for cell image segmentation and ranking. Comput. Med. Imaging Graph. 2019, 72, 13–21. [Google Scholar] [CrossRef]
  5. Al-Kofahi, Y.; Zaltsman, A.; Graves, R.; Marshall, W.; Rusu, M. A deep learning-based algorithm for 2-D cell segmentation in microscopy images. BMC Bioinform. 2018, 19, 365. [Google Scholar] [CrossRef] [Green Version]
  6. Song, Y.; Zhang, L.; Chen, S.; Ni, D.; Lei, B.; Wang, T. Accurate segmentation of cervical cytoplasm and nuclei based on multiscale convolutional network and graph partitioning. IEEE Trans. Biomed. Eng. 2015, 62, 2421–2433. [Google Scholar] [CrossRef]
  7. Kothari, S.; Chaudry, Q.; Wang, M.D. Automated cell counting and cluster segmentation using concavity detection and ellipse fitting techniques. In Proceedings of the 2009 IEEE International Symposium on Biomedical Imaging: From Nano to Macro, Boston, MA, USA, 28 June–1 July 2009; pp. 795–798. [Google Scholar]
  8. Gibbs, P.; Buckley, D.L.; Blackband, S.J.; Horsman, A. Tumour volume determination from MR images by morphological segmentation. Phys. Med. Biol. 1996, 41, 2437. [Google Scholar] [CrossRef]
  9. Kaus, M.R.; Warfield, S.K.; Nabavi, A.; Black, P.M.; Jolesz, F.A.; Kikinis, R. Automated segmentation of MR images of brain tumors. Radiology 2001, 218, 586–591. [Google Scholar] [CrossRef] [Green Version]
  10. Wang, R.; Li, C.; Wang, J.; Wei, X.; Li, Y.; Zhu, Y.; Zhang, S. Threshold segmentation algorithm for automatic extraction of cerebral vessels from brain magnetic resonance angiography images. J. Neurosci. Methods 2015, 241, 30–36. [Google Scholar] [CrossRef]
  11. Wong, D.; Liu, J.; Fengshou, Y.; Tian, Q.; Xiong, W.; Zhou, J.; Qi, Y.; Han, T.; Venkatesh, S.; Wang, S.C. A semi-automated method for liver tumor segmentation based on 2D region growing with knowledge-based constraints. MICCAI Workshop 2008, 41, 159. [Google Scholar]
  12. Chen, X.; Zheng, C.; Yao, H.; Wang, B. Image segmentation using a unified Markov random field model. IET Image Process. 2017, 11, 860–869. [Google Scholar] [CrossRef]
  13. Rosenfeld, A. The max Roberts operator is a Hueckel-type edge detector. IEEE Trans. Pattern Anal. Mach. Intell. 1981, 3, 101–103. [Google Scholar] [CrossRef]
  14. Lang, Y.; Zheng, D. An improved Sobel edge detection operator. In Proceedings of the 2016 6th International Conference on Mechatronics, Computer and Education Informationization (MCEI 2016), Chengdu, China, 9–11 July 2016; pp. 590–593. [Google Scholar]
  15. Jiang, X.; Zhang, R.; Nie, S. Image Segmentation Based on PDEs Model: A Survey. In Proceedings of the 3rd International Conference on Bioinformatics and Biomedical Engineering, Beijing, China, 11–13 June 2009; pp. 1–4. [Google Scholar] [CrossRef]
  16. Chan, T.F.; Vese, L.A. Active contours without edges. IEEE Trans. Image Process. 2001, 10, 266–277. [Google Scholar] [CrossRef] [Green Version]
  17. Celebi, M.E.; Iyatomi, H.; Schaefer, G. Contrast enhancement in dermoscopy images by maximizing a histogram bimodality measure. In Proceedings of the 2009 16th IEEE International Conference on Image Processing (ICIP), Cairo, Egypt, 7–10 November 2009; pp. 2601–2604. [Google Scholar]
  18. Yuan, X.; Wu, L.; Peng, Q. An improved Otsu method using the weighted object variance for defect detection. Appl. Surf. Sci. 2015, 349, 472–484. [Google Scholar] [CrossRef] [Green Version]
  19. Vicar, T.; Balvan, J.; Jaros, J.; Jug, F.; Kolar, R.; Masarik, M.; Gumulec, J. Cell segmentation methods for label-free contrast microscopy: Review and comprehensive comparison. BMC Bioinform. 2019, 20, 360. [Google Scholar] [CrossRef]
  20. Long, J.; Shelhamer, E.; Darrell, T. Fully convolutional networks for semantic segmentation. In Proceedings of the IEEE Conference on Computer Vision and Pattern Recognition, Boston, MA, USA, 7–12 June 2015; pp. 3431–3440. [Google Scholar]
  21. Ronneberger, O.; Fischer, P.; Brox, T. U-net: Convolutional networks for biomedical image segmentation. In International Conference on Medical Image Computing and Computer-Assisted Intervention–MICCAI 2015: 18th International Conference, Munich, Germany, 5–9 October 2015, Proceedings of the Part III; Springer International Publishing: Berlin/Heidelberg, Germany, 2015; pp. 234–241. [Google Scholar]
  22. Zhou, Z.; Rahman Siddiquee, M.M.; Tajbakhsh, N.; Liang, J. Unet++: A nested u-net architecture for medical image segmentation. In Deep Learning in Medical Image Analysis and Multimodal Learning for Clinical Decision Support: 4th International Workshop, DLMIA 2018, and 8th International Workshop, ML-CDS 2018, Held in Conjunction with MICCAI 2018, Granada, Spain, 20 September 2018, Proceedings of the 4; Springer: Berlin/Heidelberg, Germany, 2018; pp. 3–11. [Google Scholar]
  23. Guan, S.; Khan, A.A.; Sikdar, S.; Chitnis, P.V. Fully dense UNet for 2-D sparse photoacoustic tomography artifact removal. IEEE J. Biomed. Health Inform. 2019, 24, 568–576. [Google Scholar] [CrossRef] [Green Version]
  24. Khan, N.; Ullah, A.; Haq, I.U.; Menon, V.G.; Baik, S.W. SD-Net: Understanding overcrowded scenes in real-time via an efficient dilated convolutional neural network. J. Real-Time Image Process. 2021, 18, 1729–1743. [Google Scholar] [CrossRef]
  25. Hao, S.; Lee, D.-H.; Zhao, D. Sequence to sequence learning with attention mechanism for short-term passenger flow prediction in large-scale metro system. Transp. Res. Part C Emerg. Technol. 2019, 107, 287–300. [Google Scholar] [CrossRef]
  26. Jaderberg, M.; Simonyan, K.; Zisserman, A. Spatial transformer networks. Adv. Neural Inf. Process. Syst. 2015, 28, 1–9. [Google Scholar]
  27. Hu, J.; Shen, L.; Sun, G. Squeeze-and-Excitation Networks. In Proceedings of the 2018 IEEE/CVF Conference on Computer Vision and Pattern Recognition, Salt Lake City, UT, USA, 18–23 June2018; pp. 7132–7141. [Google Scholar] [CrossRef] [Green Version]
  28. Wang, X.; Girshick, R.; Gupta, A.; He, K. Non-local neural networks. In Proceedings of the 2018 IEEE/CVF Conference on Computer Vision and Pattern Recognition, Salt Lake City, UT, USA, 18–23 June 2018; pp. 7794–7803. [Google Scholar]
  29. Woo, S.; Park, J.; Lee, J.Y.; Kweon, I.S. CBAM: Convolutional block attention module. In Proceedings of the 15th European Conference on Computer Vision (ECCV), Munich, Germany, 8–14 September 2018; pp. 3–19. [Google Scholar]
  30. Liu, W.; Anguelov, D.; Erhan, D.; Szegedy, C.; Reed, S.; Fu, C.Y.; Berg, A.C. SSD: Single shot multibox detector. In European Conference on Computer Vision; Springer: Cham, Switzerland, 2016; pp. 21–37. [Google Scholar]
  31. Xiaoguo, Z.; Ye, G.; Fei, Y.; Qihan, L.; Kaixin, Z. An Approach to Improve SSD through Skip Connection of Multiscale Feature Maps. Comput. Intell. Neurosci. 2020, 2020, 2936920. [Google Scholar] [CrossRef] [Green Version]
  32. Lin, T.Y.; Dollár, P.; Girshick, R.; He, K.; Hariharan, B.; Belongie, S. Feature pyramid networks for object detection. In Proceedings of the IEEE Conference on Computer Vision and Pattern Recognition, Honolulu, HI, USA, 21–26 July 2017; pp. 2117–2125. [Google Scholar]
  33. Mnih, V.; Heess, N.; Graves, A. Recurrent models of visual attention. Adv. Neural Inf. Process. Syst. 2014, 27, 2204–2212. [Google Scholar]
  34. Lin, T.Y.; Goyal, P.; Girshick, R.; He, K.; Dollár, P. Focal loss for dense object detection. In Proceedings of the IEEE International Conference on Computer Vision, Venice, Italy, 22–29 October 2017; pp. 2980–2988. [Google Scholar]
Figure 1. The structure of the proposed RA-Unet network.
Electronics 12 00979 g001
Figure 2. Feature fusion in the encoder.
Electronics 12 00979 g002
Figure 3. Non-Local attention mechanism in the first module of the decoder.
Electronics 12 00979 g003
Figure 4. The Non-Local block design.
Electronics 12 00979 g004
Figure 5. The SENet attention mechanism in the first module of the decoder.
Electronics 12 00979 g005
Figure 6. The SENet design.
Electronics 12 00979 g006
Figure 7. The flow diagram for the dataset preparation.
Electronics 12 00979 g007
Figure 8. Some samples from the dataset. First row represents the original hybridoma cell images. Second row shows Ihe corresponding ground truth images. Third row shows the original cell images with the masks.
Electronics 12 00979 g008
Figure 9. Data labeling tool “LabelMe” for image annotation.
Electronics 12 00979 g009
Figure 10. Rotation reflection transformation example. First row shows the original hybridoma cell images. Second row shows the corresponding cell images after rotation reflection transformation.
Electronics 12 00979 g010
Figure 11. Contrast transformation example. First row shows the original hybridoma cell images. Second row shows the corresponding cell images after contrast transformation.
Electronics 12 00979 g011
Figure 12. Some visual segmentation results of FCN [20], U-Net [21], UNet++ [22] and proposed RA-UNet networks.
Electronics 12 00979 g012
Figure 13. Training loss curve.
Electronics 12 00979 g013
Table 1. Experiments environment configurations.
Experiments EnvironmentSpecific Configuration
operating systemUbuntu 18.04.5 LTS
Memory32G
procesIIIl(R) Xeon(R) Silver 4210 CPU @ 2.20GHz
Graphics cardGeForce RTX 2080 Ti
development environmentVisual Studio Code
Programming languagePython 3.6.13
Deep Learning FrameworkPytorch 1.7.1
Table 2. Segmentation accuracy comparison of RA-UNet with different attention mechanisms. Bold face indicates the best performance.
Experiment No.Attention Accuracy
Non-LocalSENetDicePAMPAMIoU
Experiment1--0.88240.99170.94260.8910
Experiment2-0.88430.99180.94690.8927
Experiment3-0.88750.99230.94870.8955
Experiment40.89370.99260.95120.9007
Table 3. The effect of feature fusion on the segmentation accuracy of the proposed RA-UNet network. Bold face indicates the best performance.
ModelAccuracy
DicePAMPAMIoU
without feature fusion0.88200.99170.94520.8901
with feature fusion0.89370.99260.95120.9007
Table 4. Segmentation accuracy of hybridoma cells by different networks. Bold face indicates the best performance.
ModelAccuracy
DicePAMPAMIoU
FCN [20]0.79770.98790.84780.8255
UNet [21]0.85960.99060.91630.8721
UNet++ [22] 0.8637 0.9909 0.9206 0.8756
Proposed RA-UNet0.89370.99260.95120.9007
Disclaimer/Publisher’s Note: The statements, opinions and data contained in all publications are solely those of the individual author(s) and contributor(s) and not of MDPI and/or the editor(s). MDPI and/or the editor(s) disclaim responsibility for any injury to people or property resulting from any ideas, methods, instructions or products referred to in the content.

