1. Introduction
The wheelchair is one of the most prevalent assistive equipment for improving personal mobility, which is necessary for mobility freedom. Wheelchairs enable persons with impairments to participate fully in their communities. Around 650 million individuals, or nearly 10% of the world population, are disabled [
1]. According to studies, around 10% of these people need a wheelchair. It was estimated that 20 million people who needed a wheelchair for mobility did not have one or could not have access to a wheelchair for multiple reasons, such as higher costs. Persons with a disability who cannot control their manual wheelchair depend on others regarding navigation from one place to another.
According to reports, just a tiny percentage of persons who use wheelchairs have access to one, and of those who do, only a tiny percentage have access to an adequate wheelchair [
1,
2]. Technology nowadays has been advancing greatly. We have the freedom to do anything we choose, even remaining at home. We do not have to rely on others for the vast bulk of our tasks. On the other hand, people with disability do not enjoy the use of advanced technology in terms of safe and intelligent assistance in their navigation on a large scale [
3]. We have developed an intelligent system to assist people with disabilities in navigation, keeping in mind the importance of their safety, health status, and sitting patterns. Therefore, the Smart wheelchair is equipped with motors and two directional switches, which the user may use to operate it.
The user can control their wheelchair in multiple modes, such as using a joystick module, voice navigation, and android app control. Moreover, the wheelchair’s health monitoring system will keep the patient’s physicians updated on their health status 24 h a day, seven days a week. This system allows doctors to take immediate action to rescue the patient in an emergency [
4,
5]. Many people lack proper healthcare, and some do not get enough time from their health consultant, resulting in life losses. Patients need care and monitoring. This study includes a real-time IoT-based health monitoring system where health parameters are measured using a pulse rate sensor, humidity sensor, body temperature sensor, and oximeter.
People who need wheelchairs could have physical or sensory impairments that limit their regular activities. In addition to leading a sedentary lifestyle, many people worldwide may also be susceptible to acquiring a particular form of pressure ulcer because of illnesses linked to limited mobility and its repercussions [
6]. Prolonged sitting and poor posture can hurt a person who uses a wheelchair. Continuous pressure causes limited blood flow, and reduced nourishment and oxygen delivery to skin tissues over time, which can cause regional and deep tissue damage (DTI) [
7,
8]. In general, a wide variety of factors can lead to immobility. The causes of loss of movement can be divided into intrapersonal factors, which are related to psychological factors, such as high levels of stress or anxiety, fear of injury, and post-traumatic stress disorder (PTSD), and due to physical modifications that may have developed because of injuries, including, but not limited to, cardiovascular, cognitive, and musculoskeletal conditions, which expose many groups to the risk of developing pressure ulcers. Although each person’s tolerance for pressure is different, several investigations have discovered that blood vessel blockage may occur at pressures higher than arterial capillary pressure (32 mm Hg) [
9].
Pressure ulcers are substantially more likely to form in those who cannot move without the assistance of others, which are frequently caused by spinal cord injuries, Parkinson’s disease, and osteoporotic fractures. The ischial tuberosities, calcaneus, and back of the knee are the body parts where pressure ulcers most frequently develop in wheelchair users [
9,
10,
11]. However, it can also manifest in other areas of the skin because of poor mobility, abnormalities in moisture content, friction, and shear. One may conclude that determining the proper sitting posture in the first place is essentially the best course of action to minimize the extended severity of the pressure and reduce the likelihood of developing an ulcer. The proposed system is designed to identify abnormal sitting positions and alert users via an Android application to prevent health-related problems. Pressure ulcers occur when the skin is pressed against the wheelchair for an extended period while seated incorrectly. By reviewing their history of sitting posture on a daily or weekly basis, the approach may also be helpful for people without mobility concerns. A post-processing unit can be used to identify irregularities in sitting habits by sharing the saved posture detection history data with medical practitioners later. The system could be applied to pressure ulcer and bed sore risk assessments. Identifying and recording people’s sitting habits can be used as a benchmark and a small, portable health monitoring device. Our research involves using FSR pressure sensors and multiple machine learning algorithms, including SVM, KNN, XG Boost, Logistic regression, decision tree, random forest, and NN.
2. Literature Review
Recent research in the advancement of wheelchairs has been done and has been undergoing for many years. People have designed many kinds of intelligent wheelchairs, including multiple types of additional features, such as health monitoring and posture detection. In China, a system is designed based on a high-performance 16-bit compact single chip that has “Manual”, “Speech”, “Vision”, and “Autonomous” modes that are fulfilled by four modules to operate the wheelchair in four multiple modes. The mode and the corresponding module can be customized according to the needs of different users and situations, lowering costs further [
12]. Mahendra Thakur and other authors developed a wheelchair that can be controlled by four different modes, each targeting a particular case of paralysis or disability. The joystick is mounted on the wheelchair to control the motion of the wheelchair. The headband moves the wheelchair by moving the head in the direction of motion. The eye blink sensor controls the wheelchair by blinking the eyes. The disabled person can control the wheelchair using a Bluetooth application, which reduces external assistance [
13]. Obstacle detection is also a crucial part of an intelligent safe wheelchair. M. Ali Fauzi presented an approach to obstacle distance estimation and navigation for intelligent wheelchairs. The camera captured images from the environment to sense the pathway condition. The line laser was combined with the camera to recognize an obstacle in the pathway based on the shape of the line laser image at a certain angle. A simple linear regression from obtained data was used to estimate the distance between a wheelchair and an obstacle [
14,
15,
16].
S. Umchid and Pitchaya Limhaprasert designed a system consisting of motors and voice recognition modules that will operate the wheelchair’s full range of motion because operating a wheelchair by another person is a difficult process. An obstacle detection system to prevent collisions with barriers is also included in their system [
17]. M. A Alim designed another smart wheelchair, which is Raspberry Pi-controlled. This system accepts commands from Google Translate before being transformed into text. Information is sent to Raspberry via text, and the wheelchair reacts accordingly. A safety system is also present to safeguard users in case of any erroneous directions. Response time to voice instructions is under 1.2 s, and the joystick takes less than 0.65 s [
18].
Table 1 presents the comparison of multiple machine learning algorithms trained by researchers in the past in posture detection systems.
The research in wheelchair systems with health monitoring and posture detection is also a center of attention to many researchers. Jawwad Latif and other authors developed a prototype wheelchair system that uses the internet of Things (IoT) biophysical sensors for AI healthcare monitoring and assistive technology to support the independence of elderly patients. Machine learning algorithms are applied to analyze sensor data to provide real-time feedback to the user and clinicians on risk factors. The system incorporated multiple sources of vital signs, including body temperature, blood pressure, heart rate, and oxygen saturation, with AI in an integrated user interface and an autonomously navigated wheelchair. Many previous studies are centered on sitting posture detection to reduce the risk of pressure ulcers. J. Ahmad proposed a system of a Life Chair for posture detection, using a pressure sensing technique, a cellphone API, and machine learning (ML). An accuracy of 98.93% is achieved by the life chair system in recognition of 13 different postures using a supervised learning algorithm [
18].
3. Materials and Methods
The study includes the study of multiple combinations of FSR sensor’s configuration with multiple machine learning algorithms to achieve the best combination for higher accuracy for detecting human sitting posture. The paper is divided into the following parts: (a) a multi-mode electric wheelchair design with an obstacle detection system, (b) an IoT-based health monitoring system, and (c) a posture detection system using machine learning techniques. Multiple components and sensors are used, which includes health sensors, pressure sensor, and communication modules, such as ESP32 and Bluetooth.
Table 2 presents a detailed overview of the components’ specifications and hardware that are used in the system.
Along with a multi-mode electric wheelchair and health monitoring system, one novel strategy mentioned in this study involves examining and compressing pressure distribution data on a chair, which is one of several approaches and methods for posture detection. In this method, the resistive force sensors FSR are strategically positioned on a typical multi-mode control wheelchair. When a person sits in a wheelchair, the sensors assess the pressure distribution on the wheelchair, and machine learning algorithms predict the posture. To forecast the four incorrect sitting patterns—bending forward, backward, left, and right—seven machine learning algorithms—Logistic Regression, KNN, SVM, random forest, decision, XG Boost, and Neural Network—are used in this study combined with two configurations of FSR sensors to study the best combination for highest accuracy. The detailed system overview of this paper is as follows.
3.1. Multi-Mode Electric Wheelchair with Obstacle Detection
An electric conversion kit to transform a standard wheelchair into an electric wheelchair was developed with a multi-mode-controlled interface to help individuals with varying degrees of disability. Multi-mode controls include joystick control, android application control, and voice control. An essential method of controlling a wheelchair is the joystick. A simple joystick module is utilized to regulate the wheelchair’s movements.
Figure 1 presents the circuit diagram of the joystick control system for controlling the wheelchair.
An android app is designed where we may choose our multi-mode feature of voice or app control, and the rationale behind both controls is identical. Five buttons, including forward, backward, left, right, and stop, are added to control the wheelchair.
The app is in communication with Arduino using a Bluetooth module. The Arduino is then give command under the button’s stated function. The wheelchair’s motors are then appropriately controlled by the Arduino to move in the desired direction.
Figure 2 presents an android app interface to control the movements of the wheelchair. Similarly, in voice control navigation, the phone receives voice instructions, analyses them, and uses Google’s speech recognition technology to translate spoken words into text.
The Arduino Uno communicates text received through Bluetooth using the UART serial communication protocol. The Arduino code validates the text it has received. When the text contains a matching string, Arduino controls the wheelchair in moving forward, moving backward, turning right, turning left, and stopping motions. Moreover, Ultrasonic sensors are used to detect the objects or walls around the wheelchair. The wheelchair will stop after the detection of any obstacle around it.
Figure 3 shows the obstacle avoidance, android app, and voice control system. The battery and one ultrasonic sensor are for reference only.
3.2. IoT-Based Health Monitoring System
The incorporation of a health monitoring system is a novel step in the development of wheelchairs. As we can see, many patients suffer from a lack of primary healthcare. Occasionally, owing to an excess of patients and a shortage of personnel, some patients do not receive adequate attention from their health consultant, resulting in significant life losses. Care and monitoring of each patient’s health are vitally important. Thus, regular monitoring of IoT is utilized to give updates in real-time [
20]. The Internet of things (IoT) is a rapidly expanding technology that offers various benefits because it requires a smart device and an internet connection. IoT’s growth is accelerating due to its widespread application in items we use or encounter daily. IoT is a system that interconnects all physical objects, sensors, and gadgets that transmit data over the Internet. Real-time data are accessible via the Internet of things. Consequently, we can monitor any item or equipment in real-time. We have precise information on what happens every second [
21,
22].
This paper consists of a Health monitoring system comprised of several health sensors. These health monitoring sensors offer the patient’s heart rate, oxygen saturation, and body temperature. In addition, it provides the room’s temperature and humidity. ESP32 is used to interface with all these sensors. An oximeter sensor is used for pulse and oxygen levels, whereas a body temperature sensor monitors a patient’s body temperature. A Wi-Fi module transmits sensor data in real time through the Android app or HMI web. Through the Wi-Fi and dual core of the ESP32 module, embedded devices may connect to networks and transfer data. This ESP32 module transmits sensor data to the android App and HMI web using its Wi-Fi capability [
23]. This paper presents a cloud-based interface on an android application for IoT-based health monitoring that delivers real-time health metrics, including temperature, oxygen level, and heart rate. This way, Health information can be shared with any caretaker, and the health history track can be recorded later with health personnel.
Figure 4 presents the circuit interfacing of health sensors with the ESP32 module.
Figure 5 presents health data graphs on ThingSpeak. The data can be accessed from anywhere around the world using the right IP address.
3.3. Posture Detection System Using Machine Learning Techniques
Machine learning algorithms are used to detect the sitting patterns of a wheelchair user. A better accuracy model is picked to monitor irregular and ideal posture after testing two configurations and seven machine learning algorithms. The suggested system is aimed at recognizing and notifying odd and inappropriate postures to prevent sitting-related health concerns, such as pressure ulcers. For pressure ulcer risk evaluations, the presented system may be applied. The posture detection system is divided into the following sections: (i) hardware system design and data extraction, (ii) data pre-processing, and (iii) Data processing.
3.3.1. Hardware System Design and Data Extraction
Two different software have been used for designing the proposed model, Arduino IDE is used for the programming of Arduino to extract the data into excel for data generation, and the second, google Colab, is used for applying machine learning algorithms. Two configurations are tested using nine FSR sensors. One configuration is random, where nine FSR sensors are embedded randomly on the wheelchair seat by the normal pressure distribution of the person, and the other configuration is in the 3 × 3 matrix form, which is well aligned.
Figure 6 shows both configurations of the system.
The FSR sensors are connected to Arduino mega, and for data generation, the Arduino is connected to Arduino IDE software, where all the data is displayed on a serial monitor. Excel files are generated to store the data of multiple postures for training machine learning algorithms.
Figure 7 shows the circuit diagram of FSR sensors connected to Arduino mega for data extraction. When data is extracted and all models are trained, then an ESP module is connected to this system for wireless communication between hardware systems, where machine learning algorithms are trained, real-time data flows using a Wi-Fi module, and using Machine learning techniques, real-time posture is detected and displayed on an android app. All the detailed process of data collection, data pre-processing, and data processing is presented in the following section.
3.3.2. Data Collection
The data set is generated inside COMSATS UNIVERSITY Islamabad, Lahore Campus, and students, staff, and faculty, who varied in height, weight, and overall body mass, participated in the generation of the data set. The total number of samples collected was 635 from various individuals, and among them, 155 samples have a forward-leaning posture, 145 have a backward-leaning posture, 160 have a right-leaning posture, and 175 have a left-leaning posture. The age range varies from 20 years to 45 years, and the BMI values range in the samples that were taken is from 16 to 35.
3.3.3. Data Pre-Processing
Pre-processing data is an effective way to add value and significance to raw data. The data set is refined using data pre-processing techniques into a functional form, and only useful data is extracted from the raw data. The data set is cleaned by removing the duplicated, wrong, and null elements. The dataset’s date and time columns are eliminated, reducing the useless column. Additionally, outliers result in an incorrect prediction elimination. Extracting null rows and columns, eliminating them, and rearranging them according to their principal values is a significant step in the pre-processing of data. Smote analysis eliminates values when there is repetition, and increases the significance of the data set.
3.3.4. Data Processing
Seven machine learning methods are used to detect the posture once the data has been preprocessed, and their execution times and accuracy have been evaluated. Seven machine learning algorithms used in this study are KNN, SVM, logistic regression, decision tree, random forest, XG Boost, and NN.
KNN
Using a KNN algorithm, values are predicted based on the proximity of nearby objects. If you want to calculate the distance between two points in your dataset, you may use Euclidean distance, which is a well-known method for doing so. To limit the number of mistakes, running the KNN algorithm repeatedly for different values of K is essential [
24]. To keep the algorithm’s capacity to create accurate predictions, the pre-processing approach is employed in this study to help improve the accuracy of the KNN algorithm. Due to majority voting/averaging, predictions become more stable as the value of k decreases. By raising the value of k, forecasts stabilize and become more accurate. Euclidean, Manhattan, and Minkowski distance functions are used to compute the distance from the nearest neighbor as shown in Equations (1)–(4), respectively.
SVM
In N-dimensional space, the SVM method locates a hyperplane. N can clearly distinguish between data points based on their overall characteristics. SVM maximizes the distance between the data points. By using the hyperplane and the loss function, you may increase the margin and reduce what is known as hinge loss.
Hinge Loss Function: t → target variable, w →model parameters, x → Input variable
Decision Tree
In terms of supervised learning, the Decision Tree algorithm is the simplest and most efficient method available. Data points in the algorithm’s decision tree are constantly divided up based on certain criteria, and the algorithm works to find a solution. Decision trees can also be referred to as classification or regression trees [
25,
26,
27,
28,
29]. Top-down reasoning is used in decision trees. The results of the decision tree are depicted by the tree’s leaves. Dividing and conquering is a way of referring to decision trees (recursive partitioning). Entropy is an information theory metric that assesses uncertainty or impurity by constructing a set of observations based on a heuristic offered in the context of a particular problem (5). In the meanwhile, Gini assesses the chance of a certain characteristic being wrongly labelled when picked at random (6).
Logistic Regression
Based on the past observations of a particular data set, the statistical analysis approach, known as logistic regression, may predict binary outcomes in the form of 0 or 1. A logistic regression model predicts a dependent data variable based on the connection between the existing independent variables and the cost function of logistic regression (7). Given a set of characteristics, logistic regression may determine whether a record belongs to a positive class or not (8).
Artificial Neural Network
Using an artificial neural network, the weighted sum of inputs is computed along with a bias. A transfer function is used to express this calculation (9):
To get the result, the weighted total is fed into an activation function. A node’s activation function determines whether it will fire. Output is limited to those who have been fired. For this task, many distinct activation functions can be used.
Random Forest
RF will build many individual decision trees. In both classification and regression, the final prediction is based on averaging the predictions from all trees [
28,
29,
30,
31]. Ensemble approaches are used to reach a final choice based on a set of outcomes. Gini impurity is defined as: fi is the frequency of label ‘i’ at a node, and c is the number of unique labels (10):
XGBoost
Thus, fi is the frequency of label ‘i’ at a node, and c is the number of unique labels. Models may be treated as classifiers or regressions in the scikit-learn system XGBoost’s covering class. The XGB Classifier is the XGBoost model’s name for grouping. Our preparation datasets may be used to create and fit this model. The scikit-learn API and the model are used to build models. Fit () has been tested and shown to be effective. To get the model ready, pass bounds to the function Object () {[native code]} and have them appear in the model’s parameter list. Thus, we are going to use appropriate default values. Printing the model allows us to see the trained XGBoost model’s output data. Its objective function is the sum of the loss function evaluated across all predictions and a regularization function for each predictor (j trees). A forecast from the jth node of the tree is represented by the symbol f
j (11).
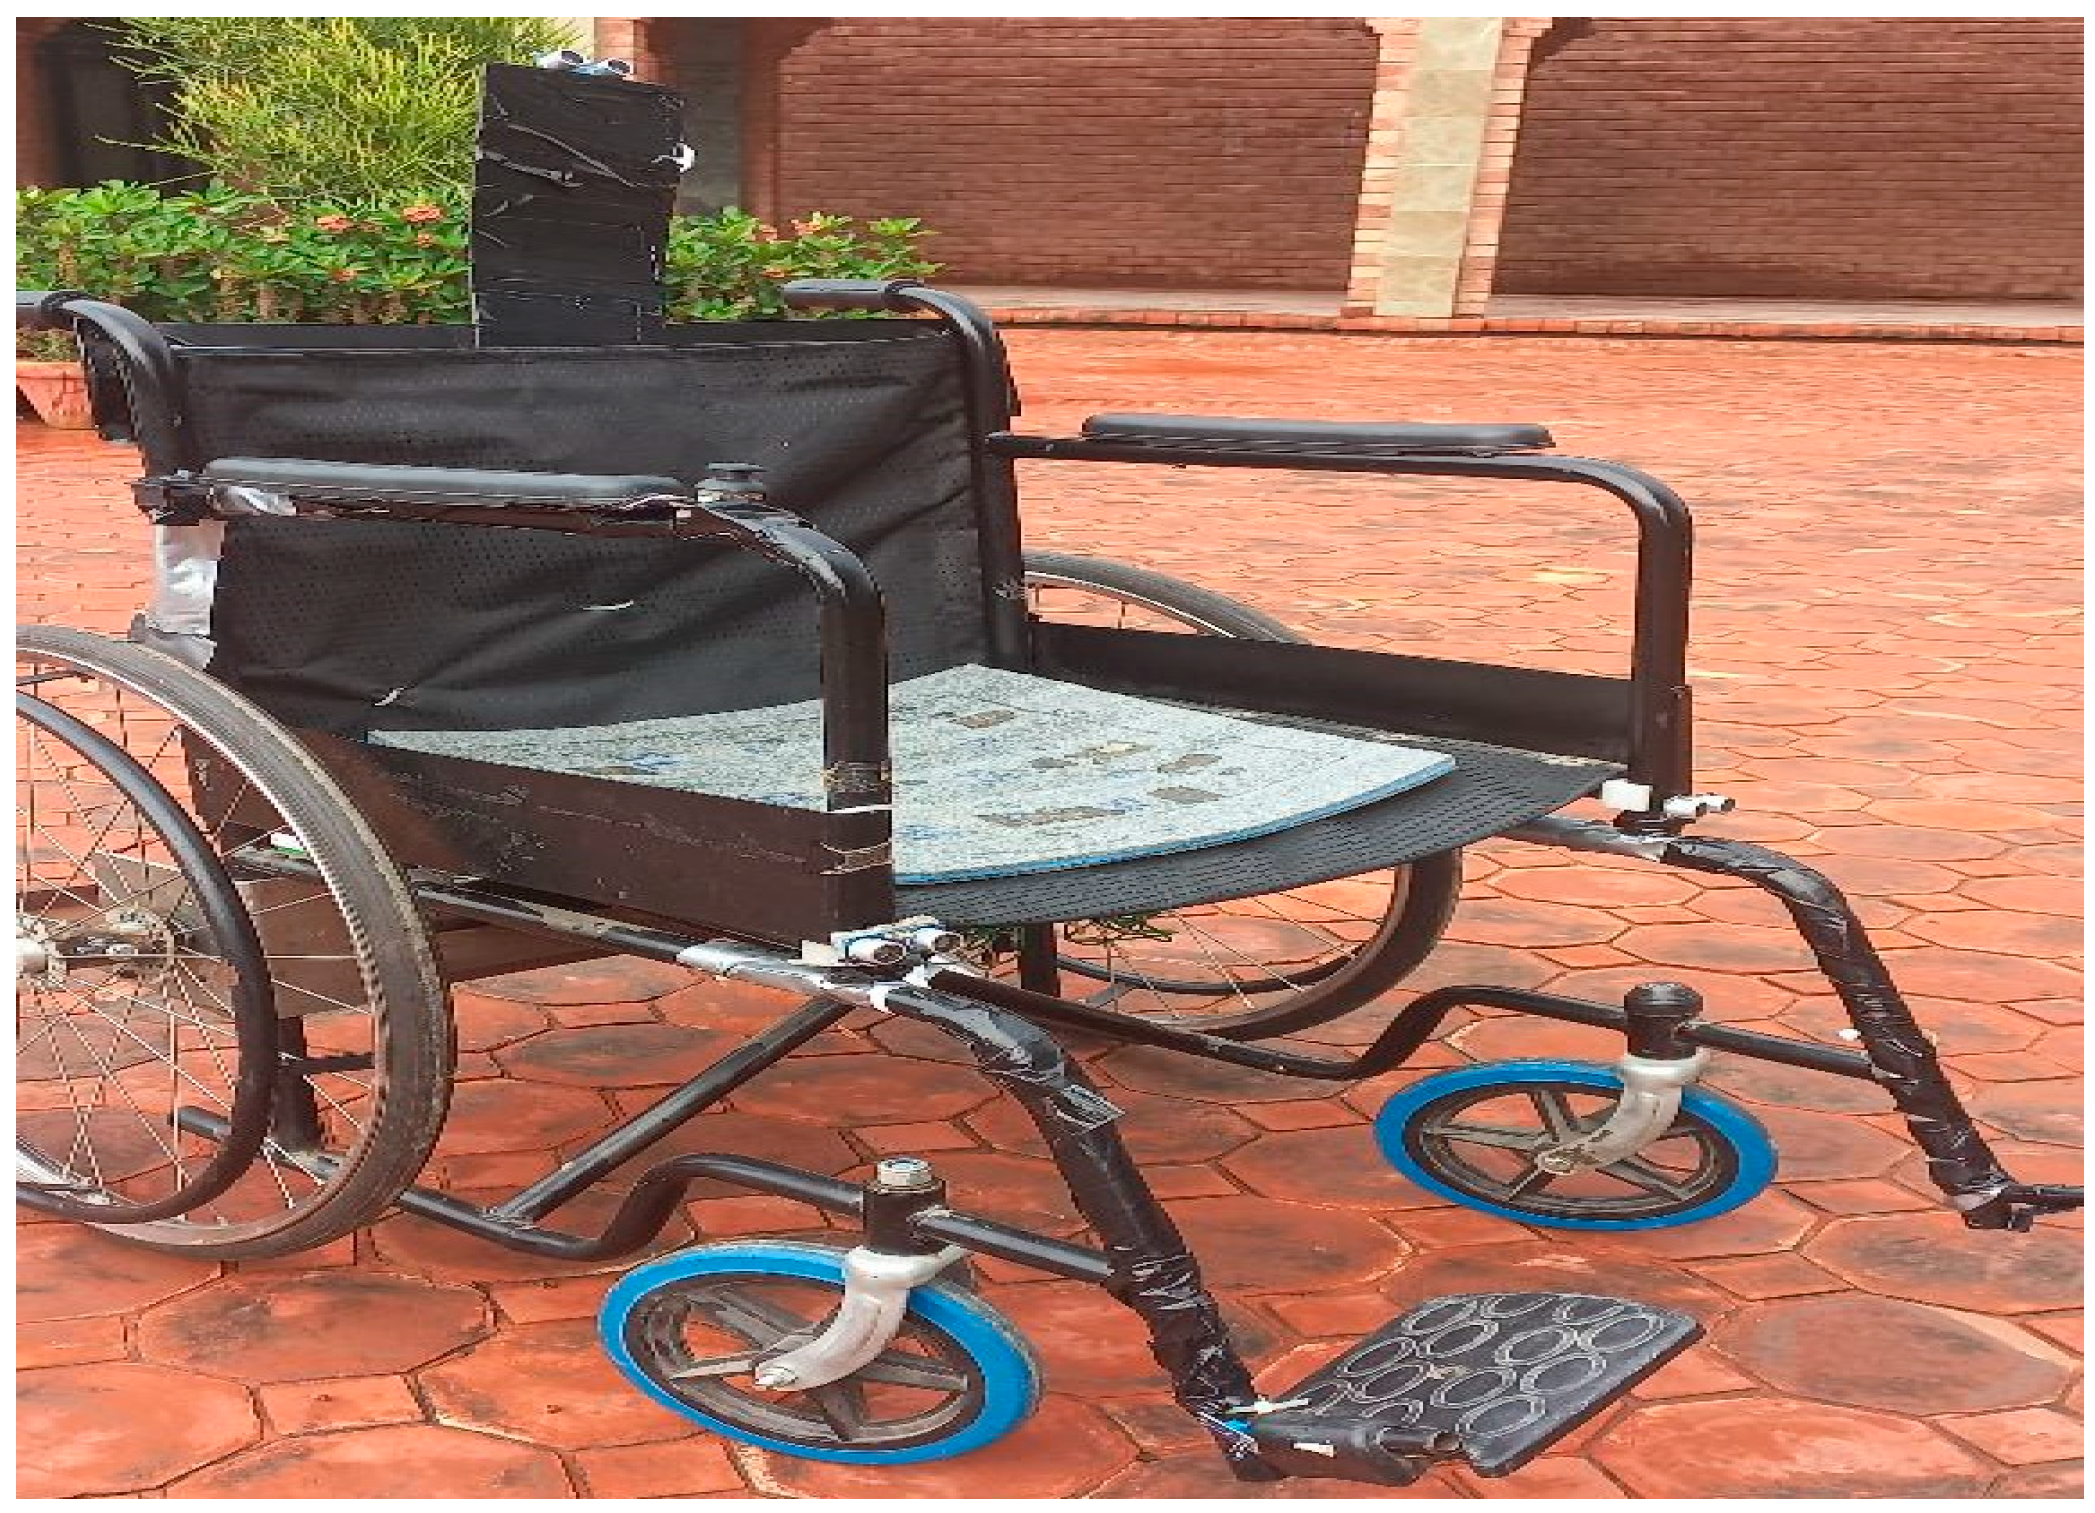
The complete system includes a multi-mode electric wheelchair with a joystick, app, and voice control. IoT-based Healthy monitoring system and a smart posture detection system using machine learning algorithms are also presented. Following
Figure 8 presents the overview of the proposed system while
Figure 9 displays the designed wheelchair along with installation of the proposal of
Figure 8.
4. Result and Discussion
Multiple machine learning algorithms have been applied, and their training and cross-validation accuracies have been computed, considering precision to add the algorithm performance. Two different arrangements have been used the random distribution of FSR sensors, and the 3 × 3 matrix of FSR sensors. The results of each configuration are in the following sections.
4.1. Random Arrangement
For this arrangement, the
KNN (K-Nearest Neighbor) method forecasting precision is 60.72 percent, the training accuracy is 60.78 percent, and the cross-validation accuracy is around 59.46 percent. The KNN is a non-parametric method; it never makes any assumption on underlying data. The KNN is a lazy learner that saves data at the time of classification. However, the advantage of adopting KNN is that it is easy to construct. The Logistic Regression classification technique yields roughly 63.67 percent precision, a training accuracy of 62.75 percent, and a cross-validation accuracy of 58.49 percent. Logistic regression delivers accurate results utilizing binary classification problems; however, our developed method comprises multiclass classification.
Table 3 shows the classifier performance comparison.
The supplied dataset is divided into subgroups using Random Forest, which uses these subsets to build several decision trees. To increase the dataset’s forecast accuracy, an average is required. Increasing the number of trees in the forest leads to greater accuracy and avoids the problem of overfitting. Predictive precision of 85.31 percent, training accuracy of 84.31 percent, and cross-validation accuracy of 78 percent are all generated using Random Forest. An algorithm’s performance may be seen using a particular table structure called a confusion matrix, also known as an error matrix. This method is commonly used for supervised learning (in unsupervised learning, it is usually called a matching matrix). Both variations of the matrix, where each row represents examples in an actual class and each column represents instances in a predicted class, are documented in the literature. The name was chosen since it is simple to determine whether the system conflates two classes (i.e., commonly mislabeling one as another). This contingency table has two dimensions,” actual” and “predicted,” with identical sets of “classes” in each dimension.
It can be seen clearly through the confusion matrix in
Figure 10 the relation between the actual label of classes and the predicted label of classes. The many classes are predicted wrong in this configuration. The Receiver Operator Characteristic (ROC) curve is a measurement tool for binary classification issues. Essentially, it separates the “signal” from the “noise” by plotting the TPR against the FPR at different threshold levels. The capacity of a classifier to differentiate between classes is measured by the Area Under the Curve (AUC), which is used as a summary of the ROC curve. The model performs better at differentiating between the positive and negative classes the higher the AUC is in
Figure 11. The Receiver Operator Characteristic (ROC) curves the same as the accuracy of a machine learning model in an ideal case with a 100% perfect model that is unity (1).
Due to an intuitive, but incorrect interpretation of specificity, the visual interpretability of ROC plots in unbalanced datasets might be misleading in judgments regarding the reliability of classification performance. Contrarily, because they assess the proportion of true positives among optimistic predictions, precision-recall curve plots can provide the observer with a precise forecast of future classification performance. The precision-recall curve between all classes is shown in
Figure 12.
4.2. 3 × 3 Arrangement
The KNN (K-Nearest Neighbor) approach forecasting precision is 69.39 percent, the training accuracy is 69.88 percent, and the cross-validation accuracy is roughly 75.62 percent for this arrangement. The logistic regression precision is 63.67 percent, with training accuracy of 62.75 percent and a cross-validation accuracy of 58.49 percent.
Table 4 shows the values in tabular form.
The Logistic Regression classification method is an excellent choice for many applications. There is a cross-validation accuracy of 88.95%, and a training accuracy of 85.71% using the Decision Tree approach, with a precision of 85.85%. Precision in the SVM method is 81.79 percent, while the training accuracy is 81.08 percent, and the cross-validation accuracy is 82.86 percent for the SVM. Precision is 50.8 percent, the training accuracy is 52.12 percent, and cross-validation accuracy is 50.67 percent for the NN model. Using Random Forest, the predictive precision is 89.69 percent, the training accuracy is 88.80 percent, and the cross-validation accuracy is 94.29%. XGBoost uses a second-order Taylor approximation in the loss function to Newton-Raphson technique, unlike gradient boosting, which operates as gradient descent in function space. An unregularized XGBoost algorithm can be summarized as Input: a collection of training data and a loss function that is differentiable; XG Boost produces a precision of 90.47%, with a training accuracy of 90.34%, and cross-validation accuracy of 94.48%. It can be observed through the confusion matrix in
Figure 13 the relation between the actual label of classes and the predicted label of classes. Maximum classes are predicted right in this.
The region of convergence is the same as the accuracy of a machine learning model. The micro average of the ROC curve is 0.98, which shows that the model performance is very reliable shown in
Figure 14.
The visual interpretability of ROC charts in imbalanced datasets may be deceiving in assessments of the reliability of classification performance due to an intuitive but inaccurate interpretation of specificity. Contrarily, precision-recall curve plots can give the observer an accurate prediction of future classification performance since they measure the fraction of real positives among optimistic forecasts in
Figure 15.
On average, the creation of 600 training instances took 6.8 s with greater scalability, as shown in
Figure 11. XG Boost achieves 94.48 percent accuracy with 600 training examples. It can be seen that, as training examples increase, the accuracy score also increases along with it, and the whole process took 6.8 s to achieve 94.48% accuracy shown in
Figure 16.
4.3. Comparative Analysis
Cross-validation, training accuracy, and precision are used to compare these two sensors’ arrangements. When run through the XG Boost algorithm, the 3 × 3 matrix design produced better results for posture detection, with a training accuracy of 90%, and a cross-validation accuracy of 94%. As shown in
Table 5, there is a direct comparison between the two setups using machine learning techniques. The 3 × 3 matrix arrangement obtained improved accuracy and precision. Hence, this configuration delivers superior results for posture identification.
5. Conclusions
A multi-mode electric conversion kit is designed to convert a manual wheelchair into an intelligent wheelchair with multiple features. Multiple modes of operation are added, such as joystick control, android app control, and voice control. An IoT-based health monitoring system is presented in this study, where real-time data of health parameters can be displayed on an android application using a Wi-Fi module to access anywhere at any time. Moreover, an intelligent posture detection system using machine learning algorithms is designed. When a wheelchair user has various infirmities, such as immobile hands, voice instructions can control the wheelchair thanks to the multi-Mode capability. A person will only use application buttons and voice instructions to operate his wheelchair. Application buttons and voice instructions will be used to operate the wheelchair. A basic joystick that can be used with just two fingers of a hand is attached, making it possible to move and adjust the position of a wheelchair with ease. Including a safety obstacle detection system required an obstacle detection feature to increase the project’s level of safety. This research’s most crucial and challenging aspects are posture detection and identification. A wheelchair user who uses their wheelchair all day in the incorrect position is at significant risk of getting pressure sores. A system is created to identify improper posture and determine the optimal posture to prevent pressure ulcers with high accuracy. While using the XG Boost algorithm on a 3 × 3 matrix arrangement of FSR sensors, the maximum training accuracy of 90.34%, the highest cross-validation accuracy of 94.48%, and the most excellent precision of 90.47 % are attained. Overall, this system’s design is the most market-appropriate for accommodating various impairments. Its posture detection characteristics increase its significance and dependability for a patient utilizing it.


 ,
, 


