Article

Probability-Based Diagnostic Imaging of Fatigue Damage in Carbon Fiber Composites Using Sparse Representation of Lamb Waves

1
Faculty of Information Engineering and Automation, Kunming University of Science and Technology, Kunming 650500, China
2
Yunnan Key Laboratory of Artificial Intelligence, Kunming University of Science and Technology, Kunming 650500, China
3
Faculty of Civil Aviation, Kunming University of Science and Technology, Kunming 650500, China
*
Author to whom correspondence should be addressed.
Electronics 2023, 12(5), 1148; https://doi.org/10.3390/electronics12051148
Submission received: 7 February 2023 / Revised: 21 February 2023 / Accepted: 24 February 2023 / Published: 27 February 2023

Abstract

:
Carbon fiber composites are commonly used in aerospace and other fields due to their excellent properties, and fatigue damage will occur in the process of service. Damage imaging can be performed using damage probability imaging methods to obtain the fatigue damage condition of carbon fiber composites. At present, the damage factor commonly used in the damage probability imaging algorithm has low contrast and poor anti-noise performance, which leads to artifacts in the imaging and misjudgment of the damaged area. Therefore, this paper proposes a fatigue damage probability imaging method for carbon fiber composite materials based on the sparse representation of Lamb wave signals. Based on constructing the Lamb wave dictionary, a fast block sparse Bayesian learning algorithm is used to represent the Lamb wave signals sparsely, and the definition of Lamb wave sparse representing the damage factor calculates the damage probability of the monitoring area and then images the fatigue damage of the carbon fiber composite materials. The imaging research was carried out using the fatigue monitoring experiment data of NASA’s carbon fiber composite materials. The results show that the proposed damage factor can clearly distinguish the damaged area from the undamaged area and has strong noise immunity. Compared with the energy damage factor and the cross-correlation damage factor, the error percentages are reduced by at least 58.63%, 28.11%, and 8.43% for signal-to-noise ratios of 6 dB, 3 dB, and 0.1 dB, respectively, after adding noise to the signal. The results can more accurately reflect the real location and area of fatigue damage in carbon fiber composites.

1. Introduction

As an advanced material combining high strength, high stiffness, and low density, carbon fiber composites are commonly used in aerospace, energy, petrochemical, rail transportation, and other fields [1,2]. It is difficult to detect the internal fatigue damage of carbon fiber composite materials during service, which will cause damage to important components and cause accidents [3]. Therefore, it is necessary to carry out structural health monitoring of carbon fiber composite materials, image fatigue damage, and determine the damage location, size, and shape [4,5]. Commonly used structural health monitoring methods include the acoustic emission method, electromechanical impedance method, Lamb wave method, etc. [6]. Lamb waves propagate in the measured structure with low signal attenuation, sensitivity to damage, and high accuracy, so the Lamb wave method is commonly used to image the damage of carbon fiber composite materials in monitoring [7,8]. The complex structure of carbon fiber composites and the dispersive, multimodal nature of Lamb waves lead to difficulty in obtaining accurate wave velocities, limiting the use of time-reversal imaging [9], time-delayed cumulative imaging [10], laminar imaging [11], phased array imaging, and other methods [12]. Damage probability imaging methods [13] compare the difference between the reference signal and the damage scattering signal, and the damage probability value of the monitored area is calculated to realize damage imaging. This method does not need to calculate the propagation velocity of the Lamb wave, is simple and easy to implement, and has a good application prospect. However, different damage factors in the damage probability imaging method will have a great impact on the imaging effect. Therefore, in the application of the damage probability imaging method, selecting a damage factor with a better damage imaging effect is the key to improving the accuracy of fatigue damage probability imaging of carbon fiber composite materials.
At present, many researchers have used different damage factors to achieve damage probability imaging. Zhang et al. [14] propose a Lamb wave convolutional sparse coding (LW-CSC) method to extract damage features in order to address the problem it is difficult to extract damage-related features effectively from Lamb waves due to dispersion and multimodal characteristics, and combine it with an imaging algorithm for damage identification and localization. This method requires more data for training and validation, which means that more sensors need to be arranged to obtain the data and the method is more complicated to implement. Liu et al. [15] used the combination of cross-correlation damage factor and improved damage probability function to realize accurate damage location of the composite-reinforced panel. Hameed et al. [16] used continuous wavelet transform to extract damage features for damage imaging of plate structures. Memmolo et al. [17] used multipath and multiparameter methods to extract different features from propagating waves to effectively identify and localize damage in composite structures. Wan et al. [18] used the empirical mode decomposition (EMD) algorithm to decompose Lamb waves into intrinsic mode function (IMF) and defined the energy change of IMF as a damage factor to achieve imaging of composite damage under different noise. Thalapil et al. [19] used signal difference coefficient as a damage factor to achieve imaging of ripple defects in carbon fiber composites. Damage imaging using the damage factors in the above studies has certain effects and can achieve damage location. However, under the same conditions, due to the influence of external environmental noise and other factors, it is difficult to extract effective signal features and the contrast of damage factors is not high. The damaged area varies greatly, and the damage location is not accurate. In this paper, we propose a high-contrast damage factor for damage imaging.
The sparse representation method can prevent the extracted damage factor from being affected by noise by designing a suitable dictionary, and can better distinguish the damaged area from the non-damaged area. Therefore, this paper proposes a damage factor based on the sparse representation of the Lamb wave signal for carbon fiber: Probabilistic Imaging of Fatigue Damage in Composite Materials. The effective part of the excitation Lamb wave signal is time-shifted to construct a Lamb wave dictionary, and the collected Lamb wave signal is sparsely represented through the dictionary, and the Lamb wave sparse representation damage factor of each excitation-sensing channel is calculated; according to the damage factor, calculate the superimposed damage existence probability of each pixel point in each excitation-sensing channel, map the pixel value of the pixel point to the damage existence probability value, realize the fatigue damage imaging of carbon fiber composite materials, and analyze the imaging effect and resistance of different damage factors’ noise performance.
The remainder of this paper is as follows: Section 2 introduces the extraction of damage factors based on sparse representation. Section 3 introduces the principle of damage probabilistic imaging. Section 4 introduces the experimental scheme and the fatigue damage probability imaging of carbon fiber composite materials based on Lamb wave sparse representation, and compares the damage imaging effects of different damage factors in the noise environment. The Section 5 summarizes and looks towards future implications of the work.

2. Damage Factor Extraction Based on Sparse Representation

2.1. Sparse Representation Theory

Sparse representation theory is a popular research direction in the field of signal processing. Its main idea is to use a linear combination of fewer basic signals to represent most or all of the original signals [20]. The expression of signal sparse representation is
y = D s + ε  
where y is the original signal, D is the dictionary, each of its column vectors is called an atom, and s is the sparse representation of the signal, ε is the residual of the sparse representation. Assuming a known dictionary D , solve for the sparse representation signal s , that is, solve for the linear combination of the signal y that minimizes the l 0 -parameter under the dictionary D and also satisfies the reconstructed residuals less than the residual limit ε max , which is calculated as follows:
min s s 0 s . t D s y 2 2 ε max 2
where s 0 denotes the l 0 -parametric number, and the above solving l 0 -parametric number belongs to the NP-difficulty combinatorial optimization problem, which is computationally intensive [21]. Tao [22] proved that under the condition that the dictionary D satisfies the finite isometric property, the l 0 -parametric optimization problem has the same solution as the l 1 -parametric optimization problem, and Equation (2) can be transformed into the convex optimization problem shown in Equation (3).
min s s 1 s . t D s y 2 2 ε max 2
The methods for solving the above sparse problems include a greedy algorithm, convex optimization algorithm, and block-sparse Bayesian learning algorithm [23]. Lamb wave signals have the structure of chunks at different moments and similar modes in the chunks. Since the greedy algorithm and convex optimization algorithm do not consider the correlation between signal chunks and chunks, the literature [24] makes full use of the correlation between sparse chunks of signals and proposes a block sparse Bayesian learning algorithm; therefore, the following will use the block sparse Bayesian learning algorithm for the sparse representation of Lamb signals.

2.2. Lamb Wave Sparse Representation Based on Fast Block-Sparse Bayesian Learning Algorithm

(1) Dictionary construction.
In the carbon fiber composite material fatigue damage probability imaging based on Lamb wave sparse representation, y b is the reference signal, y d is the monitoring signal, and y s is the damage scattering signal, and its expression is as follows:
y s = y d y b
The damage scatter signal contains both damage signal and noise signal. Therefore, in order to make the designed dictionary match the damage signal in the damage scatter signal and not be affected by noise, the atoms in the dictionary can be composed of the effective part of the excitation signal. Assuming that the Lamb wave excitation signal is δ ( t ) , A is the amplitude of the excitation signal, H is the Heaviside step function, f c is the center frequency of the excitation signal, n is the number of periods, t is the time, then a complete excitation signal is the signal contained in the period t from 0 to n / f c time; take this part of the signal as the effective part of the excitation signal d ( t ) , and its expression is as follows:
d ( t ) = A [ H ( t ) H ( t n / f c ) ] δ ( t )
The other atoms in the dictionary can be obtained by time-shifting the effective part of the excitation signal. Assuming that the number of sampling points of the excitation signal is k , each time t k is moved, a total of k times is moved, and the size of the dictionary is k × k . In this way, atoms can be in the subsequent sparse representation of the signal, it matches the damage signal in different periods of the damage scattering signal, but does not match the noise signal, so the sparse representation signal only contains the damage signal. The structure of the dictionary is shown in Figure 1.
The expression of the Lamb wave dictionary is as follows:
D = [ d ( t ) 0 0 0 0 d ( t ) 0 0 0 0 d ( t ) 0 0 0 0 d ( t ) ]
(2) Sparse Representation of Lamb Wave Signals.
Lamb wave signals include direct signals, boundary reflection signals, and damage signals that arrive at the sensor at different times. These signals are composed of Lamb wave signals with similar modes. Therefore, Lamb wave signals have blocks at different times and the modes in the blocks are of a similar structure. Assuming that the sparse representation signal s also has the block-like structure [25], where the i -th block is denoted by s i , the expression of the signal model for s i is as follows:
p ( s i | { γ i , B i } ) = N ( s i ; 0 , Γ )
where γ i is a non-negative parameter representing the block sparsity of s i . B i is a positive definite matrix representing the non-negative parameters of the i -th block correlation structure. Γ = d i a g 1 ( γ 1 B 1 , γ i B i ) is the covariance matrix of s i . The posterior probability density function of s is shown in Formula (8):
p ( s i | y , { γ i B i } , β ) = N ( s i | μ , )
where β is the variance of s i , = ( Γ 1 + D T β D ) 1 is the covariance, and μ = D T β y is the mean value of the posterior probability density function. As long as parameters γ i , B i , and β are determined, the sparse representation signal of s can be obtained from the posterior probability density function. When using the fast block-sparse Bayesian learning algorithm to solve the problem, the correlation between the blocks of the Lamb signal is used to form similar modes. The sparse representation effect is excellent, and there is no need to estimate the parameters. The solution process is relatively simple. See reference [26] for the process.

2.3. Damage Factor Based on Lamb Wave Sparse Representation

In addition to the damage signal, the Lamb wave signal also contains noise signals such as boundary reflections and external environmental influences, so that the damage factor is affected by the noise signal and the contrast is not high, resulting in a large difference between the damage imaging area and the real damage area. The sparse representation method can make the dictionary match the damage signal in the damage scattering signal and not be affected by noise by designing a suitable dictionary. Therefore, the Lamb wave sparse representation signal retains the damage signal and removes the noise signal. At the same time, the sparseness of the Lamb wave indicates that the peak value of the signal can reflect the damage degree, and its peak time can reflect the time when the Lamb wave arrives at the damage. When the structure is damaged, the sparseness of the Lamb wave indicates that the peak value of the signal changes greatly and intuitively, and the peak time changes rapidly. Damage imaging can be performed in combination with peak and peak time as damage factors. Define the peak value and peak time variation between the reference signal and the damage scattering signal as the Lamb wave sparsely represents the damage factor, and when passing through the damaged area, the value of Lamb wave sparse representation damage factor is larger, the value of the damage factor that has not passed through the damaged area is smaller, that is, the contrast of this damage factor is higher. Its expression is as follows:
D I j = log ( s d , j ) t d , j log ( s b , j ) t b , j log ( s b , j ) t b , j
where s b , j is the sparse representation signal peak of the reference signal, t b , j is the peak time corresponding to s b , j , s d , j is the sparse representation signal peak value of the damage scattering signal, and t d , j is the peak time corresponding to s d , j .

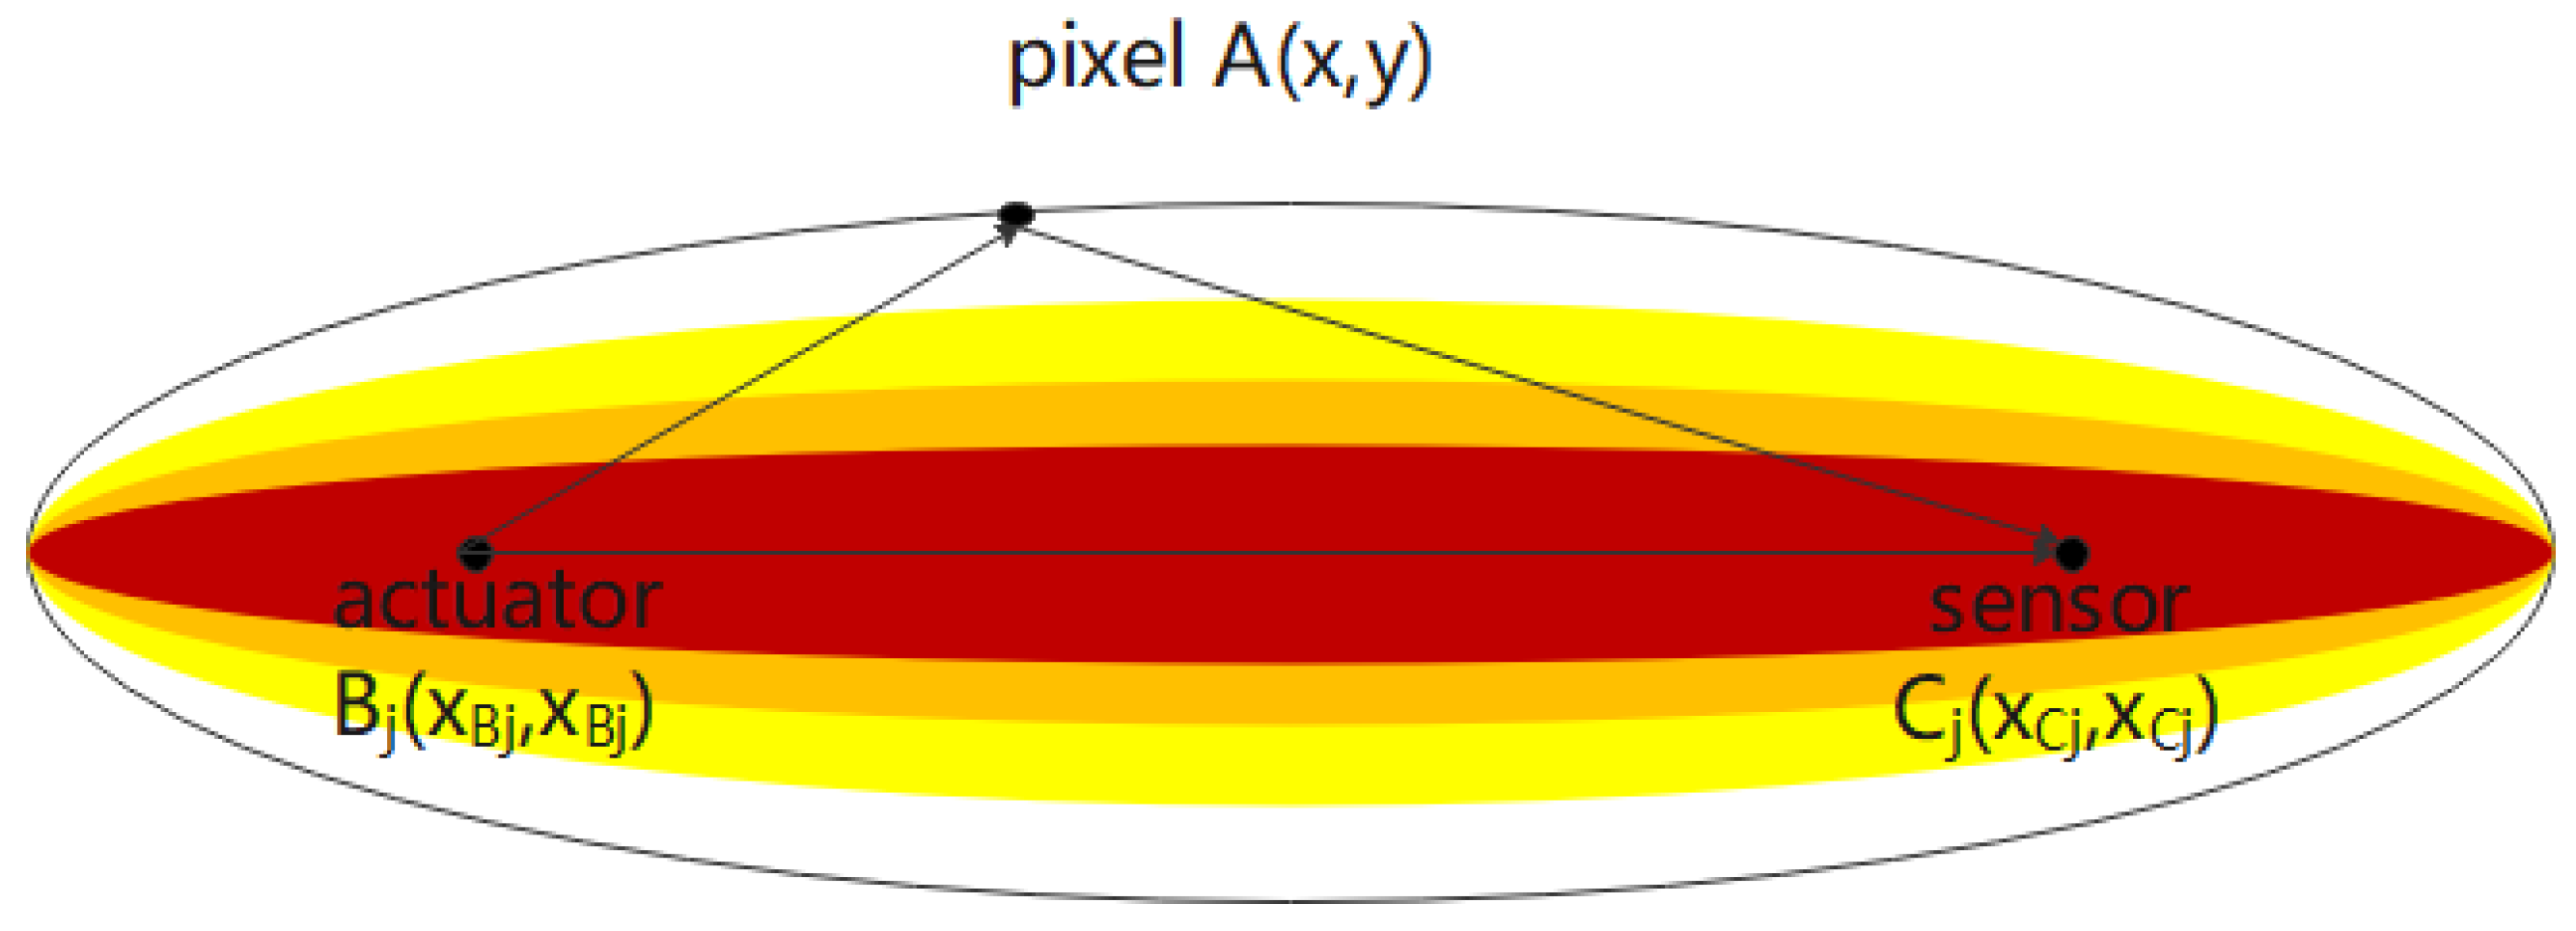
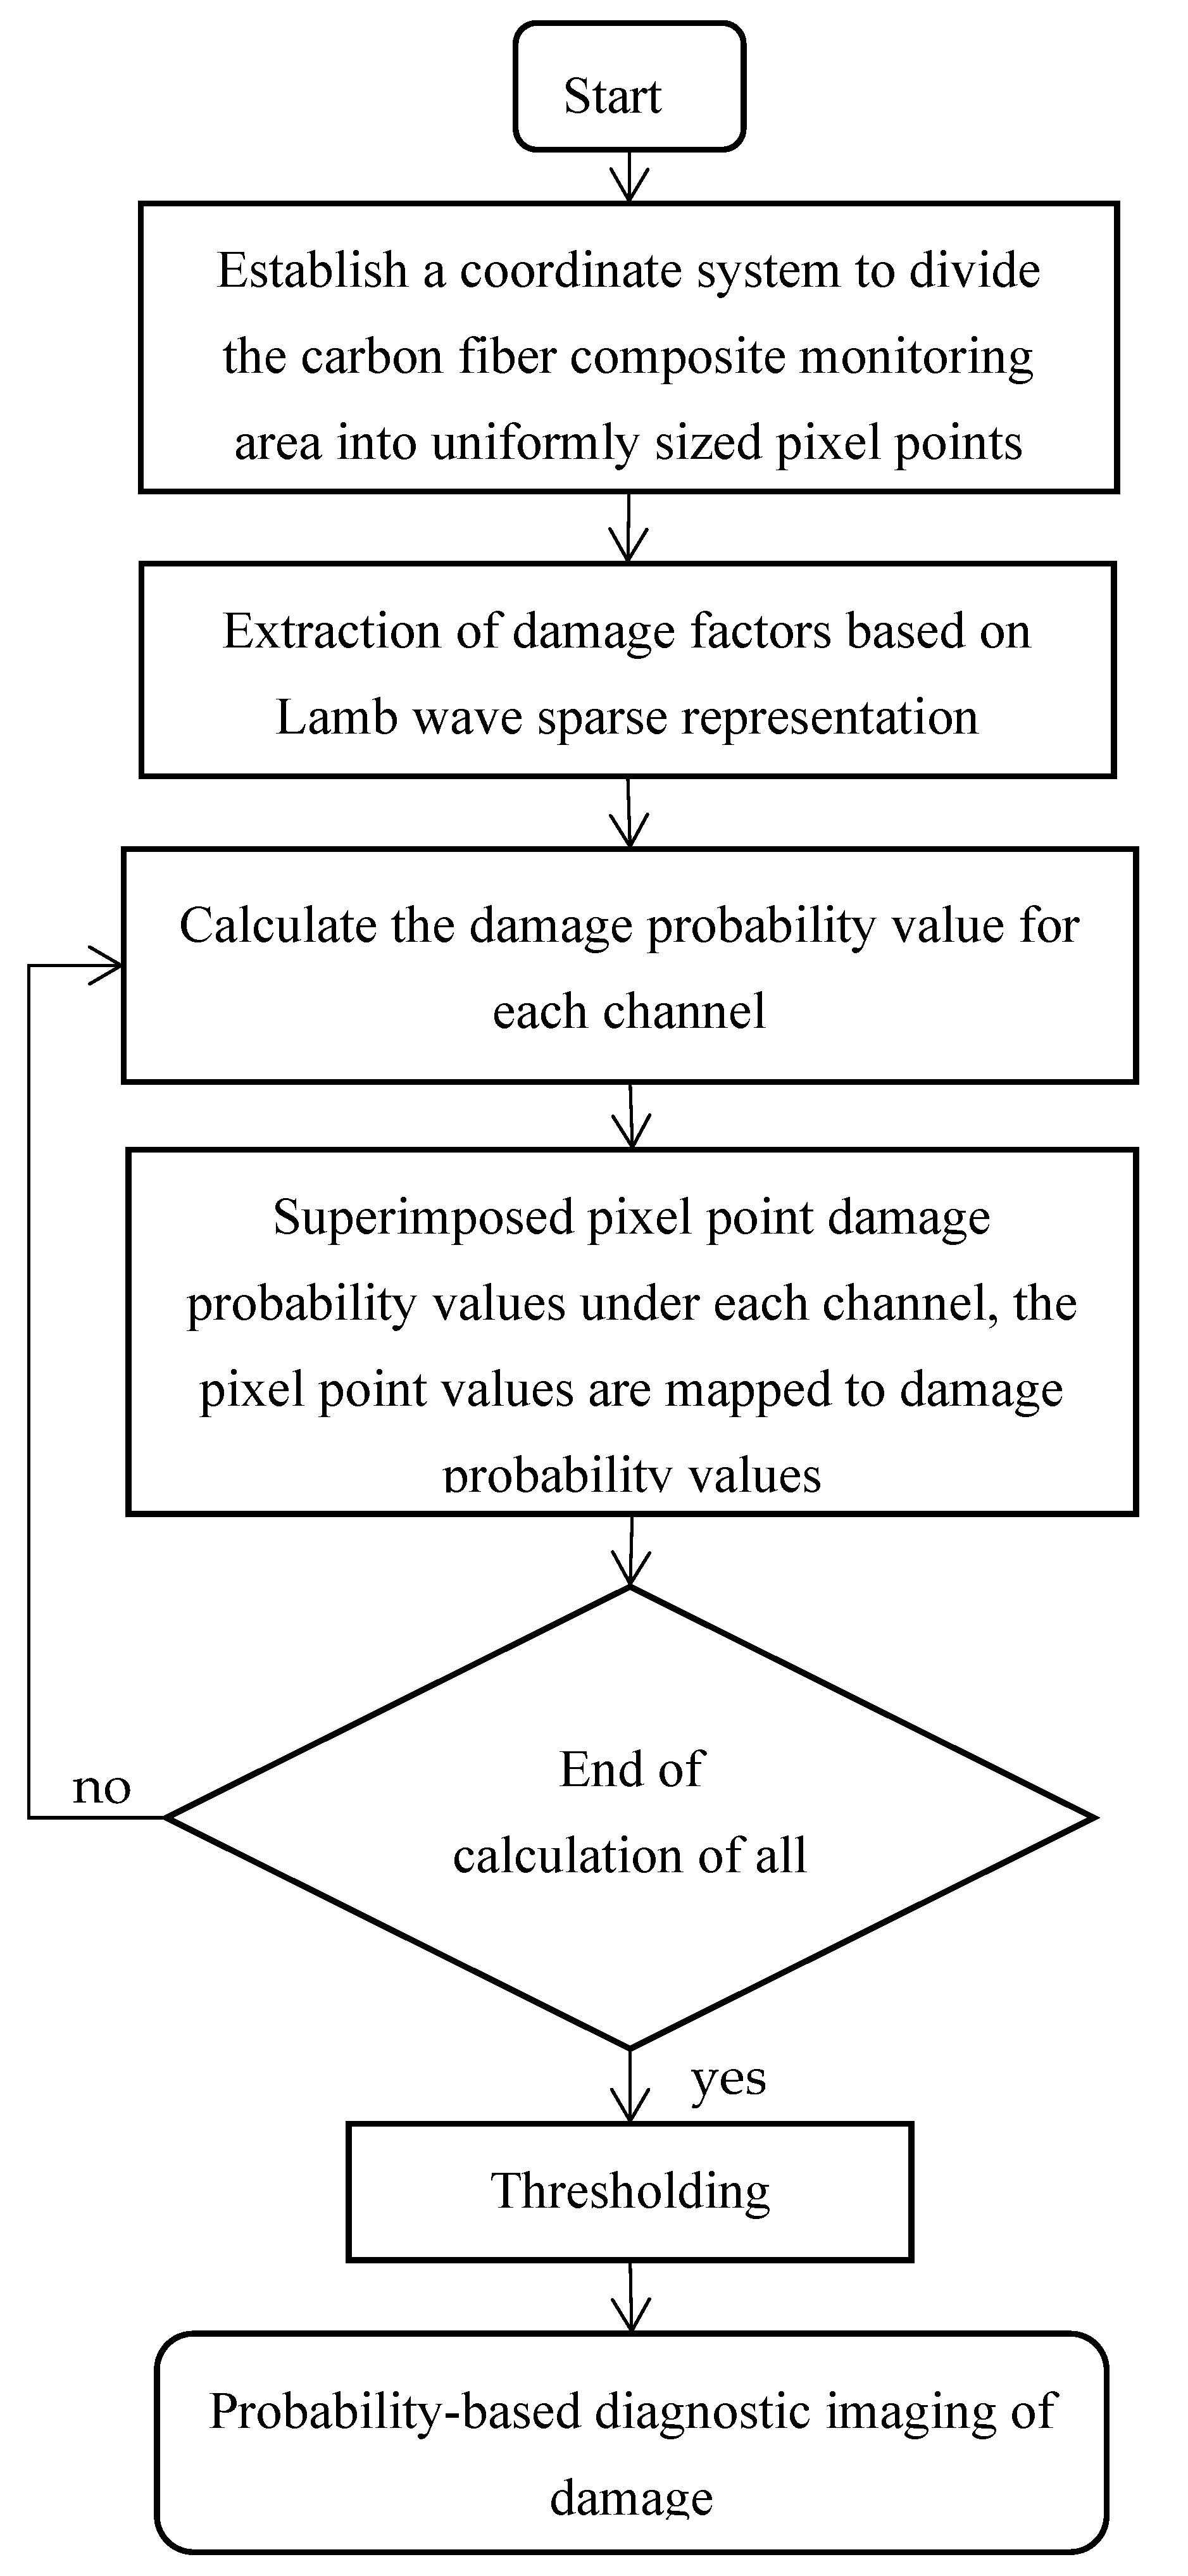
3. Damage Probability Imaging Based on Lamb Wave Sparse Representation

The principle of damage probability imaging is to divide the monitoring area into several uniform grid pixel points ( x , y ) , and the value of the pixel point is determined by the damage probability value P ( x , y ) of all excitation-sensing channels. The larger the damage probability value, the greater the damage degree [27]. There are K excitation-sensing channels in the entire monitoring area, then the damage probability value P ( x , y ) for a certain pixel point A ( x , y ) in the area is
P ( x , y ) = j = 1 K D I j W j [ R j ( x , y ) ]
where P ( x , y ) is the damage probability value of point A , D I j is the damage factor in the jth excitation-sensing channel, the magnitude of whose value reflects the size and degree of damage. W j [ R j ( x , y ) ] is the damage probability function, as shown in the following equation:
W j [ R j ( x , y ) ] = { 1 R j ( x , y ) β , R j ( x , y ) < β 0 , R j ( x , y ) β
The value of β is the parameter that controls the impact area of the ellipse distribution. If its value is too large, it will make the imaging range is too large and damage localization will not be accurate; if its value is too small it will make the imaging ignore part of the damage area. Generally choose a value slightly greater than 1, this paper selected 1.1. R j ( x , y ) is the ratio of the sum of the distance from pixel A ( x , y ) to actuator B j ( x B , j , y B , j ) and sensor C j ( x C , j , y C , j ) and the distance from actuator to sensor, the expression is as follows:
R j ( x , y ) = ( x x B , j ) 2 + ( y y B , j ) 2 + ( x x C , j ) 2 + ( y y C , j ) 2 ( x B , j x C , j ) 2 + ( y B , j y C , j ) 2 1
It can be seen from Formula (12) that the points in the detection range of each excitation-sensing channel are distributed in an elliptical area, the closer the pixel point is to the excitation-sensing channel, the greater the damage probability value, and the damage probability function distribution is shown in Figure 2:
The darker the color in the ellipse area, the greater the damage distribution probability of the point. Using the Lamb wave sparse representation damage factor proposed in this paper, the fatigue damage imaging of carbon fiber composite materials is realized through the damage probability imaging algorithm. The process is shown in Figure 3. Firstly, the monitored area is uniformly divided into small grids, and each grid represents a pixel point; then the fast block sparse Bayesian learning algorithm is used to make a sparse representation of the Lamb wave signal, and on this basis the damage characteristics are calculated to obtain the damage factor of each channel; finally, the damage probability value of each pixel point is derived by the damage probability imaging algorithm, and the area with the larger damage probability value is the damaged area, and the threshold processing is added to realize the fatigue damage imaging of carbon fiber composites.

4. Experiment and Analysis of Experimental Results

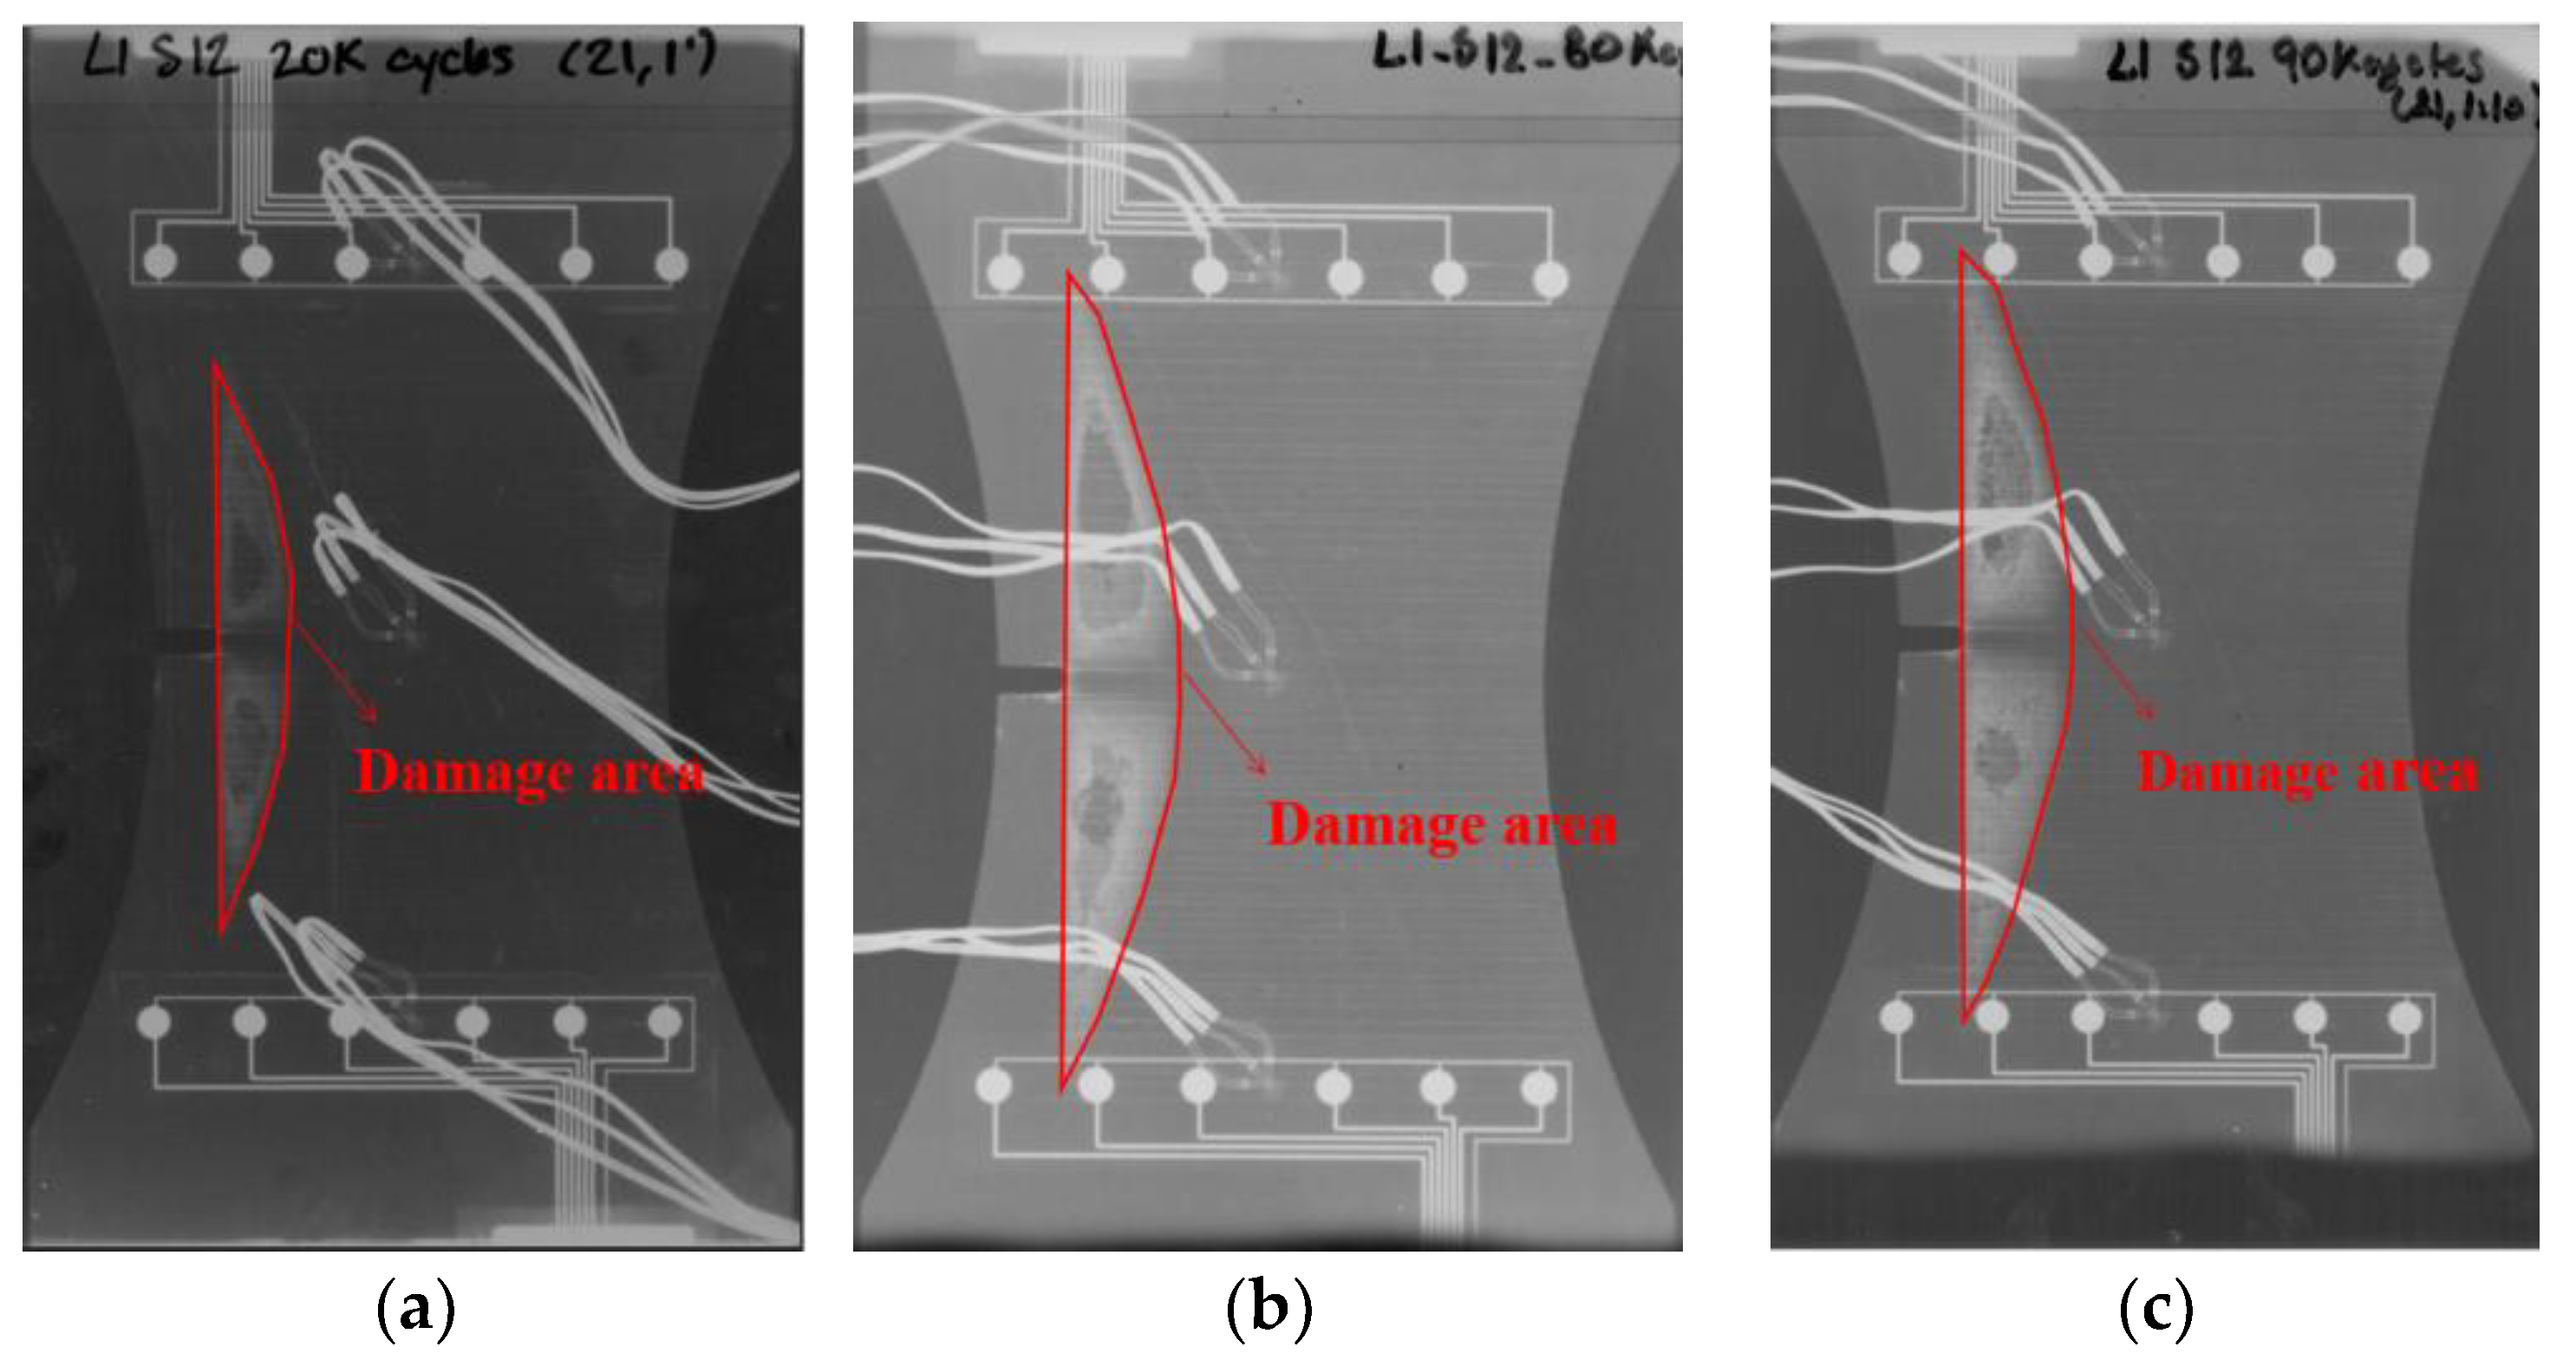
4.1. Fatigue Damage Experiment of Carbon Fiber Composite Materials

The experimental specimen in this paper is the dog-bone carbon fiber composite laminate of the Stanford Structural and Composite Materials Laboratory and the NASA Ames Research Center. Its size is 15.24 cm × 25.4 cm, and the laminate structure is [02/904]. The specimen was gripped using hydraulic grips, and both ends of the specimen were fixed on a standard fatigue testing machine. The test machine is the MTS universal fatigue testing machine, which is manufactured by the company MTS in the USA. The fatigue tensile frequency of the test machine is 5 Hz and the stress ratio is 0.14. MTS machines are automatically set up for fatigue–tension cyclic loading. All tests were performed following American Society for Testing and Materials (ASTM) Standards D3039 and D3479. A notch (5.08 mm × 19.3 mm) was prefabricated in the specimen to cause stress concentration and crack expansion along the notch, and the experimental specimen is shown in Figure 4a. Six Acellent piezoelectric sensors are installed at each end of the specimen to form a piezoelectric sensing array, each of these sensors are 0.25 in disk diameter and 0.007 thick. Numbers 1 to 6 are actuators and numbers 7 to 12 are sensors in the array. When No. 1 is used as actuator, Lamb wave is excited to actively monitor the carbon fiber composite material, sensors No. 7 to 12 receive Lamb wave signal, and so on for a total of 36 channels of Lamb wave signal; the 36 channels are shown in Figure 4b. American Acellent’s ScanScentry® 32-channel data acquisition hardware and SmartPatch® interface software were used for data acquisition. The input actuation was chosen to be a 5-peak burst signal at an actuation frequency range of 150–450 kHz, with an average input voltage of 50 V and a gain of 20 dB. In this paper, the acquired signal at the frequency of 350 kHz was used. The signal sampling frequency of each channel was 1.2 MHz, and the number of acquisition points was 2000. In addition, the tested dog-bone-shaped specimen was treated with a dye penetrant to enhance the absorption of X-rays, and the real damage of the specimen can be obtained through X-ray photographs.

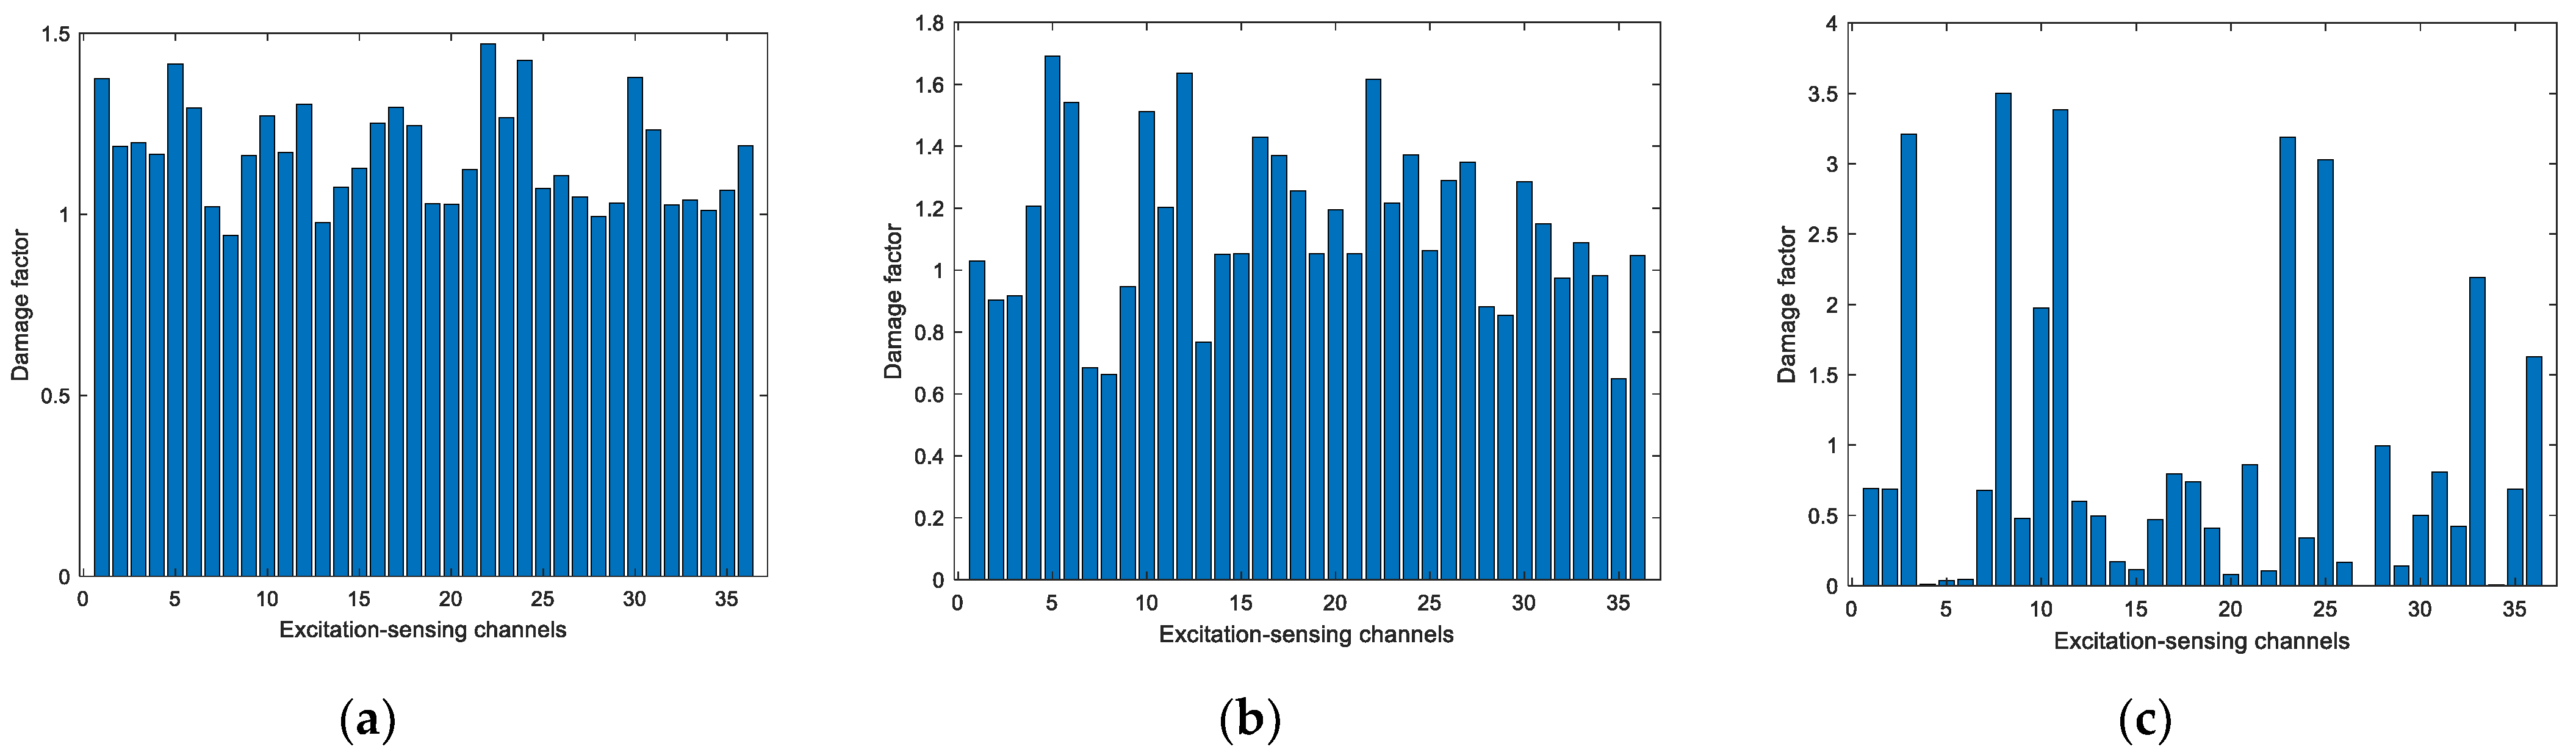
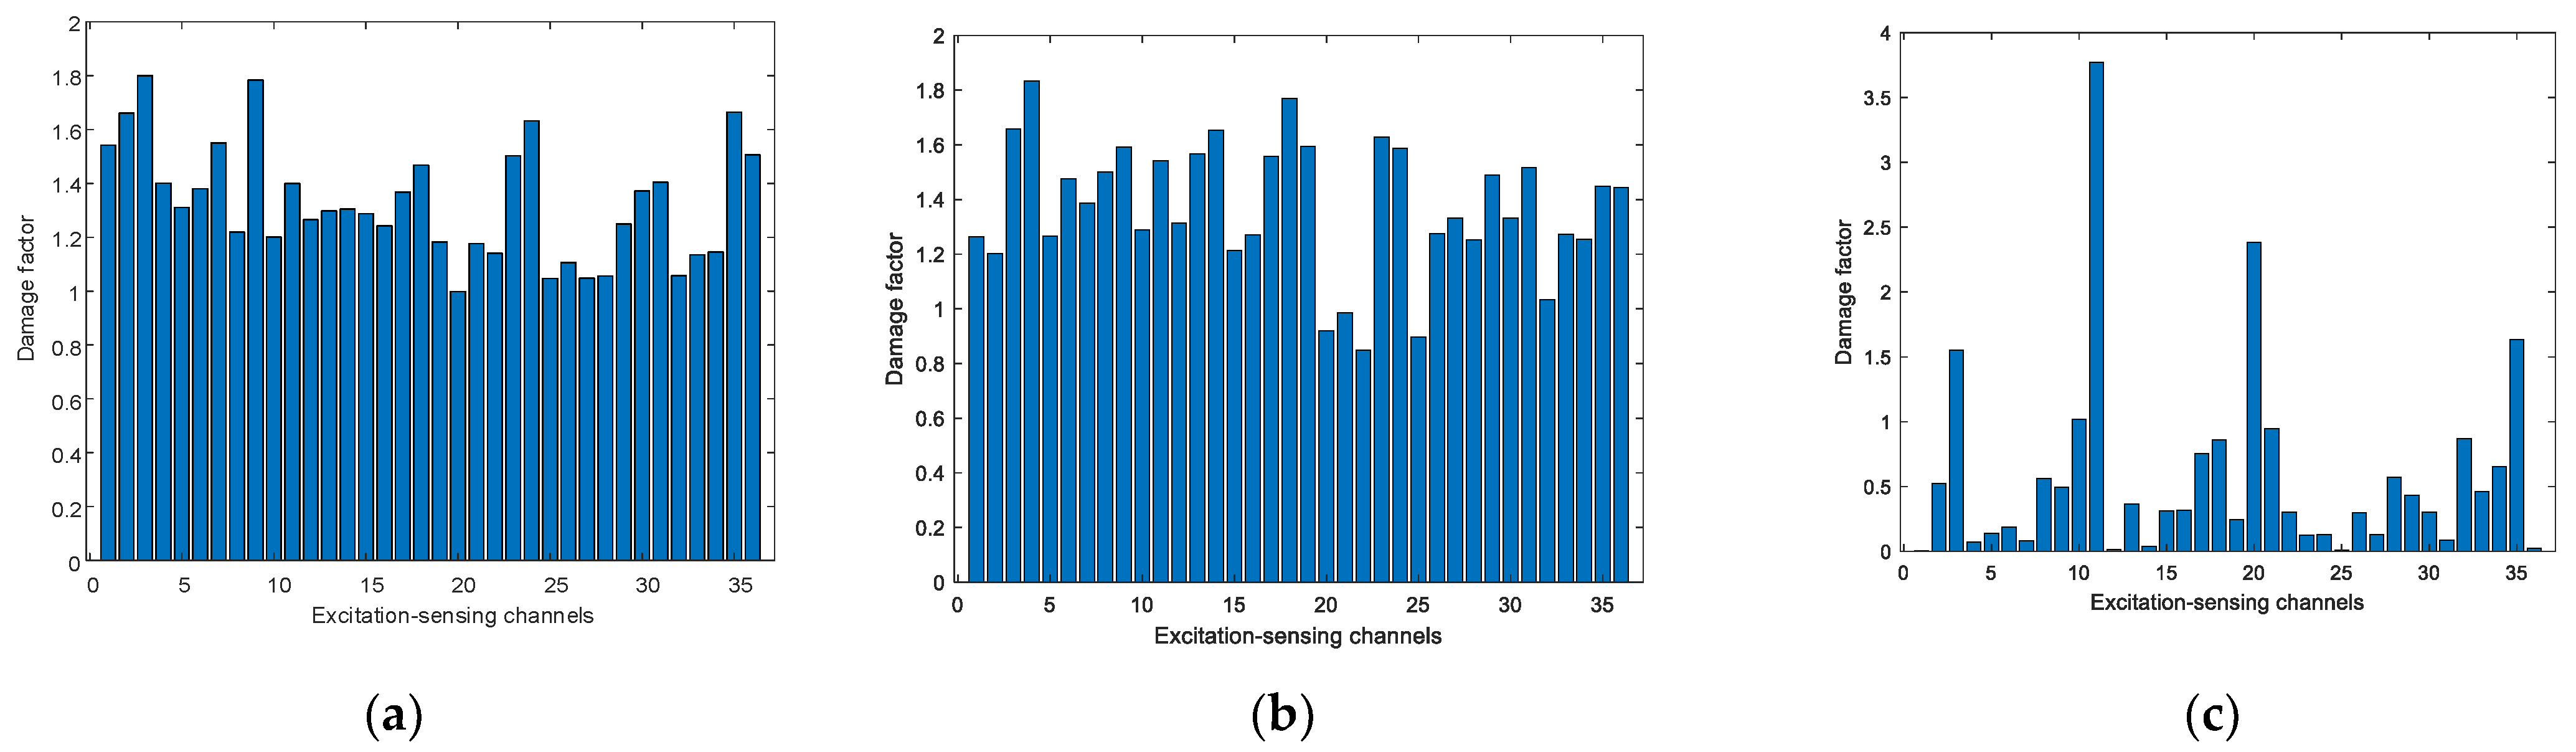
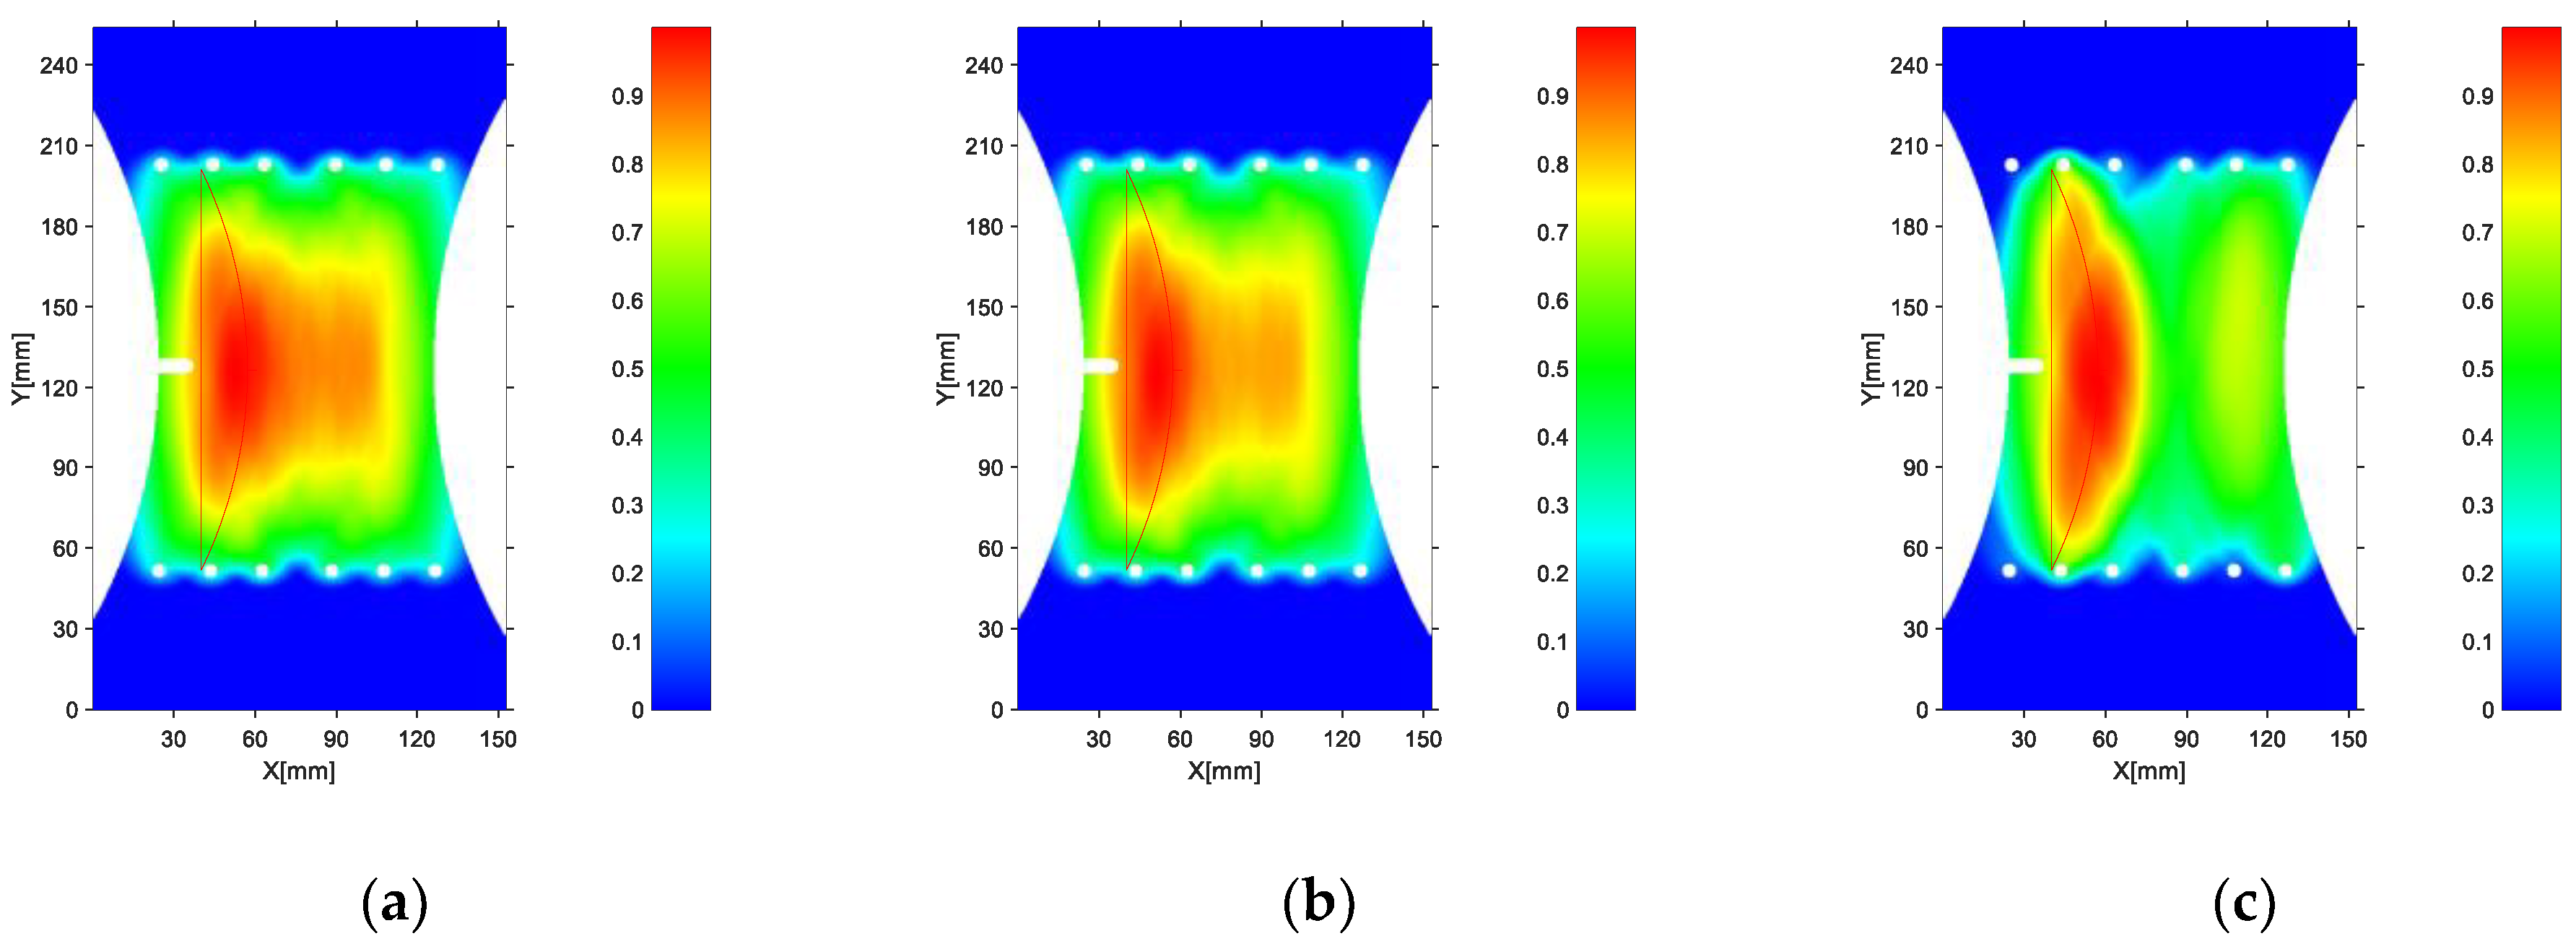
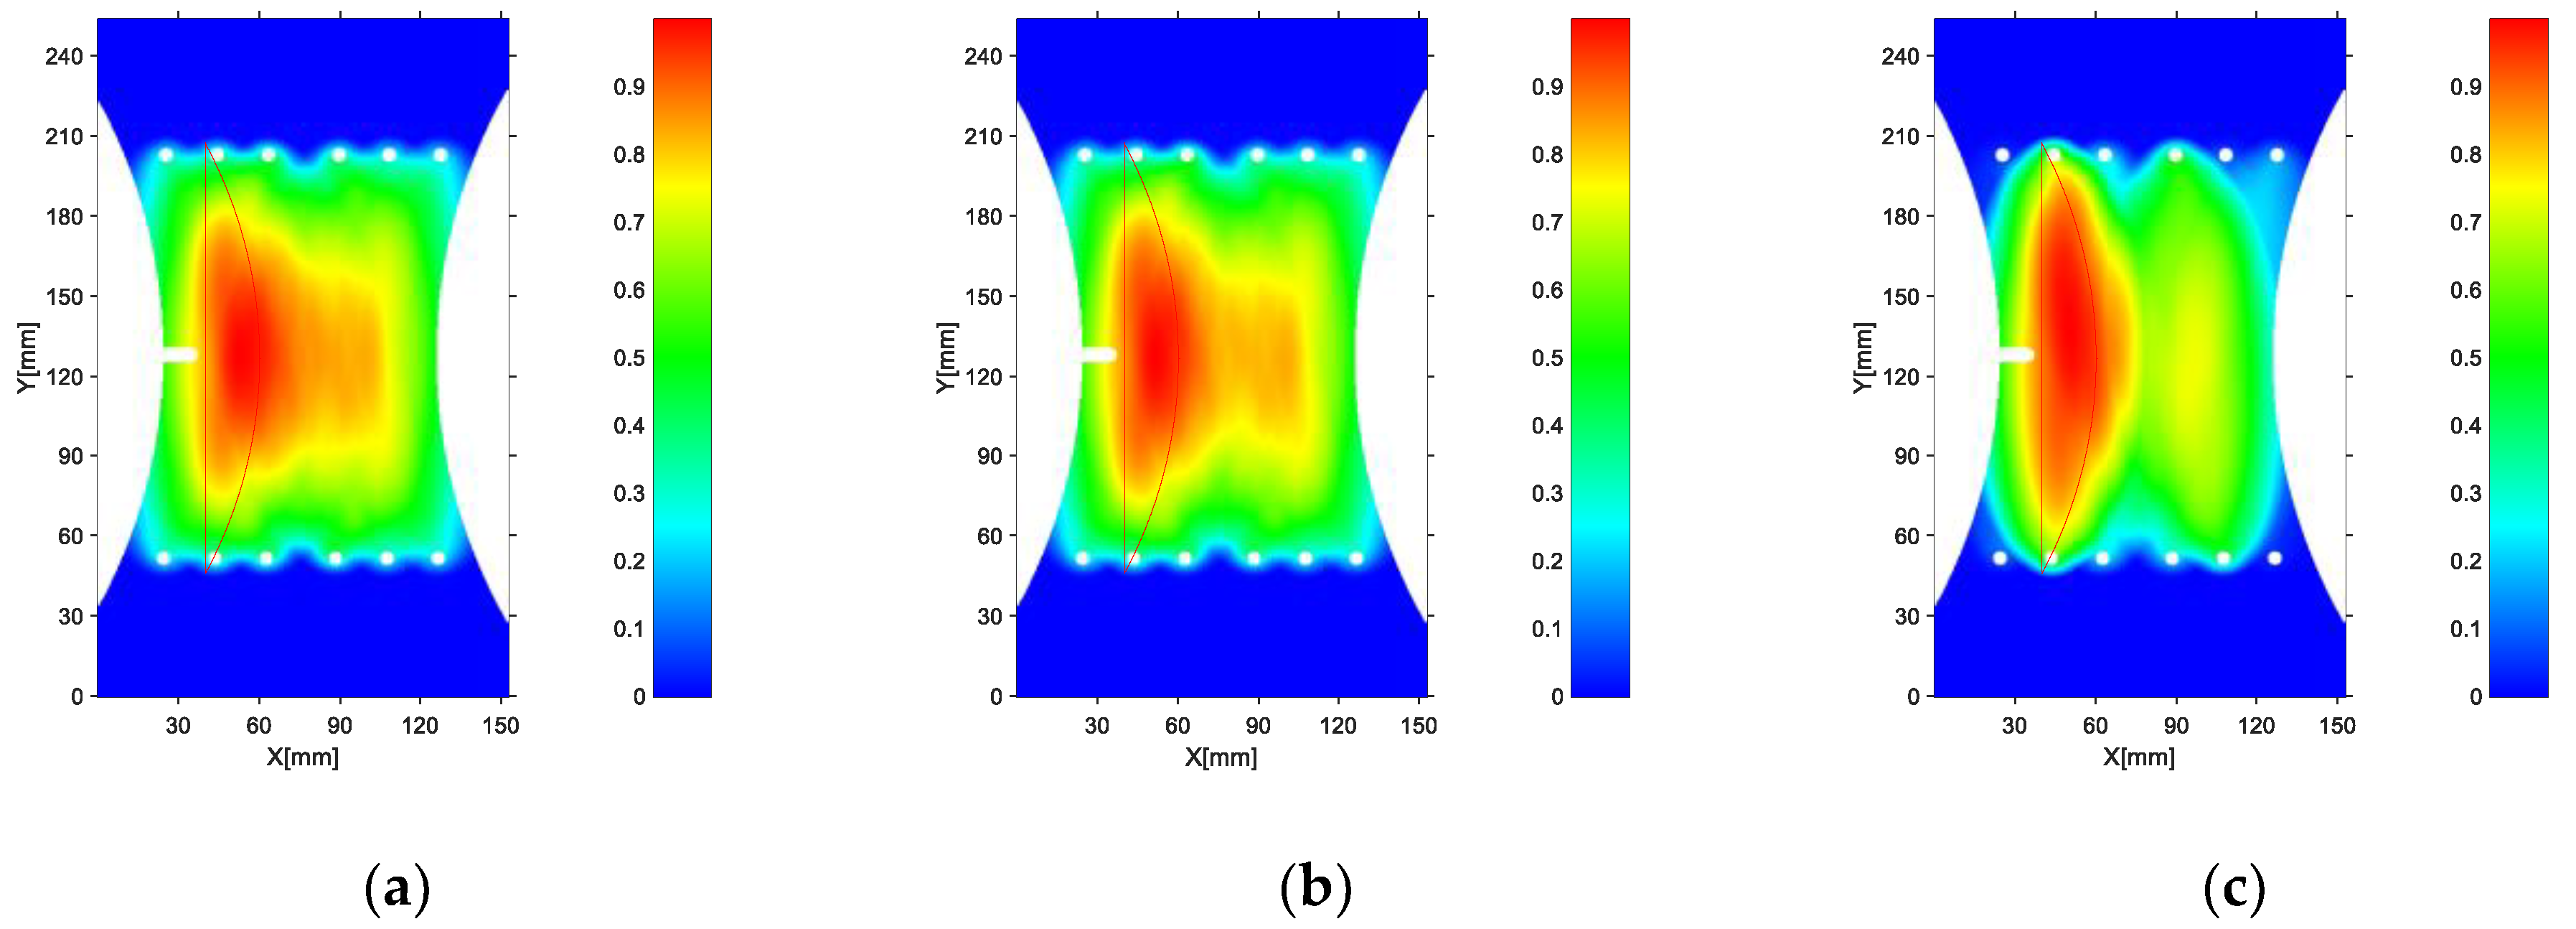
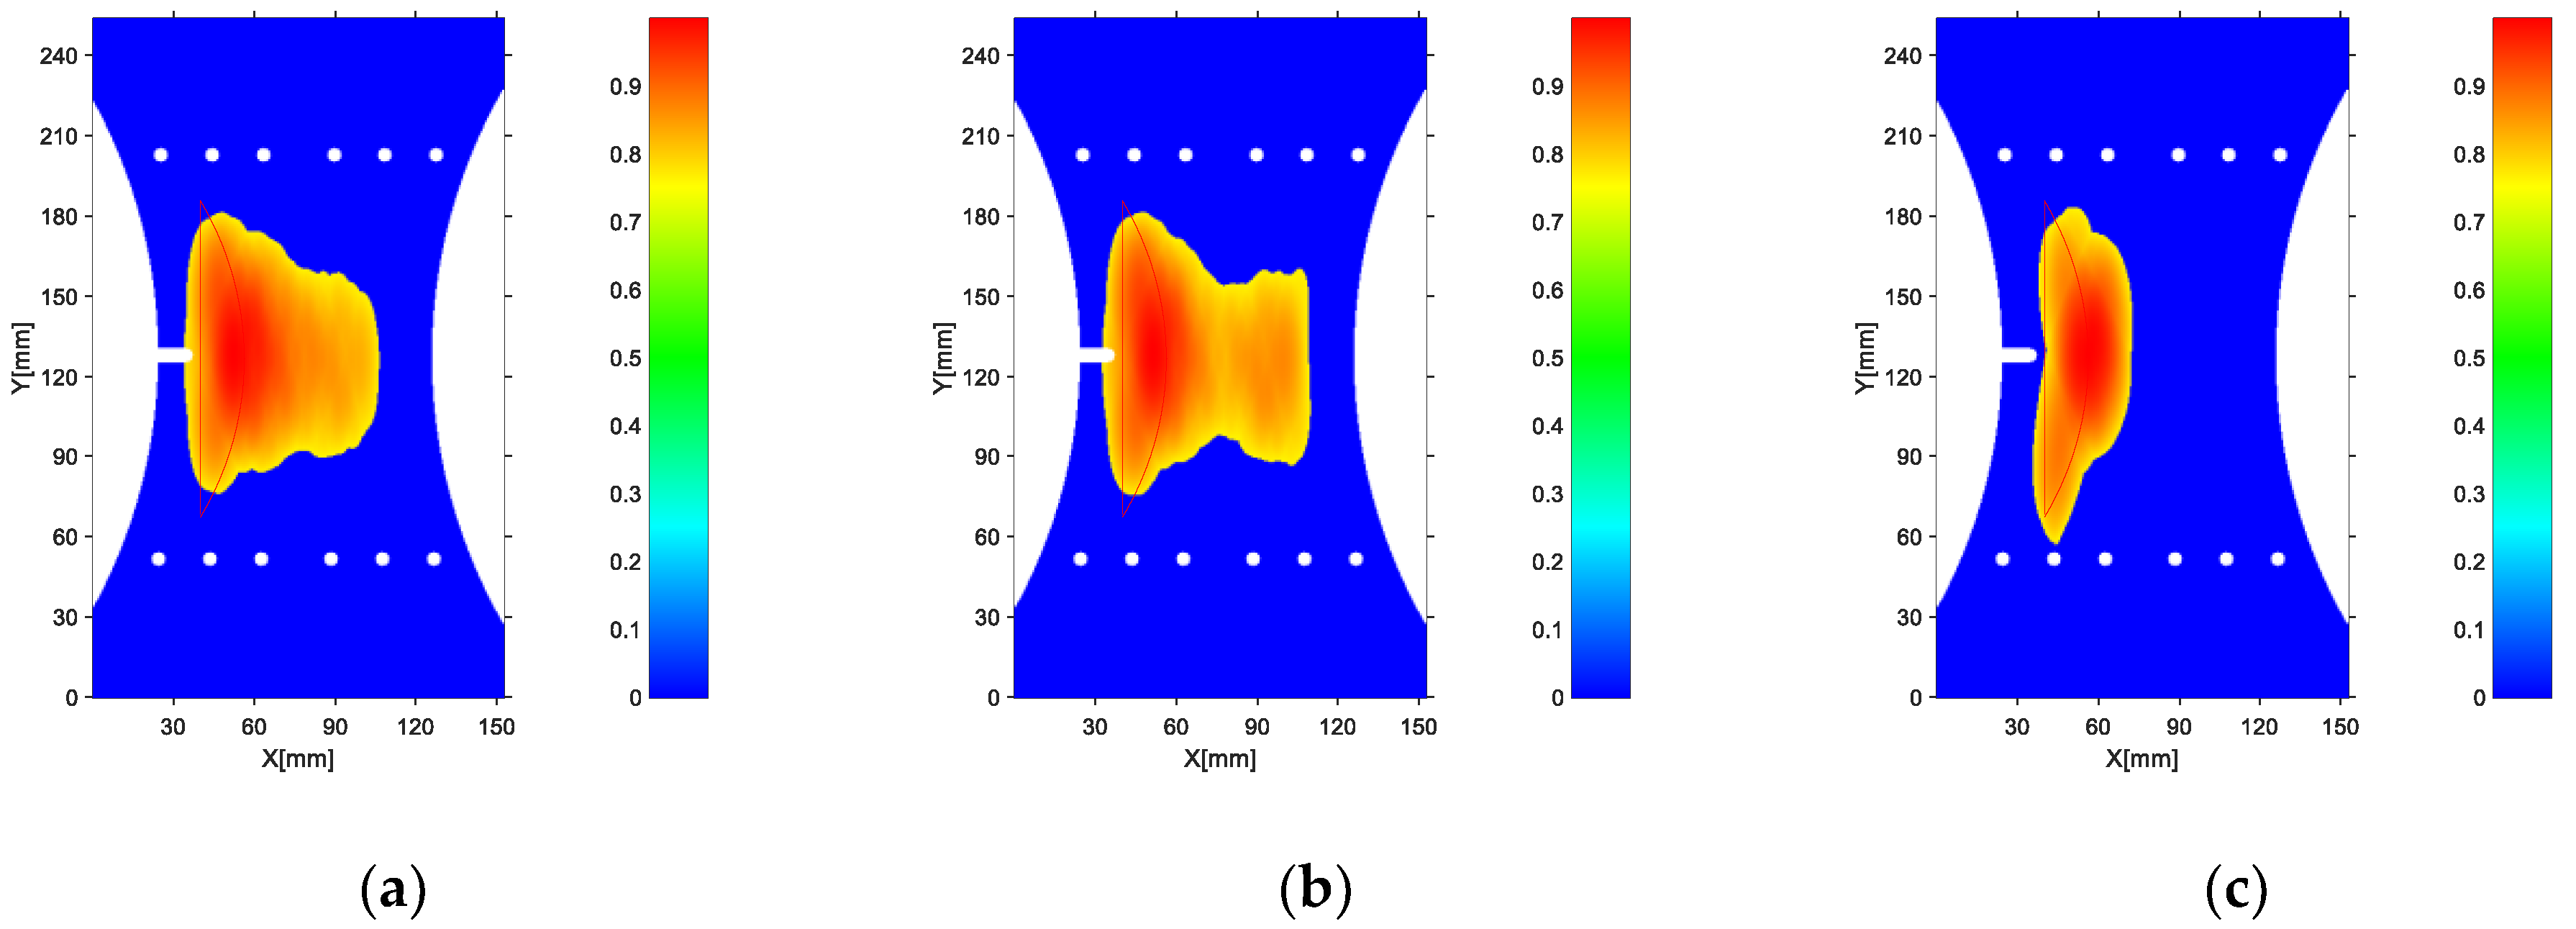
4.2. Comparison and Analysis of Imaging Results with Different Damage Factors

The expression of Lamb wave excitation signal in the data set of this paper is shown in Equation (13).
δ ( t ) = A [ 1 cos ( 2 π f c t n ) ] sin ( 2 π f c t )
where f c is 300 kHz, n is 5, A is 100 mv, the number of sampling points of the excitation signal is 2000, and the sampling frequency is 1.2 MHz [28], so the propagation time is 2000 1.2 × 10 6 s. The time domain waveform of the excitation signal is shown in Figure 5.
The Lamb wave dictionary D is composed of moving the effective part of the excitation signal along the time axis whose reference is zero time, each time moving for 1 1.2 × 10 6 s, for a total of 2000 times, and the size of the Lamb wave dictionary is 2000 × 2000. Based on the Lamb wave dictionary, a fast block sparse Bayesian learning algorithm is used to sparsely represent the Lamb wave signal. Figure 6 shows the reference signals of channels 2–8 and their sparse representation signals. Figure 7 shows the fatigue stretching cycle times and the damage scatter signal and its sparse representation signal of channels 2–8 at 90,000 times.
According to the waveforms of the 36-channel sparsely represented signals, the corresponding t b , j , s b , j , t d , j , s d , j can be obtained. Putting the above four parameters into Formula (9), the damage factor based on the Lamb wave sparsely represented for each channel can be obtained. Figure 8, Figure 9 and Figure 10 are the energy damage factors, cross-correlation damage factors, and damage factors based on Lamb wave sparse representation for fatigue stretching cycles of 20,000, 80,000, and 90,000 times, respectively. The horizontal coordinate is the channel number, and the vertical coordinate is the damage factor value.
It can be seen from Figure 8, Figure 9 and Figure 10 that in all channels, the comparison of energy damage factors and cross-correlation damage factors between the damaged area and the undamaged area is not obvious enough, and the damaged area and the non-damaged area cannot be distinguished well. The damage factor values based on Lamb wave sparse representation for channels 4–8, 5–7, 5–8, and 6–8 that pass through the damaged region are larger and those that do not pass through the damage region are smaller; the proposed paper has a high recognition of damage, corresponding to a large damage probability value and more accurate damage imaging results.
One study [29] pointed out that when the fatigue cycle stretched 20,000 times, the accumulated cracks in the specimen reached saturation and new delamination appeared, so the monitoring signal under this condition was selected for damage imaging. Meanwhile, to verify the sensitivity of the proposed damage factor to damage, the data under the conditions of 80,000 and 90,000 times with clear radiographs and small changes in the damaged area were selected for imaging comparison. The X-ray photographs of the specimen after 20,000, 80,000, and 90,000 fatigue cycles are shown in Figure 11, where the area surrounded by the red outline is the damaged area.
To realize the fatigue damage imaging of carbon fiber composites, the coordinate system is established with the coordinate origin at the vertex of the lower left corner of the specimen in Figure 4b. Based on the real specimen size, a specimen of size 15.24 cm × 25.4 cm is created in matlab 2018(a) software, and the specimen is divided into 360 × 600 = 216000 pixel points, and the value of each pixel point can be mapped to a damage probability value. The damage probability values are calculated as follows: The energy damage factor value, correlation damage factor value, and Lamb wave sparse representation damage factor value were calculated at the fatigue cycle times of 20,000, 80,000, and 90,000, respectively. The different damage factors are brought into Equation (10) to calculate the damage probability value for each pixel point under 36 channels, and the corresponding damage probability value is filled into each pixel of the specimen created by the software to realize damage imaging. The imaging results are shown in Figure 12, Figure 13 and Figure 14, where the real damage area is the area surrounded by the red line contour, which is calculated from the damaged area in the X-ray map after equal scaling.
To remove the interference information in the imaging results, threshold processing is introduced into the imaging algorithm. Because the damage probability value at the damaged location is large and the damage probability value at the damage edge is small, the damage contour can be extracted by setting the damage probability threshold [30]. In total, 76% of the maximum damage probability value in the damage imaging result is used as the threshold value, the damage probability value corresponding to pixel points smaller than the damage probability threshold is set to zero, and the damage probability value corresponding to pixel points larger than the damage probability threshold is kept constant. The results of imaging thresholding of energy damage factor, cross-correlation damage factor, and Lamb wave sparse representation damage factor for fatigue cycles of 20,000, 80,000, and 90,000 cycles are shown in Figure 15, Figure 16 and Figure 17.
By comparing the X-ray image in Figure 11 and the imaging results in Figure 15, Figure 16 and Figure 17, it can be seen that the energy damage factor, cross-correlation damage factor, and Lamb wave sparse representation of damage factor threshold imaging have good results, and the damage probability values are larger and are concentrated in the real damaged area surrounded by the red line contour. Compared with the energy damage factor and the cross-correlation damage factor, the damage probability imaging obtained by the Lamb-wave-based sparse representation of the damage factor gives a more accurate damage location and shape, which is consistent with the actual fatigue damage location and can reflect the location and size of the damage more intuitively. Meanwhile, comparing Figure 15c, Figure 16c and Figure 17c, it can be seen that with the increase in the number of fatigue cycles, the damaged area in the damage probability imaging using energy damage factor, and cross-correlation damage factor, an obvious incremental change trend did not occur. The proposed damage factor based on Lamb wave sparse representation shows an increasing trend in the imaging area, which is consistent with the real damage area change in the X-ray map, indicating that the proposed damage factor based on Lamb wave sparse representation is more sensitive to damage.
To quantitatively evaluate the effect of damage imaging, the damage imaging error expression is defined as follows:
E = m i m a g e m a c t u a l m a c t u a l
where m i m a g e is the damage imaging area and m a c t u a l is the real damage area, the larger the imaging error is, E , the worse the damage imaging effect and the larger the deviation from the real damage. To compare the effect of damage imaging with different damage factors, the imaging error percentage, E p , is defined as the percentage reduction in damage imaging error based on Lamb wave sparse representation of the damage factor over the energy damage factor or the intercorrelation damage factor, which is expressed as follows:
E p = ( 1 E S E E / C ) × 100 %
where E S is the damage imaging error based on Lamb wave sparse representation of damage factor, and E E / C is the damage imaging error of the energy damage factor or the damage imaging error of the energy damage factor. The imaging errors and error percentages of the thresholded imaging of the energy damage factor, the cross-correlation damage factor, and the damage factor based on the Lamb wave sparse representation are shown in Table 1.
As can be seen from Table 1, the energy damage factor, the cross-correlation damage factor, and the proposed damage factor have errors in damage imaging at different numbers of fatigue cycles, but they are all within acceptable limits, and the damage imaging errors of the proposed damage factor are smaller compared to the energy damage factor and the cross-correlation damage factor. The error percentages were reduced by at least 49.81%, 60.44%, and 43.77% at the fatigue cycle numbers of 20,000, 80,000, and 90,000, respectively, indicating that the damage factor proposed in this paper is more sensitive to damage and the obtained damage imaging is closer to the location and shape of the original damage.

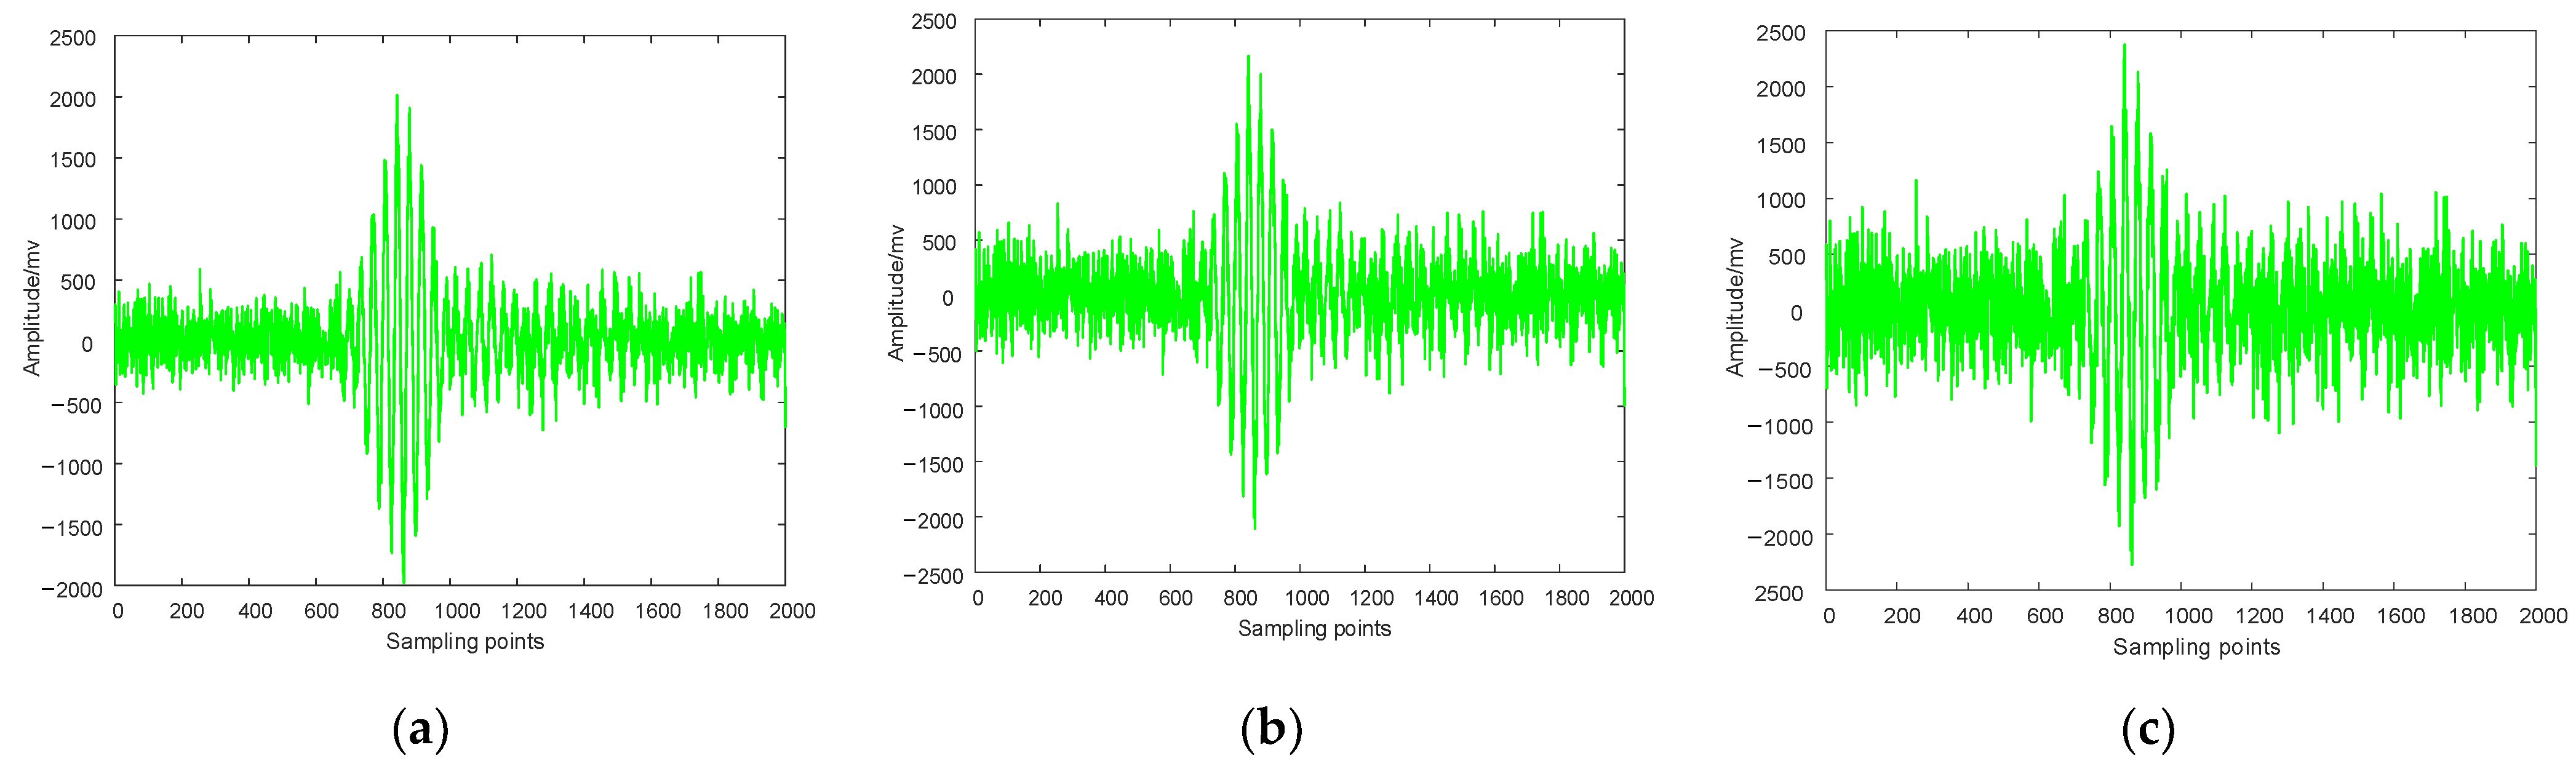
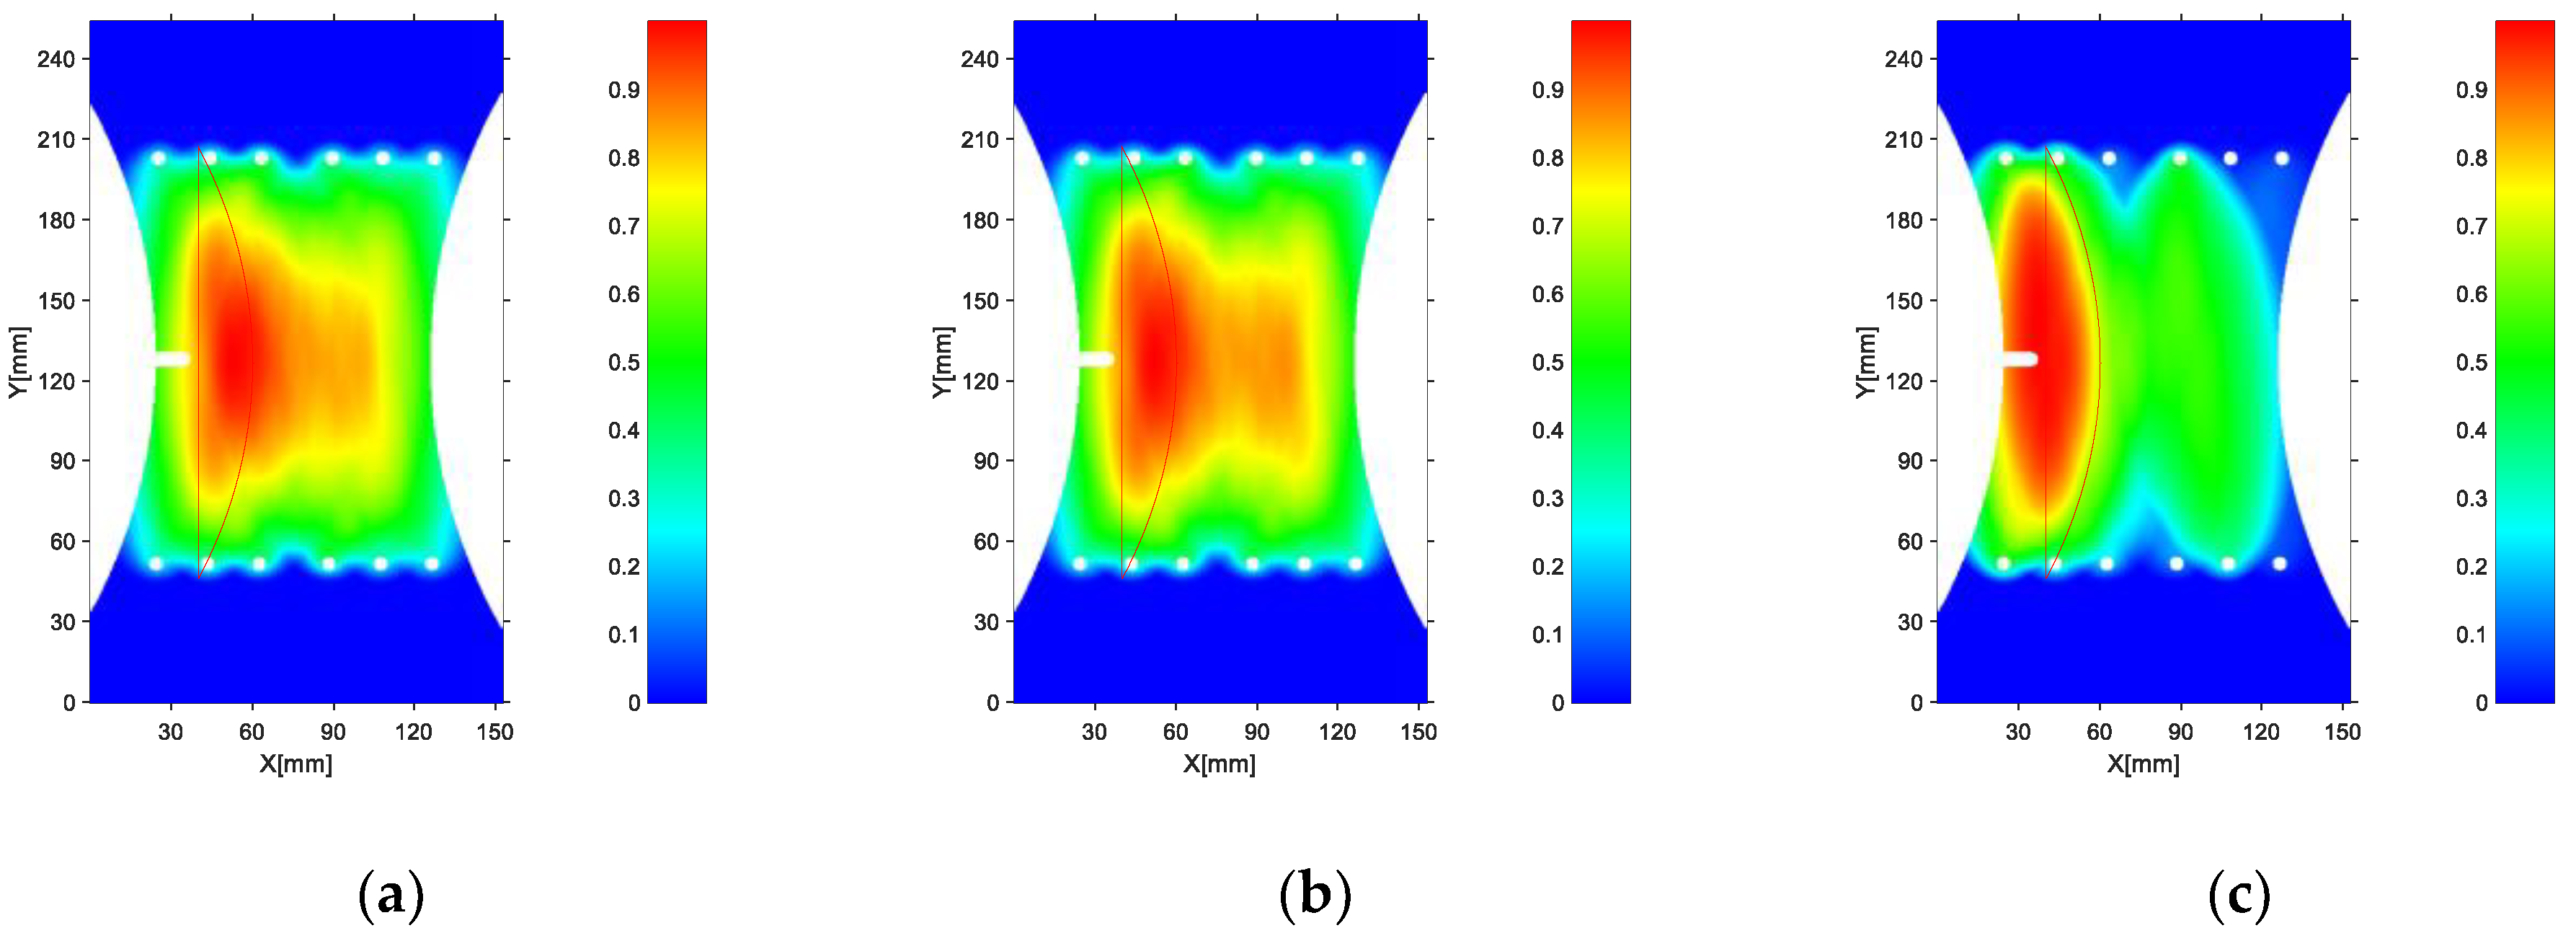
4.3. Comparison and Analysis of Imaging Results under Different Noise Intensity Environments

During the actual monitoring of carbon fiber composites, it is also necessary to consider the effect of algorithmic imaging in noisy environments. The acquired signal in the actual project contains Lamb wave signal and Gaussian white noise signal, therefore the noise was added to each excitation-sensing channel when the number of fatigue cycles was selected as 90,000 to simulate the noise interference in the actual acquisition data environment, and the signal-to-noise ratios (SNR) of the signals after adding noise were 6 dB, 3 dB, and 0.1 dB, respectively. The purpose was to test the effect of cross-correlation damage factor, energy damage factor, and damage factor based on Lamb wave sparse representation in weak noise (SNR = 6), moderate intensity noise (SNR = 3), and strong noise (SNR = 0.1) environments, and the principle of signal-to-noise ratio selection can be found in references [31,32]. Figure 18 shows the damage scattering signal waveforms with signal-to-noise ratios of 6 dB, 3 dB, and 0.1 dB after adding noise under channels 2–8, respectively, and the cross-correlation damage factor, energy damage factor, and damage factor based on Lamb wave sparse representation were imaged in different noise environments to test the noise resistance of the relevant damage factors.
At the number of fatigue cycles of 90,000, the damage imaging effects of each damage factor with the signal-to-noise ratio of 6 dB, 3 dB, and 0.1 dB are shown in Figure 19, Figure 20 and Figure 21, respectively.
Comparing Figure 19, Figure 20 and Figure 21, it can be seen that the damage probability imaging based on the Lamb wave sparse representation of the damage factor is better for different signal-to-noise ratios. The results of thresholding the results of Figure 19, Figure 20 and Figure 21 are shown in Figure 22, Figure 23 and Figure 24, respectively.
As can be seen from Figure 22, Figure 23 and Figure 24, the imaging of the three damage factors was affected to different degrees as the added noise level increased, and the damage range became larger, but the larger damage probability values were still concentrated in the real damage area surrounded by the red line contour, and the imaging effect was within the acceptable range. Compared with the energy damage factor and the cross-correlation damage factor, the damage probability imaging based on Lamb wave sparse representation of damage factor can obtain a closer profile to the real damage and a better imaging effect, and also indicates that the proposed damage factor has better noise immunity. Table 2 shows the thresholded imaging errors and error percentages of the three damage factors for different intensity noise environments under 90,000 fatigue cycles. The real damage area is 18.63 cm2.
Comparing Table 1 with Table 2, it can be seen that the imaging error gradually increases with the addition of noise level, but the damage imaging error based on Lamb wave sparse representation of damage factor increases less than the damage imaging error of the energy damage factor and the mutual correlation damage factor. It is shown that under different noise environments, the damage factor based on Lamb wave sparse representation has stronger noise immunity and can image the fatigue damage of carbon fiber composites more accurately, and the imaging results can reflect the real location and shape of the fatigue damage of carbon fiber composites more accurately.

5. Conclusions

In this paper, we propose a damage factor based on the sparse representation of Lamb wave signal for damage probability imaging in response to the problem that the damage factor commonly used in damage probability imaging algorithms has low contrast and poor noise immunity, resulting in artifacts in the resulting image that cause misjudgment of the damage region. Based on the Lamb wave dictionary, a fast block sparse Bayesian learning algorithm is used to sparsely represent the Lamb wave signal, multiplying the sparsely represented signal peak and peak time as the damage feature, defining the amount of change in the damage feature between the reference signal and the damage scattering signal as the Lamb wave signal sparsely represented damage factor, and realizing fatigue damage imaging of carbon fiber composites through a damage probability imaging method. The main conclusions are as follows:
(1) The experimental results show that the imaging error of the Lamb wave signal sparse representation damage factor is at least 43.77% lower than the imaging error of the energy damage factor and the mutual correlation damage factor, and the imaging localization is consistent with the actual fatigue damage location, and the imaging shape is basically consistent with the real damage shape, which reflects the location and size of the damage more intuitively.
(2) The damage factor based on the sparse representation of Lamb wave signal has better noise immunity and can still image the fatigue damage of carbon fiber composites more accurately in a noisy environment. With signal-to-noise ratios of 6 dB, 3 dB, and 1.0 dB, the damage imaging error based on the Lamb wave sparse representation of the damage factor is reduced by at least 58.63%, 28.11%, and 8.43%, respectively, compared to the energy damage factor and the cross-correlation damage factor.
(3) This paper achieves good results in imaging damage of carbon fiber composites in a noisy environment, and provides a basis for achieving the prediction of fatigue damage extension trends of carbon fiber composites. In future research work, we will study more powerful damage detection algorithms, such as supervised machine-learning-based detection of tiny cracks and deep-learning model-based fatigue damage detection and other detection algorithms.

Author Contributions

Conceptualization, Q.D.; Data curation, Q.D.; Formal analysis X.S.; Funding acquisition, B.Y.; Investigation, J.F.; Methodology, Q.D.; Project administration, R.H.; Resources, J.F.; Software, Y.Z.; Supervision, B.Y.; Validation, Y.Z.; Visualization, R.H.; Writing—original draft, Q.D.; Writing—review and editing, B.Y. All authors have read and agreed to the published version of the manuscript.

Funding

This research was funded by the National Natural Science Foundation of China (NSFC), grant numbers 62063012. This research was also funded by The Young and Middle-Aged Academic and Technical Leaders Reserve Talents Project of Yunnan Province, grant numbers 202305AC160062.

Institutional Review Board Statement

Not applicable.

Informed Consent Statement

Not applicable.

Data Availability Statement

Not applicable.

Conflicts of Interest

The authors declare no conflict of interest.

References

  1. Zhang, X.; Luo, D.; He, Y.; Zhang, X.; Chen, S.; Xiao, Y. CFRP Barely Visible Impact Damage Inspection Based on Nonlinear Ultrasound Signal Sparse Reconstruction. IEEE Sens. J. 2018, 18, 6303–6310. [Google Scholar] [CrossRef]
  2. Atkinson, G.A.; Nash, S.O.; Smith, L.N. Precision Fibre Angle Inspection for Carbon Fibre Composite Structures Using Polarisation Vision. Electronics 2021, 10, 2765. [Google Scholar] [CrossRef]
  3. Liu, Z.; Yu, H.; Fan, J.; Hu, Y.; He, C.; Wu, B. Baseline-free delamination inspection in composite plates by synthesizing non-contact air-coupled Lamb wave scan method and virtual time reversal algorithm. Smart Mater. Struct. 2015, 24, 045014. [Google Scholar] [CrossRef]
  4. Qing, X.; Li, W.; Wang, Y.; Sun, H. Piezoelectric Transducer-Based Structural Health Monitoring for Aircraft Applications. Sensors 2019, 19, 545. [Google Scholar] [CrossRef] [PubMed]
  5. Carrino, S.; Nicassio, F.; Scarselli, G. Nonlinearities Associated with Impaired Sensors in a Typical SHM Experimental Set-Up. Electronics 2018, 7, 303. [Google Scholar] [CrossRef] [Green Version]
  6. Abbas, M.; Shafiee, M. Determination of Surface Defects in Large Metallic Structures using Ultrasonic Guided Waves. Sensors 2018, 18, 3958. [Google Scholar] [CrossRef] [Green Version]
  7. Xu, C.; Yang, Z.; Qiao, B.; Chen, X. Traveling distance estimation for dispersive Lamb waves through sparse Bayesian learning strategy. Smart Mater. Struct. 2019, 28, 85008. [Google Scholar] [CrossRef]
  8. Nyikayaramba, G.; Murmann, B. S-Parameter-Based Defect Localization for Ultrasonic Guided Wave SHM. Aerospace 2020, 7, 33. [Google Scholar] [CrossRef] [Green Version]
  9. Huang, L.; Zeng, L.; Lin, J.; Luo, Z. An improved time reversal method for diagnostics of composite plates using Lamb waves. Composite Struct. 2018, 190, 10–19. [Google Scholar] [CrossRef]
  10. Xu, C.; Yang, Z.; Tian, S.; Chen, X. Lamb wave inspection for composite laminates using a combined method of sparse reconstruction and delay-and-sum. Composit. Struct. 2019, 223, 110973. [Google Scholar] [CrossRef]
  11. Xu, X.; Ji, H.; Qiu, J.; Cheng, J.; Wu, Y.; Takagi, T. Interlaminar contact resistivity and its influence on eddy currents in carbon fiber reinforced polymer laminates. NDT E Int. 2017, 94, 79–91. [Google Scholar] [CrossRef]
  12. Zhu, Q.; Qiu, J.; Zhang, C.; Hong, L. Application of laser ultrasonic detection method for double-layerlaminated material. Laser Optoelectron. Progress. 2016, 53, 126–133. [Google Scholar]
  13. Gao, D.; Wu, Z.; Yang, L.; Zheng, Y. Guide waves-based multi-damage identification using a local probability-based diagnostic imaging method. Smart Mater. Struct. 2016, 25, 045009. [Google Scholar] [CrossRef]
  14. Zhang, H.; Lin, J.; Hua, J.; Tong, T. Interpretable convolutional sparse coding method of Lamb waves for damage identification and localization. Struct. Health Monit. 2022, 21, 1790–1804. [Google Scholar] [CrossRef]
  15. Liu, G.; Xiao, Y.; Zhang, H.; Ren, G. Probability-based diagnostic imaging for damage identification of stiffened composite panel. Acta Mater. Compos. Sinica 2018, 35, 311–319. [Google Scholar]
  16. Hammed, M.; Li, Z.; Chen, J.; Qi, J. Lamb-Wave-Based Multistage Damage Detection Method Using an Active PZT Sensor Network for Large Structures. Sensors 2019, 19, 2010. [Google Scholar] [CrossRef] [Green Version]
  17. Memmolo, V.; Boffa, N.; Maio, L.; Monaco, E.; Ricci, F. Damage Localization in Composite Structures Using a Guided Waves Based Multi-Parameter Approach. Aerospace 2019, 5, 111. [Google Scholar] [CrossRef] [Green Version]
  18. Wan, T.; Chang, J.; Zeng, X.; Li, Y. Damage identification and scanning imaging of glass fiber reinforced polymer composite plates based on empirical mode decomposition and correlation coefficient. Acta Mater. Compos. Sinica 2020, 37, 1921–1931. [Google Scholar]
  19. Thalapil, J.; Sawant, S.; Tallur, S.; Banerjee, S. Guided wave based localization and severity assessment of in-plane and out-of-plane fiber waviness in carbon fiber reinforced composites. Compos. Struct. 2022, 297, 115932. [Google Scholar] [CrossRef]
  20. Han, J.; Ou, W.; Xiong, J.; Feng, S. Remote Heart Rate Estimation by Pulse Signal Reconstruction Based on Structural Sparse Representation. Electronics 2022, 11, 3738. [Google Scholar] [CrossRef]
  21. Davis, G.; Mallat, S.; Avellaneda, M. Adaptive greedy approximations. Construct. Approxim. 1997, 13, 57–98. [Google Scholar] [CrossRef]
  22. Candes, E.; Tao, T. Decoding by linear programming. IEEE Trans. Inf. Theory 2005, 51, 4203–4215. [Google Scholar] [CrossRef] [Green Version]
  23. Ma, Y.; Jia, X.; Hu, Q.; Xu, D.; Guo, C.; Wang, Q.; Wang, S. Laplace Prior-Based Bayesian Compressive Sensing Using K-SVD for Vibration Signal Transmission and Fault Detection. Electronics 2019, 8, 517. [Google Scholar] [CrossRef] [Green Version]
  24. Zhang, Z.; Rao, T. Sparse Signal Recovery with Temporally Correlated Source Vectors Using Sparse Bayesian Learning. IEEE J. Select. Top. Sig. Process. 2011, 5, 912–926. [Google Scholar] [CrossRef] [Green Version]
  25. Li, D.; Chen, Q.; Wang, L.; Liu, H. DME pulse interference suppression method based on BSBL-BO algorithm. J. Syst. Eng. Electron. 2021, 43, 2649–2656. [Google Scholar]
  26. Liu, B.; Zhang, Z.; Xu, G.; Fan, H.; Fu, Q. Energy Efficient Telemonitoring of Physiological Signals via Compressed Sensing: A Fast Algorithm and Power Consumption Evaluation. Biomed. Signal Proc. Control. 2014, 11, 80–88. [Google Scholar] [CrossRef] [Green Version]
  27. Zhao, X.; Gao, H.; Zhang, G.; Ayhan, B.; Yan, F.; Kwan, C.; Rose, L. Active health monitoring of an aircraft wing with embedded piezoelectric sensor/actuator network: I. Defect detection, localization and growth monitoring. Smart Mater. Struct. 2007, 16, 1028. [Google Scholar] [CrossRef]
  28. Wilson, C.; Chang, F. Monitoring fatigue-induced transverse matrix cracks in laminated composites using built-in acousto-ultrasonic techniques. Struct. Health Monit. 2016, 15, 335–350. [Google Scholar] [CrossRef]
  29. Liu, X.; Ai, F.; Bo, L.; Pu, K.; Luo, H.; Wei, D. Detection and Quantization of Fatigue Damage in Laminated Composites with Cross Recursive Quantitative Analysis. IEEE Transact. Ind. Inf. 2021, 17, 1553–1561. [Google Scholar] [CrossRef]
  30. Liu, Z.; Fan, J.; He, C.; Wu, B. Scanning imaging of composite plate using air-coupled Lamb waves based on probabilistic damage algorithm. Acta Mater. Composit. Sinica 2015, 32, 227–235. [Google Scholar]
  31. Fu, J.; Wang, X.; Li, Z.; Tan, Q.; Wang, J. Seismic P-wave arrival time automatic extraction method based on signal-to-noise ratio in strong noise environment. J. Geophys. 2019, 4, 1405–1414. [Google Scholar]
  32. Su, C.; Jiang, S.; Liang, J.; Tain, A.; Sun, L.; Zhang, F.; Zhang, L.; Sui, Q. Lamb wave tomography damage imaging of carbon fiber reinforced olymer composite structures in strong noise environment. Acta Mater. Compos. Sinica 2020, 37, 886–895. [Google Scholar]
Figure 1. Lamb wave dictionary.
Electronics 12 01148 g001
Figure 2. Damage probability function distribution.
Electronics 12 01148 g002
Figure 3. Flow chart of damage probability imaging algorithm based on Lamb wave damage factor.
Electronics 12 01148 g003
Figure 4. Experimental specimen and excitation-sensing channel schematic: (a) experimental specimen; (b) excitation-sensing channel schematic.
Electronics 12 01148 g004
Figure 5. Excitation signal.
Electronics 12 01148 g005
Figure 6. Reference signals and sparse representation signals of 2–8 channels.
Electronics 12 01148 g006
Figure 7. Damage scattering signals and sparse representation signals of 2–8 channels.
Electronics 12 01148 g007
Figure 8. Results of different damage factors at 20,000 fatigue cycles: (a) energy damage factor; (b) cross-correlation damage factor; (c) sparse representation damage factor.
Electronics 12 01148 g008
Figure 9. Results of different damage factors at 80,000 fatigue cycles: (a) energy damage factor; (b) cross-correlation damage factor; (c) sparse representation damage factor.
Electronics 12 01148 g009
Figure 10. Results of different damage factors at 90,000 fatigue cycles: (a) energy damage factor; (b) cross-correlation damage factor; (c) sparse representation damage factor.
Electronics 12 01148 g010
Figure 11. X-ray photographs of specimens under different number of fatigue cycles: (a) 20,000 fatigue cycles; (b) 80,000 fatigue cycles; (c) 90,000 fatigue cycles.
Electronics 12 01148 g011
Figure 12. Images for different damage factors at 20,000 fatigue cycles: (a) energy damage factor; (b) cross-correlation damage factor; (c) sparse representation damage factor.
Electronics 12 01148 g012
Figure 13. Images for different damage factors at 80,000 fatigue cycles: (a) energy damage factor; (b) cross-correlation damage factor; (c) sparse representation damage factor.
Electronics 12 01148 g013
Figure 14. Images for different damage factors at 90,000 fatigue cycles: (a) energy damage factor; (b) cross-correlation damage factor; (c) sparse representation damage factor.
Electronics 12 01148 g014
Figure 15. Thresholded imags for different damage factors at 20,000 fatigue cycles: (a) energy damage factor; (b) cross-correlation damage factor; (c) sparse representation damage factor.
Electronics 12 01148 g015
Figure 16. Thresholded imags for different damage factors at 80,000 fatigue cycles: (a) energy damage factor; (b) cross-correlation damage factor; (c) sparse representation damage factor.
Electronics 12 01148 g016
Figure 17. Thresholded imags for different damage factors at 90,000 fatigue cycles: (a) energy damage factor; (b) cross-correlation damage factor; (c) sparse representation damage factor.
Electronics 12 01148 g017
Figure 18. Damage scattering signals with different signal-to-noise ratios at 2–8 channels: (a) SNR = 6; (b) SNR = 3; (c) SNR = 0.1.
Electronics 12 01148 g018
Figure 19. Imaging results with different damage factors at a signal-to-noise ratio of 6 dB: (a) energy damage factor; (b) cross-correlation damage factor; (c) sparse representation damage factor.
Electronics 12 01148 g019
Figure 20. Imaging results with different damage factors at a signal-to-noise ratio of 3 dB: (a) energy damage factor; (b) cross-correlation damage factor; (c) sparse representation damage factor.
Electronics 12 01148 g020
Figure 21. Imaging results with different damage factors at a signal-to-noise ratio of 0.1 dB: (a) energy damage factor; (b) cross-correlation damage factor; (c) sparse representation damage factor.
Electronics 12 01148 g021
Figure 22. Thresholded imaging with different damage factors at a signal-to-noise ratio of 6 dB: (a) energy damage factor; (b) cross-correlation damage factor; (c) sparse representation damage factor.
Electronics 12 01148 g022
Figure 23. Thresholded imaging with different damage factors at a signal-to-noise ratio of 3 dB: (a) energy damage factor; (b) cross-correlation damage factor; (c) sparse representation damage factor.
Electronics 12 01148 g023
Figure 24. Thresholded imaging with different damage factors at a signal-to-noise ratio of 0.1 dB: (a) energy damage factor; (b) cross-correlation damage factor; (c) sparse representation damage factor.
Electronics 12 01148 g024
Table 1. Imaging error and error percentage for different damage factors.
CyclesIndicatorsEnergyCross-CorrelationSparse Representation
20,000Real area (cm2)8.848.848.84
Imaging area (cm2)55.0057.7232.01
Imaging error5.225.532.62
Error percentage49.81%52.60%
80,000Real area (cm2)16.5616.5616.56
Imaging area (cm2)59.2255.2533.44
Imaging error2.583.341.02
Error percentage60.44%67.33%
90,000Real area (cm2)18.6318.6318.63
Imaging area (cm2)53.8352.7237.80
Imaging error1.891.831.03
Error percentage45.53%43.77%
Table 2. Damage imaging error and error percentage under different noise.
SNRIndicatorsEnergyCross-CorrelationSparse Representation
6 dBReal area (cm2)18.6318.6318.63
Imaging area (cm2)53.9456.8333.24
Imaging error1.902.050.78
Error percentage58.6361.76
3 dBReal area (cm2)18.6318.6318.63
Imaging area (cm2)53.4859.9343.68
Imaging error1.872.221.35
Error percentage28.1139.33
0.1 dBReal area (cm2)18.6318.6318.63
Imaging area (cm2)54.4263.8051.40
Imaging error1.922.421.76
Error percentage8.4327.40
Disclaimer/Publisher’s Note: The statements, opinions and data contained in all publications are solely those of the individual author(s) and contributor(s) and not of MDPI and/or the editor(s). MDPI and/or the editor(s) disclaim responsibility for any injury to people or property resulting from any ideas, methods, instructions or products referred to in the content.

