Abstract
This study primarily analyzes the frequency regulation capability and fatigue loads of wind turbines based on over-speed control. Initially, a small-signal model of the wind turbine is established, which describes the output characteristics of the wind turbine under different control modes and wind speeds. Next, the model is used to analyze the wind turbine’s frequency regulation capability and to calculate the optimal frequency regulation parameter range based on the phase margin. Finally, a combination of frequency domain and time domain analysis is used to examine the influence of over-speed control on the fatigue loads of low-speed shafts, towers, and blades, which determines the wind speed range suitable for frequency regulation. The Fast (Fatigue, Aerodynamics, Structures, and Turbulence) Code V8 is used to simulate the dynamic characteristics of the wind turbine.
1. Introduction
In recent years, the role of wind turbines (WTs) in the primary frequency regulation of power systems has garnered increased attention [1,2,3,4]. Over-speed control is one of the most commonly used primary frequency regulation methods, as it can improve the frequency stability of power systems with high renewable energy penetration [5,6,7,8,9]. However, the frequency regulation capability and fatigue loads of WTs under over-speed control have been seldom analyzed. The aforementioned analysis can provide guidance for the primary frequency regulation of WTs to enhance system frequency stability and prolong their service life.
While over-speed control is a widely used primary frequency regulation method, most research has only focused on the performance of the system frequency [10], neglecting the WT’s response characteristics and stability margin under different wind speeds, de-loading factors, and frequency regulation gains. However, recent studies have highlighted the impact of frequency regulation on fatigue loads, which can accelerate the aging process of the mechanical system due to the high rates of change of torque and power [11,12]. Moreover, field tests have shown that different control methods have significant differences in their impact on fatigue loads [13], and simulation models have been used to examine the trend of fatigue load changes under different control parameters [14]. These studies indicate that under frequency response, the fatigue load on the low-speed shaft and tower increases, with a greater increase in fatigue load as the frequency response parameter becomes larger [15,16]. In addition, the impact of inertial response on low-speed shaft and tower has been evaluated using the power spectral density of system frequency and generator torque [17]. Results indicate that the fatigue load on the low-speed shaft may increase by over 200% under frequency response. One study analyzed the energy transmission path under frequency response using small signal modeling, which showed that the increase in fatigue load is mainly caused by the fluctuation of generator torque under frequency response [18]. The differences in the above literature can be shown in Table 1. However, most of these studies have only focused on the influence of control parameters on fatigue load, neglecting the impact of other factors such as wind speed. Therefore, clarifying the frequency regulation capability of WTs under different states is crucial to determine the frequency regulation gain range and guide the establishment of frequency regulation methods to improve system frequency stability. Additionally, understanding the mechanism of the impact of fatigue load is essential to prolong the service life of WTs and improve their frequency regulation performance.

Table 1.
Literature review.
This paper aims to investigate the frequency regulation capability and fatigue load of WT. The research focuses on addressing the following issues: (1) the establishment of a small-signal model of WT with different generator torque control based on over-speed control, (2) the analysis of the stability margin of the closed-loop control system, (3) the analysis of the response characteristics of the system, and (4) the analysis of the fatigue loads of WT caused by frequency response.
The main contributions of this study are as follows: (1) The establishment of a small-signal model of WT with different generator torque control based on over-speed control. (2) The analysis of the stability margin of the closed-loop control system to calculate the range of optimal frequency regulation gain. (3) The analysis of the response characteristics to investigate the effect of wind speed, de-loading factor, and frequency regulation gain on the system frequency. (4) The analysis of the fatigue loads of WT experienced by the drive train, tower, and blade caused by over-speed control.
Another limitation is that the study mainly focuses on the fatigue loads of the low-speed shaft, tower, and blades, while other components of the wind turbine, such as the gearbox and bearings, are not considered. In addition, the study only analyzes the impact of frequency response on WT fatigue loads, and other factors, such as wind shear and turbulence, are not taken into account. Furthermore, the study assumes a linear relationship between the control gain and the system response, which may not always hold in practice. Finally, the study only considers the impact of frequency regulation on the WT itself and does not take into account the impact on the power grid or the interaction between the WT and the power grid.
The paper is organized as follows. Section 2 introduces the WT control and over-speed control. Section 3 describes the establishment of WT’s small signal models. Section 4 and Section 5 analyze the frequency regulation capability and fatigue loads based on over-speed control, respectively. Conclusions are described in Section 6.
2. Frequency Regulation Method Based on Over-Speed Control
This chapter introduces the widely used WT generator torque and pitch control methods which are the basis of over-speed control [19].
2.1. Wind Turbine Control
Torque control and pitch control are the primary methods used for power tracking in wind turbines. Yaw control is also employed to align the turbine with the wind direction for better power capture, but it is not the focus of this study. Torque control can be divided into two regions: maximum power point tracking (MPPT) and constant power control [20]. The transition between these regions is typically determined by evaluating whether the set capture power, rotor speed, or pitch integral limits are exceeded, as shown in Figure 1.
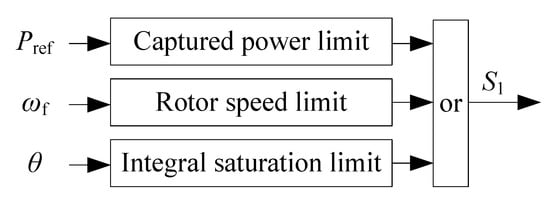
Figure 1.
The method of judging the torque control region.
When S is 0, the torque control operates in the MPPT region, and the method can be shown in Equation (1). In this control region, pitch control is prohibited. When S is 1, the torque control operates in the constant power control region, and the method can be shown in Equation (2). In this control region, the pitch control is activated. Thus, the torque control can be illustrated in Figure 2.
where, k is the optimal gain of torque control, P is the reference power, is the pitch angle (deg), P is the rated power, is the filtered speed (rad/s) of the generator speed through the low-pass filter (LPF), is the generator speed (rad/s), T is the reference torque (Nm).
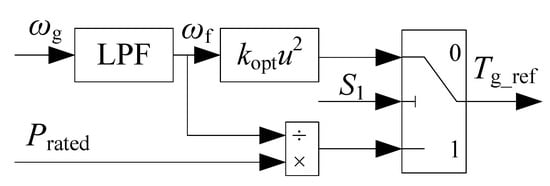
Figure 2.
The commonly used torque control method.
When the pitch control is activated (S is 1), the pitch control would be implemented if the filtered speed exceeds the rated speed. The pitch control method is the PI control method based on gain scheduling shown by Equation (3). Moreover, the pitch control block diagram can be seen in Figure 3.
where, is the pitch angle, k and k are the proportional and integral gains, is the rated generator speed, k and k are the control gains.
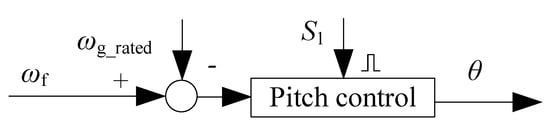
Figure 3.
The commonly used pitch control method.
2.2. Over-Speed Control
In order to continuously provide frequency support, de-loading operation is required. This can be achieved through over-speed control by appropriately shifting the WT operating point to the right of the MPPT curve, as illustrated in Figure 4. The operating point speed of the green curve is higher than that of the MPPT operating point, resulting in a lower output power P corresponding to the green curve compared to P.
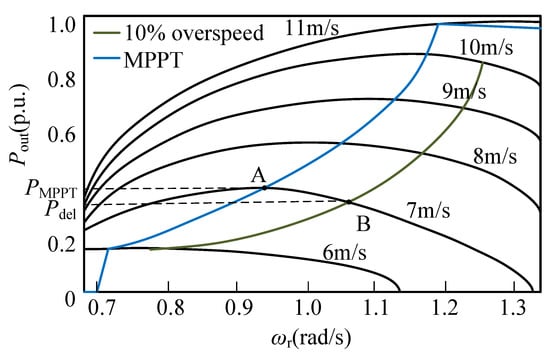
Figure 4.
Block diagram of droop control.
Therefore, torque control can be expressed as Equations (4) and (5), and its control block diagram is illustrated in Figure 5.
where, is the de-loading factor, R(s) is the reference of frequency, Y(s) is the feedback of the frequency regulation system, k is the gain of frequency regulation.
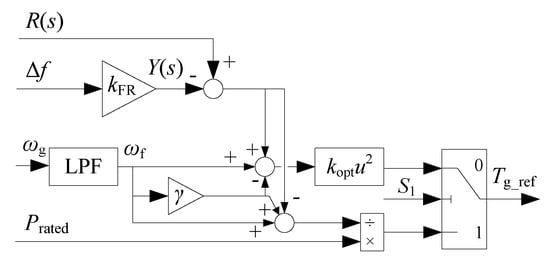
Figure 5.
Block diagram of over-speed control.
3. The Small Signal of Wind Turbine Model Based on Over-Speed Control
To investigate the frequency regulation capability and fatigue loads of a WT, it is essential to develop a small-signal model for the WT with over-speed control.
3.1. Aerodynamics
The linearization of Equation (6) can be expressed as Equation (8).
where Equation (8) can be calculated by Equation (9),
Let:
and simplify Equation (10) to obtain Equation (12). Equation (12) is the small signal model of aerodynamic torque.
Similarly, the linearization of Equation (7) can be expressed as
Unitizing Equation (13) at its stable operating point yields Equation (14).
the small signal of thrust force can be represented by Equation (15).
where, is the air density (), is the wind speed (m/s), is the length of the blade (m), is the rotor speed (rad/s), C and C are the power and thrust coefficient. The subscript with 0 indicates the state corresponding to the current operating time (stable operating point). For example, is the rotor speed at the current running time.
3.2. Drive Train Based on Dual-Mass Model
The dual-mass drive train model can better reflect the motion characteristics of the drive train, making it more suitable for the study of frequency regulation and fatigue loads of the WT. The small signal models of the rotor speed, generator speed, and low-speed shaft (LSS) can be derived using Equations (16)–(18), respectively.
where, is the gearbox ratio, J is the rotor mass, J is the generator mass, K is the LSS spring constant (Nm/rad), B is the LSS viscous friction constant (Nm·s/rad).
3.3. Wind Turbine Control
The small-signal model of the filtered generator speed can be represented as Equation (19). To simplify the expression, denote shown in Equation (20) as the input of the WT under the frequency regulation method based on over-speed control. Besides, the small signal of the WT control methods can be shown as Equations (21)–(23) based on Equations (3)–(5).
where, is the filter time(s).
3.4. Generator
3.5. The Small Signal Model of Wind Turbine under Different Operating Region
According to the aforementioned small-signal models, Figure 6 and Figure 7 show the small-signal model of the WT. It is worth noting that when S is 0, the torque control adopts the MPPT control method shown in Equation (4), and the pitch angle in this scenario is always zero. On the other hand, when S is 1, the torque control adopts the constant power control method shown in Equation (5), and the pitch control in this scenario is activated.
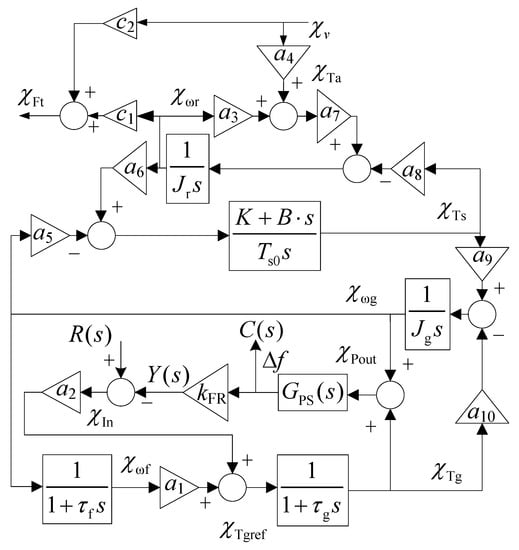
Figure 6.
The WT small signal when S is 0.
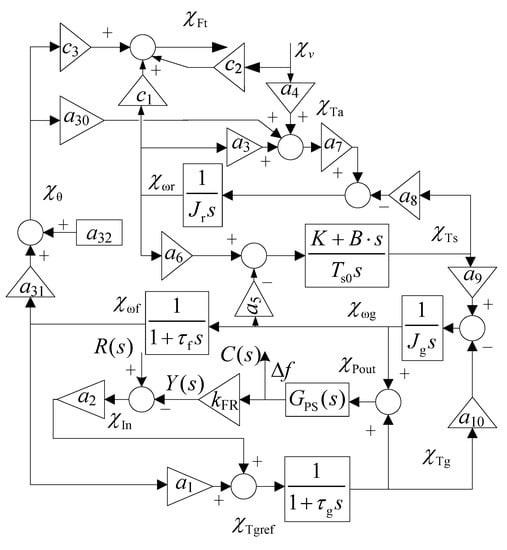
Figure 7.
The WT small signal when S is 1.
According to the input and output of the WT, its small signal model can be further simplified and expressed as shown in Figure 8. When S is 0, the WT small signal model is represented by Equation (26), while Equation (27) is used when S is 1. The related coefficients in the equations are provided. The relationship between the system frequency and the WT input, which is the WT frequency regulation method, is represented by Equation (28).
with,
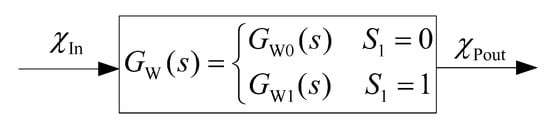
Figure 8.
The simplified WT small signal model.
4. Analysis of Stability and Response Characteristics of the Power System Frequency
In this chapter, we aim to analyze the impact of wind speed, de-loading factor, and the gain of frequency regulation on the control system. To do so, we will first analyze the control system’s open-loop transfer function and closed-loop transfer function. Additionally, we will evaluate the frequency regulation capability of the system.
4.1. Stability Analysis Based on Open-Loop Transfer Function
The stability of a control system is typically assessed based on the phase margin of its open-loop transfer function. In engineering, a phase margin between 30 to 60 degrees or 45 to 70 degrees is typically considered optimal for different controlled objects. Evaluating the phase margin can help identify the optimal control parameter range. In this study, we focus on a phase margin range of 30 to 70 degrees to determine the optimal frequency regulation gain range under different wind speeds and de-loading factors. Our program indicates that the control system is a minimum phase system across all parameters.
The frequency regulation block diagram of WT is shown in Figure 9. G() and G() in the figure represent the transfer functions of the WT and thermal unit respectively, and the expressions are shown. and are the power generation coefficients of wind power and thermal power, respectively. () represents the transfer function of the controller of the thermal unit and can be seen. () represents the transfer function of the controller of the WT. In this study, () is . Therefore, the open-loop transfer function of the frequency regulation of the WT is derived as shown in Equation (29).
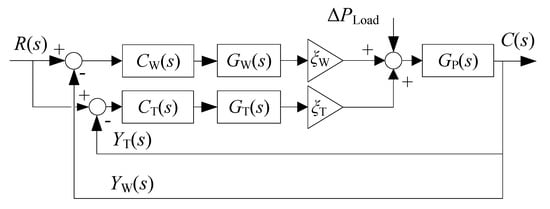
Figure 9.
The frequency regulation block diagram for analysing open-loop stability.
Based on Equation (29), the phase margins of the control systems with different wind speeds and frequency regulation coefficients are calculated under different de-loading factors . Among them, the ranges from 20 to 300. The wind speed ranges from 3 to 24. Figure 10 shows the phase margin when the is 0.05.
with,
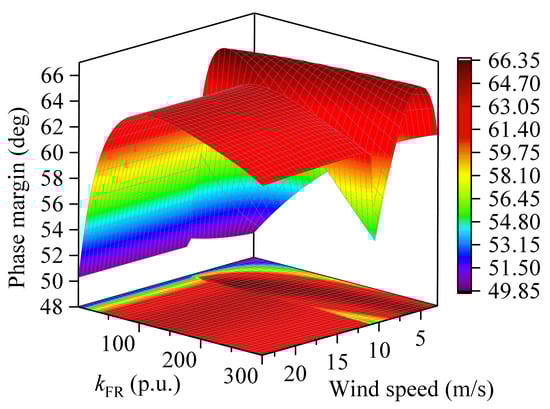
Figure 10.
The phase margin of the frequency regulation system when the de-loading factor is 0.05.
From Figure 10, it can be observed that the phase margins are within the optimal range, indicating that the frequency regulation gain falls within a specific range that meets the optimal stability margin of the control system. Furthermore, the phase margins for other de-loading factors are similar to those in Figure 10, indicating that the control gain of the primary frequency regulation based on over-speed control is feasible within a specific range. This analysis demonstrates that the control system’s stability is sufficient to ensure reliable operation of the wind turbine under different operating conditions.
4.2. Response Analysis Based on Closed-Loop Transfer Function
To investigate the effectiveness of WT’s frequency regulation in reducing frequency dips under various operating conditions (wind speed, , and ), it is necessary to analyze the response characteristics of the closed-loop transfer function. The closed-loop block diagram of the control system is shown in Figure 11, and the response characteristics can be evaluated using Equation (30).
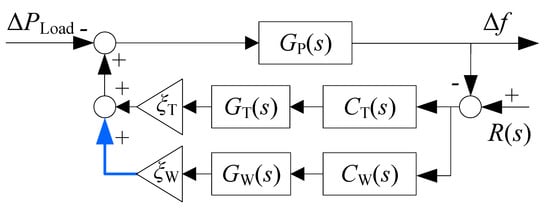
Figure 11.
Block diagram of droop control.
The Bode diagrams of Δ/Δ under different wind speeds ( is 0 or 1) are shown in Figure 12 (with Figure 13 showing partial enlargement) and Figure 14 (with Figure 15 showing partial enlargement), respectively. The results indicate that a higher can better reduce frequency deviation for the same wind speed and . Additionally, the ability to mitigate frequency deviation for a given and is dependent on the frequency band of system load changes. Specifically, if the frequency band of system load changes is above 0.15 rad/s, increasing wind speed is more conducive to reducing frequency deviation. Conversely, if the frequency band is below 0.15 rad/s, lower wind speed is more beneficial. Finally, increasing is not helpful in mitigating frequency deviation for the same wind speed and . It is worth noting that these results are based on frequency domain analysis and should be combined with time domain analysis for a more comprehensive evaluation.
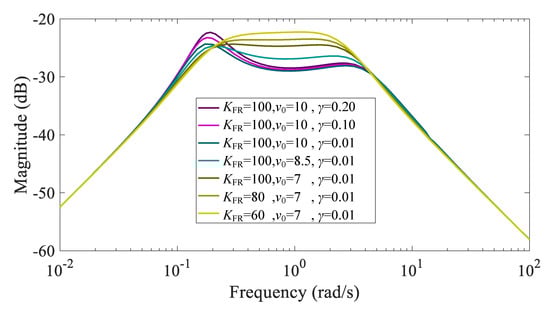
Figure 12.
The Bode diagram of Δ/Δ below rated wind speed.
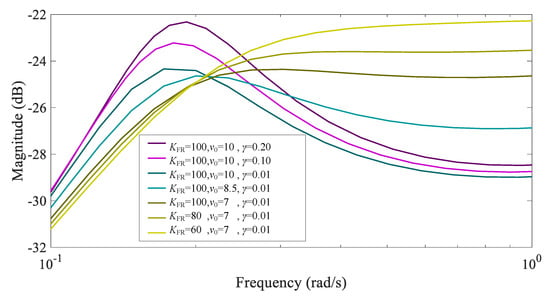
Figure 13.
Partial enlargement of the Bode diagram of Δ/Δ below rated wind speed.
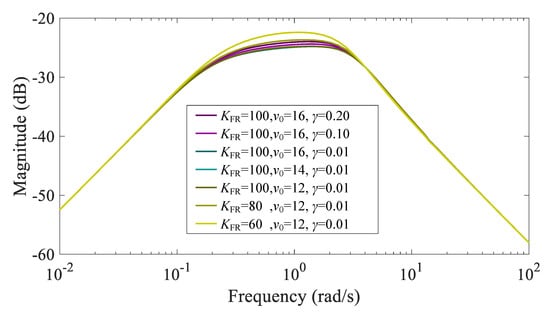
Figure 14.
The Bode diagram of Δ/Δ above rated wind speed.
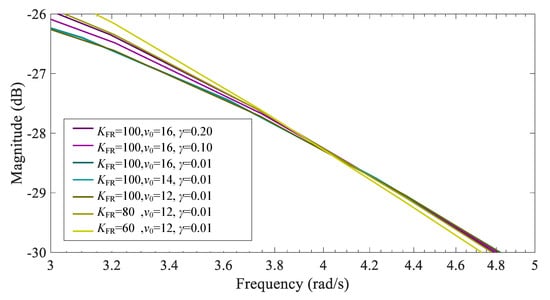
Figure 15.
Partial enlargement of the Bode diagram of Δ/Δ above rated wind speed.
It can be observed that increasing leads to better reduction in frequency deviation. Additionally, wind speed has a negligible effect on the frequency response. Furthermore, increasing does not improve the mitigation of frequency deviation. However, it is important to note that a comprehensive analysis of the specific situation should also include time domain analysis.
4.3. Evaluation of Primary Frequency Regulation Capability
To further investigate the performance of frequency regulation of the WT, it is essential to analyze its frequency regulation capability in the time domain. In this study, the frequency regulation capability is defined as the output capability under the same frequency deviation. To evaluate this capability, the blue line in Figure 11 is broken, and the WT is subjected to the same frequency change as before. The load Δ is suddenly increased by 10%, and is set to the same parameter. The frequency regulation capability is then calculated using Equation (31).
The frequency regulation capability is depicted in Figure 16. As shown, the wind speed range corresponding to the maximum frequency regulation capability is between 7.5 m/s and 10.5 m/s.
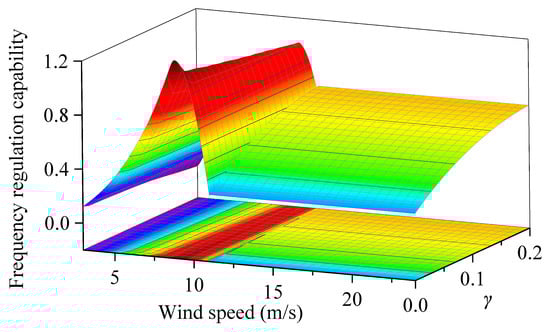
Figure 16.
The frequency regulation capability of a WT under different wind speeds and .
Below the rated wind speed, increasing would reduce the frequency regulation capability, consistent with the frequency domain analysis discussed earlier. Above the rated wind speed, increasing wind speed does not affect the frequency regulation capability, in line with the earlier frequency domain analysis. However, the frequency regulation capability increases with increasing , which differs from the frequency analysis. This is because frequency domain analysis cannot account for non-linear situations where the output is insufficient due to a lack of reserve. Additionally, it’s worth noting that even with set to 0, the WT can output power by overloading the generator (rated power is 5 MW, maximum output is 5.3 MW).
When the blue line in Figure 11 is reconnected, the frequency nadir can be observed in Figure 17. It can be inferred that the frequency nadir is inversely proportional to the frequency regulation capability of WT. Thus, the greater the frequency regulation capability of WT, the closer the frequency nadir is to zero. This observation further validates the accuracy of the analysis results of frequency regulation capability.
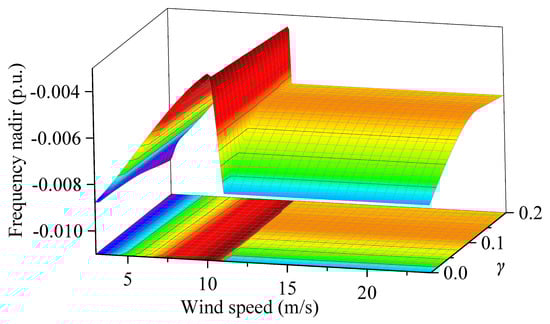
Figure 17.
Frequency nadir under different wind speeds and .
5. Analysis of the Fatigue Load Caused by Frequency Regulation
In addition to considering the contribution of WT to frequency stability, it is important to also consider the fatigue loads caused by frequency regulation, as they are crucial for the long-term stable operation of the WT. These fatigue loads mainly arise from the fluctuations of LSS torque, tower bending moments (fore-aft and lateral), and blade bending moments (flapwise and edgewise). To quantify the related fatigue loads, the damage equivalent load (DEL) is calculated using MCrunch [21]. The parameters of the simulated WT can be found in Table 2.
Table 2.
The parameters of the simulated WT.
5.1. The Fatigue Load of Low-Speed Shaft Caused by Frequency Regulation
The LSS torque fluctuation is used to evaluate the fatigue load on the LSS. The relationship between and is represented by Equations (32) and (33). The impact of due to under different parameters is shown in Figure 18 (with Figure 19 showing partial enlargement) and Figure 20. The lower corner marked with zero represents below the rated wind speed, and the lower corner marked with one represents above the rated wind speed.
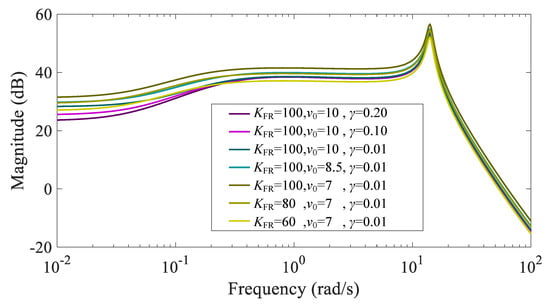
Figure 18.
Bode diagram of under different parameters below rated wind speed.
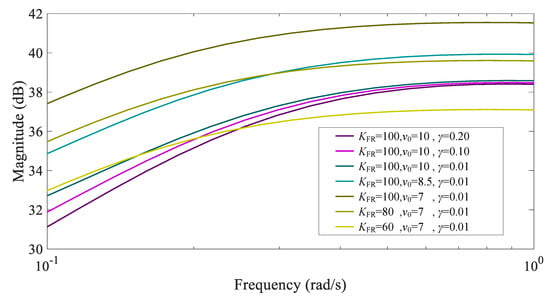
Figure 19.
Partial enlargement of the Bode diagram of under different parameters below rated wind speed.
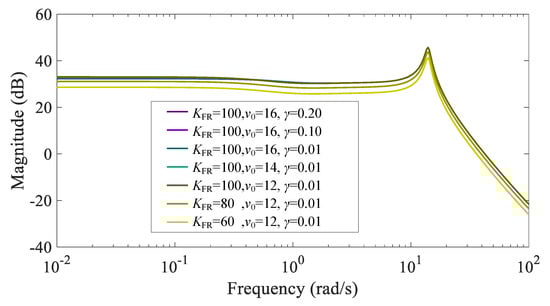
Figure 20.
Bode diagram of under different parameters above rated wind speed.
From Figure 18, it can be observed that under rated wind speed, the LSS torque would increase with a higher value. The fluctuation of LSS torque would decrease with an increase in wind speed and value. On the other hand, Figure 20 shows that the LSS torque would increase with a higher value above rated wind speed. However, the fluctuation of LSS torque would be less affected by an increase in wind speed and value. Furthermore, if the frequency band of the system frequency is close to the torsional vibration frequency of the drivetrain (14 rad/s), then the drivetrain is mostly affected by primary frequency regulation.
Figure 21 and Figure 22 show the percentage increase in fatigue loads of LSS under different wind conditions (turbulent winds with different mean velocities) and , compared to the fatigue loads without frequency regulation, for different values of . The results indicate that when is 200 p.u. and the wind speed is less than 6 m/s, the fatigue load of LSS increases significantly, with a maximum increase of 300%, which seriously reduces the service life of WT. Larger values result in significantly higher fatigue loads. However, increasing can mitigate the fatigue load to a certain extent. These time domain results are consistent with the frequency analysis results. Based on the data presented in Figure 21 and Figure 22, it can be concluded that when the average wind speed is below 6 m/s, WT is not suitable for participating in frequency regulation due to the significant increase in the fatigue load of LSS.
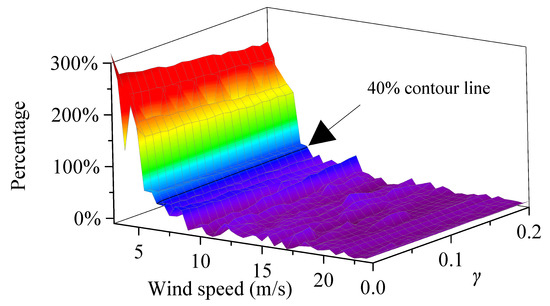
Figure 21.
The percentage increase in fatigue loads of LSS under different wind speeds, compared to the fatigue loads without frequency regulation when is 200 p.u.
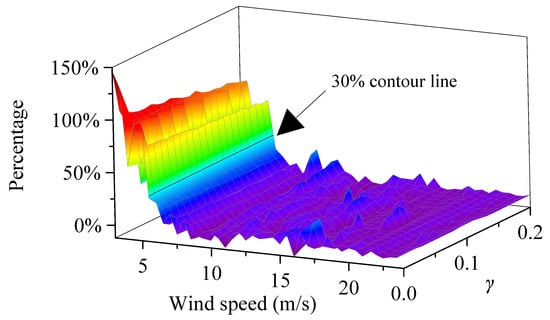
Figure 22.
The percentage increase in fatigue loads of LSS under different wind speeds, compared to the fatigue loads without frequency regulation when is 50 p.u.
5.2. The Fatigue Load of Tower Bending Moments Caused by Frequency Regulation
The tower fore-aft bending moment is mainly related to the aerodynamic thrust force. The relationship between and is represented by Equations (34) and (35). The impact under different parameters is shown in Figure 23 (with Figure 24 showing partial enlargement) and Figure 25. It can be seen from Figure 23 that the would increase with a larger below rated wind speed. The increase in wind speed or would reduce its fluctuations. It can be seen from Figure 25 that the would increase with a larger above rated wind speed. The fluctuation of around the 4 rad/s frequency is significantly mitigated at low wind speeds.
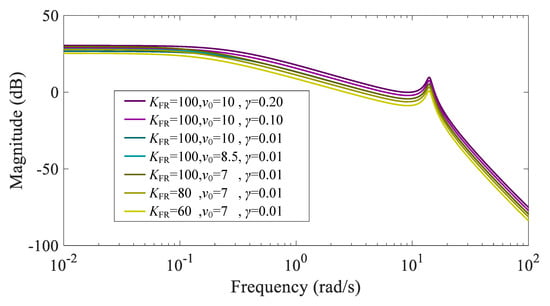
Figure 23.
Bode diagram of under different parameters below rated wind speed.
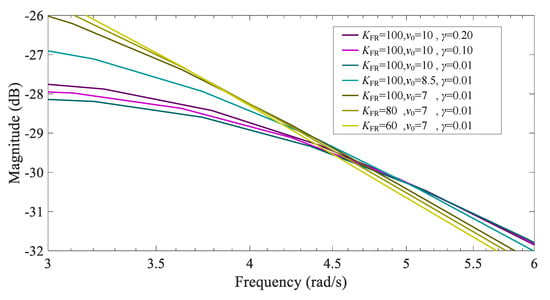
Figure 24.
Partial enlargement of the Bode diagram of under different parameters below rated wind speed.
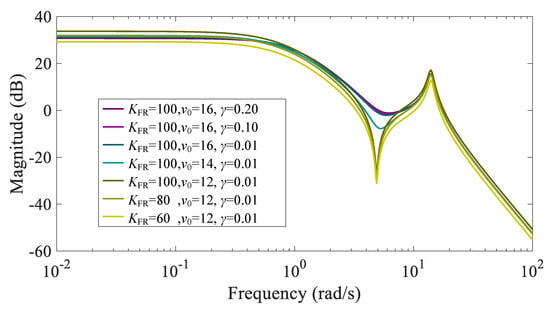
Figure 25.
Bode diagram of under different parameters above rated wind speed.
Figure 26 shows the percentage increase in fatigue loads of the tower fore-aft bending moment under different wind speeds and when is 250 p.u. The results indicate that the fatigue loads may either increase or decrease within a range of 30%.
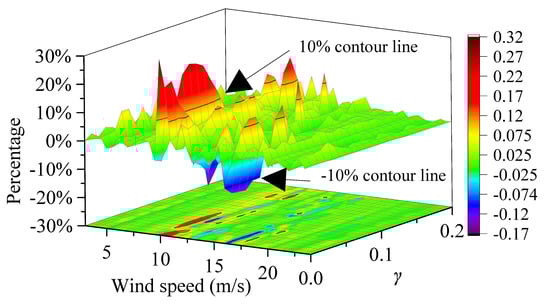
Figure 26.
The percentage increase in tower fore-aft fatigue loads under different wind speeds, compared to the fatigue loads without frequency regulation when is 250 p.u.
The tower lateral bending moment is a critical parameter related to the generator torque fluctuation during frequency regulation. The relationship between and is represented by Equations (36) and (37). The impact of by under different parameters is shown in Figure 27 and Figure 28. Figure 27 shows that the would increase with a larger below the rated wind speed. However, the increase in wind speed and would reduce its fluctuation. On the other hand, Figure 28 shows that the would increase with a larger above the rated wind speed. The increase in wind speed and has little effect on its fluctuation.
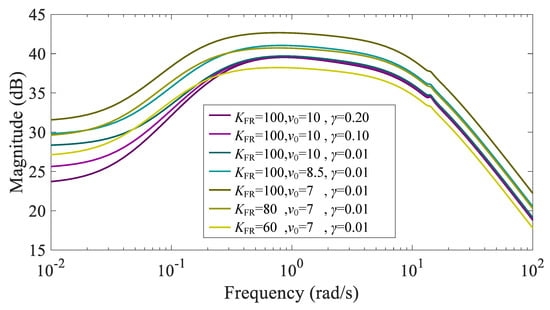
Figure 27.
Bode diagram of under different parameters below rated wind speed.
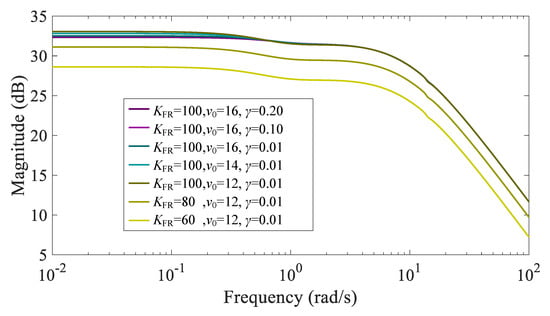
Figure 28.
Bode diagram of under different parameters above rated wind speed.
The percentage increase in fatigue loads of the tower lateral bending moment is shown in Figure 29. It can be observed that when the wind speed is below 6 m/s, the fatigue load increases significantly, with a maximum increase of 160%. This increase can substantially reduce the service life of the wind turbine.
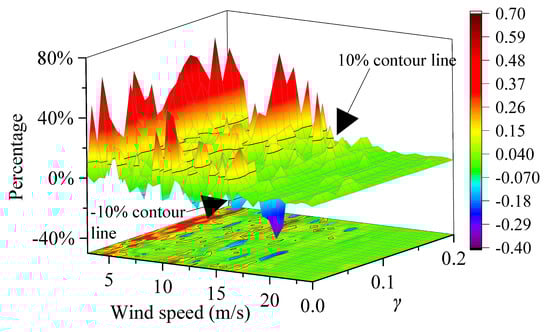
Figure 29.
The percentage increase in tower lateral fatigue loads under different wind speeds, compared to the fatigue loads without frequency regulation when is 250 p.u.
5.3. The Fatigue Load of Blade Bending Moments Caused by Frequency Regulation
The figures show the percentage increase in fatigue loads of blade flapwise and edgewise bending moment under different working conditions. The blade flapwise bending moment, which is mainly related to the aerodynamic thrust force, is affected similarly to the tower fore-aft bending moment. On the other hand, the blade edgewise bending moment, which is mainly related to the side-to-side aerodynamic force, is hardly affected by frequency regulation. These results are illustrated in Figure 30 and Figure 31.
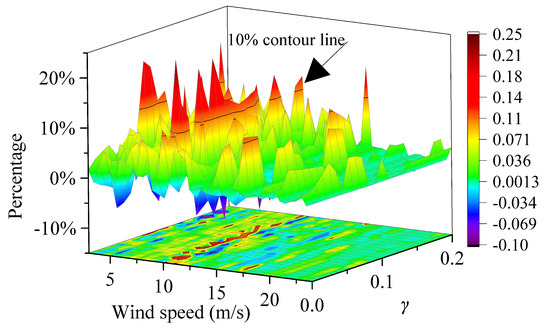
Figure 30.
The increase of fatigue load on blade flapwise bending moment under different wind speeds, compared to the fatigue loads without frequency regulation when is 250 p.u.
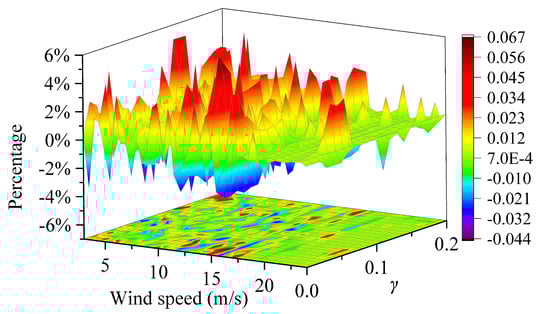
Figure 31.
The increase of fatigue load onblade edgewise bending moment under different wind speeds, compared to that without frequency regulation when is 250 p.u.
5.4. The Impact of WT Parameters on Fatigue Load under Frequency Response
With the development of technology and changes in market demand, the design parameters and operating environment of WT are constantly changing. Therefore, it is necessary to analyze the impact of changes in WT size and operating environment on the fatigue load of WT under frequency response. As wind turbines grow in size, the inertia of the wind rotor tends to increase in tandem. This is due to the increased weight and inertia of the rotor as it expands in size, as well as the need for manufacturers to reinforce the wind rotor structure with additional materials and thickness for enhanced stability and reliability. Consequently, this section will primarily examine how the increase in rotor and generator inertia impacts the fatigue load.
The graph depicted in Figure 32 illustrates the impact of frequency response on LSS as the inertia constant of the rotor and generator increases below the rated wind speed. The resonant frequency of LSS decreases as the inertia constant rises. Below the resonant frequency of LSS, the influence of frequency response on LSS increases with the inertia constant, while above the resonant frequency, this influence decreases with the inertia constant. The same trend is observed in the influence of frequency response on LSS above the rated wind speed, as shown in Figure 33. It is important to note that the frequency band of the system fluctuation is typically smaller than the resonant frequency of LSS, meaning that overall, the influence of frequency response on LSS increases with an increase in the inertia constant. Thus, as the rated capacity of the WT grows, the influence of frequency response on LSS will increase. Meanwhile, changes in air density will have no impact. The impact of frequency response on the generator and tower, however, remains relatively constant with changes in the inertia constant, and the results are not displayed.
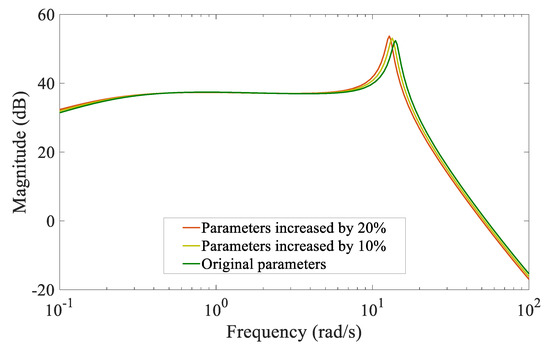
Figure 32.
Bode diagram of under rotor and generator inertia different parameters below rated wind speed.
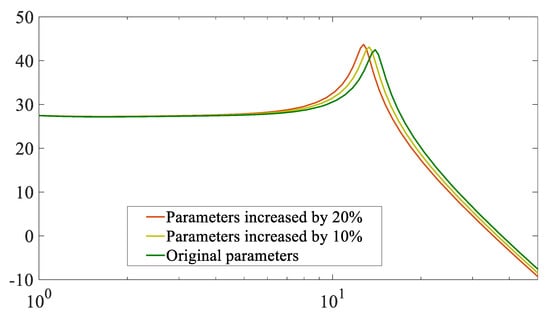
Figure 33.
Bode diagram of under different rotor and generator inertia parameters above rated wind speed.
6. Conclusions and Discussions
The frequency response of wind turbines is expected to play a crucial role in the future development of power systems, as it can significantly enhance the frequency stability of these systems. For instance, droop control can reduce the maximum frequency deviation, while inertia control can lower the rate of system frequency change. The frequency regulation capability and fatigue loads of WTs based on over-speed control have been analyzed. The response characteristics of WTs under different working conditions were examined to evaluate their frequency regulation capability. The impact of system frequency on the fluctuations of low-speed shaft torque, tower fore-aft and lateral bending moments, and blade flapwise and edgewise bending moments were analyzed using frequency domain analysis based on transfer functions to assess the mechanism of fatigue loads caused by over-speed control. The fatigue load analysis was verified by comparing the results with those obtained from the FAST tool. The findings showed that when the average wind speed is below 6 m/s, the fatigue loads experienced by tower lateral bending moment and low-speed shaft torque could increase by 50% to 300%. Therefore, it is not recommended for WTs to engage in over-speed control below 6 m/s.
To sum up, the analysis conducted indicates that the participation of wind turbines in over-speed control would lead to an increase in their fatigue loads. The results obtained from this study can provide guidance for the development of a primary frequency regulation method for wind turbines based on over-speed control while considering the impact of fatigue loads.
Author Contributions
This paper was completed by the authors in cooperation. Y.W., Y.G. and Y.C. carried out theoretical research, data analysis, results analysis, paper writing, and constructive suggestions. W.X. revised the paper. All authors have read and agreed to the published version of the manuscript.
Funding
This work is funded by State Grid Corporation of China. This work was supported by Science and technology projects managed by the headquarters of State Grid Corporation of China under Grant 5108-202299259A-1-0-ZB.
Data Availability Statement
Data sharing not applicable.
Conflicts of Interest
The authors declare no conflict of interest.
References
- Cheng, Y.; Azizipanah-Abarghooee, R.; Azizi, S.; Ding, L.; Terzija, V. Smart frequency control in low inertia energy systems based on frequency response techniques: A review. Appl. Energy 2020, 279, 115798. [Google Scholar] [CrossRef]
- Yao, Q.; Li, S.; He, J.; Cai, W.; Hu, Y. New design of a wind farm frequency control considering output uncertainty and fatigue suppression. Energy Rep. 2023, 9, 1436–1446. [Google Scholar] [CrossRef]
- Guan, M. Scheduled Power Control and Autonomous Energy Control of Grid-Connected Energy Storage System (ESS) With Virtual Synchronous Generator and Primary Frequency Regulation Capabilities. IEEE Trans. Power Syst. 2022, 37, 942–954. [Google Scholar] [CrossRef]
- Björk, J.; Pombo, D.V.; Johansson, K.H. Variable-Speed Wind Turbine Control Designed for Coordinated Fast Frequency Reserves. IEEE Trans. Power Syst. 2022, 37, 1471–1481. [Google Scholar] [CrossRef]
- Zhang, X.; Lin, B.; Xu, K.; Zhang, Y.; Hao, S.; Hu, Q. An Improved Over-Speed Deloading Control of Wind Power Systems for Primary Frequency Regulation Considering Turbulence Characteristics. Energies 2023, 16, 2813. [Google Scholar] [CrossRef]
- Liu, M.; Chen, J.; Milano, F. On-Line Inertia Estimation for Synchronous and Non-Synchronous Devices. IEEE Trans. Power Syst. 2021, 36, 2693–2701. [Google Scholar] [CrossRef]
- Manaz, M.A.M.; Lu, C.N. Design of Resonance Damper for Wind Energy Conversion System Providing Frequency Support Service to Low Inertia Power Systems. IEEE Trans. Power Syst. 2020, 35, 4297–4306. [Google Scholar] [CrossRef]
- Lee, G.S.; Kwon, D.H.; Moon, S.I.; Hwang, P.I. A Coordinated Control Strategy for LCC HVDC Systems for Frequency Support with Suppression of AC Voltage Fluctuations. IEEE Trans. Power Syst. 2020, 35, 2804–2815. [Google Scholar] [CrossRef]
- Ortega, A.; Milano, F. A Method for Evaluating Frequency Regulation in an Electrical Grid—Part II: Applications to Non-Synchronous Devices. IEEE Trans. Power Syst. 2021, 36, 194–203. [Google Scholar] [CrossRef]
- Zhao, J.; Lyu, X.; Fu, Y.; Hu, X.; Li, F. Coordinated Microgrid Frequency Regulation Based on DFIG Variable Coefficient Using Virtual Inertia and Primary Frequency Control. IEEE Trans. Energy Convers. 2016, 31, 833–845. [Google Scholar] [CrossRef]
- Arani, M.F.M.; Mohamed, Y.A.R.I. Analysis and Mitigation of Undesirable Impacts of Implementing Frequency Support Controllers in Wind Power Generation. IEEE Trans. Energy Convers. 2016, 31, 174–186. [Google Scholar] [CrossRef]
- Arani, M.F.M.; Mohamed, Y.A.R.I. Analysis and Damping of Mechanical Resonance of Wind Power Generators Contributing to Frequency Regulation. IEEE Trans. Power Syst. 2017, 32, 3195–3204. [Google Scholar] [CrossRef]
- Fleming, P.A.; Aho, J.; Buckspan, A.; Ela, E.; Zhang, Y.; Gevorgian, V.; Scholbrock, A.; Pao, L.; Damiani, R. Effects of power reserve control on wind turbine structural loading. Wind. Energy 2016, 19, 453–469. [Google Scholar] [CrossRef]
- Attya, A.B.T.; Dominguez-García, J.L. Insights on the Provision of Frequency Support by Wind Power and the Impact on Energy Systems. IEEE Trans. Sustain. Energy 2018, 9, 719–728. [Google Scholar] [CrossRef]
- You, R.; Barahona, B.; Chai, J.; Cutululis, N.A. Frequency support capability of variable speed wind turbine based on electromagnetic coupler. Renew. Energy 2015, 74, 681–688. [Google Scholar] [CrossRef]
- Barahona Garzón, B.; You, R.; Hansen, A.D.; Cutululis, N.A.; Sørensen, P.E. Assessment of the impact of frequency support on DFIG wind turbine loads. In Proceedings of the 12th International Workshop on Large-Scale Integration of Wind Power into Power Systems as well as on Transmission Networks for Offshore Wind Power Plants, London, UK, 22–24 October 2013; pp. 1–7. [Google Scholar]
- Guo, F.; Schlipf, D. A Spectral Model of Grid Frequency for Assessing the Impact of Inertia Response on Wind Turbine Dynamics. Energies 2021, 14, 2492. [Google Scholar] [CrossRef]
- Zhang, X.; He, W.; Hu, J. Impact of Inertia Control of DFIG-Based WT on Torsional Vibration in Drivetrain. IEEE Trans. Sustain. Energy 2020, 11, 2525–2534. [Google Scholar] [CrossRef]
- Wang, Y.; Guo, Y.; Zhang, D. Optimal ancillary control for frequency regulation of wind turbine generator based on improved fatigue load sensitivity. Int. J. Electr. Power Energy Syst. 2022, 137, 107751. [Google Scholar] [CrossRef]
- Zhao, H.; Wu, Q.; Guo, Q.; Sun, H.; Xue, Y. Distributed Model Predictive Control of a Wind Farm for Optimal Active Power ControlPart I: Clustering-Based Wind Turbine Model Linearization. IEEE Trans. Sustain. Energy 2015, 6, 831–839. [Google Scholar] [CrossRef]
- Buhl, M.L. MCrunch User’s Guide for Version 1.00; National Renewable Energy Laboratory: Denver, CO, USA, 2008.


Disclaimer/Publisher’s Note: The statements, opinions and data contained in all publications are solely those of the individual author(s) and contributor(s) and not of MDPI and/or the editor(s). MDPI and/or the editor(s) disclaim responsibility for any injury to people or property resulting from any ideas, methods, instructions or products referred to in the content. |
© 2023 by the authors. Licensee MDPI, Basel, Switzerland. This article is an open access article distributed under the terms and conditions of the Creative Commons Attribution (CC BY) license (https://creativecommons.org/licenses/by/4.0/).