Article

A User Purchase Behavior Prediction Method Based on XGBoost

1
School of Software, Jiangxi Normal University, Nanchang 330022, China
2
Department of Mathematics and Information Technology, The Education University of Hong Kong, Hong Kong 999077, China
3
School of Economics and Management, East China Jiaotong University, Nanchang 330013, China
4
School of Intercultural Studies, Jiangxi Normal University, Nanchang 330022, China
*
Authors to whom correspondence should be addressed.
Electronics 2023, 12(9), 2047; https://doi.org/10.3390/electronics12092047
Submission received: 19 March 2023 / Revised: 25 April 2023 / Accepted: 26 April 2023 / Published: 28 April 2023

Abstract

:
With the increasing use of electronic commerce, online purchasing users have been rapidly rising. Predicting user behavior has therefore become a vital issue based on the collected data. However, traditional machine learning algorithms for prediction require significant computing time and often produce unsatisfactory results. In this paper, a prediction model based on XGBoost is proposed to predict user purchase behavior. Firstly, a user value model (LDTD) utilizing multi-feature fusion is proposed to differentiate between user types based on the available user account data. The multi-feature behavior fusion is carried out to generate the user tag feature according to user behavior patterns. Next, the XGBoost feature importance model is employed to analyze multi-dimensional features and identify the model with the most significant weight value as the key feature for constructing the model. This feature, together with other user features, is then used for prediction via the XGBoost model. Compared to existing machine learning models such as K-Nearest Neighbor (KNN), Support Vector Machine (SVM), Random Forest (RF), and Back Propagation Neural Network (BPNN), the eXtreme Gradient Boosting (XGBoost) model outperforms with an accuracy of 0.9761, an F1 score of 0.9763, and a ROC value of 0.9768. Thus, the XGBoost model demonstrates superior stability and algorithm efficiency, making it an ideal choice for predicting user purchase behavior with high levels of accuracy.

1. Introduction

Given the surge in e-commerce, there has been a substantial increase in online purchasing. As a result, online sales have now become a crucial factor in the overall shopping market [1]. Owing to the widespread adoption of the mobile internet and smartphones, people can now engage in instant communication via cyberspace. In this context, shopping has also become a social activity where individuals share their experiences with others [2]. The quantity of users’ online behavioral data, such as browsing, adding items to their shopping cart, and making purchases, is increasing sharply. Especially in the era of 5G, the fusion of e-commerce and the Internet of Things is expected to produce an unparalleled volume of user behavior data [3,4]. It is a critical and interesting issue to mine critical information from historical data, which can then be used to predict user behavior [5,6]. This approach is a mutually beneficial and advantageous solution for both the merchant and the users [7]. Moreover, the massive user behavior on the Internet will cause information security problems for e-commerce itself [8]. Analyzing online user behavior data, developing models to capture user purchase expectations, and predicting their buying intentions is a valuable approach. Leveraging the insights from this analysis, targeted marketing strategies can then be devised that aim to improve user conversion rates.
Up to now, several machine learning methods have been proposed for analyzing user behavior and predicting their actions [9,10,11,12,13]. The current machine learning-based methods often rely on only one attribute of a node, leading to the loss of potentially useful information. As the number of e-commerce users increases and behavioral data expands, traditional machine learning algorithms require an extensive amount of computing time for feature selection and composition. Furthermore, these methods often necessitate the implementation of complicated feature engineering techniques [14], thereby increasing implementation complexity. Extracting meaningful features from the raw browsing and purchase behavior dataset alone is challenging since it contains diverse and irrelevant characteristics. The presence of extraneous features in the massive purchase behavior data results in increased time and cost for training models.
Additionally, users’ purchase behavior data is not always labeled with their distinctive characteristics. It is challenging to distinguish the purchase efficiency of browsing behavior alone and to predict the actions of distinct users accurately. Machine learning methods are gradually applied to user behavior prediction [15,16,17,18], such as Random Forest (RF) [15], K-Nearest Neighbor (KNN) [16], and eXtreme gradient boosting (XGBoost) [18]. Following careful analysis and comparison, the XGBoost model outperformed other prediction models, exhibiting the most potent predictive capabilities [19].
Based on the above, a prediction model based on multi-feature fusion based on XGBoost is designed to mine user purchase behavior in this paper. The contribution of this paper mainly focuses on the following:
(1) A feature fusion model named LDTD, which fuses three dimensions of “login_diff_time” (LDT), “login_time” (LT), and “login_day” (LD), is uniquely designed to differentiate user value types based on user account data information. A multi-feature behavior fusion approach is then employed to generate user tag features, enabling more insightful analysis. Once the users are classified and processed, their data tags are further transformed into distinctive features.
(2) The XGBoost feature importance model is leveraged to compute the weights of multi-dimensional features. The model then extracts relevant features with substantial weight values for building the model, which are subsequently combined with users’ features to form the training dataset. To improve efficiency, the optimized ClusterCentroids are used for undersampling.
(3) By comparing with other machine models and neural network algorithms in terms of prediction accuracy, stability, and algorithmic time consumption, it is determined that the XGBoost model provided the best performance on the test dataset. This provides a solid foundation for the practical application of the model. With this approach, we were able to realize multi-feature fusion and automatic feature extraction for predicting user purchase behavior.
The XGBoost prediction model is capable of effectively generating representative user label features that compensate for the lack of user value features in the original dataset, thereby enhancing the interpretability of the feature datasets. Furthermore, through feature selection, a large number of features with low weight influence are filtered out, optimizing the consumption and cost of model training while simplifying the dataset. At the same time, the XGBoost prediction algorithm exhibits excellent performance with an accuracy rate consistently above 95%, displaying exceptional stability and operating with a short algorithm execution time.
The remainder of the paper is organized as follows: The related work is introduced in Section 2. Section 3 describes the paper’s overall model framework and the data preparation. We adopt a multi-feature fusion model (i.e., LDTD) to measure users’ behavior and propose the behavior prediction model in Section 4. The model experiment setup and results comparison are discussed in Section 5. Finally, in Section 6, we summarize the conclusion and future work.

2. Related Works

2.1. Online Purchase Prediction

The prediction of user purchase behavior is integral to optimizing service, marketing, recommendation, and so on. In response, researchers have developed a range of models or analytical techniques to effectively predict users’ purchase decisions [20,21]. Furthermore, recent studies have explored website usability and modeling transaction convergence as predictors of task completion [22]. The authors of [23] have thoroughly examined the capabilities of the online platforms throughout the entire purchase process, closely linking users’ motivations and actions to their utilization of online features. Moreover, various studies have rigorously analyzed customers’ online activities to derive insights into their purchasing behavior [24,25,26]. Additionally, numerous researchers have purposefully mined users’ purchase data using model fusion strategies to achieve greater accuracy in their predictions. To this end, they introduced the user behavior analysis model into association rules for recommendation algorithms so that new user purchase data could accurately predict purchasing trends according to weight rules [27]. To address category imbalance in training data, a strategy that combines random sampling with assigning varying weights to each category has been proposed. The Support Vector Machine (SVM) and Random Forest (RF) algorithms have been successfully integrated using this strategy with impressive results [28].
While purchase intention is important, it does not necessarily correlate with real-life purchase behavior. As such, many studies have utilized actual sales data to accurately understand online purchasing behavior [29]. Moreover, demographic characteristics such as age and gender play a crucial role in determining user activity, with different users ultimately engaging on the same platform in diverse ways [30]. Therefore, it is crucial to consider both user attributes and historical data in predicting customer behavior to attain the most precise results.

2.2. Analytical Methods for Prediction

Over the years, researchers have employed various analytical methods to predict user purchases, resulting in significant improvements in the determination of users’ purchase intentions. Popularly used methods include Decision Trees (DT) [31], Random Forests (RF) [15], and Support Vector Machines (SVM) [32]. While DT and RF are the most widely utilized due to their high interpretability, the DT algorithm can be sensitive to slight variations within the data, making it less reliable than RF [33]. Additionally, compared to neural network-based models, the RF algorithm features fewer hyperparameters for easier adjustment purposes.
Recent studies have demonstrated the widespread utilization of these methods in analyzing extensive and intricate datasets containing numerous dependencies. Koehn [34], for example, leveraged deep learning to predict potential customers’ purchases selection and eventual purchases. The comparative analysis of different methods is shown in Table 1.
For prior purchasing history analysis, the Recency, Frequency, and Monetary (RFM) is a powerful tool for measuring the customers’ value [16], which has been widely used in various customer segmentation fields, such as banking, e-commerce [17,18], etc. We propose a new multi-feature fusion method, LDTD, based on RFM’s idea of integrating three user information indicators, including “login_diff_time” (LDT), “login_time” (LT), and “login_day” (LD), to determine the potential use value of online purchasing.
The XGBoost algorithm [19] is a powerful gradient tree boosting system optimized to capture complex data dependencies. By utilizing a scalable learning system, it is capable of effectively learning and acquiring models from large datasets. Within the XGBoost framework, several innovative algorithms, such as approximate greedy search and parallel learning, are employed to improve learning outcomes and avoid overfitting. By enhancing the gradient boosting machine (GBM) with sophisticated features, the XGBoost algorithm offers an efficient, flexible, and portable means of providing a gradient-boosted decision tree [34].
In summary, most previous studies have analyzed the impacts of engagement attributes of platforms, user behavior, and customer characteristics on purchase intentions, but all separately. It is crucial to investigate the relationship between these factors and online behavior. Our aim is to address these gaps and gain insights into users’ purchasing behavior by promoting meaningful engagement, with the goal of accurately predicting their purchase intentions.

3. Overall Framework and Data Preparation

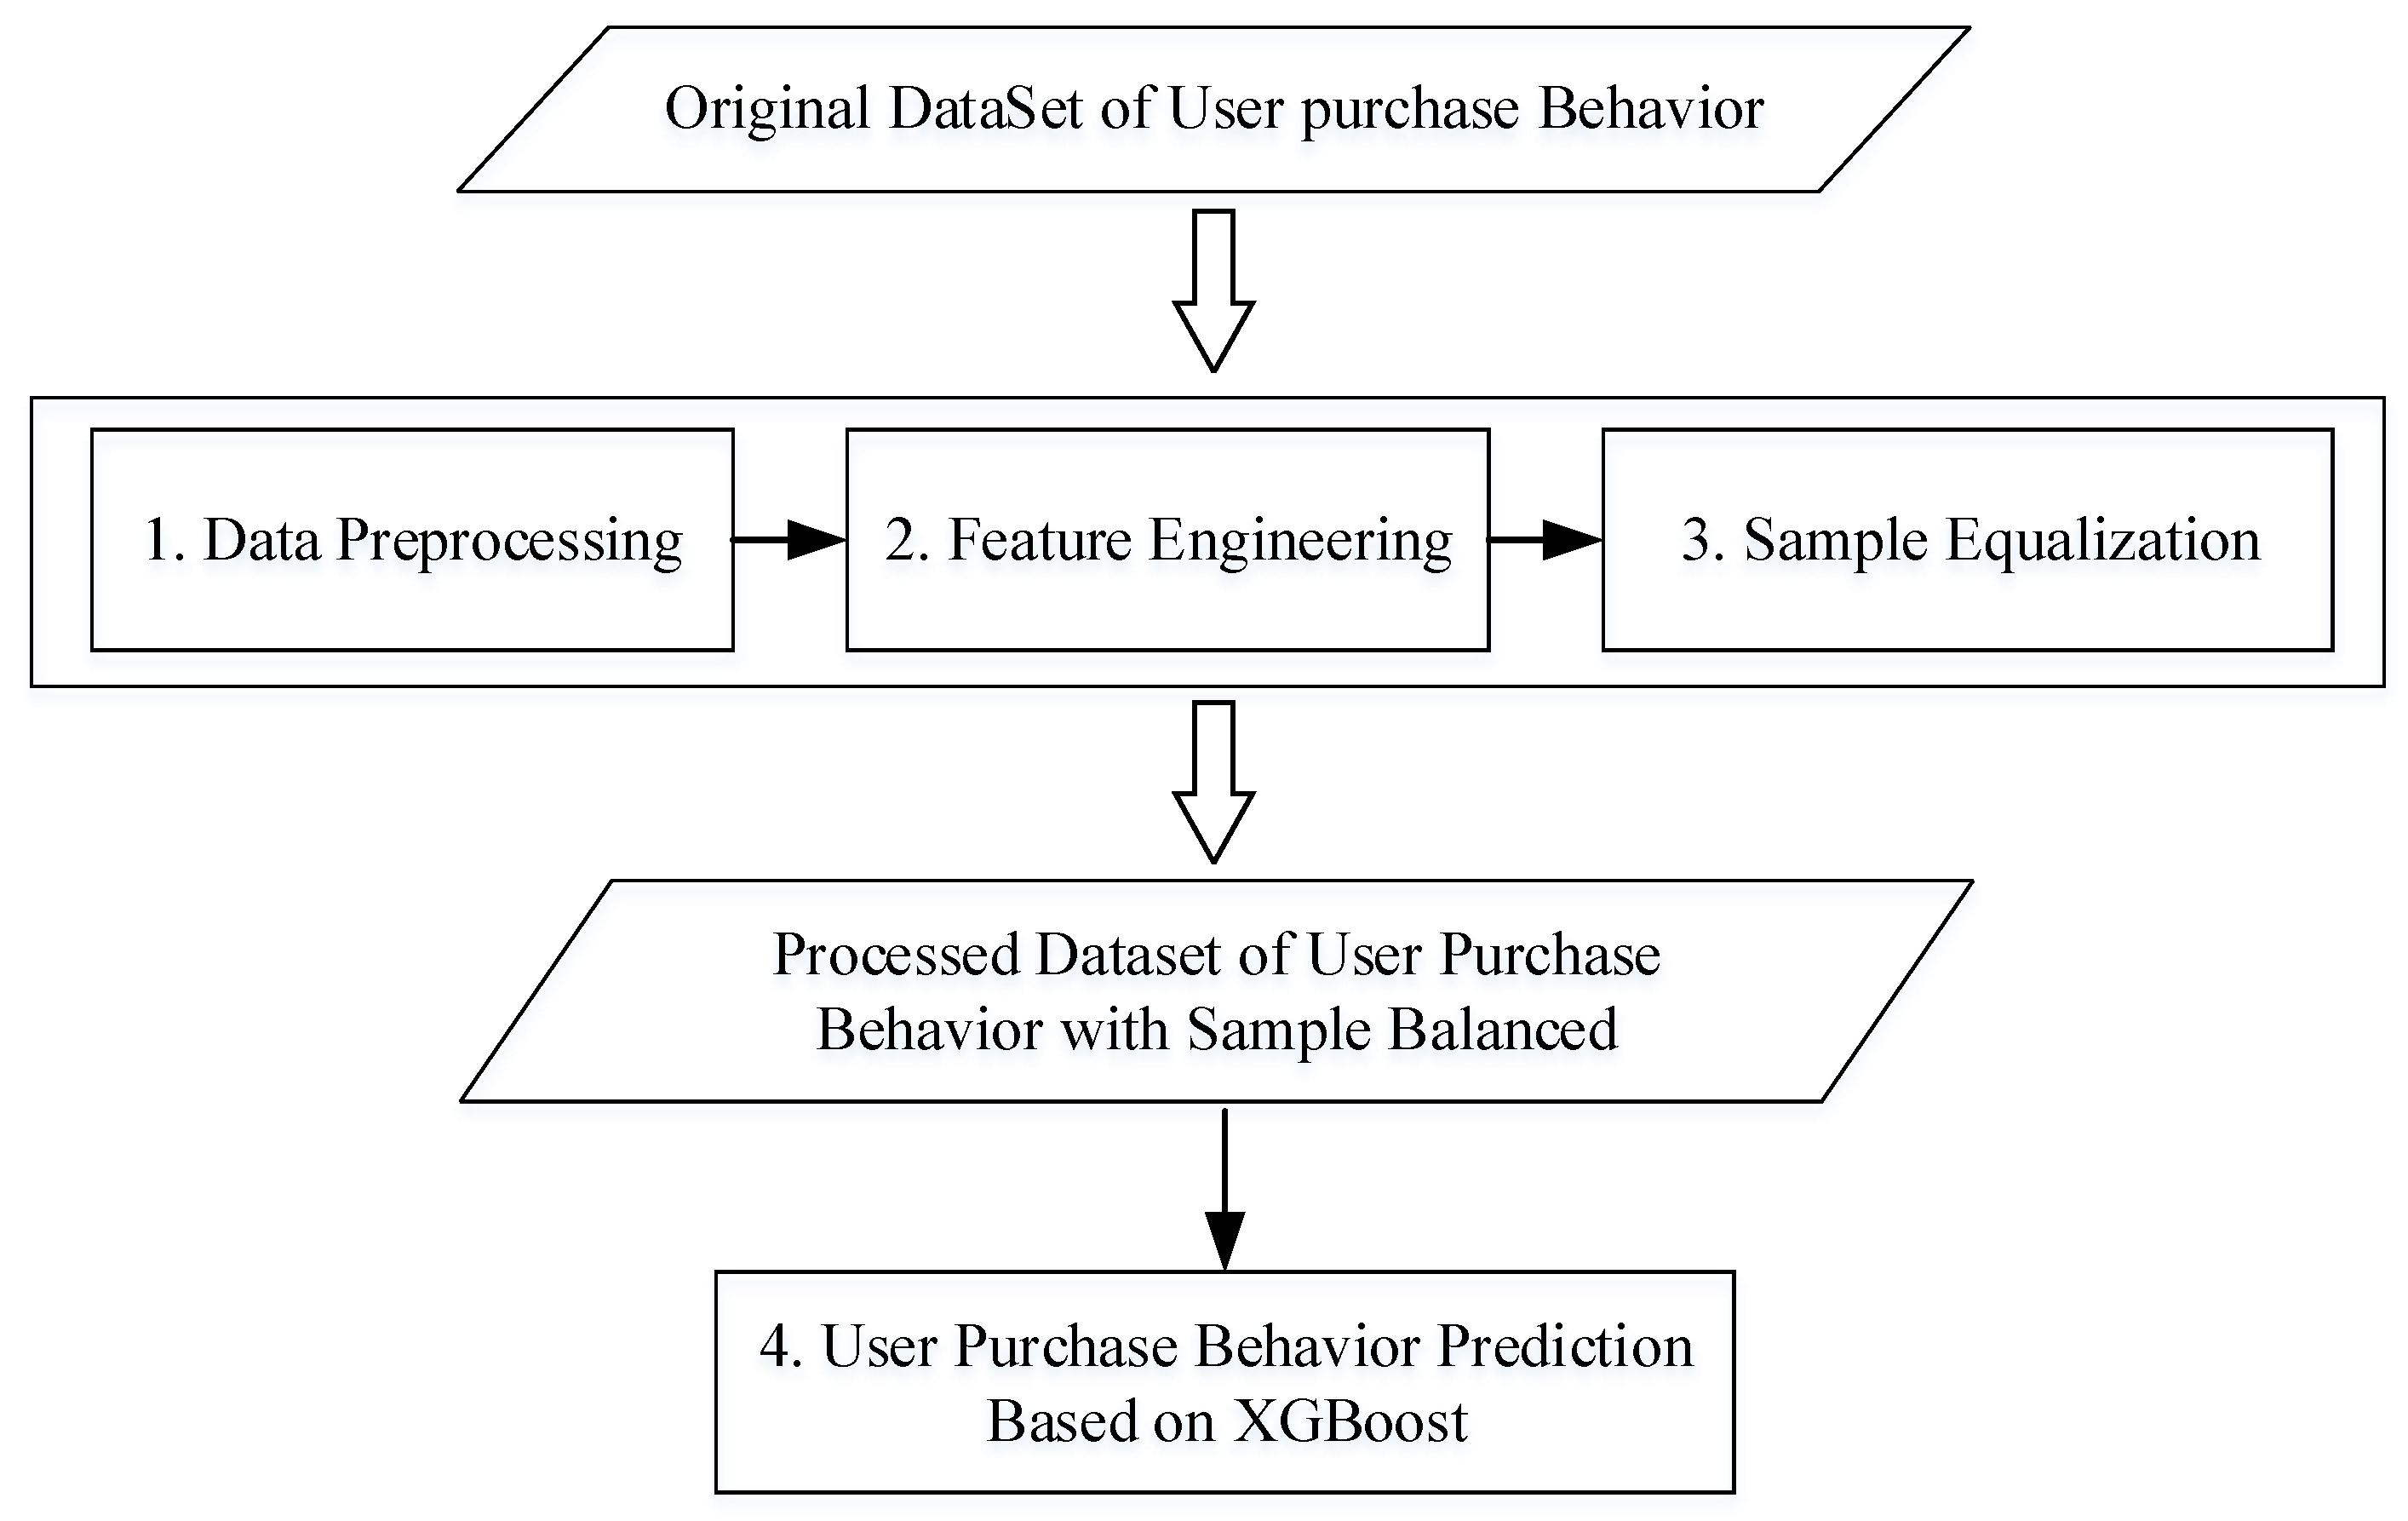
3.1. Overall Framework

In this paper, we construct a user purchase behavior prediction model using XGBoost and multi-feature fusion LDTD. We begin by preparing the original dataset of user purchase behavior through various processes, such as data preprocessing, feature engineering, and sample equalization, resulting in a balanced user purchase behavior dataset. The overall framework is illustrated in Figure 1.
(1) Data preprocessing: The missing or abnormal user behavior data was removed, such as those with inaccurate age or city information.
(2) Feature Engineering: We extracted a subset of the feature data to create a user feature dimension dataset. Then, utilizing a new feature fusion model called LDTD (in Section 4.1), we fused these features together again to generate user tag features. Additionally, we combined these features with the weighted features of the original dataset, which were extracted using XGBoost feature importance selection (Section 4.2), resulting in a user purchasing behavior dataset.
(3) Sample Equalization: As the overall user behavior dataset may appear unbalanced, a sampling method is needed. We opted for the optimized ClusterCentroids undersampling method to address the issue of an unbalanced dataset.
(4) User purchase behavior prediction based on XGBoost: Several metrics were used to evaluate the model’s performance. Precision and recall were used to assess the majority and minority classes, respectively. The F1 score and receiver operating characteristic (ROC) are calculated to measure the prediction accuracy. After considering various parameters, the XGBoost model with optimal parameters outperformed other purchasing behavior classification algorithms.

3.2. Dataset Description

Data quality is a challenge in the big data analysis of user purchase prediction. Recent research indicates that analyzing user purchase data results in more significant findings [35]. To address this concern, we obtained the purchase behavior dataset from the 2021 national data statistics and analysis competition for college students [36]. The dataset includes historical purchase behavior data for 135,618 users and four forms of information: user basic information, user login information, user purchase behavior information, and whether to purchase information.
The user’s basic information comprises eight fields, including user ID, city, and age. The user login information consists of sixteen fields, such as user login days, login interval, and login duration. In addition, the user purchase behavior information includes 26 fields of information, such as the number of user visits and the number of coils. The purchase information only contains two fields: user ID and purchase judgment. Examples of the data structure are shown in Table 2.

3.3. Dataset Processing and Feature Engineering

The data processing of user behavior is listed as follows:
(1) Data preprocessing: The user_info file was read to determine that the app has a total of 135,968 users, with 8 recorded information fields including “user_id”, “first_order_time”, “first_order_price”, “age_month”, “city_num” (city), “platform_num” (device), “model_num” (mobile phone model), and “app_num” (APP activation). Upon preliminary browsing, it was discovered that 3001 users had age outliers and 28,621 users had missing or outlier data related to “city”. In order to eliminate false age values, a normal age range of 0–99 years old was established, resulting in a total of 132,967 valid age values. Moreover, after removing missing or abnormal user information related to “city”, 131,581 user behavior data entries remained.
(2) Feature Engineering: When dealing with large datasets, traditional machine learning models cannot effectively handle a large number of original data features. This situation can result in a dimensional disaster where more features cause data sparsity and worse classification effects for the classifier. To overcome this issue, we used feature extraction to condense the original features and fuse them to construct new user label features. After including the data features, it was crucial to filter out any features that were too large to avoid dimensional disasters caused by oversized features. Therefore, we employed the XGBoost feature importance algorithm to filter the features, extracting only those with a significant influence on the model’s performance. Therefore, the XGBoost feature importance algorithm is utilized to filter the features, and the features with greater weight influence are extracted as modeling features, as shown in Figure 2, and the model feature dataset is then formed by combining the user label features.
(3) Sample equalization: In user browsing behavior data, only a small percentage is associated with purchasing behavior. This leads to a significant imbalance in the overall data between purchased and non-purchased samples, which can have a detrimental effect on the prediction accuracy of the model. To address this issue, sampling methods such as random oversampling and random undersampling have been widely used [33]. However, in situations where data samples are extremely unbalanced, oversampling algorithms like SMOTE and ADASYN can generate noisy samples and lead to overfitting in trained XGBoost models due to the large number of repeated purchasing behavior data points generated. In comparison, undersampling is often considered a suitable approach for this situation. Therefore, we adopted the optimized ClusterCentroids undersampling technique, which replaces the majority class cluster with the ClusterCentroids obtained using the K-Means algorithm. The ClusterCentroids algorithm fits a K-Means model with N clusters to the majority class, and then uses the coordinates of the N ClusterCentroids as new majority samples, resulting in the retention of N majority samples.

4. Multi-Feature Fusion User Value Based on the XGBoost Model

4.1. Multi-Feature Fusion User Value Model (LDTD)

The RFM model is often used to measure user value and user innovation ability, which evaluates user behavior from three dimensions: the most recent consumption (Recency), the consumption frequency (Frequency), and the consumption amount (Monetary) [17].
However, the above three metrics defined by the original RFM model are insufficient for capturing online purchase behavior and information. Therefore, directly applying the RFM model may not be suitable for predicting customer purchase intentions in this paper. Instead, we identified user account information as a valuable resource and selected three online behavior indicators, including “login_diff_time” (LDT), “login_time” (LT), and “login_day” (LD), to construct a new model called the LDTD model. Setting these features expresses a certain degree of user dependence. These features represent a certain level of user dependence on the platform, and their extraction enables one to comprehend the user’s degree of engagement with the platform and determine if they are a high-value user. By identifying customers who meet certain behavioral criteria, one can easily infer whether they are strongly inclined towards making purchases online. The processing is shown in Figure 3.
Regarding the LDTD model, scoring across different dimensions is a crucial process. The assigned scores and their corresponding meanings are generally based on actual feature interpretation and data size. For specifics on LDTD metrics scoring, please refer to Table 3, Table 4 and Table 5.
Based on the user dimension matrix, all users can be represented by the three-dimensional data of LDT, LT, and LD. As a result, a user division basis table has been included in Table 6 to illustrate the interpretation of these three-dimensional features.
Figure 4 displays the user division results for all classifications. The x-axis represents the eight user types, the y-axis shows the quantity, and the line depicts the proportion of each classification in descending order. As seen in Figure 4, LU has the largest number of users, while GVU carries the smallest weight among all categories.

4.2. XGBoost Feature Importance Selection Algorithm

XGBoost employs a structure score for each feature to calculate the segmentation point. Moreover, the importance of each feature is measured by its summation of occurrences throughout all decision trees. The more a feature is used to partition the structure, the more important it is considered. The XGBoost algorithm for feature importance is presented as Algorithm 1.
Algorithm 1: XGBoost feature importance algorithm
Input:
D : the original historical data of set;
XGBoost parameters: max_depth, n_estimators, learning_rate, nthread, subsample, colsample_bytree, min_child_weight, seed
Output:
D filtered feature history data;
1. import XGBClassifier
2. D a t a s e t = D ;
3. m o d e l = XGBClassifier();
4. p a r a m s = {‘max_depth’, n_estimators’, ‘learning_rate’, ‘nthread’, ‘subsample’,
‘colsample_bytree’, ‘min_child_weight’, ‘seed’};
5. X G B f e a t u r e = XGB.train(params, Dataset, num_boost_round=1);
6. for importance_type in (‘weight’, ‘gain’, ‘cover’, ‘total_gain’, ‘total_cover’):
7.      print(importance_type,
                 X G B f e a t u r e .get_score(importance_type=importance_type));
8. end
9. m o d e l .fit(X_train, y_train);
10. plot_importance( m o d e l );
11. select X G B f e a t u r e in D ;
12. return D ;
Compared to other well-known feature selection algorithms, the above Algorithm 1, based on RFM’s idea, can better select the most relevant features. By combining different features, the accuracy and robustness of the algorithm are improved while increasing the speed of model training and iteration.

4.3. Prediction Principle of the XGBoost Algorithm

XGBoost is developed based on GBDT with improvements to create a more powerful algorithm applicable in a wider range of applications. In contrast with Random Forest, which assigns equal voting weights to each decision tree, subsequent tree generation and training in XGBoost depend on previous training and prediction outcomes. The model’s accuracy is improved by assigning higher learning weights to previously misclassified samples. Compared to other ensemble learning algorithms, XGBoost introduces regularization terms and column sampling to improve model robustness. Additionally, parallelization is used when choosing split points for each tree, resulting in significantly faster model execution times. The XGBoost algorithm allocates a corresponding leaf node for each feature of the sample in every generated decision tree, and all the leaf nodes associated with the specific feature will have their respective weights. Eventually, the predicted value of this sample will be calculated by adding up the weights of all the corresponding leaf nodes from each tree. [20].
In addition, XGBoost has multiple methods to optimize the model. Due to its good generalization performance, XGBoost has been widely used in the field of algorithm prediction in recent years. The algorithm of the XGBoost prediction model is shown in Algorithm 2.
Algorithm 2: XGBoost prediction model algorithm
Input:
     D :  the training dataset;
     D :  the test dataset;
Output:
     t e s t _ p r e d i c t : result;
XGBoost prediction parameters:

learning_rate, n_estimators, max_depth, subsample, min_child_weight,

colsample_bytree, gamma, reg_alpha, reg_lambda;
1. import XGBClassifier;
2. train = D ;
3. test = D ;
4. train = ClusterCentroids( D );
5. load the adjusted parameters to params;
6. XGBfeature = XGB.train(params, D , num_boost_round =1);
7. XGBfeature.fit(train, test);
8. test_predict = clf.predict(test);
9. return test_predict;

5. Model Experiment and Comparison

5.1. Experimental Environment and Performance Metrics

The configurations of the experimental environment are listed in Table 7.
Performance measurement aims to evaluate the generalization ability during the learning phase. The most commonly used metrics for this purpose include precision and recall.
Precision and recall are versatile detection values used for evaluating the performance of applications. In binary classification problems, the combination of the actual category and prediction category by the algorithm can be classified into four cases: true positive (TP), false positive (FP), true negative (TN), and false negative (FN). The precision P is defined as:
P = T P T P + F P
The recall R’s is defined as follows:
R = T P T P + F N
F1 score considers both precision P and recall R, and is measured as shown below:
F 1 = 2 × P × R P + R = 2 × T P A L L + T P T N
where ALL is the total number of samples.
In addition, we utilized the receiver operating characteristic curve (ROC curve) to quantify the prediction accuracy. The vertical axis of the ROC curve is the true positive rate (referred to as TPR), and the horizontal axis is the false positive rate (referred to as FPR). The two are respectively defined as:
T P R = T P T P + F N
F P R = F P T N + F P

5.2. Experimental Results and Analysis

Firstly, the original dataset is sorted by the importance of XGBoost features. The first seven features with the most influential weights are selected to combine with user label features. The XGBoost feature importance ranking is shown in Figure 5.
To verify the reliability of the model predictions, we compare the XGBoost prediction model with four other models, including KNN, SVM, Random Forest, and BP Neural Network. The parameter settings are shown in Table 8.
To obtain a more reliable and robust evaluation of the model’s performance, we repeated the experiments ten times and considered the average of precision, recall, F1, and ROC values as the final result of the model. The corresponding comparison results are clearly presented in Table 9.
It is obvious that the XGBoost model obtained the highest F1 value. This is mainly because the XGBoost algorithm expands the loss function with Taylor’s second order and considers its second derivative, proposing an approximate algorithm. This algorithm can greatly improve the learning rate when the training dataset has a wide range of scales and pre-pruned decision trees by adding a regular coefficient to the loss function.
To verify the stability of the XGBoost model more intuitively, the F1 score from 10 different tests of five models was analyzed using a histogram, as shown in Figure 6.
Furthermore, the changes in precision and recall accuracy of five models are presented in Figure 7. It can be seen that the score of XGBoost is significantly higher and more stable than other model algorithms, with the model score rate consistently above 0.95. This is due to the unique block structure of the XGBoost algorithm and its support for column sampling, both of which can effectively reduce overfitting while also enhancing computational efficiency.
The false-positive curve (FP) is illustrated in Figure 8, which shows that the XGBoost algorithm has the lowest FP, while the KNN and SVM obtain the highest FP. KNN lacks assumptions about data and is not very good at classifying when sample feature deviations are not obvious, whereas SVM has no general solution to nonlinear problems and inaccurate kernel functions lead to low accuracy. In contrast, XGBoost adds a regular term to the cost function to control model complexity, making it more effective for diverse data with different value attributes while also improving overall accuracy. Specifically, the regular term in XGBoost includes the number of leaf nodes within the tree and the sum of the squares of the L2 moduli of the scores outputted on each leaf node. From the perspective of the bias-variance tradeoff, this regular term helps reduce model variance by simplifying the learned model and preventing overfitting.
In addition to excellent stability, it is also necessary to compare the training time of the model. The time consumption of a good model algorithm should be as low as possible. The training time of each model is shown in Figure 9, where the unit of time is a second.
As indicated in Figure 9, XGBoost requires significantly less time to achieve a cross-validation score of over 95% compared to the RF algorithm, which sometimes takes four times longer to attain a 90% accuracy rate. The BPNN algorithm needs multiple iterations, resulting in prolonged reverse transmission residual time and thus a linear relationship between computation time and data size. The SVM algorithm also exhibits sluggishness when working with massive amounts of data. While KNN can produce quick results, its performance falls significantly short compared to the advanced capabilities of XGBoost. XGBoost can sort the eigenvalues in advance and supports parallel computing, greatly reducing the training time. The analysis of model stability and algorithm time consumption shows that the prediction model based on the XGBoost algorithm established in this paper performs better in terms of instability and algorithm time consumption.

6. Conclusions

A user purchase behavior prediction model based on multi-feature fusion and XGBoost is proposed in the paper. To enhance the predictive capabilities of the model compared to existing models, user tag features are added to enrich the user behavior feature set. The XGBoost feature importance algorithm is then implemented to select the most significant features, leading to improved accuracy and stability in predicting user purchase behavior and a reduction in training time for the feature model. In addition, the ClusterCentroids undersampling sample equalization algorithm effectively addresses the issue of extreme imbalance between e-commerce purchase and non-purchased e-commerce behavior samples, further improving the accuracy of the XGBoost prediction model.
In the future, we will increase user purchase behavioral data and improve the accuracy of calculating weights for each feature in the sampling process. Additionally, we will consider the initiative and passivity of characteristic behaviors, as well as the impact of major events and holidays on users’ purchasing behavior.

Author Contributions

Conceptualization, W.W. and S.L.; methodology, Y.Y.; software, W.X.; validation, W.W. and W.X.; formal analysis, W.W.; investigation, J.W.; resources and data curation, W.X.; writing—original draft preparation, J.W.; writing—review and editing, L.T. and C.L.; visualization, X.Z.; supervision, Y.Y.; project administration, S.L.; funding acquisition, X.Z. All authors have read and agreed to the published version of the manuscript.

Funding

This research was funded by the National Natural Science Foundation of China (NSFC) under Grant Nos. [62202211] and [71861010], the National Social Science Foundation under Grant No. [19CTJ014]; the Social Science Planning Project in Jiangxi Province (Nos. [21WT17] and [22WT79]); and the Science and Technology Research Project of the Jiangxi Provincial Department of Education (No. [GJJ170234]). The APC was funded by NSFC under Grant No. [62202211].

Institutional Review Board Statement

Not applicable.

Informed Consent Statement

Not applicable.

Data Availability Statement

The data presented in this study are available on request from the corresponding author.

Conflicts of Interest

The authors declare no conflict of interest.

References

  1. Wang, X.F.; Yan, X.B.; Ma, Y.C. Research on user consumption behavior prediction based on improved XGBoost algorithm. In Proceedings of the 2018 IEEE International Conference on Big Data (Big Data), Seattle, WA, USA, 10–13 December 2018; pp. 4169–4175. [Google Scholar]
  2. Wu, H.T.A. Prediction Method of User Purchase Behavior Based on Bidirectional Long Short-Term Memory Neural Network Model. In Proceedings of the 2021 2nd International Conference on Artificial Intelligence and Information Systems, Chongqing, China, 28–30 May 2021; ACM: New York, NY, USA; pp. 1–6. [Google Scholar]
  3. Palattella, M.R.; Dohler, M.; Grieco, A.; Rizzo, G.; Torsner, J.; Engel, T.; Ladid, L. Internet of Things in the 5G Era: Enablers, Architecture, and Business Models. IEEE J. Sel. Areas Commun. 2016, 34, 510–527. [Google Scholar] [CrossRef]
  4. Yao, Y.H.; Yen, B.; Yip, A. Examining the Effects of the Internet of Things (IoT) on E-Commerce: Alibaba Case Study. In Proceedings of the 15th International Conference on Electronic Business (ICEB 2015), Hong Kong, China, 6–10 December 2015; pp. 247–257. [Google Scholar]
  5. Tseng, V.S.; Lin, K.W. Efficient mining and prediction of user behavior patterns in mobile web systems. Informat. Softw. Technol. 2006, 48, 357–369. [Google Scholar] [CrossRef]
  6. Yin, H.Z.; Hu, Z.T.; Zhou, X.F.; Wang, H.; Zheng, K.; Nguyen, Q.V.H.; Sadiq, S. Discovering interpretable geo-social communities for user behavior prediction. In Proceedings of the 2016 IEEE 32nd International Conference on Data Engineering (ICDE), Helsinki, Finland, 16–20 May 2016; pp. 942–953. [Google Scholar]
  7. Sireesha, C.H.; Sowjanya, V.; Venkataramana, K. Cyber security in E-commerce. Int. J. Sci. Eng. Res. 2017, 8, 187–193. [Google Scholar]
  8. Zhang, H.B.; Dong, J.C. Application of sample balance-based multi-perspective feature ensemble learning for prediction of user purchasing behaviors on mobile wireless network platforms. Eurasip J. Wirel. Commun. Netw. 2020, 1, 1–26. [Google Scholar] [CrossRef]
  9. Luo, X.; Jiang, C.; Wang, W.; Xu, Y.; Wang, J.H.; Zhao, W. User behavior prediction in social networks using weighted extreme learning machine with distribution optimization. Future Gener. Comput. Syst. 2019, 93, 1023–1035. [Google Scholar] [CrossRef]
  10. Li, J.; Pan, S.X.; Huang, L.; Zhu, X. A Machine Learning Based Method for Customer Behavior Prediction. Tehnicki Vjesnik Technical Gazette 2019, 26, 1670–1676. [Google Scholar]
  11. Chung, Y.-W.; Khaki, B.; Li, T.; Chu, C.; Gadh, R. Ensemble machine learning-based algorithm for electric vehicle user behavior prediction. Appl. Energy 2019, 254, 113732. [Google Scholar] [CrossRef]
  12. Martínez, A.; Schmuck, C.; Pereverzyev, S.; Pirker, C.; Haltmeier, M. A machine learning framework for customer purchase prediction in the non-contractual setting. Eur. J. Oper. Res. 2020, 281, 588–596. [Google Scholar] [CrossRef]
  13. Fu, X.; Zhang, J.; Meng, Z.; King, I. MAGNN: Metapath Aggregated Graph Neural Network for Heterogeneous Graph Embedding. In Proceedings of the The Web Conference 2020, Taipei, Taiwan, 20–24 April 2020; ACM: New York, NY, USA; pp. 2331–2341. [Google Scholar]
  14. Wen, Y.T.; Yeh, P.W.; Tsai, T.H.; Peng, W.C.; Shuai, H.H.A.-B. Customer purchase behavior prediction from payment datasets. In Proceedings of the 11th ACM International Conference on Web Search and Data Mining, Marina Del Rey, CA, USA, 5–9 February 2018; ACM: New York, NY, USA; pp. 628–636. [Google Scholar]
  15. Gao, X.; Wen, J.H.; Zhang, C. An improved random forest algorithm for predicting employee turnover. Math. Probl. Eng. 2019, 2019, 1–12. [Google Scholar] [CrossRef]
  16. Xu, G.W.; Shen, C.; Liu, M.; Zhang, F.; Shen, W.M. A user behavior prediction model based on parallel neural network and k-nearest neighbor algorithms. Clust. Comput. 2017, 20, 1703–1715. [Google Scholar] [CrossRef]
  17. Gao, H.; Kuang, L.; Yin, Y.; Guo, B.; Dou, K. Mining consuming behaviors with temporal evolution for personalized recommendation in mobile marketing apps. Mob. Netw. Appl. 2020, 25, 1233–1248. [Google Scholar] [CrossRef]
  18. Chen, T.; Guestrin, C. XGBoost: A scalable tree boosting system. In Proceedings of the 22nd ACM SIGKDD International Conference on Knowledge Discovery and Data Mining, San Francisco, CA, USA, 13–17 August 2016; ACM: New York, NY, USA; pp. 785–794. [Google Scholar]
  19. Tian, X.; Qiu, L.; Zhang, J. User behavior prediction via heterogeneous information in social networks. Inf. Sci. 2021, 581, 637–654. [Google Scholar] [CrossRef]
  20. Hughes, A.M. Strategic Database Marketing: The Masterplan for Starting and Managing a Profitable, Customer-Based Marketing Program, 3rd ed.; McGrawHill Companies: New York, NY, USA, 2005. [Google Scholar]
  21. Chiang, W.Y. To mine association rules of customer values via a data mining procedure with improved model: An empirical case study. Expert Syst. Appl. 2011, 38, 1716–1722. [Google Scholar] [CrossRef]
  22. Hu, Y.H.; Yeh, T.W. Discovering valuable frequent patterns based on RFM analysis without customer identification information. Knowl. Based Syst. 2014, 61, 76–88. [Google Scholar] [CrossRef]
  23. Song, P.; Liu, Y. An XGBoost algorithm for predicting purchasing behaviour on E-commerce platforms. Tehnički Vjesn. 2020, 27, 1467–1471. [Google Scholar]
  24. Xu, J.; Wang, J.; Tian, Y.; Yan, J.; Li, X.; Gao, X. SE-stacking Improving user purchase behavior prediction by information fusion and ensemble learning. PLoS ONE 2020, 15, e0242629. [Google Scholar] [CrossRef]
  25. Kagan, S.; Bekkerman, R. Predicting purchase behavior of website audiences. Int. J. Electron. Commer. 2018, 22, 510–539. [Google Scholar] [CrossRef]
  26. Venkatesh, V.; Agarwal, R. Turning visitors into customers: A usability-centric perspective on purchase behavior in electronic channels. Manag. Sci. 2006, 52, 367–382. [Google Scholar] [CrossRef]
  27. Close, A.G.; Kukar-Kinney, M. Beyond buying: Motivations behind consumers’ online shopping cart use. J. Bus. Res. 2010, 63, 986–992. [Google Scholar] [CrossRef]
  28. Brown, M.; Pope, N.; Voges, K. Buying or browsing? An exploration of shopping orientations and online purchase intention. Eur. J. Mark. 2002, 37, 1666–1684. [Google Scholar] [CrossRef]
  29. Olbrich, R.; Holsing, C. Modeling consumer purchasing behavior in social shopping communities with clickstream data. Int. J. Electron. Commer. 2011, 16, 15–40. [Google Scholar] [CrossRef]
  30. Chaudhuri, N.; Gupta, G.; Vamsi, V.; Bose, I. On the platform but will they buy? Predicting customers’ purchase behavior using deep learning. Decis. Support Syst. 2021, 149, 113622. [Google Scholar] [CrossRef]
  31. Quinlan, J.R. Induction of decision trees. Mach. Learn. 1986, 1, 81–106. [Google Scholar] [CrossRef]
  32. Drucker, H.; Surges, C.J.; Kaufman, L.; Smola, A.; Vapnik, V. Support vector regression machines. In Proceedings of the Advances in Neural Information Processing Systems (9’NIPS), Denver, CO, USA, 3–5 December 1997; pp. 155–161. [Google Scholar]
  33. Ge, S.L.; Ye, J.; He, M.X. Prediction Model of User Purchase Behavior Based on Deep Forest. Comput. Sci. 2019, 46, 190–194. [Google Scholar]
  34. Koehn, D.; Lessmann, S.; Schaal, M. Predicting online shopping behaviour from clickstream data using deep learning. Expert Syst. Appl. 2020, 150, 113342. [Google Scholar] [CrossRef]
  35. Hu, X.; Huang, Q.; Zhong, X.; Davison, R.M.; Zhao, D. The influence of peer characteristics and technical features of a social shopping website on a consumer’s purchase intention. Int. J. Inf. Manag. 2016, 36, 1218–1230. [Google Scholar] [CrossRef]
  36. Saikr. Available online: https://www.saikr.com/c/nd/7844 (accessed on 4 May 2022).
Figure 1. Overall framework.
Electronics 12 02047 g001
Figure 2. Building a user purchase behavior prediction dataset.
Electronics 12 02047 g002
Figure 3. Multi-feature fusion model based on LDTD.
Electronics 12 02047 g003
Figure 4. User division result.
Electronics 12 02047 g004
Figure 5. XGBoost feature importance ranking.
Electronics 12 02047 g005
Figure 6. F1 change curves of five models.
Electronics 12 02047 g006
Figure 7. Precision and recall accuracy change curves for five models.
Electronics 12 02047 g007
Figure 8. False-positive change curves of five models.
Electronics 12 02047 g008
Figure 9. The training times of five models.
Electronics 12 02047 g009
Table 1. Comparative analysis of different models.
Model CategoryAdvantagesDisadvantages
Decision Tree (DT)1. Easy to understand and interpret.
2. Can handle discrete and continuous data.
1. Prone to overfitting, especially when the tree depth is large.
2. Lacks global optimization exploration.
Random Forest (RF)1. Reduces overfitting by constructing multiple trees on subsets of the data and averaging them.
2. Provides estimates of feature importance for a better understanding of the data.
1. Needs to tune hyperparameters for good performance.
2. Interpretability can be difficult when examining the specific interaction effects of different features.
Support Vector Machines (SVM)1. Can handle large feature sets and complex data patterns.
2. Effective in small sample sizes and in noisy datasets.
1. Becoming less efficient as the number of features increases.
2. Large datasets may require a lot of time and computational power during training and prediction, making them less practical for larger-scale problems.
Recurrent Neural Network (RNN)1. Has a memory component, making it effective for modeling sequential data.
2. Can handle variable-length sequences of data, making it suitable for handling time-series data.
1. The models can be computationally expensive to train due to their recurrent nature.
2. Tends to suffer from exploding gradients during backpropagation, making training difficult.
eXtreme gradient boosting (XGBoost)1. Highly accurate and often outperforms other algorithms on structured or unstructured datasets.
2. Has built-in regularization to prevent overfitting and can automatically identify and prune unimportant features.
1. Training a model on small datasets may lead to overfitting as the boosting process is less effective.
2. Can be sensitive to noisy or irrelevant inputs, leading to suboptimal performance.
Table 2. Examples of key table structures.
TableColumnMeaning
user_infoUser_id
first_order_time
first_order_price
age_month
user_info city_num
platform_num
model_num
app_num
5
Uniform
1
30
1
2
3
4
login_dayUser_id
login_diff_time
distance_day
login_time
launch_time
chinese_subscribe_num
math_subscribe_num
add_friend
add_group
camp_num
learn_num
add_friend
add_group
study_num
coupon
course_order_num
5
Uniform
1
30
1
2
3
4
1
2
3
4
2
3
3
4
Table 3. Login_diff_time dimension scoring table.
LDT ScoresLDT ValueMeaning
1[30, 135)Over one month up to four and a half months without login.
2[10, 30)Over 10 days up to one month without login.
3[3, 10)Over 3 days up to 10 days without login.
4[1, 3)Over 1 day up to 3 days without login.
5[0, 1)Logged into the website within 1 day.
Table 4. Login_time dimension scoring table.
LT ScoresLT ValueMeaning
1[0, 1)The login duration is less than 1 day.
2[1, 10)The login duration is longer than 1 day and less than 10 days.
3[10, 30)The login duration is longer than 10 days and less than 30 days.
4[30, 365)The login duration is longer than 30 days and less than 365 days.
5[365, --)The login duration is longer than 1 year.
Table 5. Login_day dimension scoring table.
LD ScoresLT ValueMeaning
1[0, 1)The login days are not more than 1 day.
2[1, 3)The login days are more than 1 day and less than 3 days.
3[3, 5)The login days are more than 3 days and less than 5 days.
4[5, 10)The login days are more than 5 days and less than 10 days.
5[10, 120)The login days are more than 10 days and less than 120 days.
Table 6. Login_day dimension scoring table.
LDTLTLDTraditional ClassificationImproved ClassificationDescription
111Valuable usersValuable users (VU)Frequent login, long duration, and many days.
110Important potential usersConsumption potential users (CPU)Frequent login, long duration, and few days.
101Important training usersDeep ploughing users (DPU)Frequent login, short time, and many days.
100new userPotential users (PU)Frequent login, short time, and few days.
011Important lost usersLoss of important value users (LIVU)Not logged in for a long time and for many days.
010General userGeneral value users (GVU)Not logged in recently, for a long time, and for a few days.
001Loss of Important value usersLoss of Important value usersNot logged in recently, for a short time, and for many days.
000Lost usersLost users (LU)Not logged in recently, for a short time, and for a few days.
111Important potential usersImportant potential users (LPU)Frequent login, long duration, and few days.
Table 7. The environment of simulation.
Configuration
CPU
Running Memory
Operating System
Coding Language
Scikit-learn version
Compiler Environment
Intel(R) Core(TM)i7-7700HQ
16.0 GB
Windows 10
Python version 3.7.6
1.0.2
PyCharm Community Edition 2020.1.3 x64
Table 8. Important parameter settings of machine learning algorithms.
Model CategoryMain ParametersValue
KNNSelected neighbors
Predicted weight function
Nearest neighbor algorithm
Leaf size
Vector distance algorithm
5
Uniform
Ball-tree
30
Euclidean distance
SVMPenalty coefficient
Use contraction heuristics
Multi-class fusion strategy
Kernel function
1
True
Ovr
Rbf
Random forestNumber of decision trees
Split criterion
Maximum depth of the decision tree
Splitting an internal node requires a small number of samples
100
Gini
13
120
BP Neural NetworkActivation function
Solver
Learning rate
Maximum number of iterations
Number of hidden layer neurons
Relu
Adam
0.0001
400
128 + 64
XGBoostLearning rate
Base classifier
Maximum depth of the decision tree
Number of decision trees
0.3
Gbtree
6
100
Table 9. Comparison of prediction models’ precision, recall, F1, and ROC values.
Model CategoryF1RecallPrecisionROC
KNN0.86800.86810.86880.8679
SVM0.87450.87460.87530.8745
Random Forest0.89780.89780.89800.8978
BP Neural Network0.89300.89300.89320.8931
XGBoost0.97610.97610.97630.9768
Explanation: the value with bold and underline is the best for each metric.
Disclaimer/Publisher’s Note: The statements, opinions and data contained in all publications are solely those of the individual author(s) and contributor(s) and not of MDPI and/or the editor(s). MDPI and/or the editor(s) disclaim responsibility for any injury to people or property resulting from any ideas, methods, instructions or products referred to in the content.

