3.1. Principle of the Method
Let
. When the radar and the target meet the far-field conditions, i.e.,
,
, then Formula (1) can be expressed as follows:
During the CSAR movement, the incident angle
of the beam remains unchanged. Substituting Formula (6) into Formula (2) yields the following:
where
represents the position tracking of target point P in the echo after range compression. When point P is located at the center of the scene, Formula (7) can be expressed as follows:
Here, the position trajectory of the target is constant; that is, the trajectory of the center point of the scene will not change with a position change in the SAR platform after the target range is compressed. Next, ignore the change in the scattering coefficient for target . Except for the central point of the scene, the trajectories of all other target points have the characteristics of a sinusoidal curve change, and the change frequency is , which is consistent with the CSAR motion platform. The amplitude of oscillation is , which is related to the bandwidth of the radar signal , the distance between the target point and the center of the scene , and the incident angle of the radar beam . When the CSAR observation geometry is determined, the amplitude of the sinusoidal change in the trajectory of a fixed-point target is only related to . The larger is, the greater the amplitude of sinusoidal oscillation becomes. The initial phase is , which is the inversion of the azimuth angle of the target point.
When there are multiple targets located at different positions and azimuth angles in the scene, the range-compressed echoes form multiple sinusoidal curves that have the same frequency, different amplitudes, and different initial phases. These sinusoids overlap each other with the locus of the central point of the scene as the symmetrical center . By detecting the sinusoidal curve of range-compressed CSAR echo data along the azimuth direction, the position of the target in the scene can be extracted, and 2D imaging of the scene can be realized.
IRT can accumulate and focus the sinusoidal curve in the image, transforming it into a point on the imaging plane [
12]. Ignoring the changes to
, the scattering coefficient of the target and the sine change track of the ideal point target echo after distance compression is as follows:
The IRT of
is as follows:
where
and
. When the height of the imaging plane is consistent with the actual size of the target, that is
, a sine curve in the range-compressed echo signal is transformed into a point
in the imaging plane
after IRT, and the relationship between the amplitude
and initial phase
of the point corresponding to the original sine curve and the point coordinates is as follows:
The IRT of the compressed echo of the N ideal point target distance is:
The height of the imaging plane is inconsistent with the actual height of the target; that is,
. Based on CSAR confocal 3D imaging theory [
13], only when the imaging height is consistent with the target height can the target on the 2D image be accurately focused; On the contrary, at other imaging heights, the target on the 2D image will be defocused into a circle, and the radius of the circle has a linear relationship with the deviation between the imaging height and the target height. Then, the sine curve is transformed into a circle in the imaging plane
by IRT, and the relationship between the radius of the circle
and the height deviation
can be defined as follows:
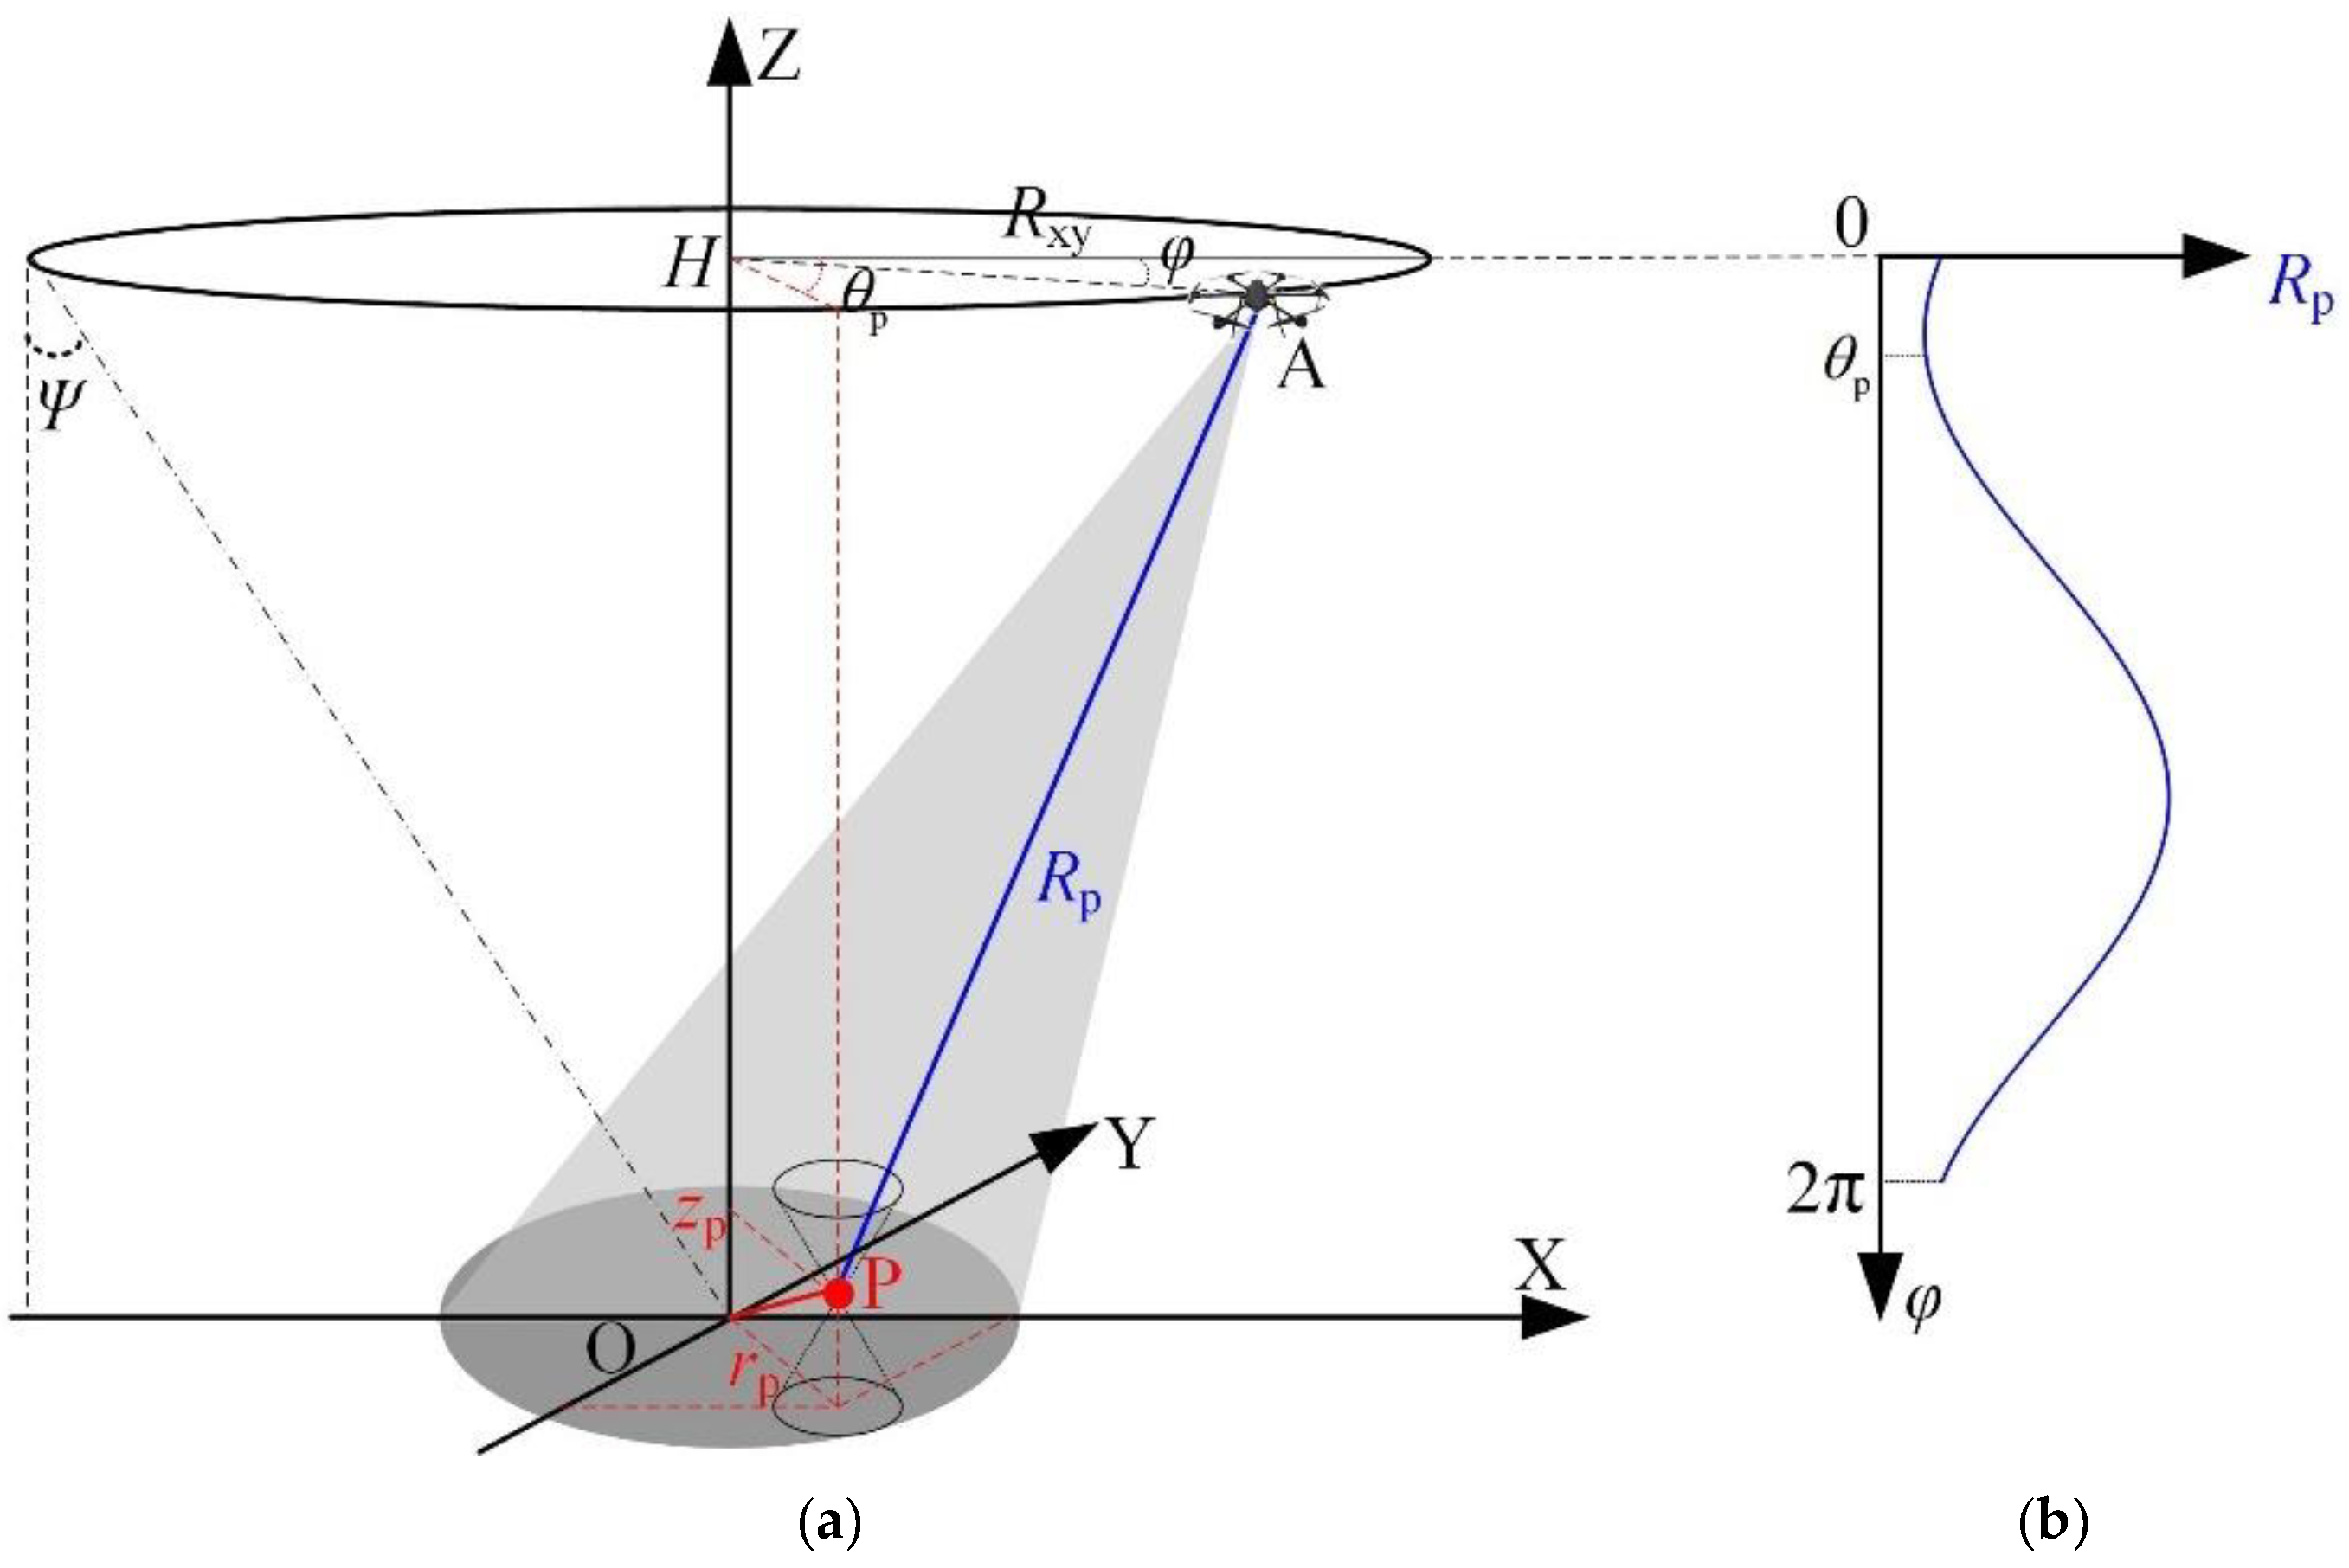
In CSAR imaging mode, the incident angle
is constant, and the relationship between the radius of the circle
and the height deviation
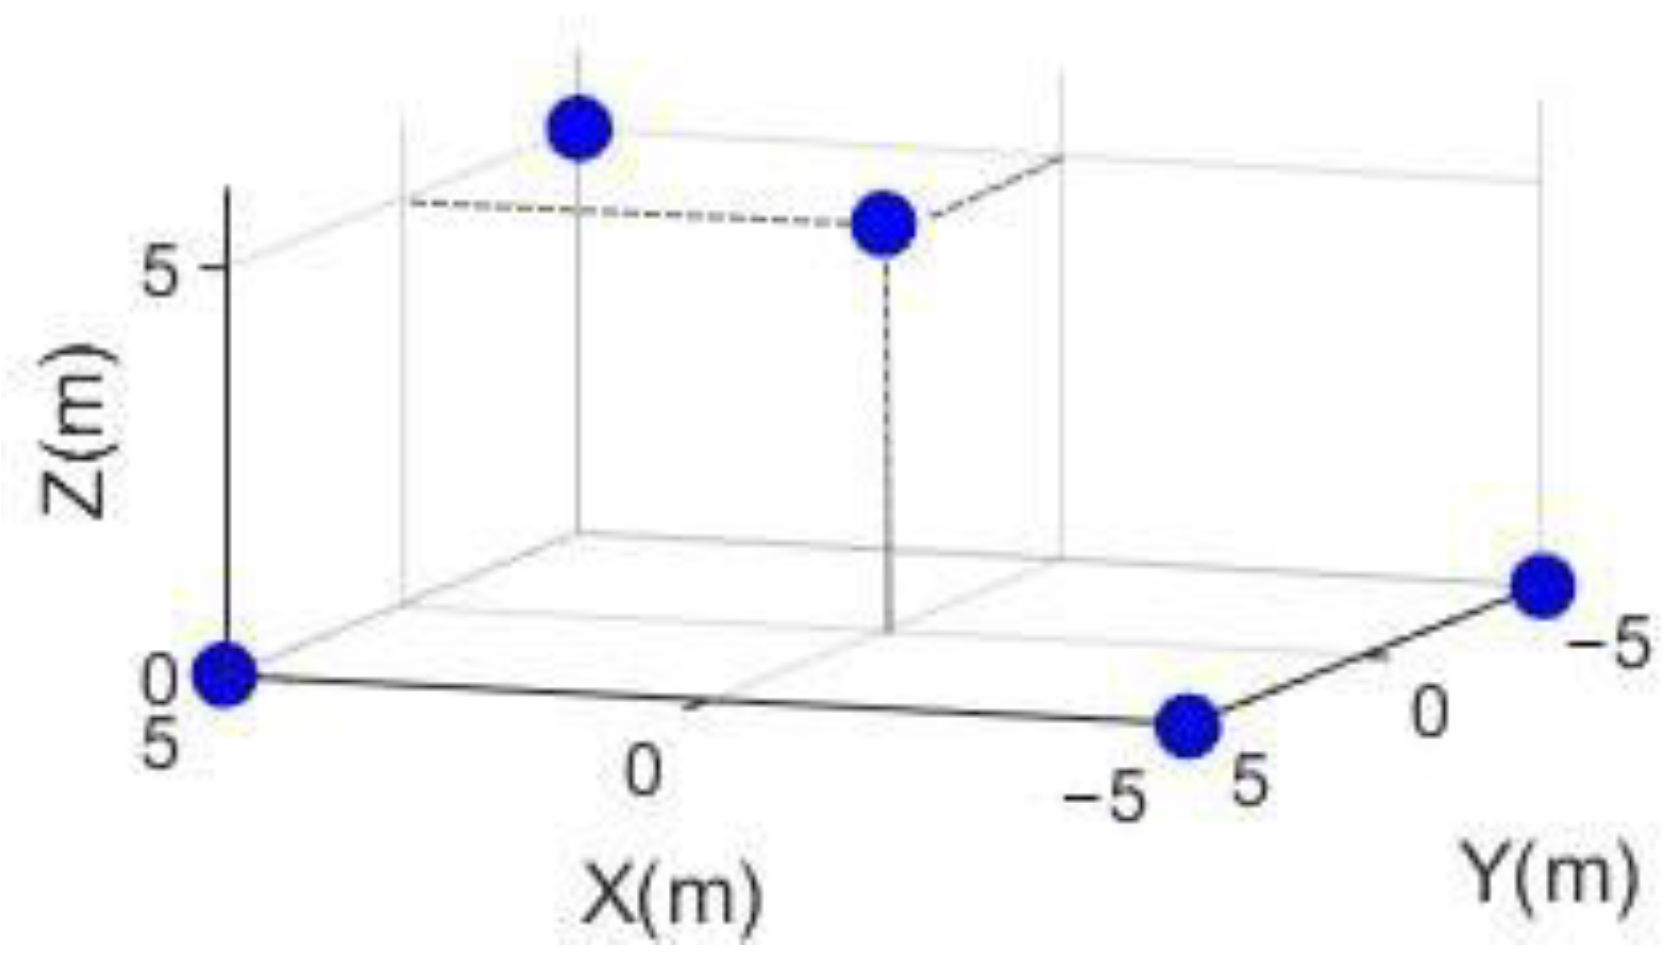
is linear. As shown in
Figure 1, the target focus point P, which is the vertex of the cone formed by circles with different heights, is the intersection point of the cone generatrix passing through the vertex.
Hough transform is an effective method to detect the intersection of many straight lines [
14]. In the Hough-transformed space
of the binary image, the meeting of two line segments on the image is the sine curve that passes through two peak points simultaneously. According to the coordinates
and
, which are the two peak points, the intersection coordinates of two line segments in the image can be calculated via the Hough transformation formula as follows:
3.2. Algorithm Flow
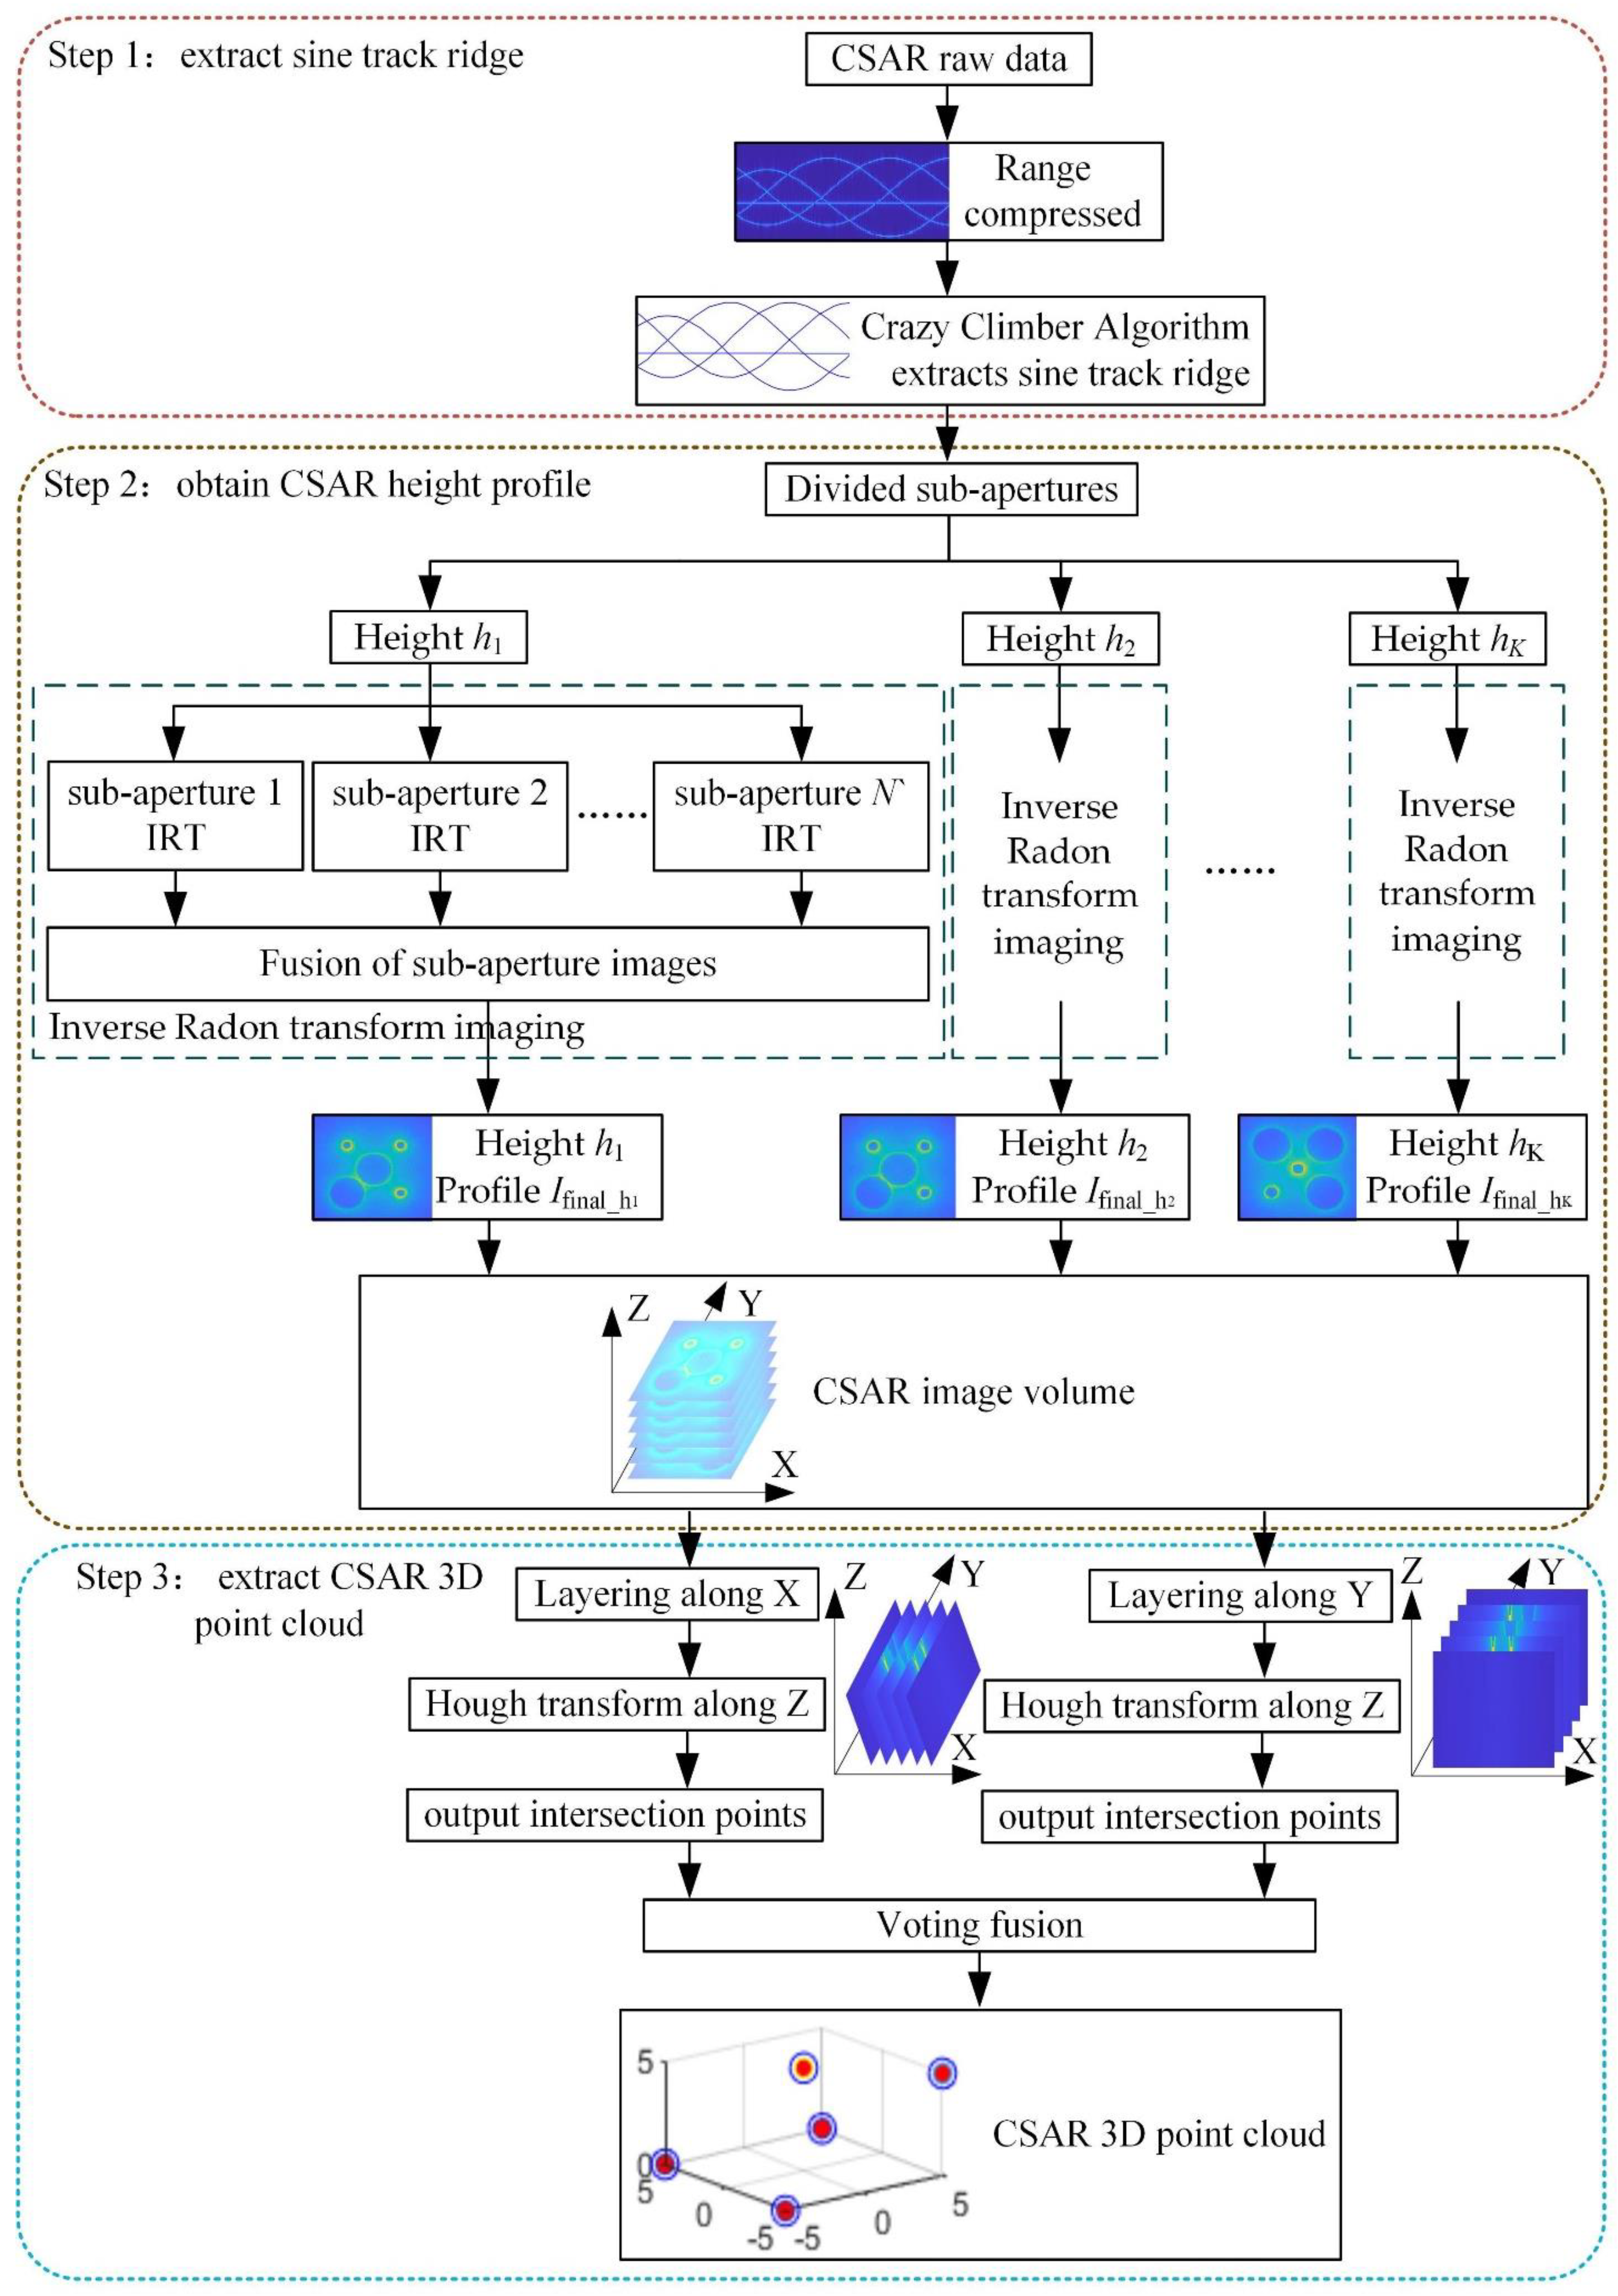
A flow chart of the CSAR fast 3D imaging method based on image detection presented in this paper is shown in
Figure 2. This method includes three steps: (1) using the Crazy Climber algorithm to extract the sine track ridge [
15], (2) using IRT to obtain the CSAR height profile, and (3) applying Hough transform to extract a CSAR 3D point cloud. The details are as follows.
Step 1: Extract the sine track ridge. Because the sinusoidal trajectories of different targets overlap and cross in the range-compressed echo signal, high-quality CSAR images cannot be obtained directly by IRT. The improved Crazy Climber algorithm is used to extract the spine of the target sinusoidal trajectory [
15], which can effectively improve the imaging effect of CSAR. The specific steps of the improved Crazy Climber algorithm are as follows.
(1) Initialization. is the observation matrix, the observation matrix and the measurement matrix are zero matrices with the exact dimensions of , and the Climbers are evenly distributed in the observation matrix . Let the number of climber moves be .
(2) Move the Climber. The time corresponding to the movement of the Climber is
. If the position of the Climber at time
is
, the rule for estimating the position of the Climber
at time
involves calculating the probability of the Climber moving to the adjacent six positions:
where
, and
is the amplitude increment of the six adjacent positions
relative to the position
. When
is located inside the matrix, that is
and
, the adjacent six positions are
,
,
,
,
, and
. Conversely, when
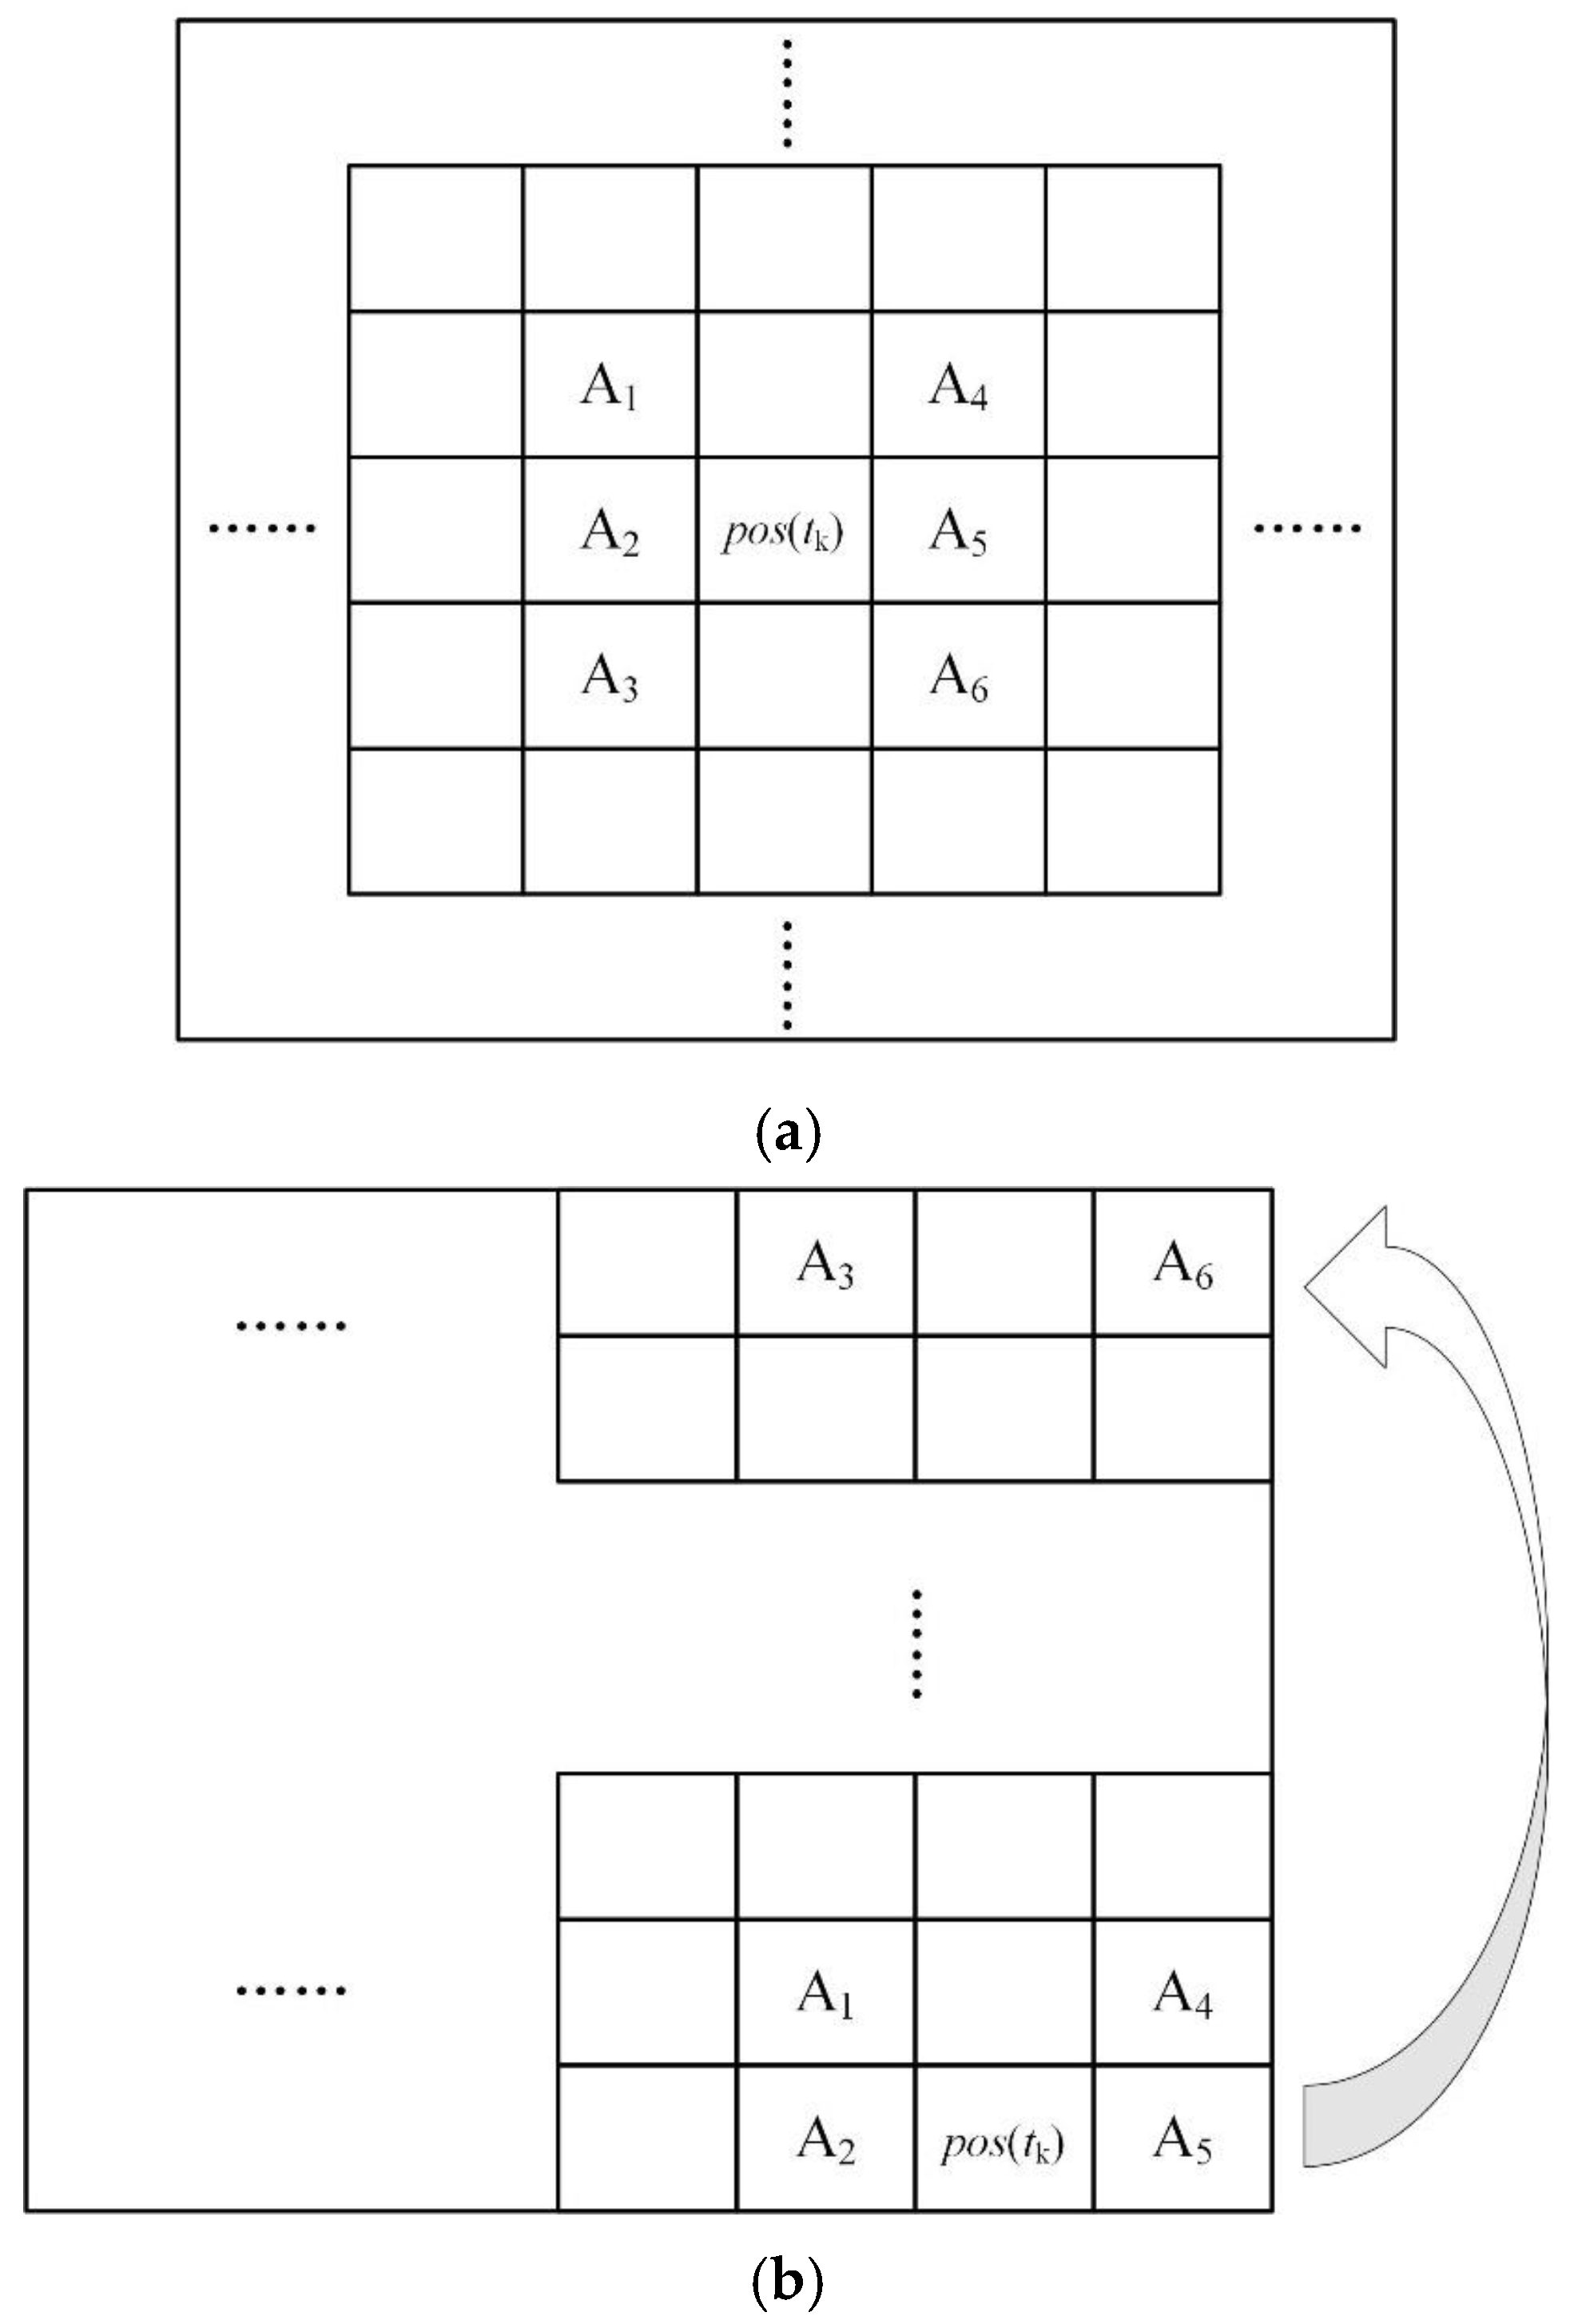
is located at the edge of the matrix, first connect the end of the matrix
and then shift it. For example, if
and
, the adjacent six positions are
,
,
,
,
, and
, as shown in
Figure 3.
(3) According to the moving result, add 1 to the corresponding position of the measurement matrix .
(4) Repeat the above steps until the Climber traverses to obtain the final metric matrix .
(5) Recurse the measurement matrix in the slow time direction to form a sinusoidal ridge line and eliminate the ridge lines with too small a length to obtain the ridge line matrix .
Step 2: Obtain the CSAR height profile. Two-dimensional profiles of CSAR with different heights are obtained via IRT.
(1) Divide the sub-apertures. According to the scattering characteristics of the target in the scene, is divided into sub-apertures along the slow time, where , is the number of sub-apertures, and is the sub-aperture width;
(2) Set the height of the imaging plane . By changing the range center of the data during the IRT, 2D imaging of the CSAR at different height planes can be realized;
(3) Sub-aperture IRT imaging. IRT is performed on
along the slow time direction to obtain
, which is a 2D image of each sub-aperture at height
:
where
denotes the IRT.
(4) Sub-aperture image fusion. To reduce the average effect of sub-apertures in incoherent processing and the influence of scattering center intensity in different sub-apertures, sub-aperture images are fused based on the generalized likelihood ratio test (GLRT) [
16], and the largest pixel in each sub-image is taken as the pixel of the final 2D image:
where
is the CSAR 2D image representing the height
. CSAR 2D images with different heights are then superimposed to form a CSAR image volume
.
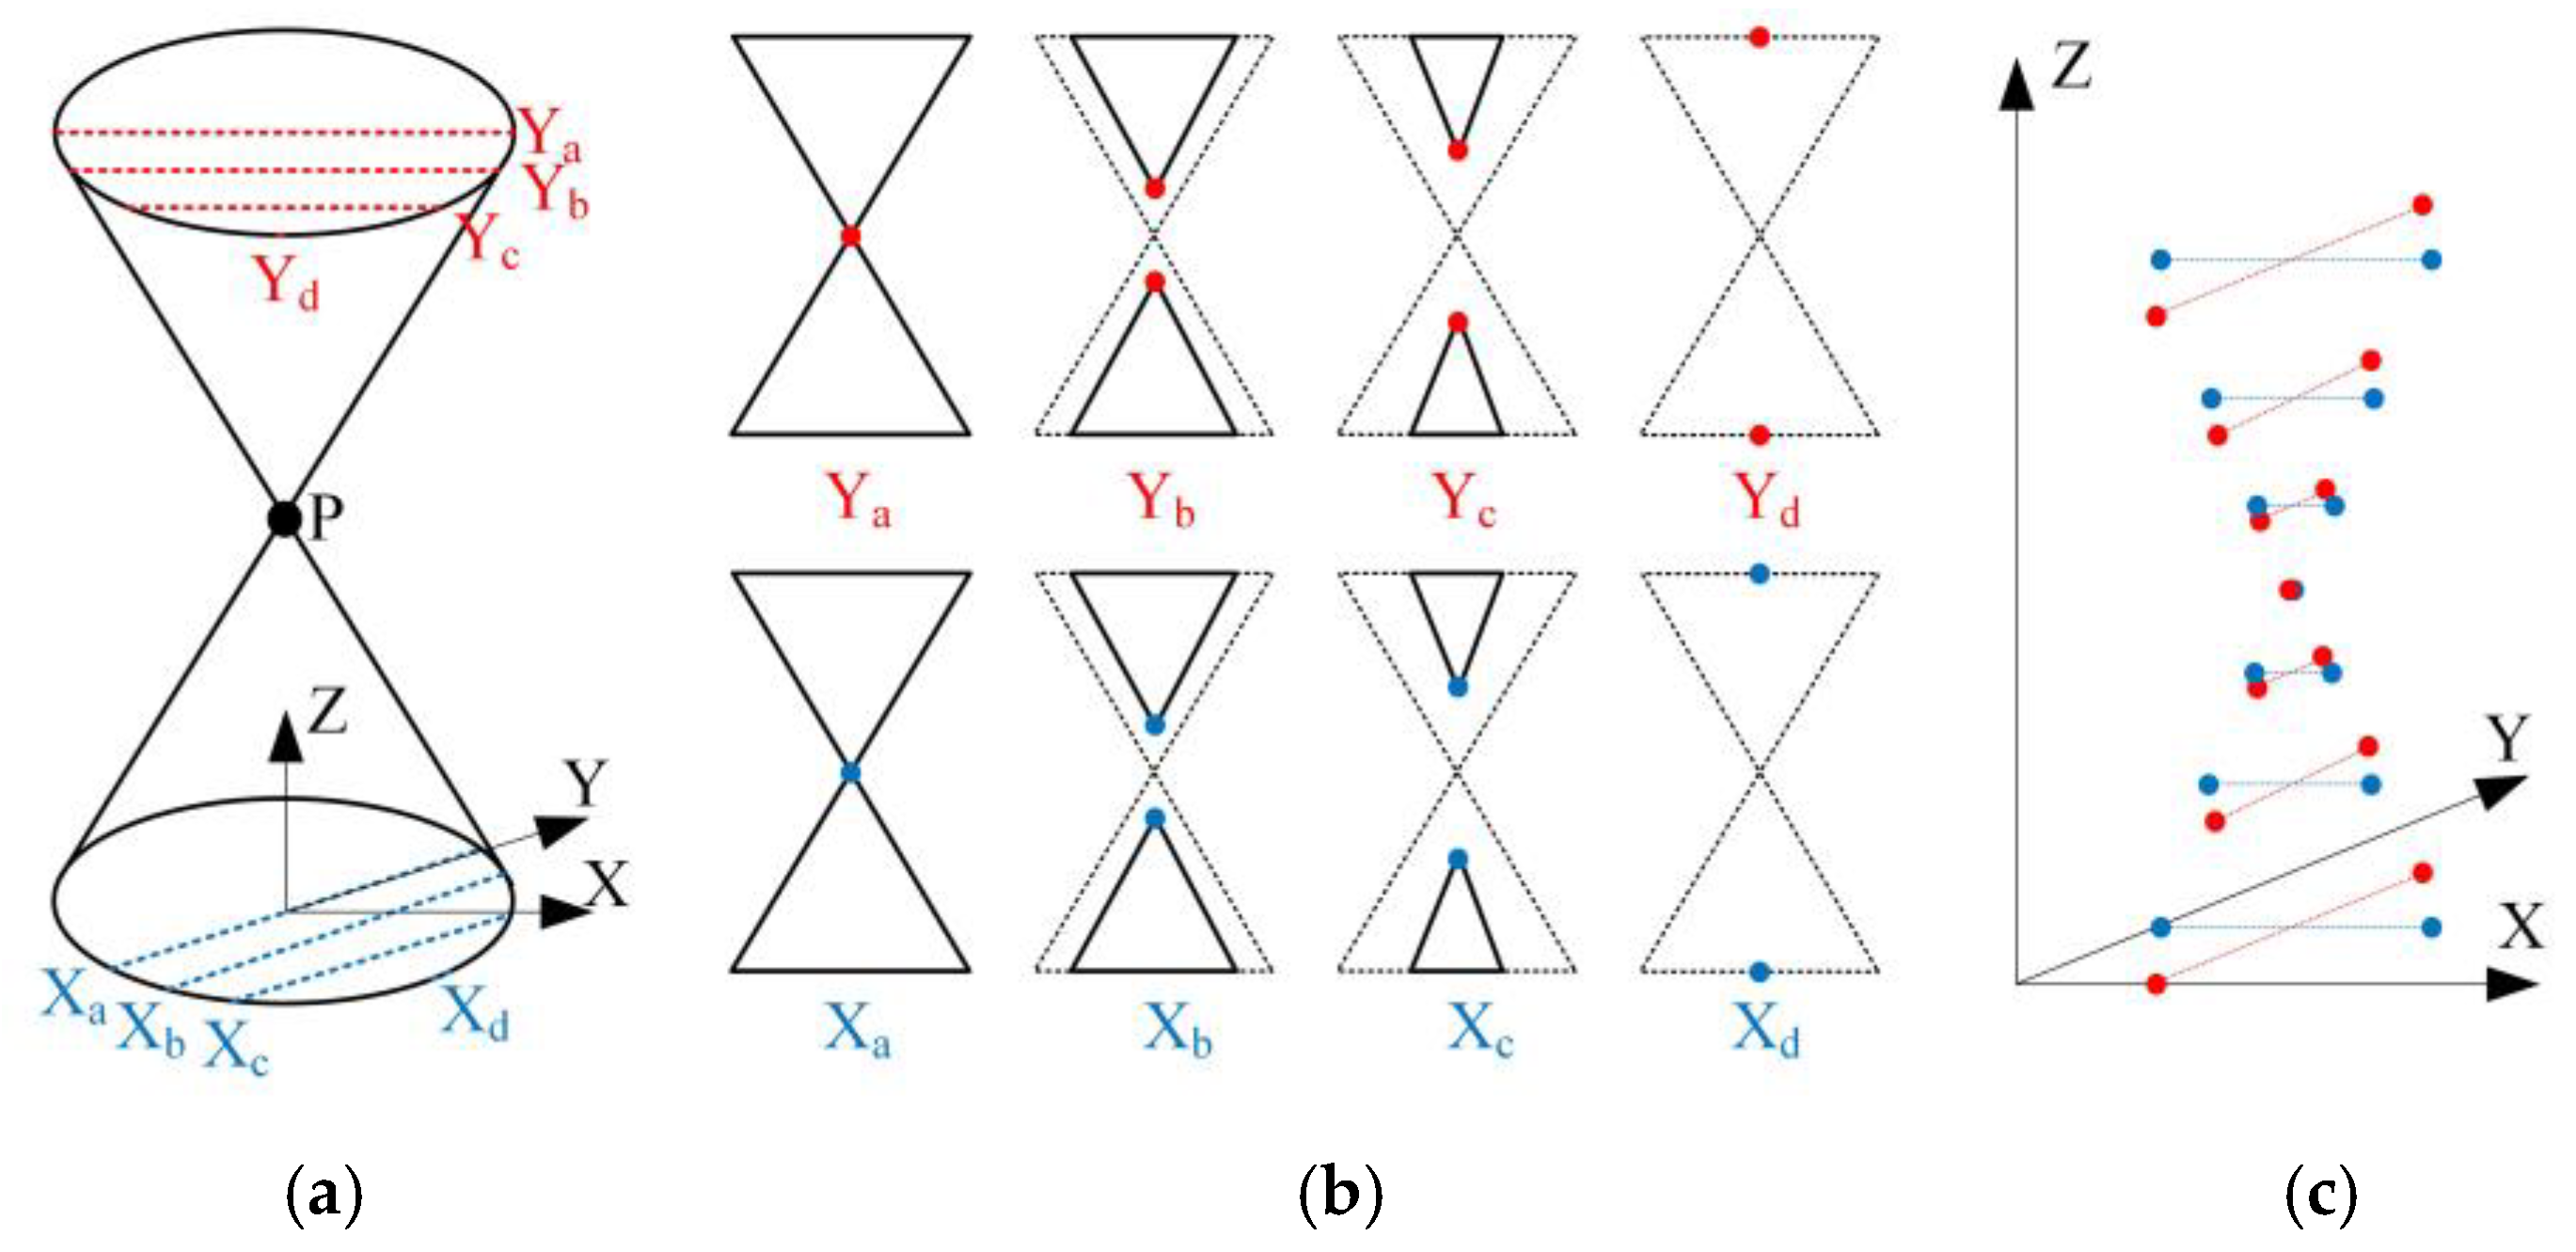
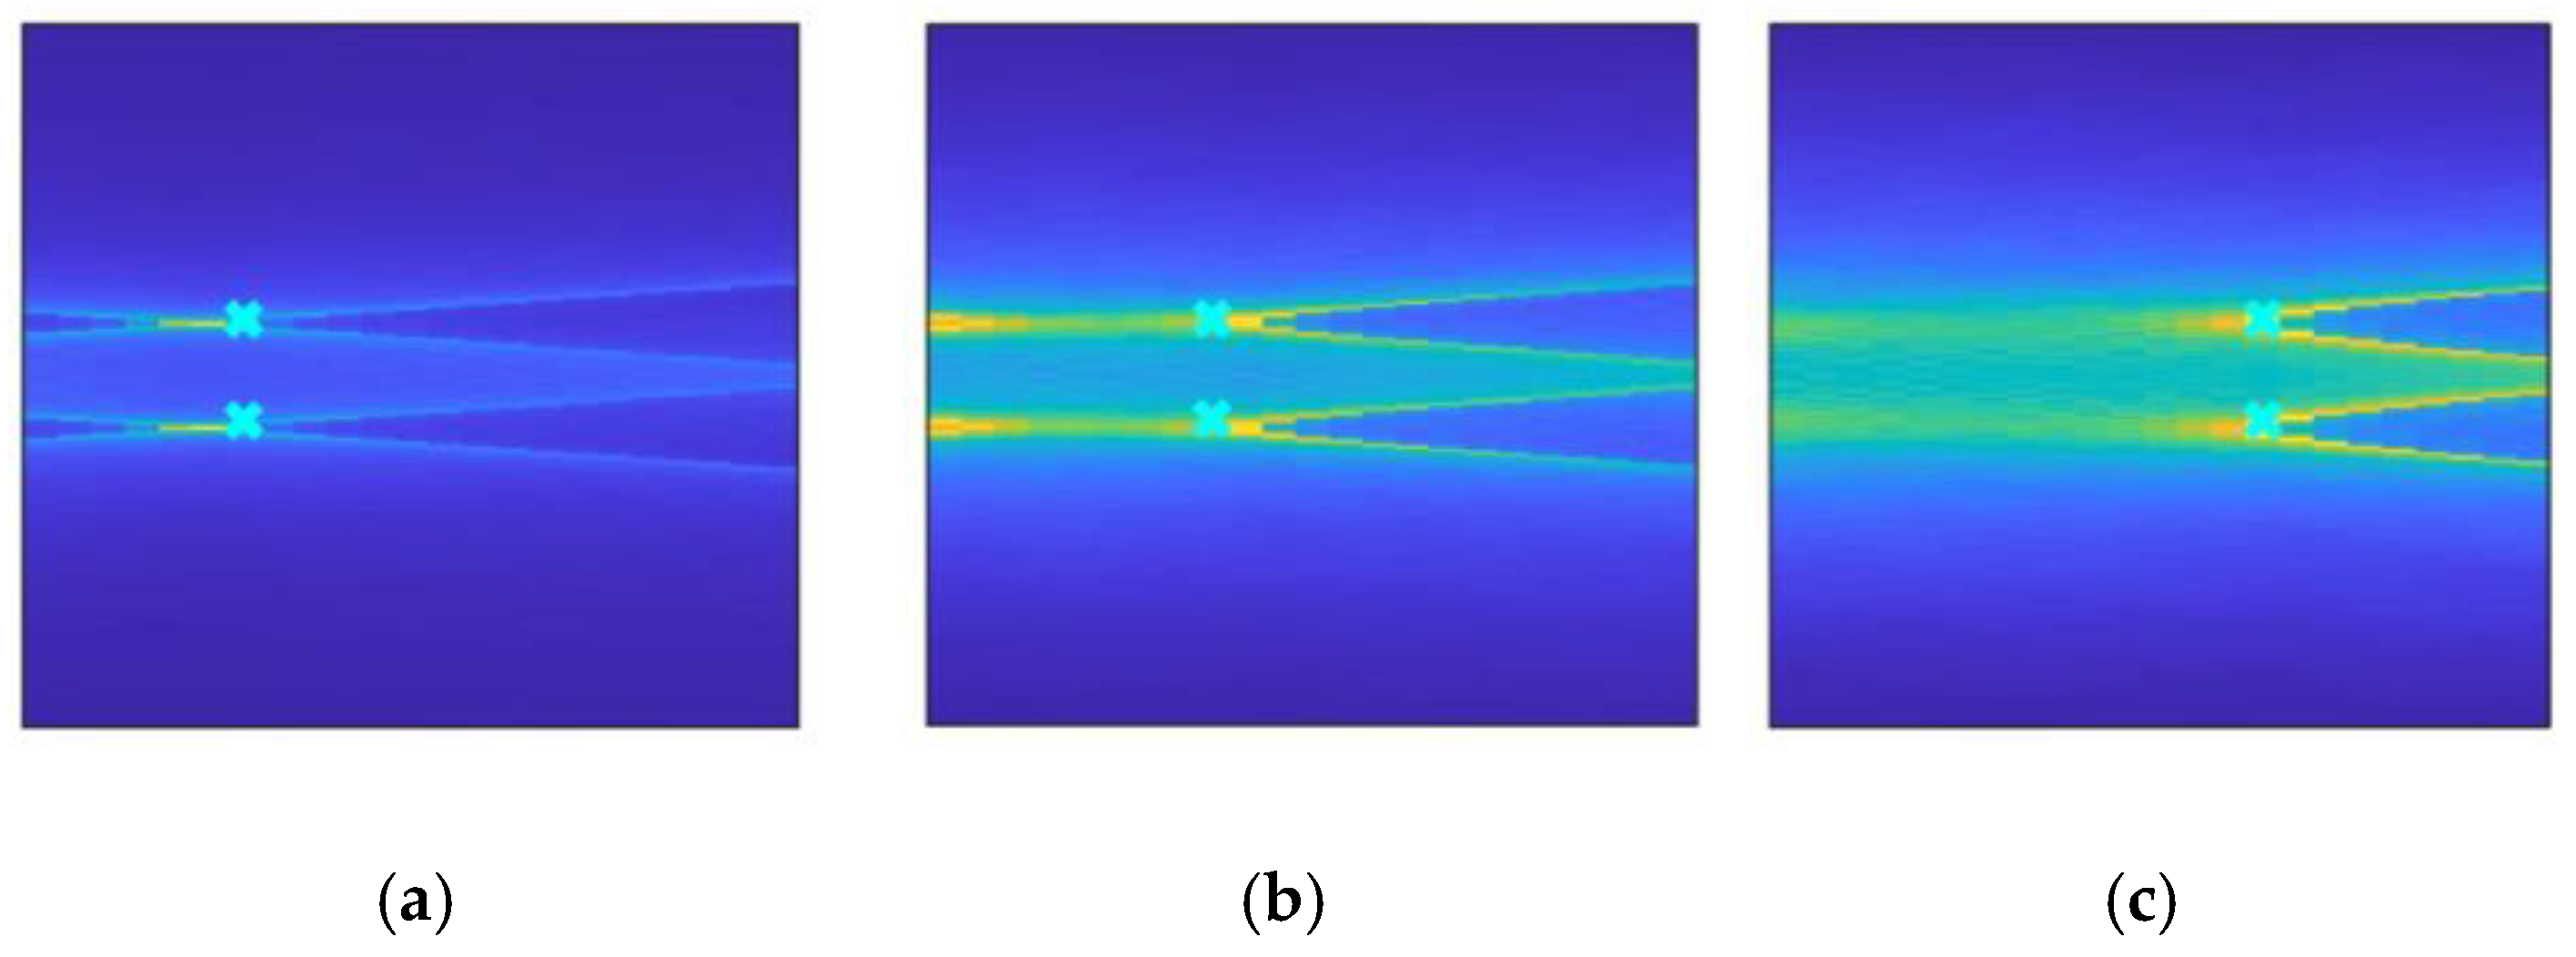
Step 3: Extract the CSAR 3D point cloud. Hough transform is used to extract the intersection points of the height slices of the defocused circle in the X and Y directions, respectively. Lastly, 3D point cloud extraction is completed after voting fusion.
(1) Layering along the X (Y) direction. Firstly, the CSAR image volume
obtained in step 2 is layered along the X direction and the Y direction, respectively, as shown in
Figure 4a. Each layer’s data
(
) represent a change in the Z−Y (Z−X) direction, where
. Then, the Canny operator is used to binarize each layer of data
(
) to obtain
(
), which prepares the data for the Hough transform;
(2) Hough transform along the Z direction. Carry out a one-dimensional Hough transform on () along the Z direction and extract the peak points of the Hough transform in each layer, where . The upper limit needs of can be set according to the number of targets to be extracted in this layer;
(3) Output intersection points. According to Formula (14), calculate the intersection points of the straight lines in
(
), as shown in
Figure 4b;
(4) Voting fusion to extract the 3D point cloud. In the 3D grid composed of the CSAR image volume
, according to the Hough transform, the output intersection coordinates are voted for in the corresponding grid. As seen in
Figure 4c, only when the height of the imaging plane is consistent with the actual height of the target will the output intersection coordinates in the X and Y directions completely coincide when the target is entirely focused. If the grid voting result exceeds a certain threshold, the CSAR 3D point cloud extraction is considered complete.
3.3. Algorithm Complexity Analysis
The traditional 3D BP imaging algorithm has to perform phase compensation for each 3D grid in each azimuth pulse, so the imaging speed is extremely low. In this paper, IRT and Hough transforms are used to extract the 3D point cloud, which can greatly improve the rate of CSAR 3D imaging. Let the azimuth pulse number of the full CSAR aperture data be , the distance pulse number be , and the 3D imaging grid size be .
The traditional 3D BP algorithm needs
phase compensation operations, and the algorithm time is as follows:
where
is the time consumption of one phase compensation operation using the traditional 3D BP algorithm.
The IBP 3D imaging method requires one geometric interpolation kernel construction,
interpolation and phase compensation operations, and
vector search operations. The algorithm time is as follows:
where
denotes the time consumption of one geometric interpolation kernel construction, and
denotes the time consumption of one vector search operation.
The proposed method needs to extract the ridge line of the sinusoidal trajectory once, including an
prediction of Climber movement. For
IRT sub-aperture fusion imaging, if the full aperture data are divided into
sub-apertures, each imaging dataset includes
IRT and one sub-aperture image fusion based on GLRT; then,
Hough transforms are used to extract the intersection points with one vote for fusion. The time consumption is as follows:
where
is the time consumption of one Climber motion prediction,
indicates the time consumption of one IRT,
is the time consumption of one sub-aperture image fusion based on GLRT,
indicates the time consumption of one Hough transform to extract intersection points, and
is the time consumption of one vote for fusion.
The proposed algorithm simplifies the phase compensation operation of the traditional 3D BP or IBP algorithm into Climber motion prediction, IRT, sub-aperture image fusion, Hough transform to extract the intersection points, and one voting fusion, which effectively simplifies the computational complexity of the model and improves the imaging speed.


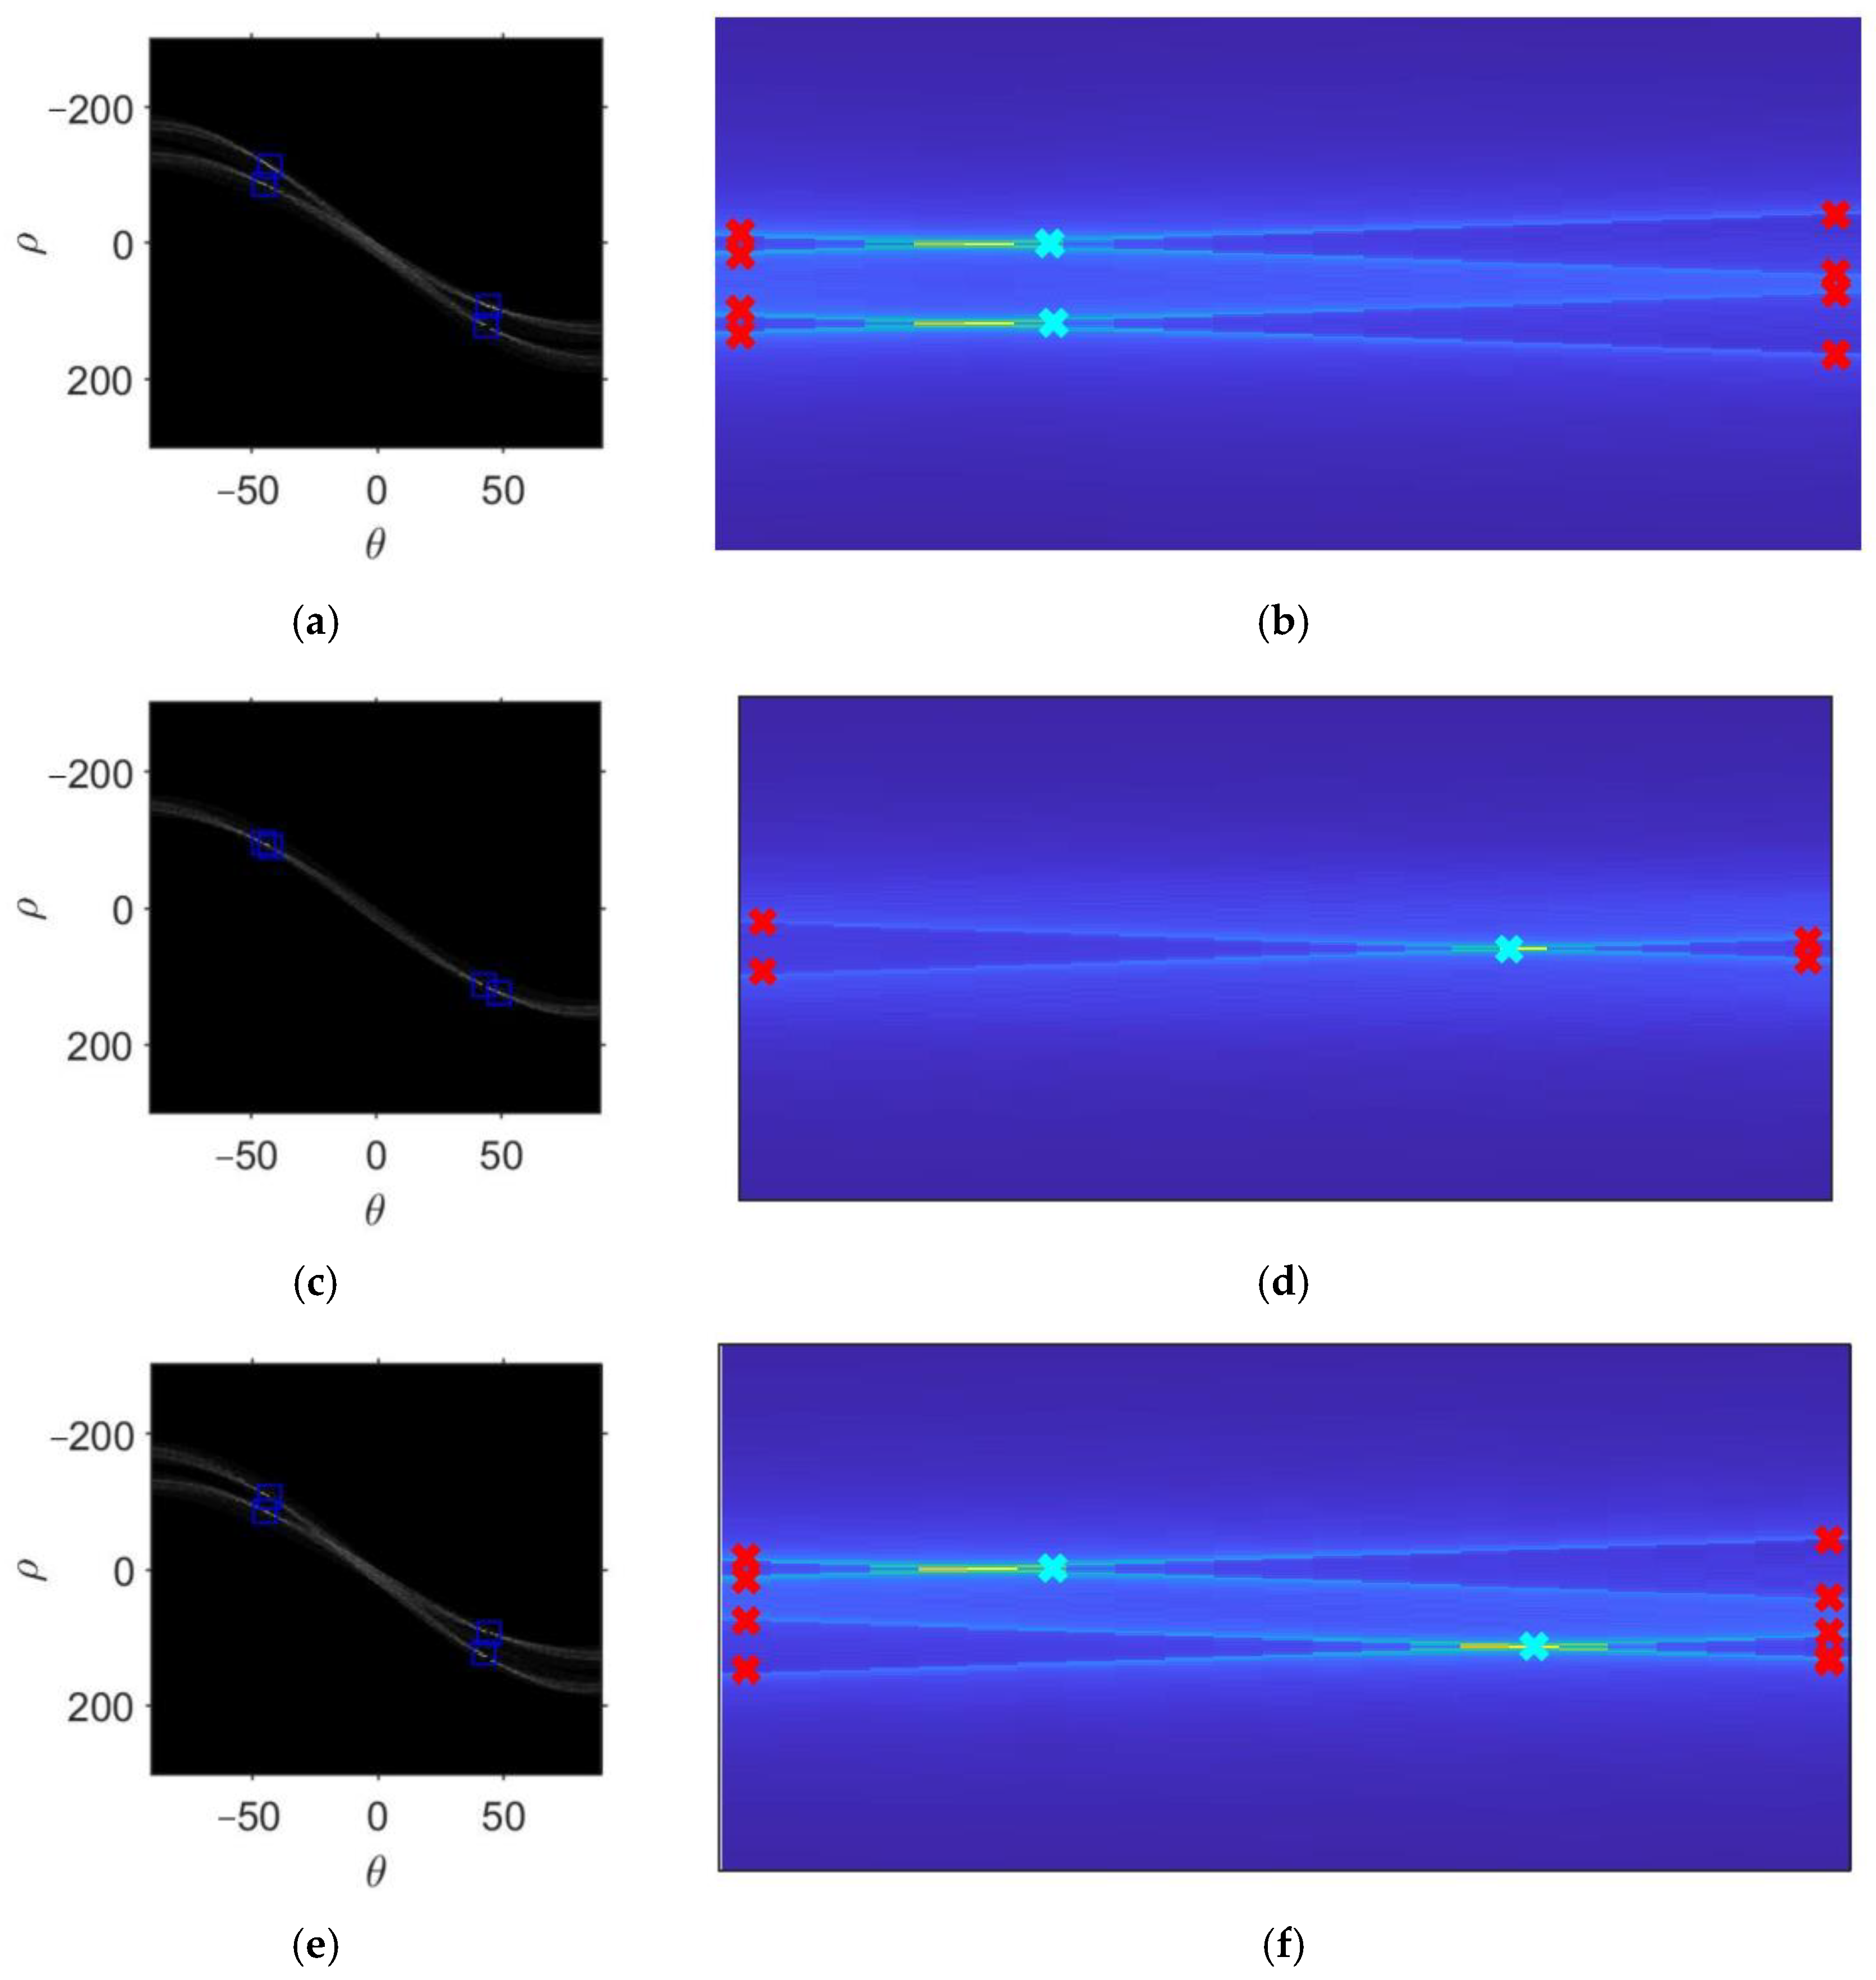
 ” in Figure 9b; and the intersection point of the detected output line is shown as the cyan “
 ” in Figure 9b. Here, the two intersection points are consistent with the two-point target with a height of z = 0 m in the scene. When x = 0 m, the peak point after the Hough transform is extracted, as shown in Figure 9c, and the intersection point of the extracted straight line and the detected output straight line is shown in Figure 9d. When x = 5 m, the peak point after the Hough transform is extracted, as shown in Figure 9e, and the intersection point of the extracted straight line and the detected output straight line is shown in Figure 9f. The two intersection points are located at different heights, consistent with heights of z = 0 m and z = 5 m in the scene.


