Review

A Decade of Intelligent Software Testing Research: A Bibliometric Analysis

1
LTI Laboratory, National School of Applied Sciences, Chouaib Doukkali University, El Jadida 24000, Morocco
2
IPSS Team, Faculty of Sciences, Mohammed V University in Rabat, Rabat 10000, Morocco
3
National Center for Scientific and Technical Research (CNRST), Rabat 10000, Morocco
*
Author to whom correspondence should be addressed.
Electronics 2023, 12(9), 2109; https://doi.org/10.3390/electronics12092109
Submission received: 28 March 2023 / Revised: 22 April 2023 / Accepted: 25 April 2023 / Published: 5 May 2023
(This article belongs to the Special Issue Software Analysis and Testing for Large-Scale Software Systems)

Abstract

:
It gets harder and harder to guarantee the quality of software systems due to their increasing complexity and fast development. Because it helps spot errors and gaps during the first phases of software development, software testing is one of the most crucial stages of software engineering. Software testing used to be done manually, which is a time-consuming, imprecise procedure that comes with errors and gaps and costs money, time, and effort. Currently, testing professionals routinely automate testing to obtain trustworthy results while saving time, cost, and labor. We’ve also moved the starting point of the software cycle to the developer, and made write tests before even writing code, or what’s known as TDD (Test Driven Development). The use of new artificial intelligence techniques will enable the generation of smart test cases to improve test quality and provide better coverage and accurate results. In this study, we used the Web of Science database to acquire bibliometric data about intelligent software testing papers which were conducted between 2012 and 2022, and we used Biblioshiny from the R bibliomerix package, alongside with VOSViewer in order to analyze the data and extract insights and answer research questions about the authors, articles, journals, organizations, and countries publishing in the field of intelligent software testing. The focus of this study is on scientific progress and collaborative trends in scholarly research, providing a blueprint for showcasing worldwide developments in the realm of intelligent software testing. By gaining a comprehensive understanding of the present state of research on the application of artificial intelligence in software testing, this study can offer valuable insights to software engineers, architects, and researchers in the field.

1. Introduction

Intelligent (Smart) software testing refers to the use of artificial intelligence (AI) and machine learning (ML) techniques to improve the efficiency and effectiveness of software testing [1]. The goal of intelligent testing is to reduce the time and cost of testing while increasing the coverage and reliability of tests [2]. Some examples of intelligent software testing include:
  • Using AI to automatically generate test cases based on the code and requirements of the software [3].
  • Using ML to predict which test cases are most likely to find defects, and prioritizing those test cases for execution [4].
  • Using AI to automatically identify patterns in test results and suggest areas of the code that may be prone to defects [5].
Intelligent software testing can help to improve the quality of software by identifying defects that might have been missed by traditional testing approaches [6]. It can also help to reduce the time and cost of testing by automating many of the tasks that are typically done manually [7]. Traditional software testing approaches rely on manual effort to design and execute test cases. This can be time-consuming and may not provide comprehensive coverage of the software being tested [8]. Intelligent software testing, on the other hand, uses artificial intelligence (AI) and machine learning (ML) techniques to automate the testing process and improve its efficiency and effectiveness [9].
Some specific ways in which intelligent software testing differs from traditional approaches include:
  • Automation: Intelligent testing uses AI and ML to automate the generation and execution of test cases, reducing the need for manual effort [10];
  • Coverage: Intelligent testing techniques can help to ensure that a greater proportion of the code is covered by test cases, increasing the likelihood of finding defects [11];
  • Prioritization: Using ML, intelligent testing can prioritize the execution of test cases based on their likelihood of finding defects, allowing testers to focus on the most important tests first [12];
  • Defect prediction: AI can be used to analyze test results and identify patterns that may indicate the presence of defects in the code [13].
Therefore, intelligent software testing can help to improve the quality and reliability of software by identifying defects that might have been missed by traditional testing approaches, and by automating many of the tasks that are typically done manually.
Well-conducted bibliometric studies can provide academics with a complete overview of their field, identify areas where further research is needed, spark new research ideas, and help establish their contributions to the field. Furthermore, these studies can establish a strong basis for the development of a field in novel and important ways. Bibliometric software like Gephi, Leximancer, and VOSviewer enable the analysis of such data in a very practical way, which has led to a recent increase in scholarly interest in bibliometric analysis. It is noteworthy that the emergence of scientific databases like Scopus and Web of Science has made acquiring large volumes of bibliometric data relatively easy [14].
The research questions we’re trying to answer are:
Q1.
What is the average number of citations per research document?
Q2.
What is the annual growth rate of research?
Q3.
How many year-wise citations were received by the research documents?
Q4.
What is the correlation between countries, authors, and research documents?
Q5.
What are the most successful and highly cited journals?
Q6.
What are the most contributing institutions and authors to the field?
Q7.
Which countries have contributed to most to the field?
Q8.
Who are the most cited authors?
Q9.
What are the most cited papers?
Q10.
What is the relationship between authors and the quantity of articles published?
Q11.
Which words are often used and how are they used together?
Q12.
Which countries usually collaborate together?
Q13.
Which organizations/institutions usually collaborate together?
Q14.
What are the scholarly communities in terms of authors and journals?
Q15.
What are the related research themes/topics?
These research questions provide valuable insights into the impact, productivity, and trends in research output over time. By analyzing the citation impact of specific researchers, articles, or journals, researchers can identify the most influential research in a particular field, which can inform funding decisions and guide future research directions. Additionally, understanding the collaboration patterns of authors and organizations can help identify productive research partnerships and collaborations, leading to more effective research outcomes. These questions can also provide insights into emerging research areas and areas that may require more attention or investment. Furthermore, they can provide insights into the productivity and impact of research output across different regions and countries, which can inform research policy and investment decisions.
This study contributes both theoretically and practically to the field of intelligent software testing. Theoretical contributions include (1) the identification of research trends by identifying the most popular research topics, the most cited articles and authors, and the most influential journals in the field. This information can help researchers identify gaps in the literature and guide future research directions. (2) The development of a bibliometric framework for analyzing research in the field of intelligent software testing. This framework can be applied to other fields to identify research trends and gaps in the literature. (3) The identification of research collaboration networks between authors, institutions, and countries. This information can be used to facilitate collaborations and knowledge exchange between researchers in different regions. Practical contributions include (1) the identification of key research areas which can be used by other scholars in the field to prioritize areas for research. (2) The identification of influential researchers and institutions which can be used by other scholars to identify potential partners for collaboration.
The rest of this article is structured as follows. We will start by mentioning related works in the studied field in Section 2, then we will reveal our data collection steps and query in Section 3, Section 4 will explain the research methodology we followed, then we will show the results of this study in Section 5, Section 6 is about the discussion of the results found in this study, and finally the conclusions are presented in Section 7.

2. Related Work

This is the first bibliometric study, that we are aware of, that evaluates the results of intelligent software testing. Nevertheless, there were other scholars who treated this subject as a systematic literature review [6,15,16], or as a simple review of the literature [17,18]. As we’re zooming out, we find some articles focusing on summarizing the bibliometric data like [19,20]. Some of them were doing systematic reviews specializing in a single type of software tests: like Higher order mutation testing [21], or software testing in general like [22]. A few scholars focused on examining reviews that help to synthesize indexes that makes it easier to discover the most pertinent data from secondary studies, encouraging the use of proof decisions in any specific field of software engineering [23]. Another type of reviews were those related to automation, in order to evaluate its benefits and limitations [10], or knowing when and what to automate [24], or the challenges facing its automation [25].
Another important area in this topic is generating test data, some are proposing an intelligent framework based on genetic algorithms [26], or genetic algorithms and reinforcement learning in the hopes of automating the generation of test data [27], using optimisation algorithms such as particle swarm optimization [28,29,30,31] or cuckoo algorithm [32]. Also, we have discovered the usage of search-based methods to produce test data and guarantee branch coverage [33], or achieve full statement coverage [34], or getting the inclusion of a structural, or white-box, testing technique that includes the coverage of specific program structures [35].
Many artificial intelligence (AI) approaches have been related to the methods and stages of software testing [36]. One of the frequently used algorithms in the studied field is bee colony algorithm. This algorithm models how honey bees work to improve the food-finding and nectar-gathering system [37]. The path coverage metric is used to optimize the test cases from the search area [38]. It is also used to achieve prioritizing the regression test suite based on fault coverage [39]. Another use is to generate test cases that require the fewest possible iterations and duration [40]. Other algorithms that are much used are genetic algorithms. A genetic algorithm is a type of general algorithm that locates the best possible answer based on the natural selection principle and natural heredity mechanism. It achieves the optimization of a particular objective in the manual system by emulating the life evolutionary mechanism of nature [41]. They produce software test cases by leveraging a fossil record and proportional or developing fitness ideas [42] or as a regeneration method that evaluates the rate of population aging [43], or by combining mutation testing with genetic algorithm [44], or use them to automatically generate test cases [45,46,47].
Another type of newly trending technologies is natural language processing (NLP), its application to categorize and isolate needed information from the massive unprocessed data yields positive outcomes. Using methods influenced by linguistic techniques can help you characterize performance in detail, uncover errors, and achieve excellent code coverage [48]. They are used in the field of software testing to be able to generate automated test cases from initial requirements document [49], or by using keywords in the context to analyze the requirement document to generate test cases for testing [50].
Data mining and multi-agent systems are also used in software testing. In order to evaluate association rules among software testing metrics, data mining is utilized as a technique [51], or it can be used to automated regression testing of data-driven software systems [52]. Multi-agent systems can collaborate to finish creating the test data for software [53]. Another approach is developing a multi-agent testing framework [54]. Moreover, an adaptive test automation model is a potential application. This model integrates the study of test requirements, building and executing test cases. Additionally, it can also plan and carry out tests, reporting and analyzing defects [55]. Researchers, scientists, and graduates could profit from a bibliometric analysis by employing it to decide more effectively in their disciplines according to different properties and to encourage future studies in domains that require it.
Some scholars investigated whether having pairs of testers working collaboratively affects the quality of test reports produced [56]. Some used smart contract testing patterns in order to reduce the number of test cases required [57]. The testing of abstract classes is difficult because they cannot be instantiated, the template method design pattern is used to generate an abstract class with a concrete template method and one or more abstract primitive operations [58]. Code optimization can be helpful to speed up the execution of the tests, an approach for optimizing source code using equivalent mutants employs an algorithmic strategy that surpasses traditional compiler optimizations [59]. Metamorphic testing uses metamorphic relations between the inputs and outputs of multiple program executions to generate test cases in the absence of an oracle, it is used in combination with search-based techniques to automate the detection of performance bugs [60].

3. Data Collection

Bibliometric analysis is a popular and accurate way for perusing and analyzing vast amounts of scientific data. It enables us to recognize emerging fields and comprehend the evolution of a particular field. [14]. Bibliometric software facilitates the classification and analysis of huge volumes of information obtained through studies carried out over a set period. Contrary to systematic literature reviews, which typically utilize qualitative procedures and may be vulnerable to interpretation bias because of the researchers’ varied academic backgrounds, systematic review and bibliometric analysis concentrate on statistical approaches, lowering the likelihood of bias [14].
Multiple databases exist to export data from the literature, like Web of Science (WoS), Scopus, PubMed, Lens and Google Scholar, and every one comes with distinct qualities and roles. The majority of disciplines have broader coverage in Google Scholar, while the Web of Science and Scopus produce largely comparable results [61], WoS offers a wide variety of methods to influence search results, including general, cited reference, and advanced search functions. All three databases allow for the monitoring, counting, processing, and analysis of cited references [62]. Almost 10,000 journals are included in WoS, which also includes seven distinct citation databases with information gleaned from book series, conferences, journals, reports, and books. [63]. As one of the most comprehensive databases, the WoS database offers articles from high-quality research literature [64], It also has an extensive selection of elevated journals and high-quality publications that have been earlier evaluated by experts in their respective disciplines [65], and is regarded among the most reliable sources of research articles [66]. We therefore selected Web of Science. This study used the Web of Science Core Collection since it offers comprehensive coverage of all major scientific disciplines and includes a large number of high-impact journals, which ensures that the literature on intelligent software testing is thoroughly represented [65,67]. Consistent indexing and citation metrics across all journals in the Core Collection facilitate standardized and reliable comparisons between articles, authors, and journals, leading to valid and reliable bibliometric analysis [68].
The papers included in this study have been published by various reputable and well-known publishers, including MDPI, IEEE, Elsevier, and Springer. These publishers are recognized for their contributions to scientific research and are often associated with publishing high-quality papers in various fields, including computer science, engineering, medicine, and more.
The database search discussed in this section was done in the 4 January 2023. The study focused on gathering bibliometric data related to software testing in conjunction with all forms of artificial intelligence: machine learning, deep learning, natural language processing, etc. Figure 1 demonstrates the search strategy applied in this research.
The chosen keywords were picked from a broader search for papers related to software testing, and papers related to artificial intelligence. We ended up choosing the following keywords. The keyword “software test*” is an umbrella for many other keywords such as “software tests” or “software testing”. The keyword “test case generation” and “test prioritization” which refers to test case generation and prioritization as a form of software testing. The keyword “automat*” is an umbrella for other keywords such as “automatic” or “automating”. The following keywords were used to refer to artificial intelligence forms, techniques, and algorithms: “artificial intelligence”, “nlp”, “natural language processing”, “machine learning”, “deep learning ”, “Genetic Algorithms”, “Neural Network*”, “data mining” and “multi-agent”.
First the search was done with keywords from the domain of artificial intelligence along with software testing concatenated by the AND operator and using all the fields of Web of Science Core Collection, this gave us 4970 documents.
Then, the search was limited to the abstract only, and the ‘AND’ operator was replaced by the ‘NEAR/50’ operator. By focusing only on the abstract, which is typically a brief summary of the main content of the document, we can quickly determine whether the document is relevant to our research question. Additionally, using the ‘NEAR/50’ operator can further refine the search results by specifying a distance parameter for the search terms. This is particularly useful for searching for information that may be conceptually related, but not necessarily directly connected in the text. By using the ‘NEAR/50’ operator, the search will retrieve abstracts that contain both terms, even if they are not adjacent to each other in the text, as long as they are within 50 words of each other. After this update, the result set had 1395 documents.
Then, all the documents that are not written in English were removed, this excluded another 12 documents.
The paper is focused on retrieving insights from the last decade, so, another filter for documents published in the time interval of 2012 and 2022 (inclusive) was added. With this filter, the result set had 969 documents.
Finally, a filter to limit the result set only to the documents of type ‘Article’ or ‘Review’ was added, and any ‘Early Access’ document was removed, because it will be published in 2023. With this filter, the final result set had 336 documents. The final query looks like this:
(“software test*”) near/50 (“automat*” or “test prioritization” or “test case generation” or “artificial intelligence” or “nlp” or “natural language processing” or “machine learning” or “deep learning” or “genetic algorithms” or “neural network*” or “data mining” or “multi-agent”) (abstract) and english (language) and 2012–2022 (year published) and article or review (document type) not early access (document type).

4. Research Method

A bibliometric study is a research method that uses statistical analysis of published literature to assess the effect of a particular field or group of work. In the context of software testing, a bibliometric study involves analyzing multiple factors. One factor is the number and quality of publications related to software testing. Another factor is the authors and institutions that are producing the most influential work in the field. Additionally, a bibliometric study looks at the citation patterns of software testing papers to identify trends and patterns in the research landscape. This kind of research can be valuable for determining the most important research areas, comprehending the condition of the field, and seeing potential areas for future research.
We used the Bibliometrix R Package (biblioshiny v4.0.1) software to do a thorough scientific mapping analysis after exporting the dataset from the WoS Database [69] in order to generate most of the graphs, and we used VOSviewer, a free computer tool for creating and viewing bibliometric maps [70], for the rest of the graphs.
We started by showing an overview of the dataset which consists of the following items:
  • Main information: A table showing the fundamental traits of our dataset;
  • Scientific production: A graph of the annual scientific production of the studied field;
  • Citations per year: A graph showing the growth in citations by year;
  • Relationship between countries, authors, and titles: Which is a Three-Field Plot showing the relationship between countries, authors, and title of articles.
The second part of the results is about science mapping. This final step is a general domain analysis and visualization process. Several components, such as a group of scientific writing, a collection of metrics, indicators, scientometric and tools for observation and analysis, are frequently included in a science mapping project. These components can draw attention to trends and patterns that may be important as well as scientific transformation ideas which can direct the conceptual frameworks and cycles analysis and interpretation [71]. In this step, we focused on the following items:
  • The Most Successful and Highly Cited Journals: A graph showing the best ten most active journals based on the quantity of articles they published and the top cited journals based on the quantity of citations they got;
  • The Most Important Organizations: Based on the quantity of documents created, a graph showing the top 10 most prolific institutions;
  • The Most Relevant Authors: A graph showing the top 10 authors based on the volume of articles created;
  • The Top Developing Nations According to Corresponding Authors: A graph showing the top 10 most relevant countries based on the amount of articles produced, either in single country publication or multiple countries publication;
  • The Most Globally cited authors: A graph of the top 10 most cited authors using all citations in the Web of Science database;
  • The Most Globally cited documents: A graph of the top 10 most cited documents using all citations in the Web of Science database;
  • Scientific Productivity Frequency Distribution (Lotka’s Law): A graph and table displaying the frequency analysis of research publications according to Lotka’s law;
  • The Most Frequent Words: A graph and a word cloud of the most used words in the documents’ abstract, title and keywords;
  • Co-occurrence network of keywords: A graph that depicts the relationship between key words and divides them into smaller clusters;
  • Collaboration World Map and Network: A graph and a world map showing the relationship between countries in terms of collaboration;
  • Organisations Co-authorship: A graph showing a network of collaborations between organizations;
  • Authors co-citation network: A graph of the network of connection between authors based on the co-citations;
  • Journals co-citations network: A graph of the network of correlation between journals based on the co-citations.
Network analysis is the third section. According to network theory or graph theory, network analysis is the study of the properties of networks and the interaction between their vertices and segments. The most crucial measures for network analysis are the proximity and betweenness centrality indices. The social power of a vertex is represented by the centrality index, which ranks each vertex in the network according to its function and location in network communications [72]. In this part of the research, we focused on the following items:
  • Thematic Map: A network graph, referred to as a thematic map, is created by the keywords and how they are connected. Each thematic map’s labels are identified using the name of the keyword that appears most frequently in the connected topic [73];
  • Multiple Correspondence Analysis (MCA): For visually and mathematically analyzing such data, multivariate categorical analysis (MCA) is aa method for multidimensional analysis method [74];
  • Correspondence Analysis (CA): Correspondence analysis is a visual method of comprehending the connection between items in a frequency table. It is intended to assess connections between qualitative variables and is a development of principal component analysis (or categorical data) [75];
  • Multidimensional scaling: Just like MCA and CA, a dimensionality reduction approach called multidimentional scaling is used to create a map of the network under study using normalized data [69].
All of these items will be discussed in the details in Section 5 of this article. Figure 2 summarizes the research approach used in this article.

5. Results

5.1. Overview

5.1.1. Main Information

Table 1 shows the main information related to intelligent software testing extracted from the dataset that we exported from the Web of Science Database. The key pieces of information are about the research timeframe, the journals and documents captured, the average number of citations, the references, and the annual growth rate. The essential information related to the content is the keywords used by the authors and the Keywords Plus attribute that is unique to the Web of Science database. We also have data related to documents’ authorship which is divided into single and multi-authored documents. The facts related to collaboration are the number of single-authored documents, the number of authors per document, and the international co-authorship rate.

5.1.2. Annual Scientific Production

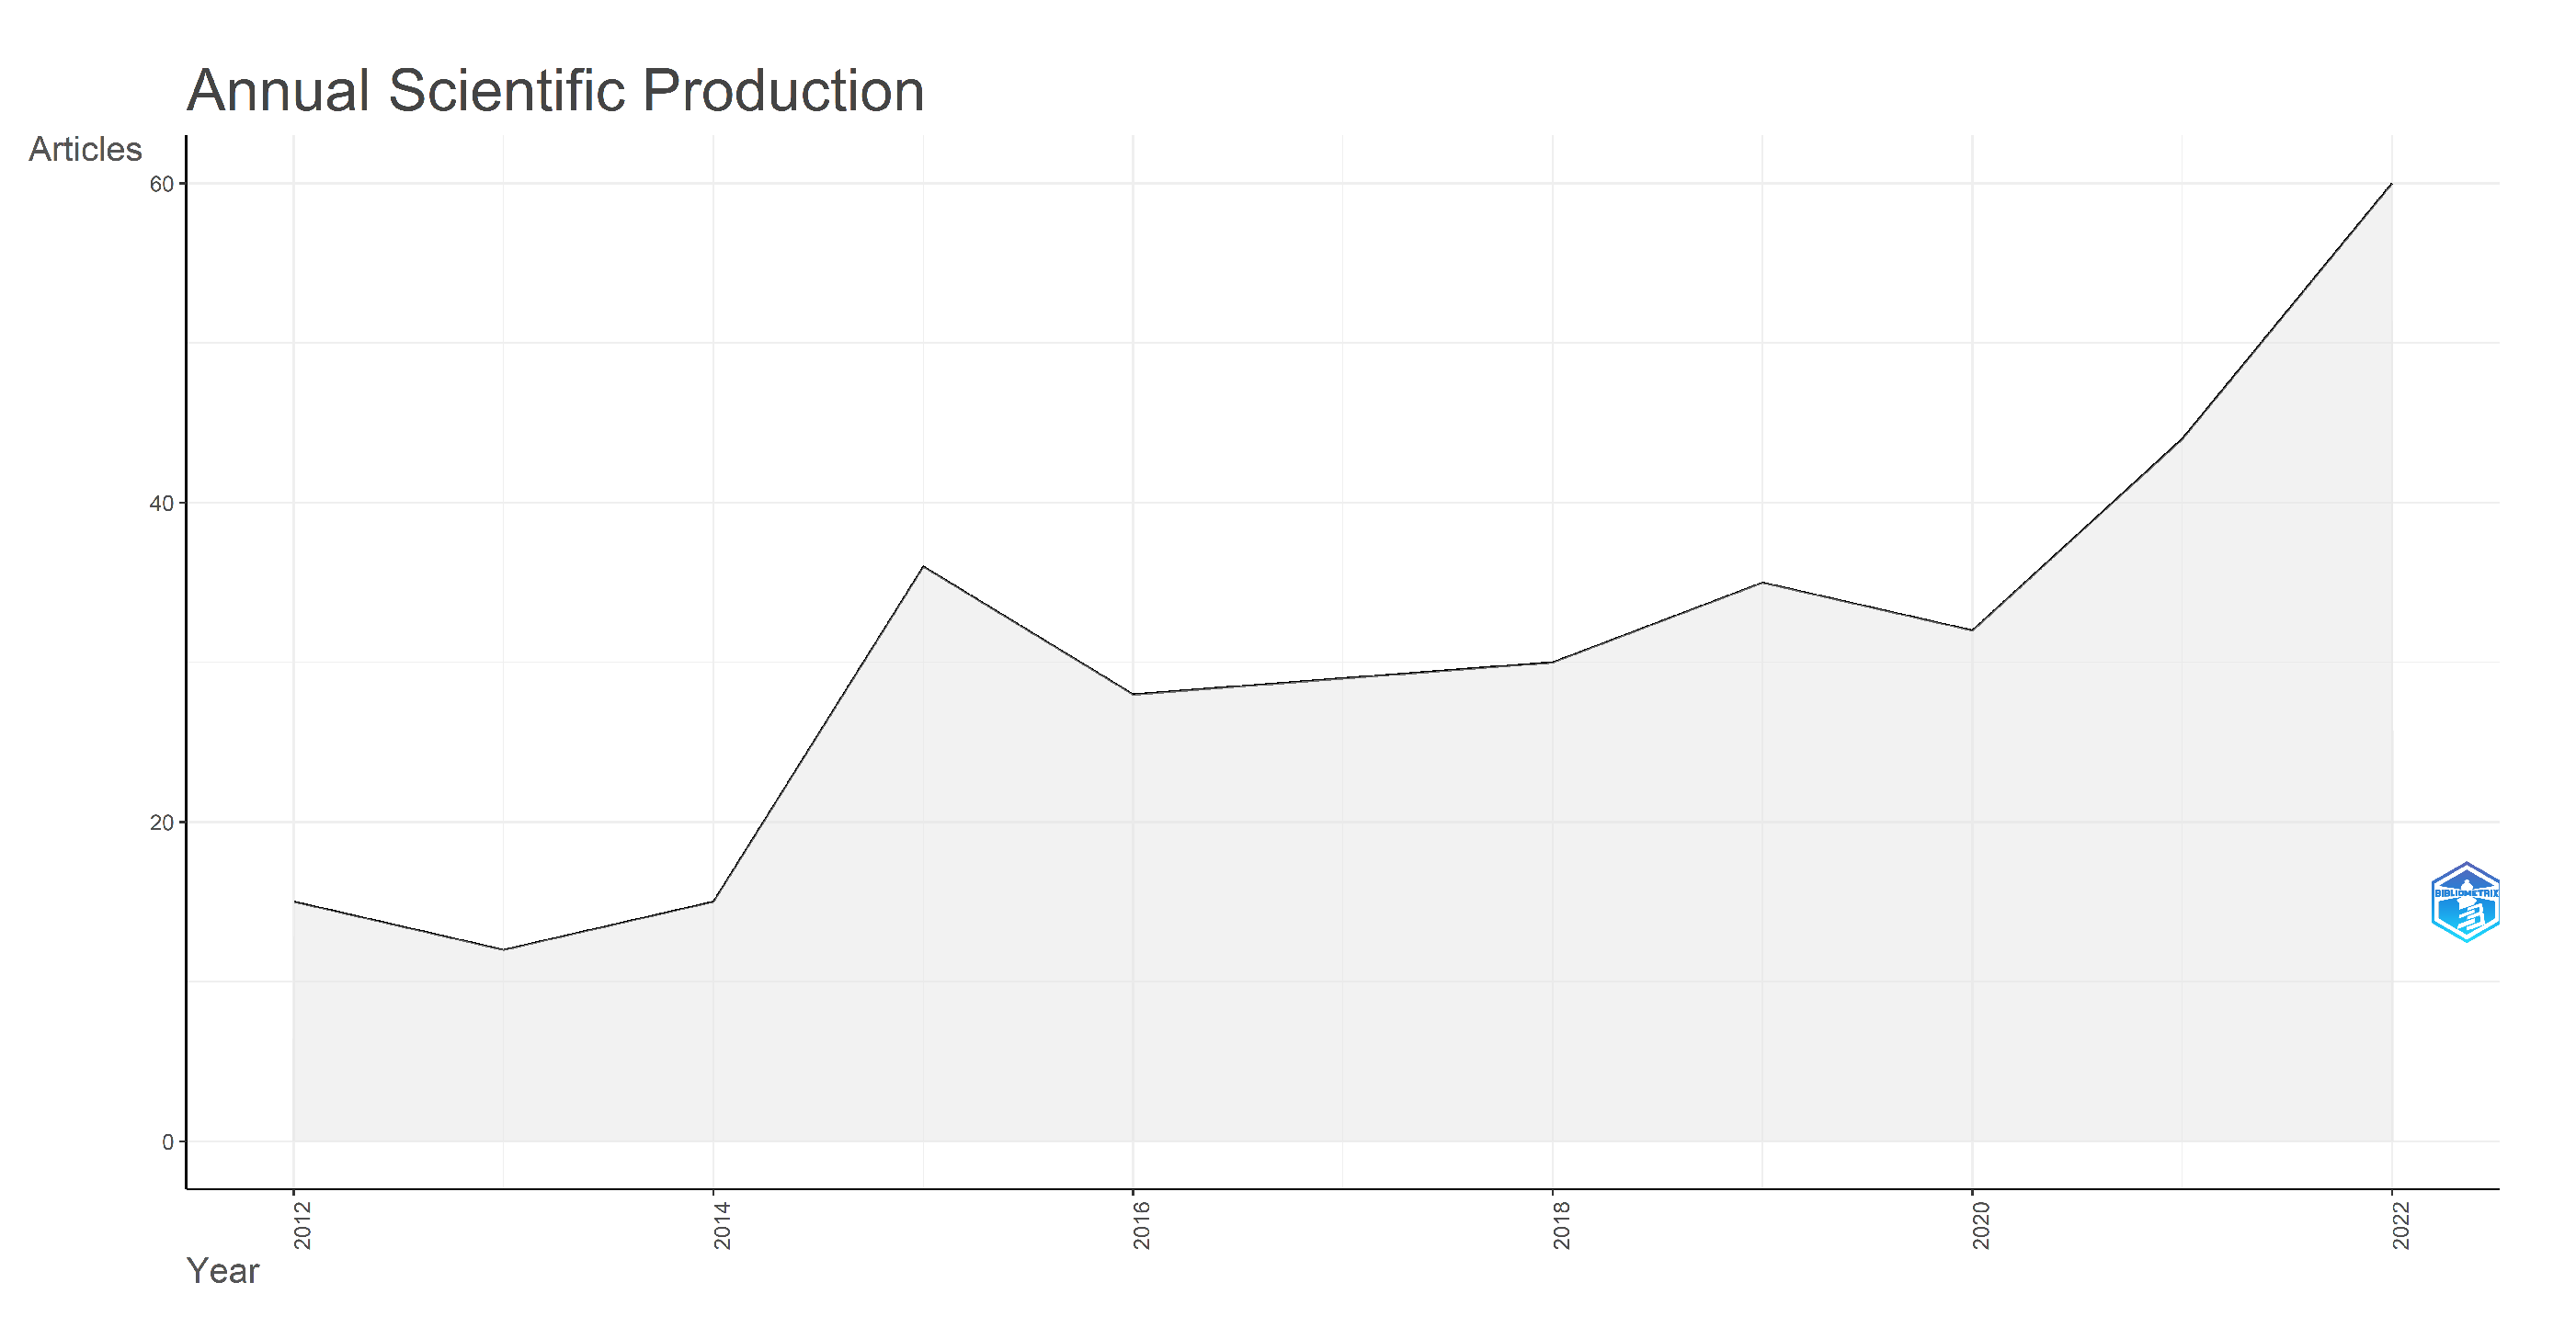
Figure 3 illustrates the yearly scientific output in software testing research. The production is overall increasing, with only 15 documents in 2012, the number of documents published in 2022 has reached 60 articles, with a growth rate of 14.87% every year.

5.1.3. Average Citation per Year

Figure 4 displays the average number of document citations per year. In 2012 the average was 0.98 citation per document. If we ignore the last 3 years, since the citations are not yet recorded and the documents are still new in this period of time, in 2019 the average citations per document was 6.54, with a growth rate of 26.78% every year.

5.1.4. Relationship between Countries, Authors, and Titles

The relationship between the nations, authors, and document keywords of the publications on software testing is depicted by the three-field plot. The diagram’s pertinent components were represented by rectangles in a range of colors. The height of the rectangles was decided by the sum of the relationships arising between the items that the rectangle represented. A considerable amount of information is flowing between a collection of values, as indicated based on the links’ thickness. As shown in Figure 5, the most significant research subjects on intelligent software testing have been written by authors from China, India, and the USA.

5.2. Science Mapping

5.2.1. The Most Productive and Top-Cited Sources

Figure 6 lists the top ten red sources with the most papers on intelligent software testing. The analysis shows the IEEE Access journal with 25 documents, the journal of systems and software with 12 documents, and the software quality journal with 12 documents.
Figure 7 reveals the top 10 most-cited sources for works in intelligent software testing. The bibliometric analysis listed the IEEE Transactions on Software Engineering journal as the most cited source with 684 citations, followed by the Lecture Notes in Computer Science book series with 453 citations, and with 331 citations, the third place was achieved by the Information Software Technology journal.

5.2.2. The Most Relevant Institutions

The publication output of organizations or author affiliations that contributed to the field of intelligent software testing was also evaluated as shown in Figure 8. With ten documents, the University of So Paulo took first place.

5.2.3. The Most Relevant Authors

The 10 most pertinent authors are shown in Figure 9. A total of 1053 authors published 336 documents in the field of intelligent software testing. Arcuri, A, and Gong, YZ, were the most productive authors with 6 publications and a fractionalized value of 2.09 and 1.73 respectively, followed by Chen, TY, and GAROUSI, V, with 5 documents and a fractionalized value of 1.14, and 1.73 respectively.

5.2.4. The Most Relevant Countries by Corresponding Authors

This study also took into account the nations where the related authors were published in relation to their contributions to the field of intelligent software testing, as shown in Table 2 and Figure 10. With 55 single-country publications, 12 multi-country publications, and the greatest frequency of 0.199, China was in first place. In terms of scientific productivity, China, India, and the USA are the top three countries worldwide.

5.2.5. The Most Globally Cited Authors

Local citations show how frequently a scholar in this selection has been referenced in other papers in the selection. To perform a more detailed examination of the source papers, local citation score and global citation score metrics were used. The frequency with which other articles in the collection mentioned the authors’ works in the WoS database was tracked by the local citation score. According to the global citation score, total citations represent the number of times the papers in this collection have been cited. The publications mentioned, nevertheless, didn’t always deal with intelligent software testing. The more local citation score, the more relevant the piece was to the domain [75]. The study also employed bibliometrics to look at the publishing output of the most widely read authors on the subject. As shown in Table 3 and with 326 total citations and a yearly average of 29,636 citations, Chen TY made it into the top. Findings also reveal that the majority of the most-cited papers have test data generation as a major theme.

5.2.6. The Most Globally Cited Documents

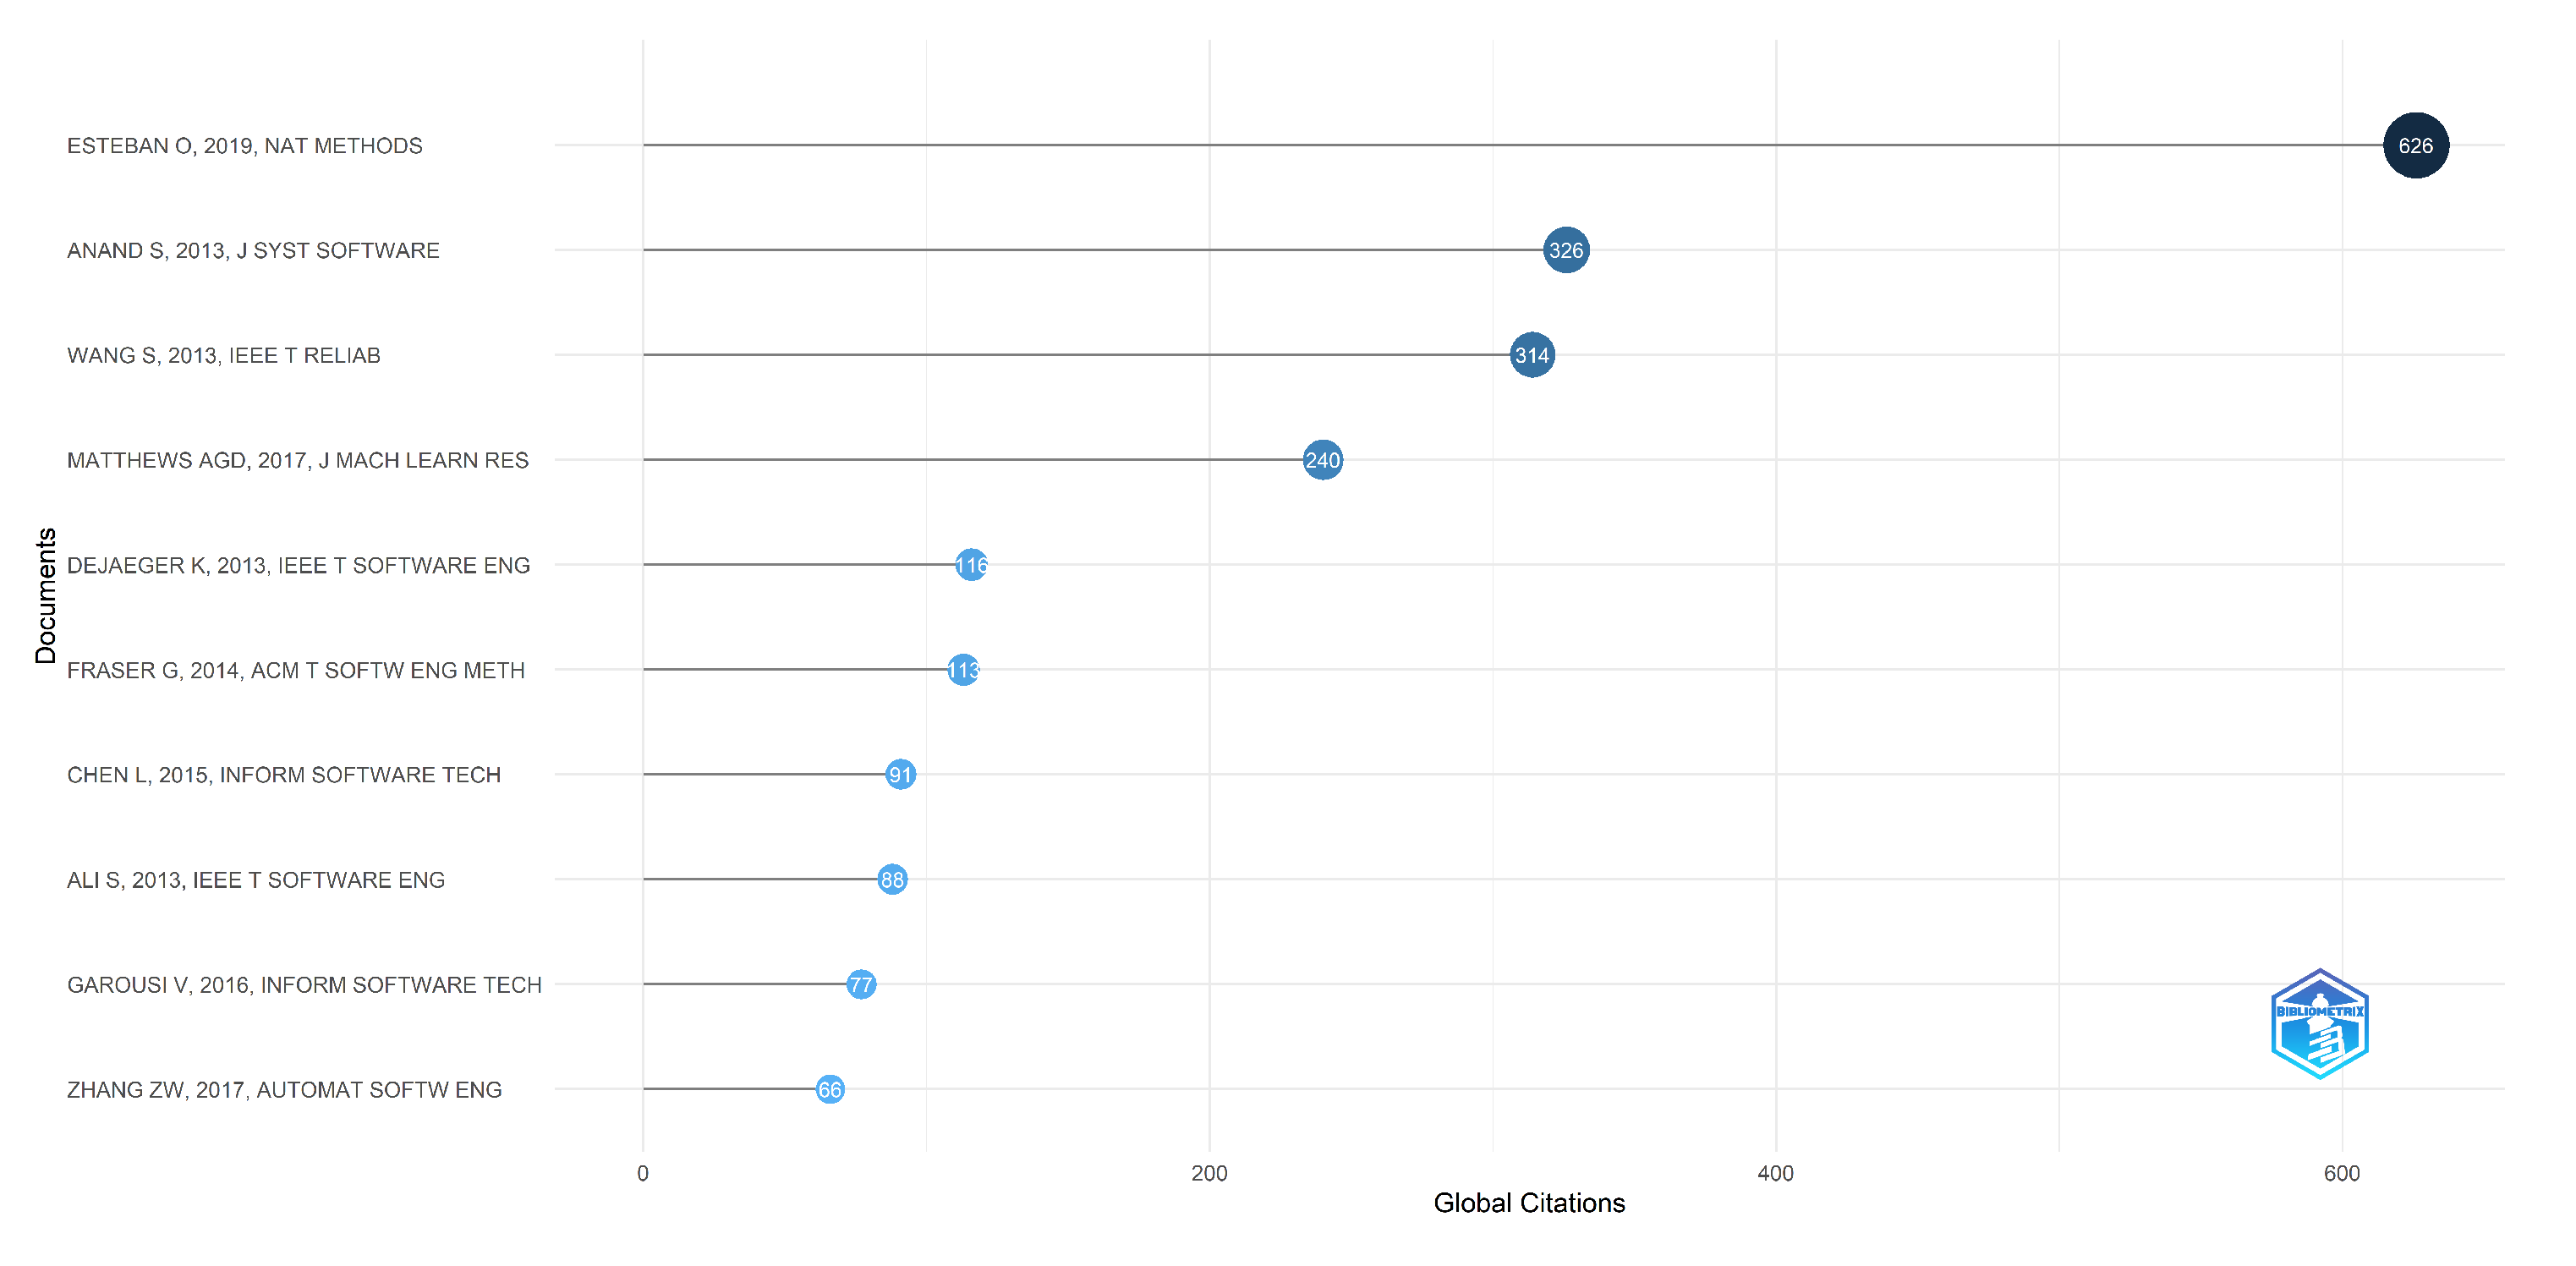
Globally cited documents means the number citations a given document has received by any other paper in the whole WoS Core Collection. Figure 11 shows the most globally cited documents. A paper by Esteban, O published in 2019 in Nature Methods Journal ranked first with 626 citations.

5.2.7. The Most Locally Cited Documents

The amount of citations a particular document has gotten from any other paper in the investigated dataset is referred to as its local citation count, in our case, the field of intelligent software testing. Figure 12 shows the most locally cited documents. The paper entitled “An orchestrated survey of methodologies for automated software test case generation” published by Anand, S, in 2013 ranked first with 28 citations.

5.2.8. Frequency Distribution of Scientific Productivity (Lotka’s Law)

This bibliometric analysis calculates the Lotka’s law coefficients for the publications about intelligent software testing. The link between authors and the quantity of articles published is described by Lotka’s law. The distribution of writers across time or within specific informatics subject areas is described by Lotka’s law [75]. Figure 13 illustrates Lotka’s Law’s frequency distribution of scientific output. Table 4 shows how Lotka’s law is considerably followed by the number of publications and the frequency of authors in the topic under consideration.

5.2.9. The Most Frequent Words

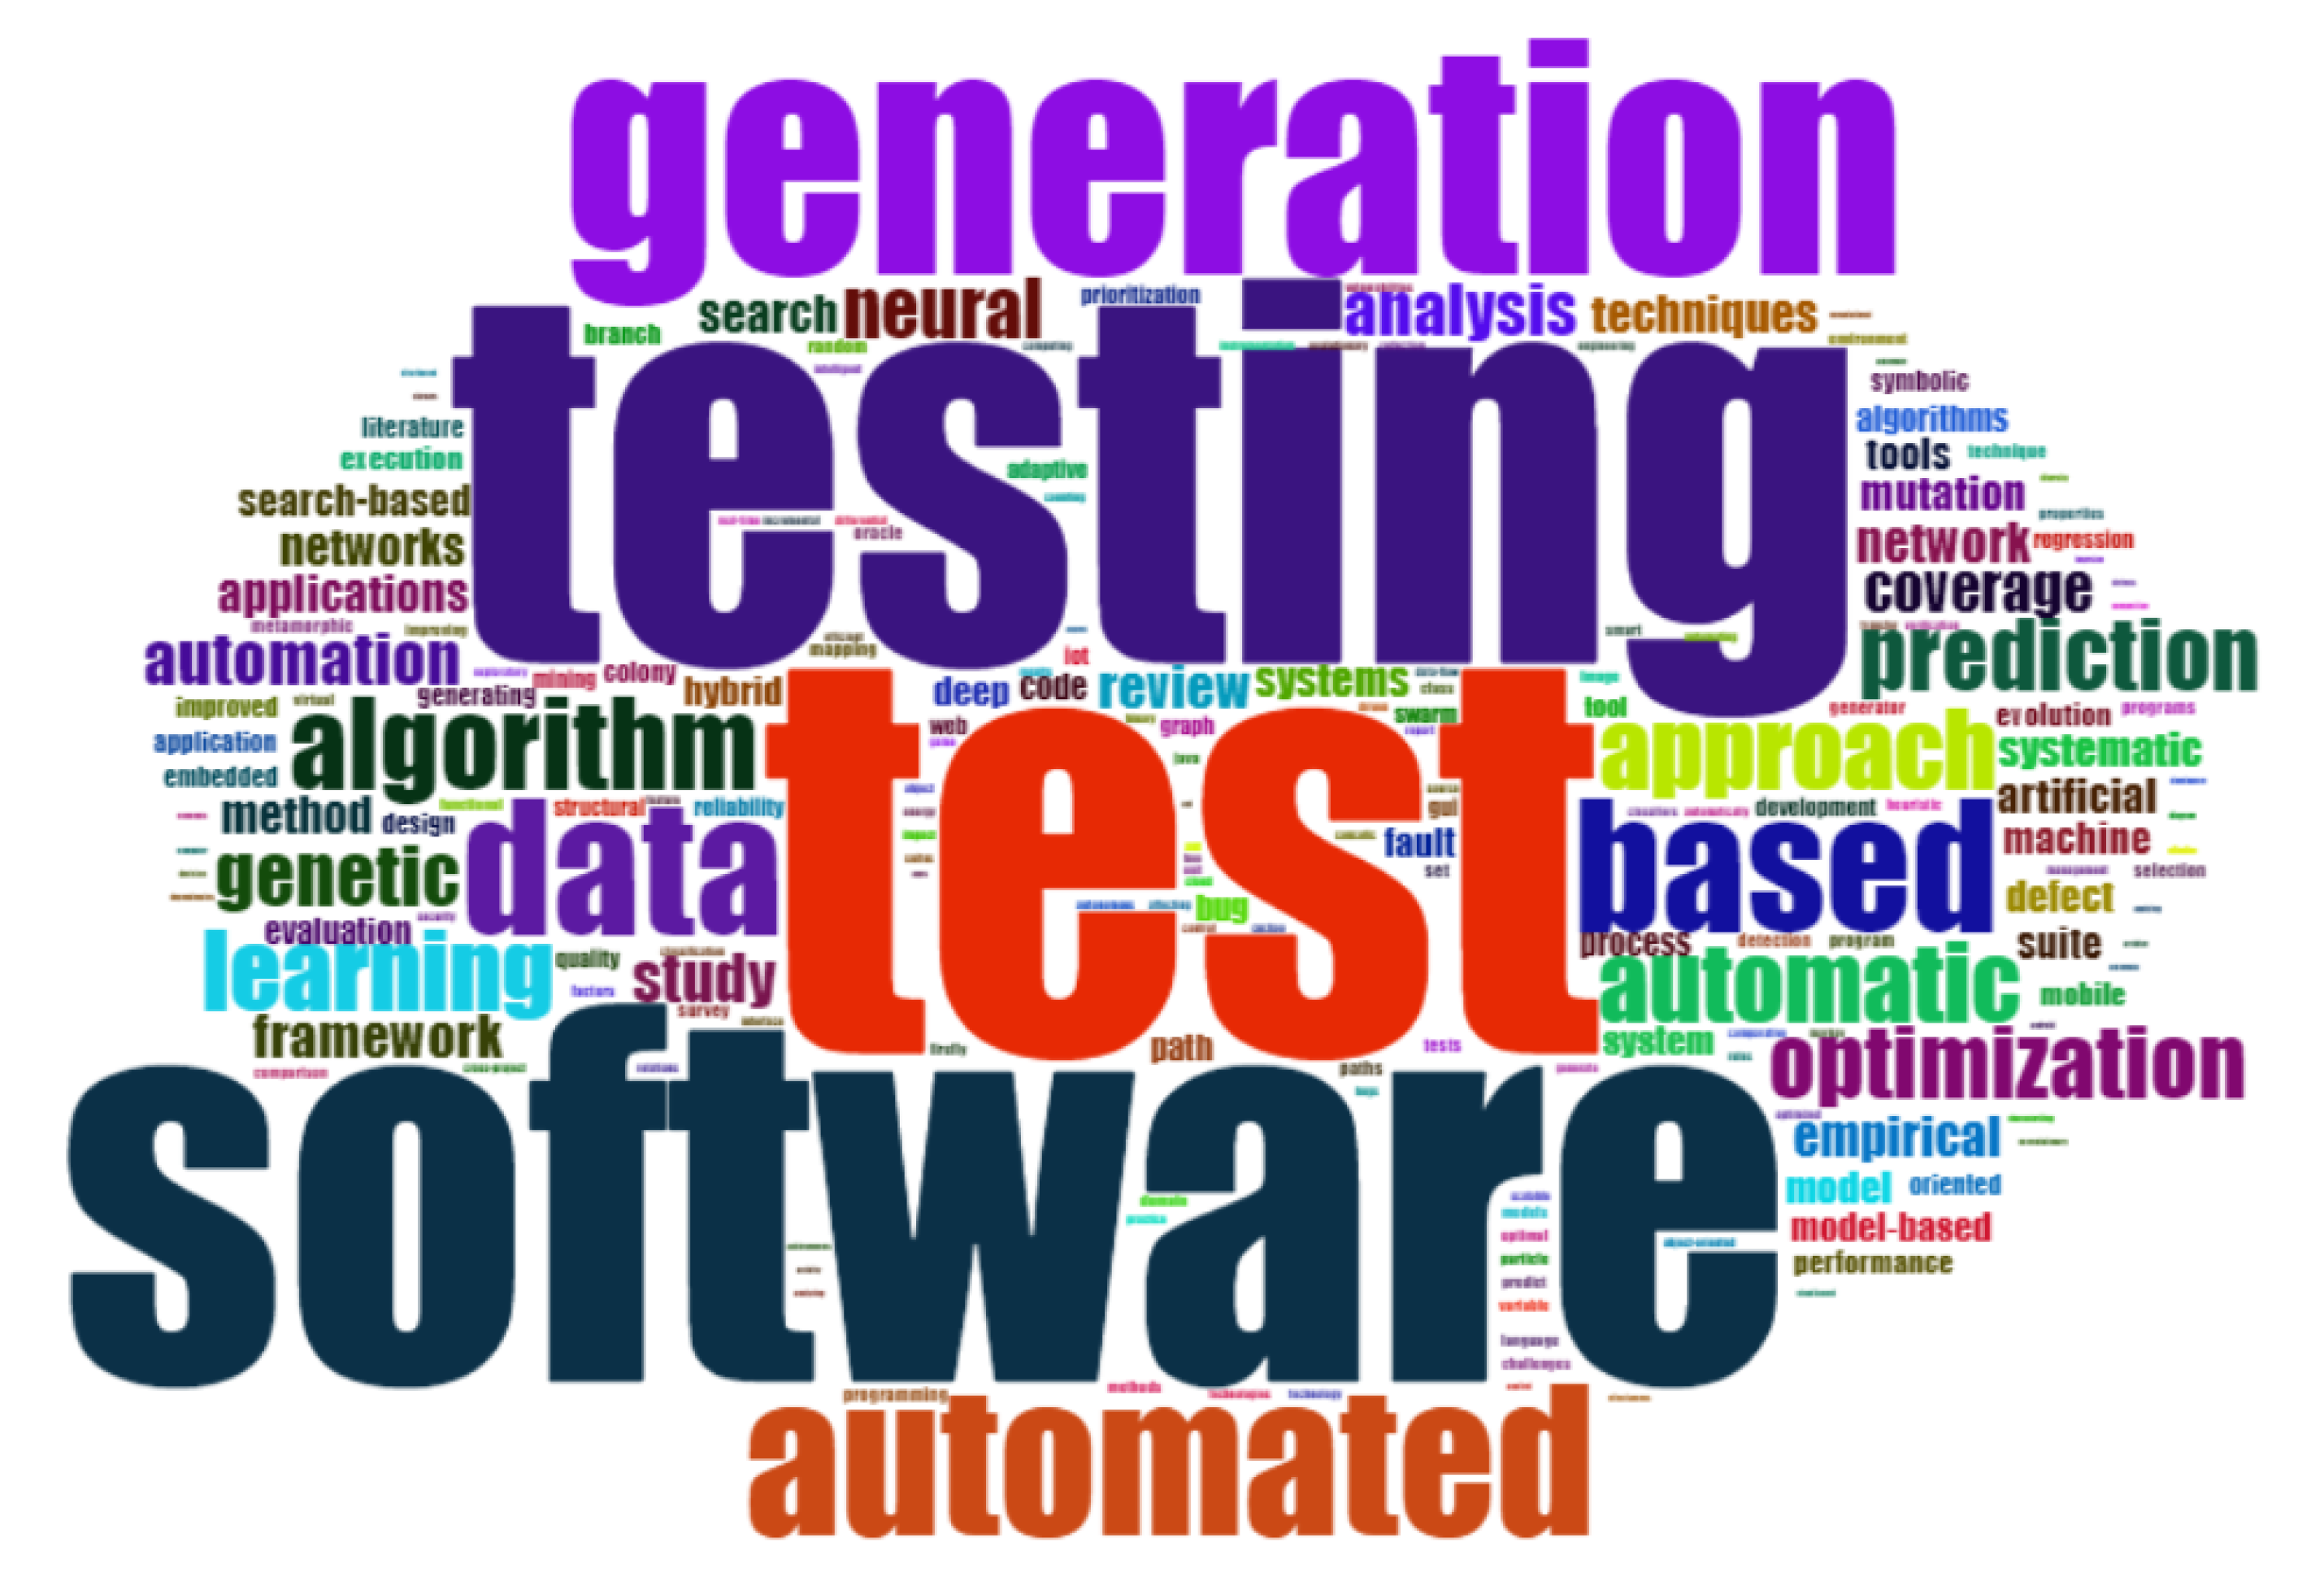
“test" and “testing" were the most often used terms by authors, with a total of 270 occurrences combined, followed by “software" with 128 occurrences. Figure 14 shows the most used words in the field of intelligent software testing. Figure 15 shows the word cloud of the most frequently used keywords in the research about the studied field.

5.2.10. Keywords Co-Occurrence Network

The keywords co-occurrence network is shown in Figure 16. A keyword is represented by each node in the network. The size of the node shows the frequency of the keyword (the frequency with which the keyword appears), The co-occurrence of terms is represented by the link between the nodes (terms that appear together or co-occur), and the thickness of the relationship indicates the occurrence of keyword co-occurrences (the frequency with which two or more terms appear together). A thematic cluster is represented by each color. Software testing, Software, genetic algorithm, test data generation and machine learning are the most occurring keywords in different clusters.

5.2.11. Collaboration World Map and Network

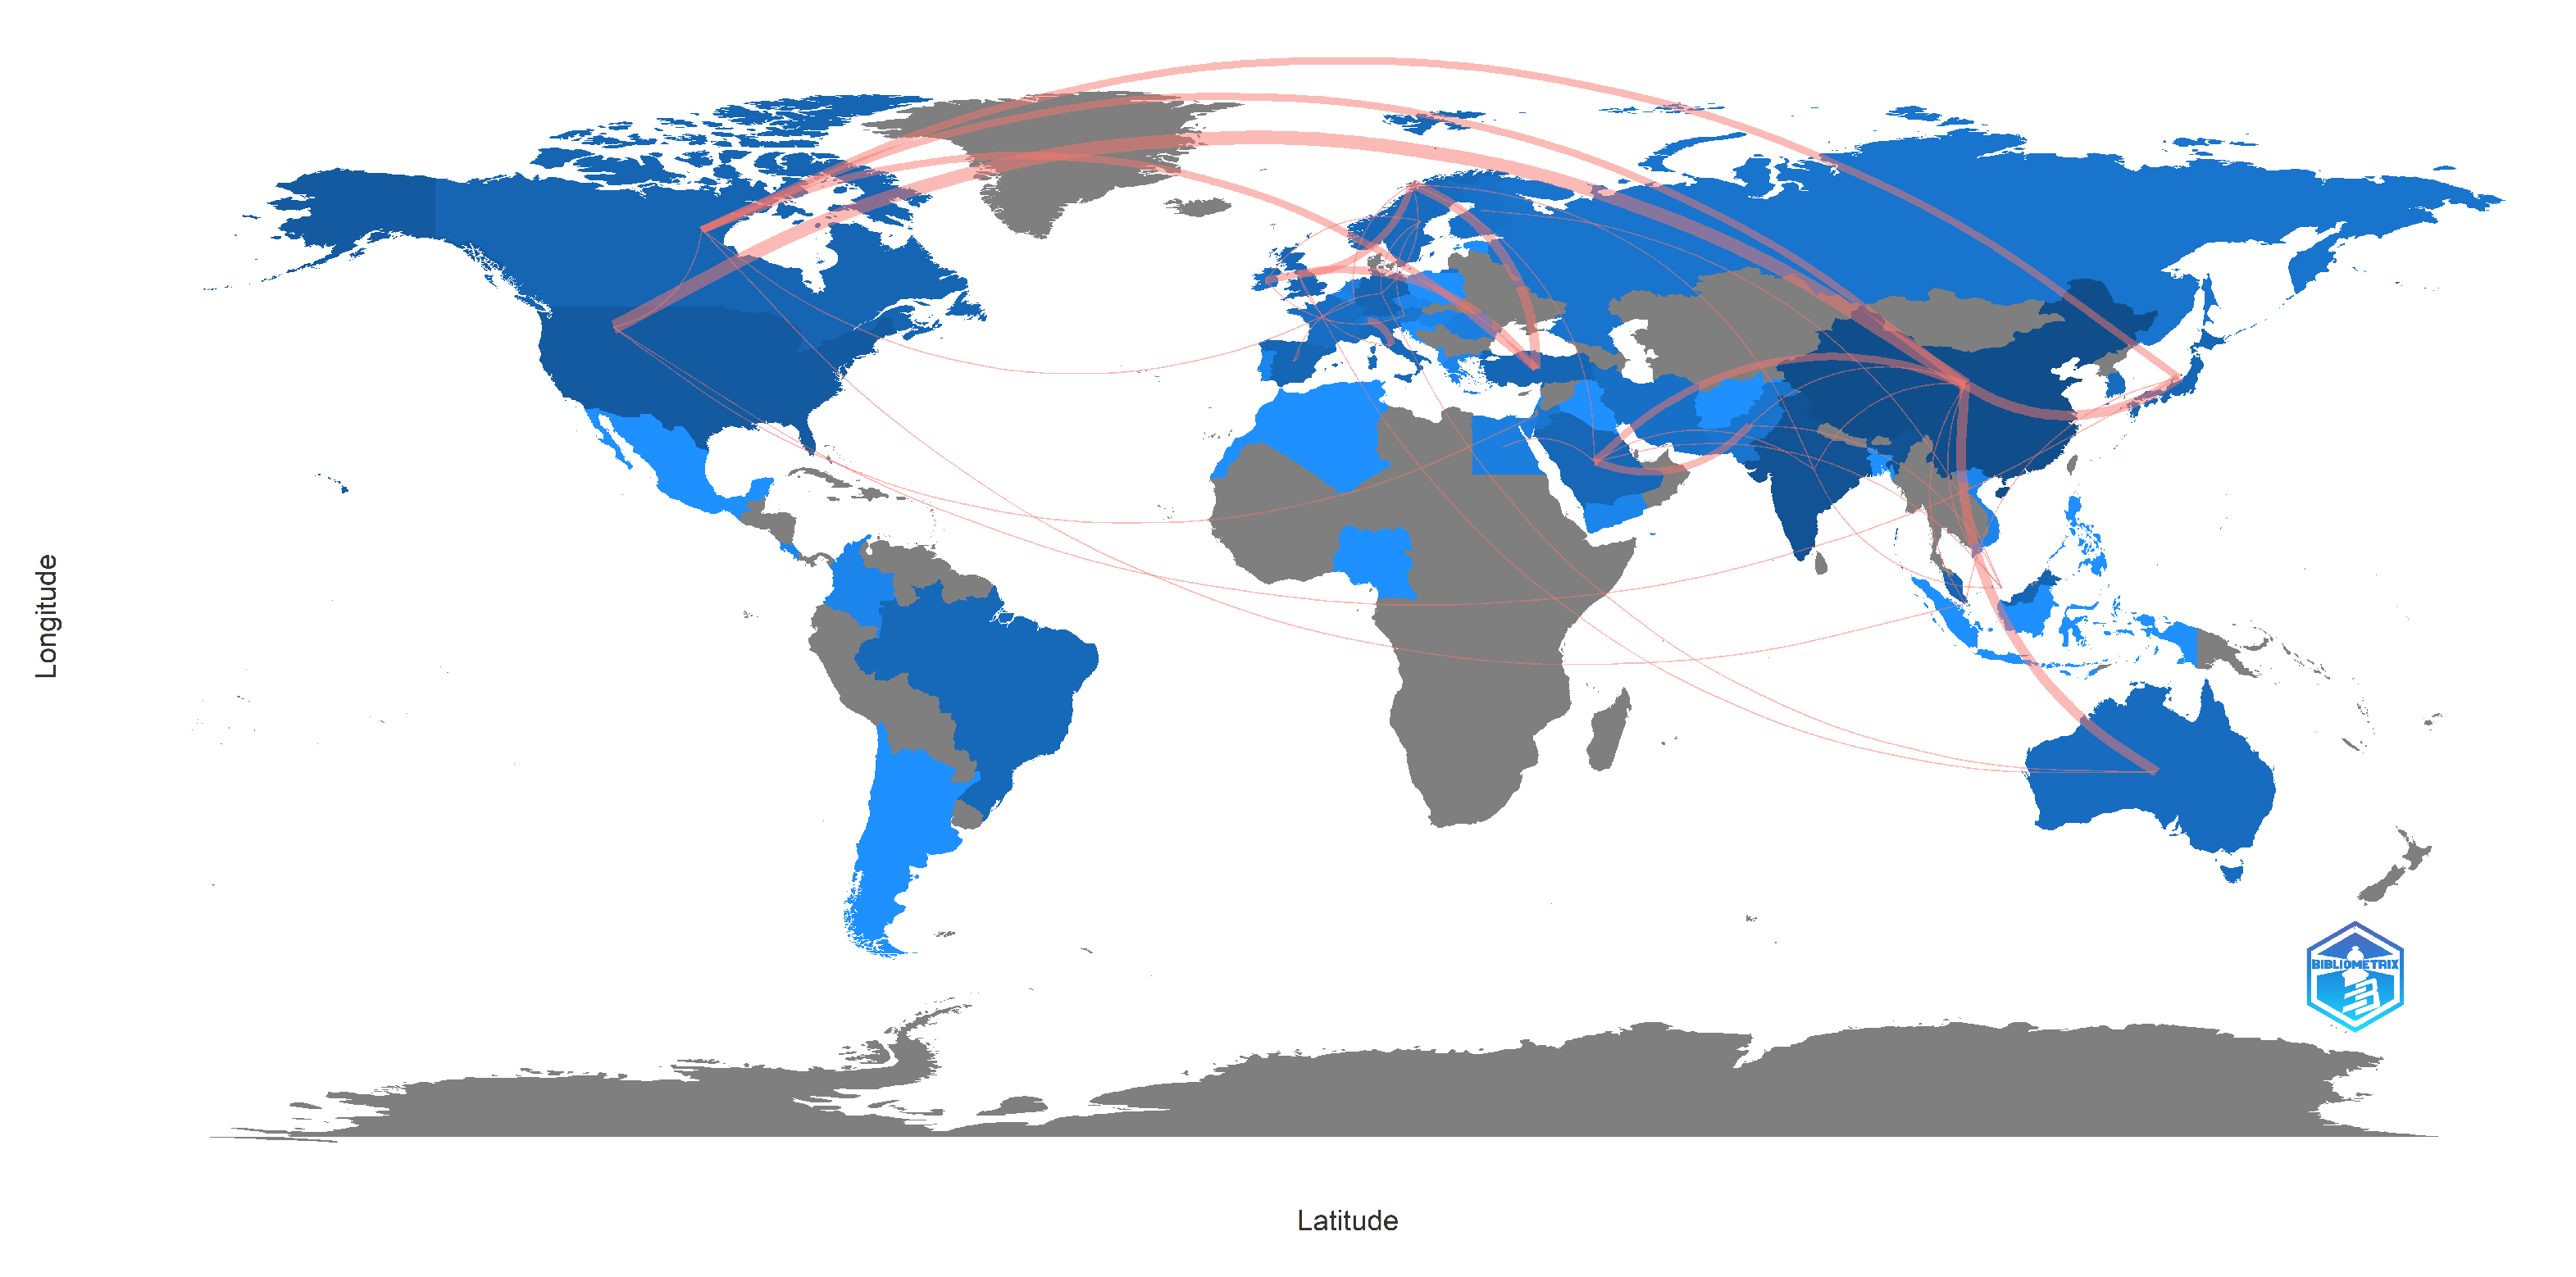
As shown in Figure 17 and Figure 18, China is in the center of the biggest cluster of collaborations, followed by India and the USA. A second cluster can be seen between Turkey, Austria, Sweden, Iran, and Finland. And a third one between Norway, Luxembourg, the United Kingdom, Italy, Switzerland and Australia.

5.2.12. Organisations Co-Authorship

Figure 19 shows the collaboration between organizations in terms of co-authorship. The network is divided into 8 clusters, here are the top three:
  • Cluster 1:
    The Certus Centre for Software Validation and Verification
    Korea Advanced Institute of Science & Technology
    Kyungpook National University
    Nanjing University of Aeronautics and Astronautics
    Simula Research Laboratory
    University of Luxembourg
    University of Milano-Bicocca
    University of Ottawa
    University of Sheffield
  • Cluster 2:
    Blekinge Institute of Technology
    Ericsson AB
    Mälardalen University
    Queen’s University Belfast
    Technical University of Clausthal
    University of Innsbruck
  • Cluster 3:
    McGill University
    Microsoft Research
    Stanford University
    University of Cambridge
    University of Edinburgh
    University of Oxford

5.2.13. Authors Co-Citation Network

A network of authors’ co-citations is shown in Figure 20. The network is divided into 4 clusters representing the co-citations between authors. Garousi, V, is the most cited author in Cluster 1. Harman, M, is the most cited author in Cluster 2. Chen, Ty, is the most cited author in Cluster 3. And Fraser, G, is the most cited author in Cluster 4.

5.2.14. Journals Co-Citations Network

Figure 21 displays a network of journal co-citations. In the network, there are 6 clusters representing the co-citations between journals. The IEEE Transactions on Software Engineering journal is the most cited journal, followed by the Lecture Notes in Computer Science book series, and the Information and Software Technology Journal.

5.3. Network Analysis

5.3.1. Thematic Map

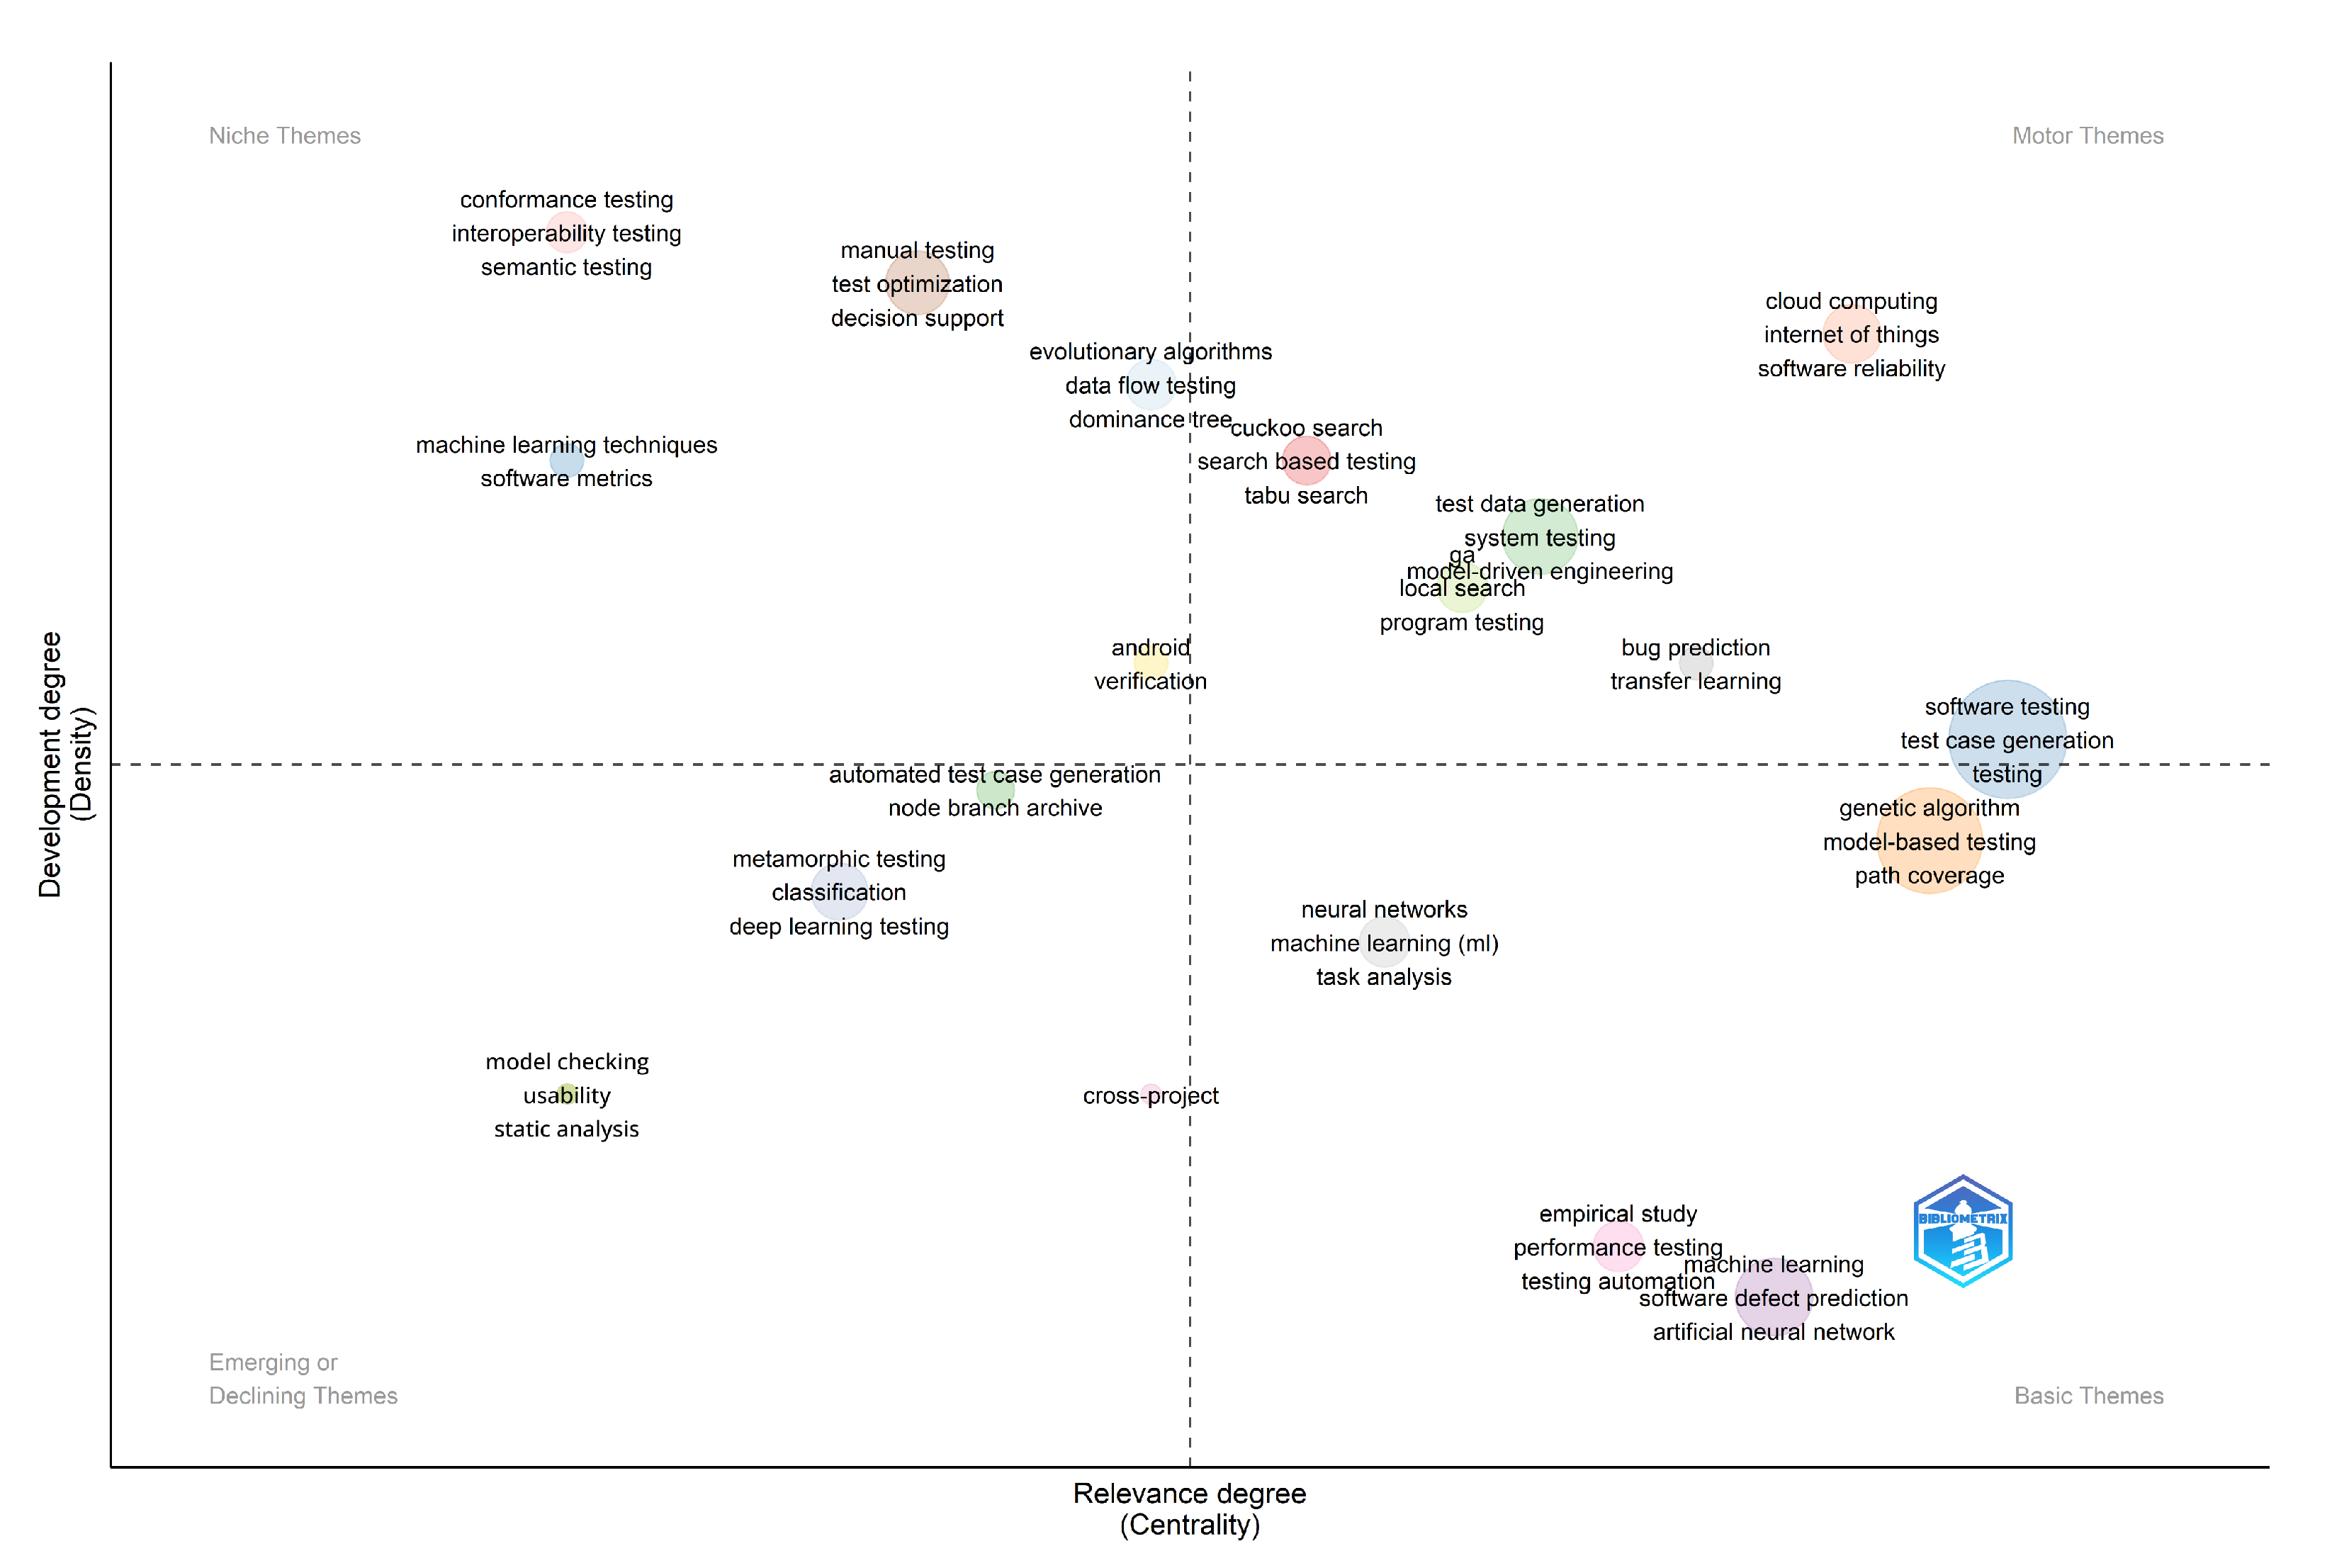
Thematic maps are keyword clusters that can be arranged into a single circle and mapped as a two-dimensional image using their density and centrality. A thematic map is divided into quadrants according to their locations as seen in Figure 22. There are motor themes in the upper-right quadrant which have keywords with the highest development and relevance degree. Basic themes are in the lower-right quadrant which are keywords with a high relevance degree and a low to medium development degree. Emerging or decreasing topics are in the lower-left quadrant, they are keywords that have low to medium relevance and development degree. Niche themes are in the upper-left quadrant, these are keywords with high development degree but could be not very relevant.

5.3.2. Multiple Correspondence Analysis

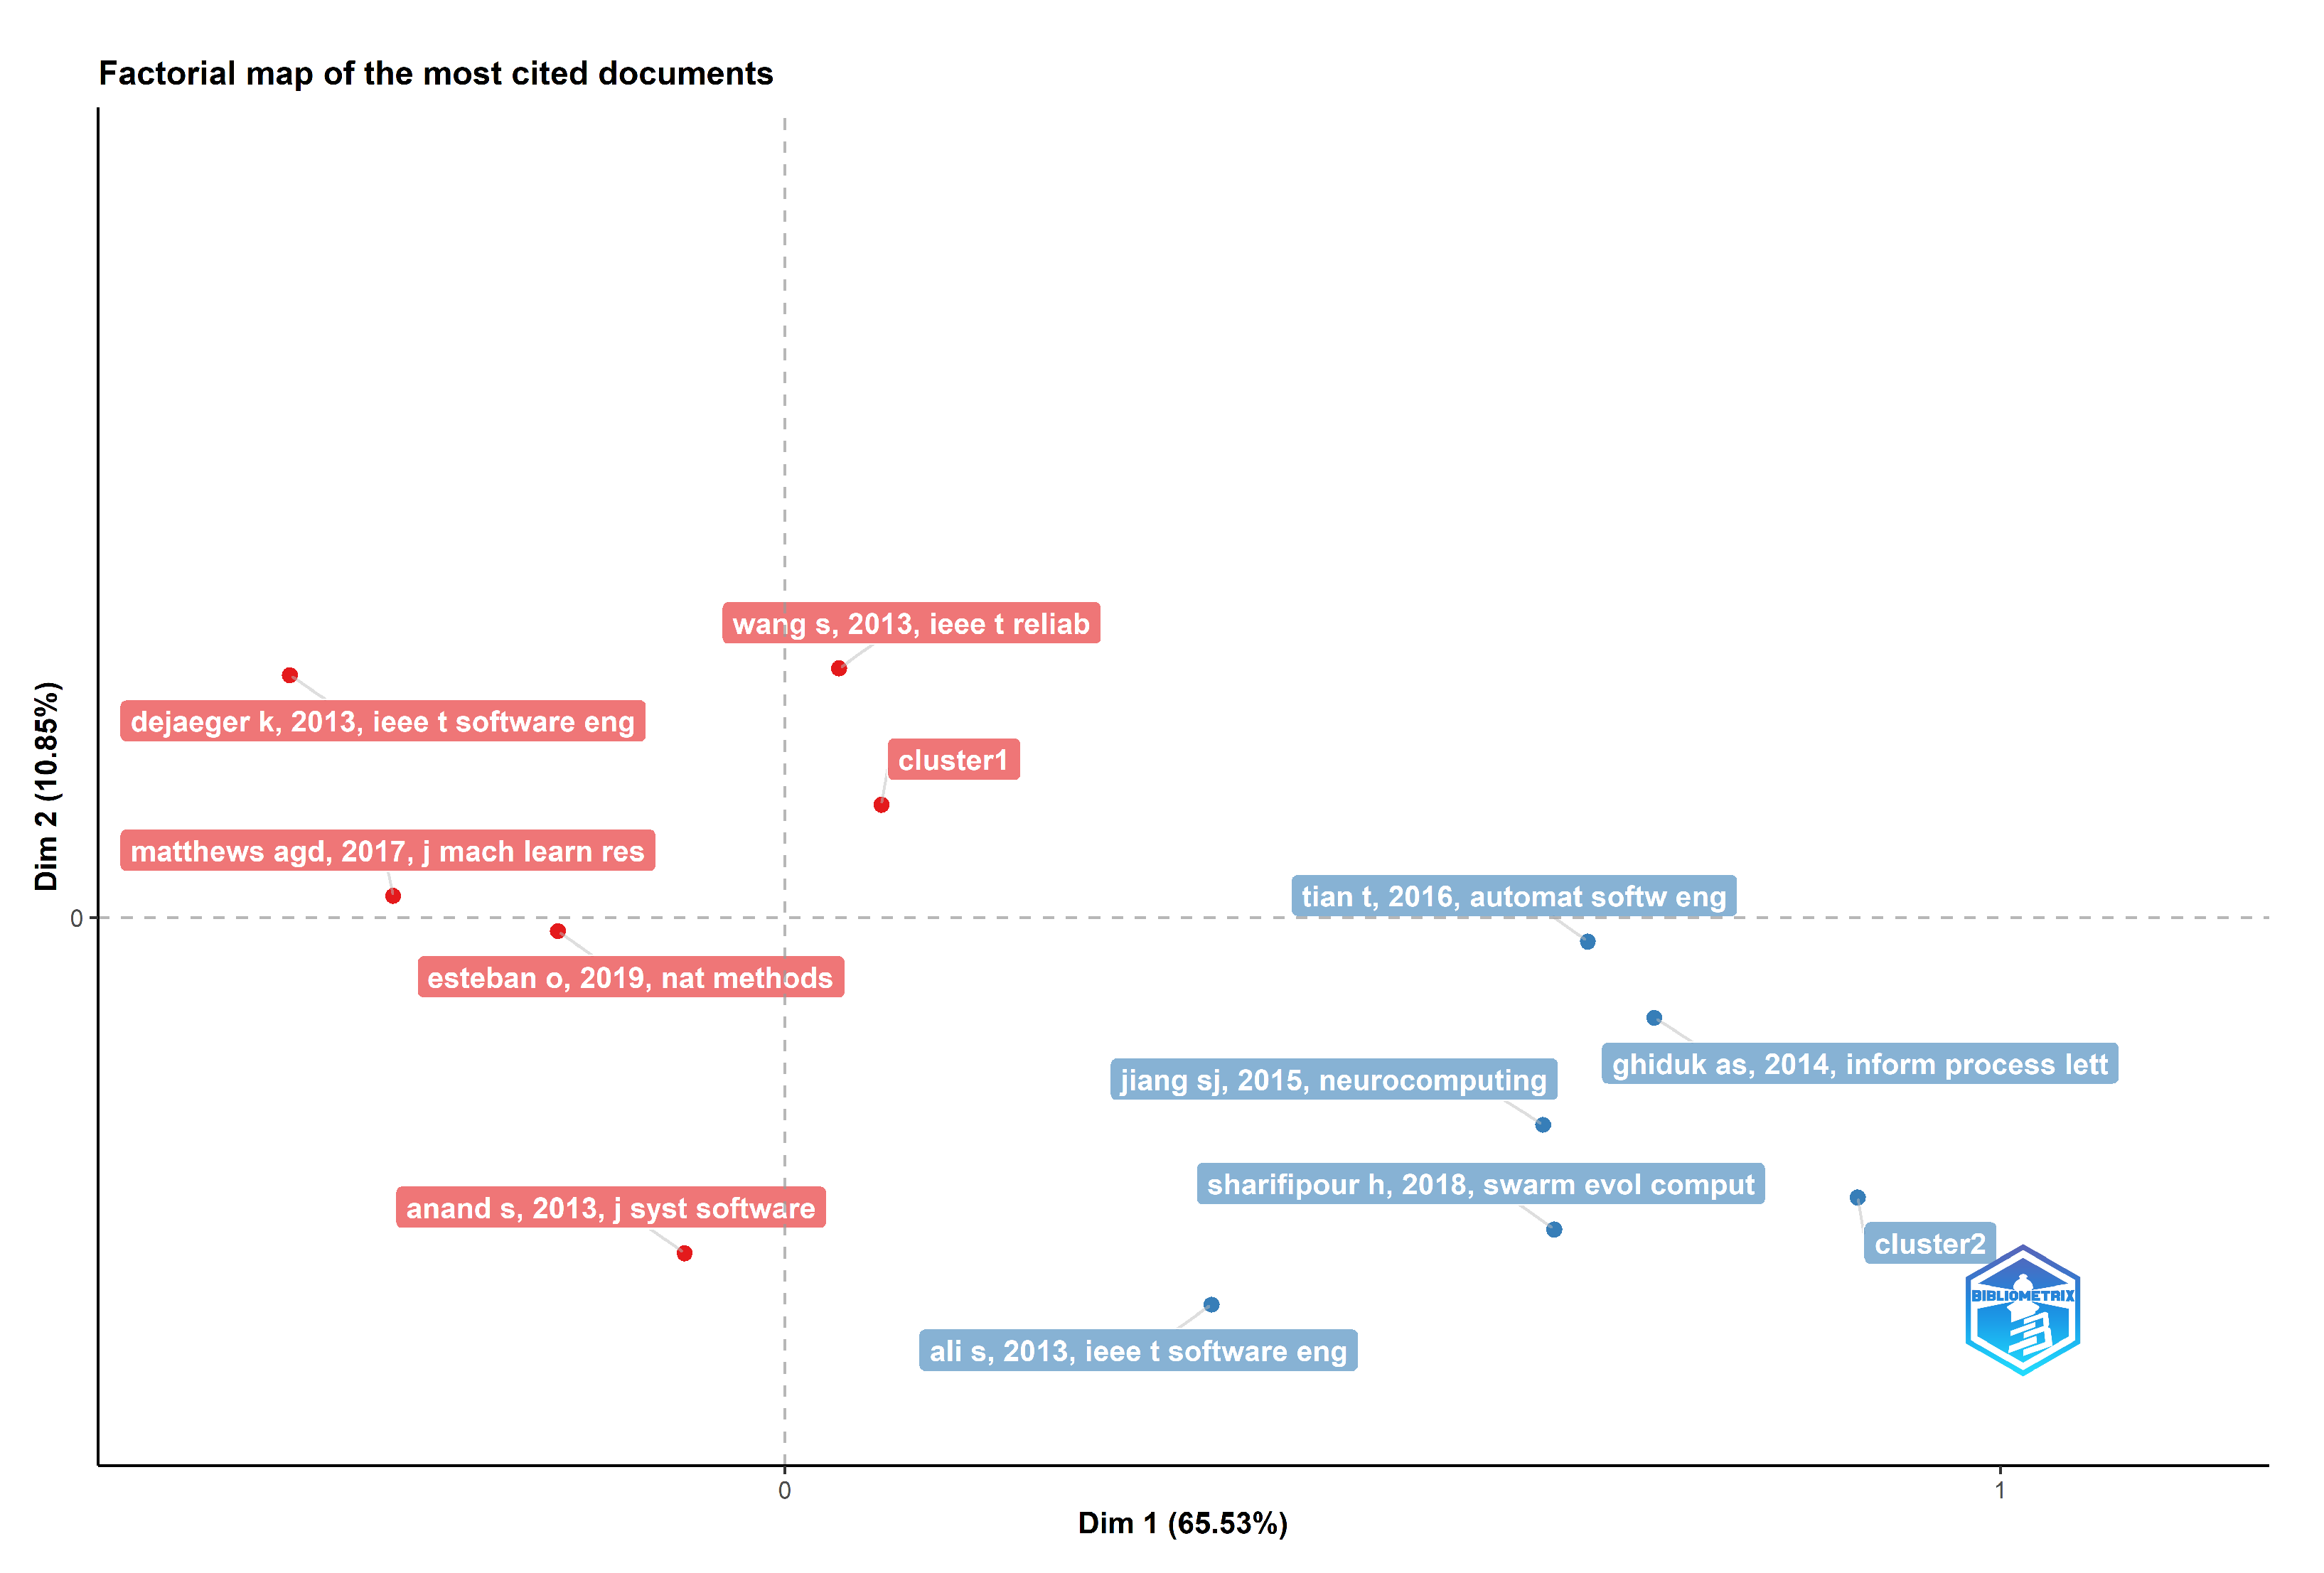
As explained in Section 4, MCA is used to analyze multivariate categorical data graphically and mathematically. In order to identify new latent variables or factors, it examines the interrelationship of a collection of categorical data. The results are interpreted using the relative positions and distribution of the dots along the dimensions; the nearer the words are placed in the Figure 23, Figure 24 and Figure 25, the more comparable the distribution is.
In Figure 23, the papers were analyzed based on unigrams from their abstract, and then ranked based on their total citation number. We can distinguish two clusters of papers: Cluster 2 with 26 papers, and cluster 1 with 310 papers. Only the 5 most cited papers from each cluster are shown in the figure, the rest are hidden inside the “Cluster1” and “Cluster2” dots, for a better visibility.
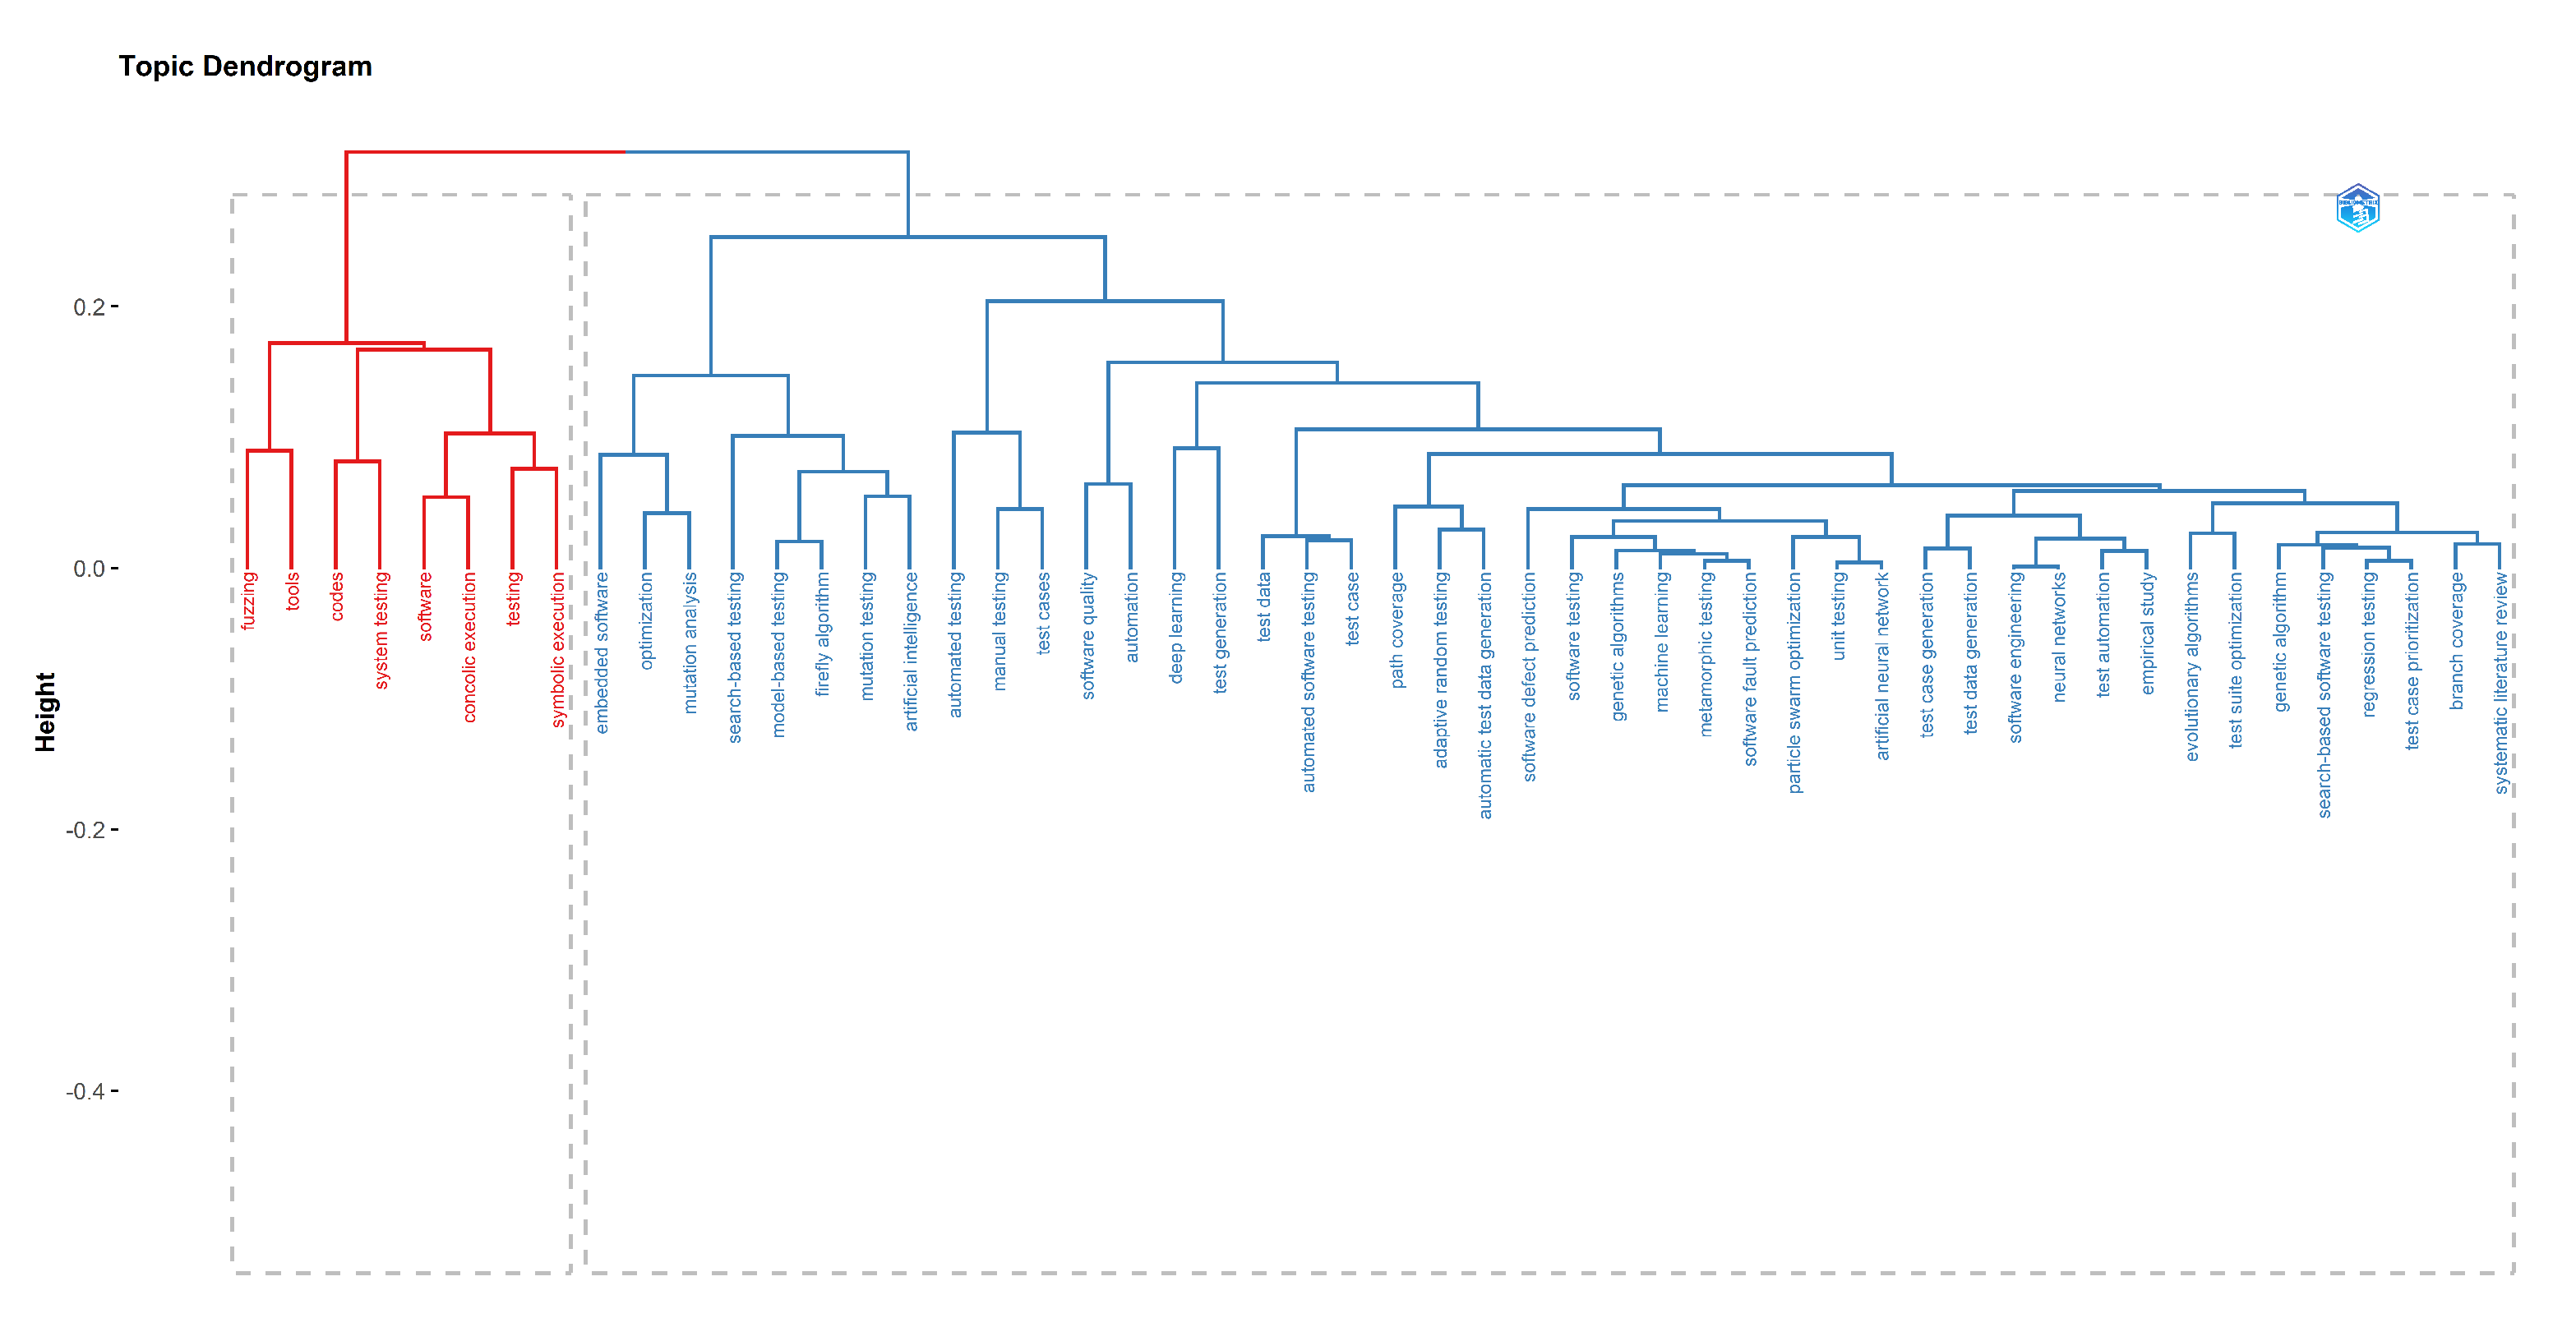
In Figure 24 and Figure 25, the topic dendrogram and the conceptual structure map were generated based on the Keywords Plus of each paper. The y-axis represents the height, which is the distance between the words. Each group of words represents the same topic. We have two clusters of words: Cluster 1 with 5 words related to the challenges and considerations of systems engineering. Cluster 2 has 65 words related to the technical aspects of software engineering and testing.

5.3.3. Correspondence Analysis

We identified in Section 4, what correspondence analysis is and what is used for. It is a visual method of examining how a contingency table’s variables relate to one another. It offers a method for reducing and representing data sets with two-dimensional graphs. As shown in Figure 26, Figure 27 and Figure 28, the objective is to create a comprehensive data picture that can be used for interpretation.
Figure 26 was generated using unigrams from the abstract of the papers, and then ranked based on their total citation number. We have found two clusters of papers: Cluster 1 with 326 papers, and Cluster 2 with 10 papers. Only the 5 most cited papers from each cluster are shown in the figure, the rest are hidden inside the “Cluster1” and “Cluster2” dots, for a better visibility.
In Figure 27 and Figure 28, the topic dendrogram and the conceptual structure map were generated based on the author’s keywords of each paper. The y-axis represents the height, which is the distance between the words. Each group of words represents the same topic. We have two clusters of words: Cluster 1 with 1 word which is “empirical study”. Cluster 2 has 51 words related to software testing and artificial intelligence techniques.

5.3.4. Multidimensional Scaling

Figure 29 and Figure 30 illustrate the use of multidimensional scaling (MDS), which is, as covered in Section 4, a technique for multivariate data analysis, to visualize sample similarity and dissimilarity by plotting points in two-dimensional plots. The MDS algorithm receives input data from the dissimilarity matrix, which indicates the distances between pairs of objects.
In Figure 29 and Figure 30, the topic dendrogram and the conceptual structure map were generated based on the author’s keywords of each paper. The y-axis represents the distance between the words. Each group of words represents the same topic. We have two clusters of words: Cluster 1 with 8 words related to the field of software testing, verification, reliability, and performance. Cluster 2 has 44 words related to software testing techniques and multiple artificial intelligence algorithms.

6. Discussion

The results of this bibliometric analysis and content studies have generated several inferences and implications that have sparked a large amount of debate. This study has been done over 336 papers related to intelligent software testing written by 1053 authors over the time-span: 2012–2022. With a growth rate of 14.87% every year, and an average citation rate of 6.54. The figures show that most documents were co-written, with only 1.9% of them being single-authored, demonstrating a very high level of collaboration in this field.
The three-field plots utilizing three key metadata fields offer valuable insights on the connection between domains, such as linking authors’ work to specific keywords and countries involved in the research field; an example of this would authors Arcuri, A., and Gong, Y.Z., from Norway, and China respectively had the greatest influence on the study of intelligent software testing. Our findings also point to a close connection between the topic studies in China, India, and the USA.
The results also showed six clusters of keywords, each of them having nine or more words. cluster one has 13 words related to software testing, test case, and synonyms and types of testing. Cluster two has 12 keywords which are about test case generation and other types of software testing. Cluster three has 11 keywords focusing mainly on artificial intelligence, such as natural language processing, machine learning, neural networks, and prediction. 9 keywords are present in cluster four, closely linked to algorithms. Cluster five has 9 keywords with a focus on automation and tools. Cluster six contains keywords about prioritization and coverage. These results reflect the extensive use of artificial intelligence in order to improve the quality of testing in software engineering.
Thematic maps depict the structural and dynamic components of a research domain using knowledge frameworks. They were used to create conceptual structures that outlined the key themes, subjects, and intellectual frameworks that categorized how an author’s work influenced this scientific community. These conceptual structures served to provide a thorough overview of the significant trends and findings in software testing research. Another of its useful uses could be the examination of how ideas or circumstances change through time. This approach offers scholars a list of the most well-known papers for each subject cluster, which can be used to focus study on a particular theme. The scientific map can offer data on the importance of the topics based on centrality and density, allowing predictions of the themes’ potential future growth.
The bibliometric analysis’s findings show that a small group of authors are responsible for the most famous works. Since the majority of papers are open access, contributions are quickly shared with the public and as the topic advances, a large number of writers emerge. It’s also important to notice that the topic is becoming more and more cited (with 626 citations for the most cited paper), which shows how important it is right now. China, India, and the USA take the top three spots for scientific output in this field. These results are not surprising given that these nations lead Nation Rank’s rankings for worldwide scientific productivity in all categories [76]. The results show that even the most productive researchers use a variety of approaches and expertise, demonstrating the interdisciplinarity of the study. In order to effectively transfer knowledge to all players, journals must be both effective and comprehensive. Our analysis revealed that “The IEEE Transactions on Software Engineering” and “Lecture Notes in Computer Science” were the two sources with the most citations on the subject.
This study was restricted to articles that dealt with intelligent software testing and were indexed in the Web of Science Core Collection database. Whereas comparing datasets from several databases is outside the focus of this study, searching them may provide different sets of items, and the outcomes of this analysis may vary.
In conducting this study, the authors made an effort to exhaustively search for all relevant material related to the topic. Despite this, the study has several restrictions, including: a search period limited to 2012–2022; reliance on the WoS database which may not capture all indexed journals and potentially miss relevant publications; limitations in the search process which could lead to false positive or negative results; and a focus on English language papers which may introduce a bias towards English-speaking nations.

7. Conclusions

In this bibliometric analysis paper, 336 publications from 2012 to 2022 have been examined in light of 15 research questions. By examining data from the Web of Science database, this paper compared and evaluated the worldwide research production related to intelligent software testing. It also identified the most influential researchers worldwide and mapped their geographical distribution and publications. We utilized VOSviewer and the Biblioshiny program from the Bibliometrix package for R were used to analyze the data and provide great visualization in order to facilitate her gathering of insights. The scientific publication trends show a growth rate of 14.87% every year, with an average citation rate of 6.54. The top three countries for this field’s scientific production were China, India, and the United States. The studied field has a high level of collaboration, with only 1.9% of single-authored papers. “The IEEE Transactions on Software Engineering” and “Lecture Notes in Computer Science” were the two sources with the most citations on the subject.
Our results should be able to shed light on potential future research directions and perspectives in the quickly growing field of software engineering by providing a thorough summary of the trends connected to research in intelligent software testing. There are several prospects for considerable future work.
The results also reveal that machine and deep learning algorithms such as neural networks and natural language processing (NLP) are heavily used techniques for intelligent software testing, and that the research in this area has the potential to address some of the key challenges faced by software testing professionals. Although, there are many other AI techniques that can be applied to software testing, such as genetic algorithms, fuzzy logic, and deep learning. Future work could explore the potential benefits of these techniques for improving software testing efficiency and effectiveness. The paper showcased, through the keywords network graph, some types of software testing, such as regression testing and metamorphic testing. However, there are many other types of testing, such as security testing or usability testing, that can also benefit from AI techniques. Future work could explore the potential benefits of AI for different types of testing.

Author Contributions

Conceptualization, M.B. and M.H.; methodology, M.B and N.K; validation, M.B., M.H. and N.K.; formal analysis, M.B. and M.H.; investigation, N.K.; resources, M.H.; data curation, M.B.; writing—original draft preparation, M.B.; writing—review and editing, M.H. and N.K.; visualization, M.B.; supervision, M.H.; project administration, N.K. All authors have read and agreed to the published version of the manuscript.

Funding

This research received no external funding.

Data Availability Statement

The data presented in this study are available on request from the corresponding author.

Conflicts of Interest

The authors declare no conflict of interest.

References

  1. Tahvili, S.; Hatvani, L. Uncertainty, Computational Techniques, and Decision Intelligence. In Artificial Intelligence Methods for Optimization of the Software Testing Process with Practical Examples and Exercises; Elsevier Science: Amsterdam, The Netherlands, 2022. [Google Scholar]
  2. Khari, M.; Mishra, D.; Acharya, B.; Crespo, R. Optimization of Automated Software Testing Using Meta-Heuristic Techniques; Springer International Publishing: Berlin/Heidelberg, Germany, 2022. [Google Scholar]
  3. Meziane, F.; Vadera, S. Artificial Intelligence Applications for Improved Software Engineering Development: New Prospects; IGI Global: Harrisburg, PA, USA, 2009. [Google Scholar]
  4. Qiao, L.; Li, X.; Umer, Q.; Guo, P. Deep learning based software defect prediction. Neurocomputing 2020, 385, 100–110. [Google Scholar] [CrossRef]
  5. Ren, J.; Qin, K.; Ma, Y.; Luo, G. On software defect prediction using machine learning. J. Appl. Math. 2014, 2014, 785435. [Google Scholar] [CrossRef]
  6. Battina, D.S. Artificial intelligence in software test automation: A systematic literature review. Int. J. Emerg. Technol. Innov. Res. 2019, 6, 2349–5162. [Google Scholar]
  7. Karhu, K.; Repo, T.; Taipale, O.; Smolander, K. Empirical observations on software testing automation. In Proceedings of the International Conference on Software Testing Verification and Validation, Denver, CO, USA, 1–4 April 2009; pp. 201–209. [Google Scholar]
  8. Sivakumar, N.; Vivekanandan, K. Comparing the Testing Approaches of Traditional, Object-Oriented and Agent-Oriented Software System. Int. J. Comput. Sci. Eng. Technol. (IJCSET) 2012, 3, 498–504. [Google Scholar]
  9. Briand, L.C.; Labiche, Y.; Bawar, Z. Using machine learning to refine black-box test specifications and test suites. In Proceedings of the The 8th International Conference on Quality Software, Oxford, UK, 12–13 August 2008; pp. 135–144. [Google Scholar]
  10. Rafi, D.M.; Moses, K.R.K.; Petersen, K.; Mäntylä, M.V. Benefits and limitations of automated software testing: Systematic literature review and practitioner survey. In Proceedings of the 7th International Workshop on Automation of Software Test (AST), Zurich, Switzerland, 2–3 June 2012; pp. 36–42. [Google Scholar]
  11. Okutan, A.; Yıldız, O.T. Software defect prediction using Bayesian networks. Empir. Softw. Eng. 2014, 19, 154–181. [Google Scholar] [CrossRef]
  12. Perini, A.; Susi, A.; Avesani, P. A machine learning approach to software requirements prioritization. IEEE Trans. Softw. Eng. 2012, 39, 445–461. [Google Scholar] [CrossRef]
  13. Wahono, R.S. A systematic literature review of software defect prediction. J. Softw. Eng. 2015, 1, 1–16. [Google Scholar]
  14. Donthu, N.; Kumar, S.; Mukherjee, D.; Pandey, N.; Lim, W.M. How to conduct a bibliometric analysis: An overview and guidelines. J. Bus. Res. 2021, 133, 285–296. [Google Scholar] [CrossRef]
  15. Trudova, A.; Dolezel, M.; Buchalcevova, A. Artificial Intelligence in Software Test Automation: A Systematic. Available online: https://pdfs.semanticscholar.org/9fca/3577e28c06ff27f16bfde7855f29b8d8236c.pdf (accessed on 27 March 2023).
  16. Lima, R.; da Cruz, A.M.R.; Ribeiro, J. Artificial intelligence applied to software testing: A literature review. In Proceedings of the 15th Iberian Conference on Information Systems and Technologies (CISTI), Seville, Spain, 24–27 June 2020; pp. 1–6. [Google Scholar]
  17. Serna, M.E.; Acevedo, M.E.; Serna, A.A. Integration of properties of virtual reality, artificial neural networks, and artificial intelligence in the automation of software tests: A review. J. Software Evol. Process. 2019, 31, e2159. [Google Scholar] [CrossRef]
  18. Garousi, V.; Bauer, S.; Felderer, M. NLP-assisted software testing: A systematic mapping of the literature. Inf. Softw. Technol. 2020, 126, 106321. [Google Scholar] [CrossRef]
  19. Garousi, V.; Felderer, M.; Kılıçaslan, F.N. A survey on software testability. Inf. Softw. Technol. 2019, 108, 35–64. [Google Scholar] [CrossRef]
  20. Zardari, S.; Alam, S.; Al Salem, H.A.; Al Reshan, M.S.; Shaikh, A.; Malik, A.F.K.; Masood ur Rehman, M.; Mouratidis, H. A Comprehensive Bibliometric Assessment on Software Testing (2016–2021). Electronics 2022, 11, 1984. [Google Scholar] [CrossRef]
  21. Ghiduk, A.S.; Girgis, M.R.; Shehata, M.H. Higher order mutation testing: A systematic literature review. Comput. Sci. Rev. 2017, 25, 29–48. [Google Scholar] [CrossRef]
  22. Jamil, M.A.; Arif, M.; Abubakar, N.S.A.; Ahmad, A. Software testing techniques: A literature review. In Proceedings of the 6th International Conference on Information and Communication Technology for the Muslim World (ICT4M), Jakarta, Indonesia, 22–24 November 2016; pp. 177–182. [Google Scholar]
  23. Garousi, V.; Mäntylä, M.V. A systematic literature review of literature reviews in software testing. Inf. Softw. Technol. 2016, 80, 195–216. [Google Scholar] [CrossRef]
  24. Garousi, V.; Mäntylä, M.V. When and what to automate in software testing? A multi-vocal literature review. Inf. Softw. Technol. 2016, 76, 92–117. [Google Scholar] [CrossRef]
  25. Wiklund, K.; Eldh, S.; Sundmark, D.; Lundqvist, K. Impediments for software test automation: A systematic literature review. Softw. Testing, Verif. Reliab. 2017, 27, e1639. [Google Scholar] [CrossRef]
  26. Zhang, D. Machine learning in value-based software test data generation. In Proceedings of the 18th International Conference on Tools with Artificial Intelligence (ICTAI’06), Arlington, VA, USA, 13–15 November 2006; pp. 732–736. [Google Scholar]
  27. Esnaashari, M.; Damia, A.H. Automation of software test data generation using genetic algorithm and reinforcement learning. Expert Syst. Appl. 2021, 183, 115446. [Google Scholar] [CrossRef]
  28. Zhu, X.-M.; Yang, X.-F. Software test data generation automatically based on improved adaptive particle swarm optimizer. In Proceedings of the International Conference on Computational and Information Sciences, Chengdu, China, 17–19 December 2010; pp. 1300–1303. [Google Scholar]
  29. Koleejan, C.; Xue, B.; Zhang, M. Code coverage optimisation in genetic algorithms and particle swarm optimisation for automatic software test data generation. In Proceedings of the Congress on Evolutionary Computation (CEC), Sendai, Japan, 25–28 May 2015; pp. 1204–1211. [Google Scholar]
  30. Huang, M.; Zhang, C.; Liang, X. Software test cases generation based on improved particle swarm optimization. In Proceedings of the 2nd International Conference on Information Technology and Electronic Commerce, Dalian, China, 20–21 December 2014; pp. 52–55. [Google Scholar]
  31. Liu, C. Research on Software Test Data Generation based on Particle Swarm Optimization Algorithm. In Proceedings of the 5th International Conference on Trends in Electronics and Informatics (ICOEI), Tirunelveli, India, 3–5 June 2021; pp. 1375–1378. [Google Scholar]
  32. Khari, M.; Kumar, P. A novel approach for software test data generation using cuckoo algorithm. In Proceedings of the 2nd International Conference on Information and Communication Technology for Competitive Strategies, Udaipur, India, 4–5 March 2016; pp. 1–6. [Google Scholar]
  33. Alshraideh, M.; Bottaci, L. Search-based software test data generation for string data using program-specific search operators. Softw. Testing, Verif. Reliab. 2006, 16, 175–203. [Google Scholar] [CrossRef]
  34. Mairhofer, S.; Feldt, R.; Torkar, R. Search-based software testing and test data generation for a dynamic programming language. In Proceedings of the 13th Annual Conference on Genetic and Evolutionary Computation, Dublin, Ireland, 12–16 June 2011; pp. 1859–1866. [Google Scholar]
  35. McMinn, P. Search-based software test data generation: A survey. Softw. Testing Verif. Reliab. 2004, 14, 105–156. [Google Scholar] [CrossRef]
  36. De Lima, L.F.; Peres, L.M.; Grégio, A.R.A.; Silva, F. A Systematic Literature Mapping of Artificial Intelligence Planning in Software Testing. In Proceedings of the ICSOFT, Paris, France, 7–9 July 2020; pp. 152–159. [Google Scholar]
  37. Dahiya, S.S.; Chhabra, J.K.; Kumar, S. Application of artificial bee colony algorithm to software testing. In Proceedings of the 21st Australian Software Engineering Conference, Auckland, New Zealand, 6–9 April 2010; pp. 149–154. [Google Scholar]
  38. Mala, D.J.; Mohan, V.; Kamalapriya, M. Automated software test optimisation framework—An artificial bee colony optimisation-based approach. IET Softw. 2010, 4, 334–348. [Google Scholar] [CrossRef]
  39. Karnavel, K.; Santhoshkumar, J. Automated software testing for application maintenance by using bee colony optimization algorithms (BCO). In Proceedings of the International Conference on Information Communication and Embedded Systems (ICICES), Chennai, India, 21–22 February 2013; pp. 327–330. [Google Scholar]
  40. Lakshminarayana, P.; SureshKumar, T. Automatic generation and optimization of test case using hybrid cuckoo search and bee colony algorithm. J. Intell. Syst. 2021, 30, 59–72. [Google Scholar] [CrossRef]
  41. Lijuan, W.; Yue, Z.; Hongfeng, H. Genetic algorithms and its application in software test data generation. In Proceedings of the International Conference on Computer Science and Electronics Engineering, Hangzhou, China, 23–25 March 2012; Volume 2, pp. 617–620. [Google Scholar]
  42. Berndt, D.; Fisher, J.; Johnson, L.; Pinglikar, J.; Watkins, A. Breeding software test cases with genetic algorithms. In Proceedings of the 36th Annual Hawaii International Conference on System Sciences, Big Island, HI, USA, 6–9 January 2003; p. 10. [Google Scholar]
  43. Yang, S.; Man, T.; Xu, J.; Zeng, F.; Li, K. RGA: A lightweight and effective regeneration genetic algorithm for coverage-oriented software test data generation. Inf. Softw. Technol. 2016, 76, 19–30. [Google Scholar] [CrossRef]
  44. Khan, R.; Amjad, M. Automatic test case generation for unit software testing using genetic algorithm and mutation analysis. In Proceedings of the UP Section Conference on Electrical Computer and Electronics (UPCON), Allahabad, India, 4–6 December 2015; pp. 1–5. [Google Scholar]
  45. Dong, Y.; Peng, J. Automatic generation of software test cases based on improved genetic algorithm. In Proceedings of the International Conference on Multimedia Technology, Hangzhou, China, 26–28 July 2011; pp. 227–230. [Google Scholar]
  46. Bouchachia, A. An immune genetic algorithm for software test data generation. In Proceedings of the 7th International Conference on Hybrid Intelligent Systems (HIS 2007), Kaiserslautern, Germany, 17–19 September 2007; pp. 84–89. [Google Scholar]
  47. Peng, Y.P.; Zeng, B. Software Test Data Generation for Multiple Paths Based on Genetic Algorithms. Appl. Mech. Mater. 2013, 263, 1969–1973. [Google Scholar] [CrossRef]
  48. Cohen, K.B.; Hunter, L.E.; Palmer, M. Assessment of software testing and quality assurance in natural language processing applications and a linguistically inspired approach to improving it. In Trustworthy Eternal Systems via Evolving Software, Data and Knowledge, Proceedings of the 2nd International Workshop (EternalS 2012), Montpellier, France, 28 August 2012; Springer: Berlin/Heidelberg, Germany, 2012; pp. 77–90. [Google Scholar]
  49. Ahsan, I.; Butt, W.H.; Ahmed, M.A.; Anwar, M.W. A comprehensive investigation of natural language processing techniques and tools to generate automated test cases. In Proceedings of the 2nd International Conference on Internet of things, Data and Cloud Computing, Cambridge, UK, 22–23 March 2017; pp. 1–10. [Google Scholar]
  50. Ansari, A.; Shagufta, M.B.; Fatima, A.S.; Tehreem, S. Constructing test cases using natural language processing. In Proceedings of the 3rd International Conference on Advances in Electrical, Electronics, Information, Communication and Bio-Informatics (AEEICB), Chennai, India, 27–28 February 2017; pp. 95–99. [Google Scholar]
  51. Wang, H.; Bai, L.; Jiezhang, M.; Zhang, J.; Li, Q. Software testing data analysis based on data mining. In Proceedings of the 4th International Conference on Information Science and Control Engineering (ICISCE), Changsha, China, 21–23 July 2017; pp. 682–687. [Google Scholar]
  52. Last, M.; Friedman, M.; Kandel, A. Using data mining for automated software testing. Int. J. Softw. Eng. Knowl. Eng. 2004, 14, 369–393. [Google Scholar] [CrossRef]
  53. Yu, S.; Ai, J.; Zhang, Y. Software test data generation based on multi-agent. In Advances in Software Engineering, Proceedings of the International Conference on Advanced Software Engineering and Its Applications (ASEA 2009), Jeju Island, Republic of Korea, 10–12 December 2009; pp. 188–195.
  54. Dhavachelvan, P.; Uma, G. Complexity measures for software systems: Towards multi-agent based software testing. In Proceedings of the International Conference on Intelligent Sensing and Information Processing, Chennai, India, 4–7 January 2005; pp. 359–364. [Google Scholar]
  55. Tang, J. Towards automation in software test life cycle based on multi-agent. In Proceedings of the International Conference on Computational Intelligence and Software Engineering, Wuhan, China, 10–12 December 2010; pp. 1–4. [Google Scholar]
  56. Alyahya, S. Collaborative Crowdsourced Software Testing. Electronics 2022, 11, 3340. [Google Scholar] [CrossRef]
  57. Górski, T. The k + 1 Symmetric Test Pattern for Smart Contracts. Symmetry 2022, 14, 1686. [Google Scholar] [CrossRef]
  58. Bijlsma, A.; Passier, H.J.; Pootjes, H.; Stuurman, S. Template Method test pattern. Inf. Process. Lett. 2018, 139, 8–12. [Google Scholar] [CrossRef]
  59. López, J.; Kushik, N.; Yevtushenko, N. Source code optimization using equivalent mutants. Inf. Softw. Technol. 2018, 103, 138–141. [Google Scholar] [CrossRef]
  60. Segura, S.; Troya, J.; Durán, A.; Ruiz-Cortés, A. Performance metamorphic testing: A proof of concept. Inf. Softw. Technol. 2018, 98, 1–4. [Google Scholar] [CrossRef]
  61. Harzing, A.W.; Alakangas, S. Google Scholar, Scopus and the Web of Science: A longitudinal and cross-disciplinary comparison. Scientometrics 2016, 106, 787–804. [Google Scholar] [CrossRef]
  62. Norris, M.; Oppenheim, C. Comparing alternatives to the Web of Science for coverage of the social sciences’ literature. J. Inf. 2007, 1, 161–169. [Google Scholar] [CrossRef]
  63. Chadegani, A.A.; Salehi, H.; Yunus, M.M.; Farhadi, H.; Fooladi, M.; Farhadi, M.; Ebrahim, N.A. A comparison between two main academic literature collections: Web of Science and Scopus databases. arXiv 2013, arXiv:1305.0377. [Google Scholar] [CrossRef]
  64. Feng, X.W.; Hadizadeh, M.; Cheong, J.P.G. Global Trends in Physical-Activity Research of Autism: Bibliometric Analysis Based on the Web of Science Database (1980–2021). Int. J. Environ. Res. Public Health 2022, 19, 7278. [Google Scholar] [CrossRef] [PubMed]
  65. Skute, I. Opening the black box of academic entrepreneurship: A bibliometric analysis. Scientometrics 2019, 120, 237–265. [Google Scholar] [CrossRef]
  66. Zhao, D.; Strotmann, A. Analysis and visualization of citation networks. Synth. Lect. Inf. Concepts Retr. Serv. 2015, 7, 1–207. [Google Scholar]
  67. Ma, X.; Zhang, L.; Wang, J.; Luo, Y. Knowledge domain and emerging trends on echinococcosis research: A scientometric analysis. Int. J. Environ. Res. Public Health 2019, 16, 842. [Google Scholar] [CrossRef] [PubMed]
  68. Lee, Y.C.; Chen, C.; Tsai, X.T. Visualizing the knowledge domain of nanoparticle drug delivery technologies: A scientometric review. Appl. Sci. 2016, 6, 11. [Google Scholar] [CrossRef]
  69. Aria, M.; Cuccurullo, C. bibliometrix: An R-tool for comprehensive science mapping analysis. J. Inf. 2017, 11, 959–975. [Google Scholar] [CrossRef]
  70. Van Eck, N.; Waltman, L. Software survey: VOSviewer, a computer program for bibliometric mapping. Scientometrics 2010, 84, 523–538. [Google Scholar] [CrossRef]
  71. Chen, C. Science mapping: A systematic review of the literature. J. Data Inf. Sci. 2017, 2, 1–40. [Google Scholar] [CrossRef]
  72. Negahban, M.B.; Zarifsanaiey, N. Network analysis and scientific mapping of the e-learning literature from 1995 to 2018. Knowl. Manag. E-Learn. Int. J. 2020, 12, 268–279. [Google Scholar]
  73. Cobo, M.J.; López-Herrera, A.G.; Herrera-Viedma, E.; Herrera, F. An approach for detecting, quantifying, and visualizing the evolution of a research field: A practical application to the Fuzzy Sets Theory field. J. Inf. 2011, 5, 146–166. [Google Scholar] [CrossRef]
  74. Matute, J.; Linsen, L. Evaluating Data-type Heterogeneity in Interactive Visual Analyses with Parallel Axes. In Proceedings of the Computer Graphics Forum, Reims, France, 25–29 April 2022. [Google Scholar]
  75. Ejaz, H.; Zeeshan, H.M.; Ahmad, F.; Bukhari, S.N.A.; Anwar, N.; Alanazi, A.; Sadiq, A.; Junaid, K.; Atif, M.; Abosalif, K.O.A.; et al. Bibliometric Analysis of Publications on the Omicron Variant from 2020 to 2022 in the Scopus Database Using R and VOSviewer. Int. J. Environ. Res. Public Health 2022, 19, 12407. [Google Scholar] [CrossRef]
  76. Jaffe, K.; Ter Horst, E.; Gunn, L.H.; Zambrano, J.D.; Molina, G. A network analysis of research productivity by country, discipline, and wealth. PLoS ONE 2020, 15, e0232458. [Google Scholar] [CrossRef] [PubMed]
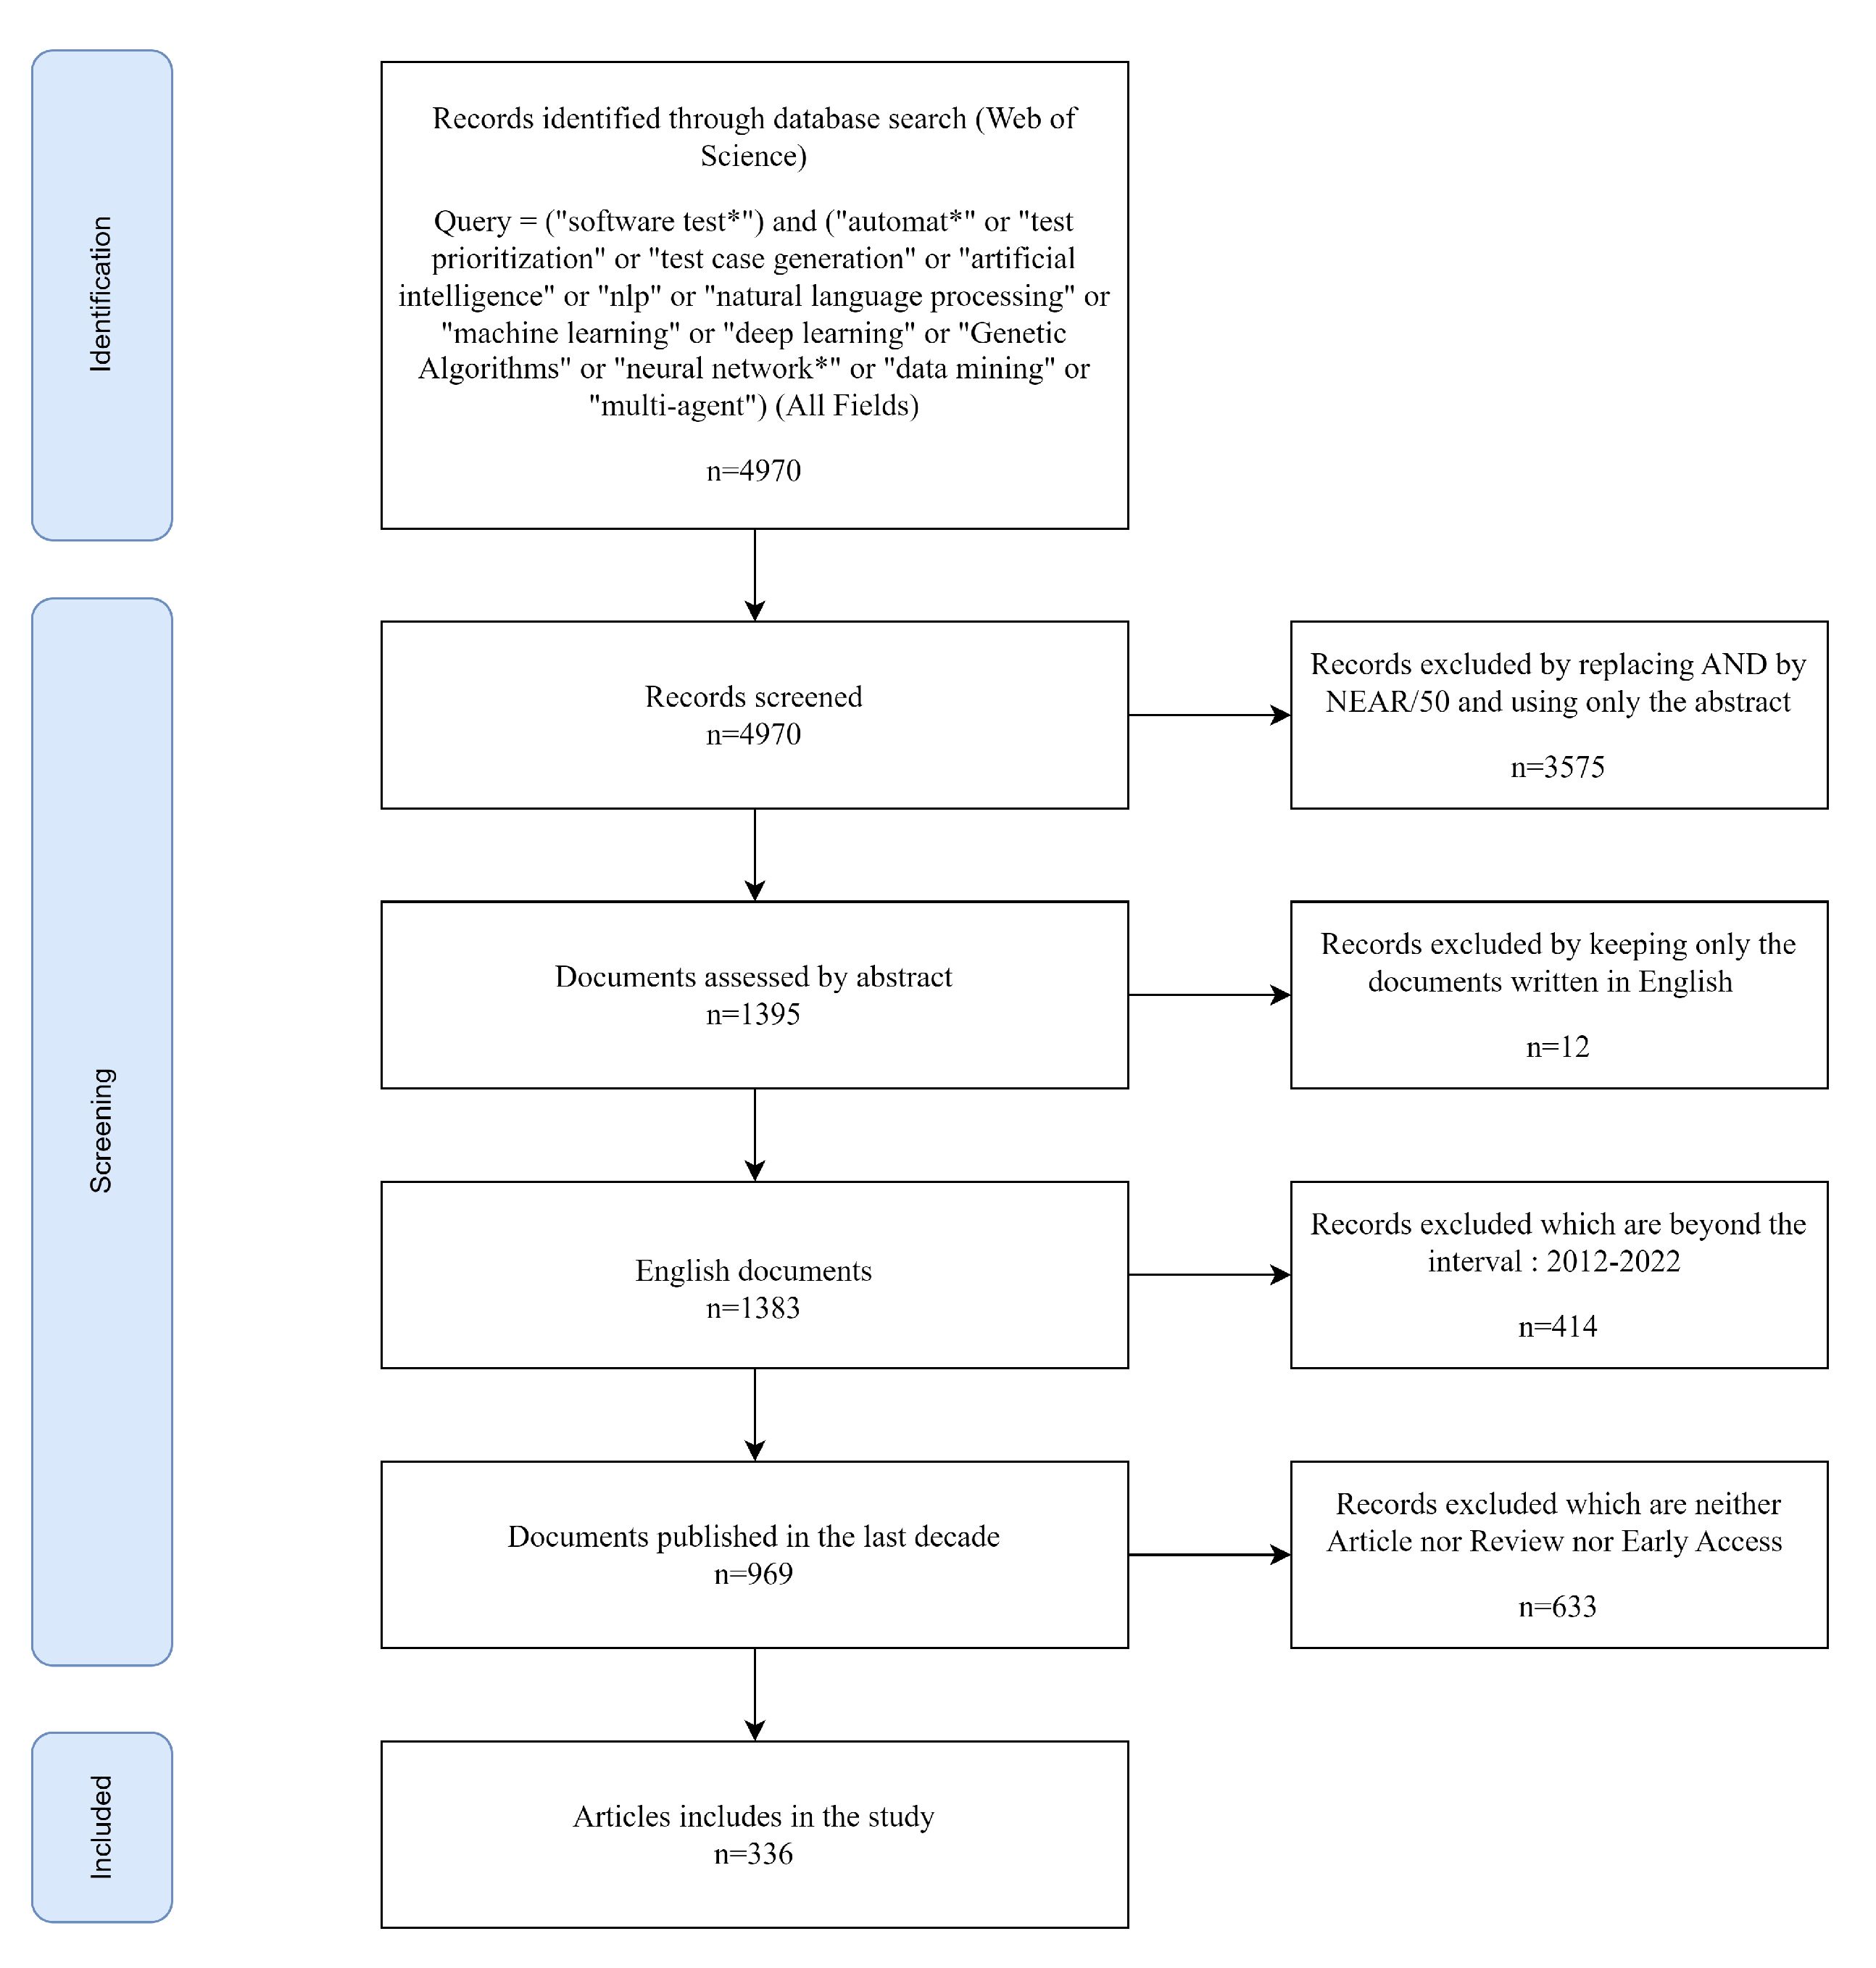
Figure 1. Flow chart of the search strategy.
Electronics 12 02109 g001
Figure 2. Flow chart of the bibliometric analysis.
Electronics 12 02109 g002
Figure 3. The annual scientific production in the field of intelligent software testing.
Electronics 12 02109 g003
Figure 4. The average citations per year in the field of intelligent software testing.
Electronics 12 02109 g004
Figure 5. The Three-Field plot of countries, authors and document title keywords.
Electronics 12 02109 g005
Figure 6. Top 10 journals with the highest productivity.
Electronics 12 02109 g006
Figure 7. Top ten highly cited sources.
Electronics 12 02109 g007
Figure 8. Top ten most relevant affiliations.
Electronics 12 02109 g008
Figure 9. Top ten most relevant authors.
Electronics 12 02109 g009
Figure 10. The most relevant countries by corresponding authors.
Electronics 12 02109 g010
Figure 11. Most globally cited documents.
Electronics 12 02109 g011
Figure 12. Most Locally Cited Documents.
Electronics 12 02109 g012
Figure 13. Frequency Distribution of Scientific Productivity (Lotka’s Law).
Electronics 12 02109 g013
Figure 14. The most relevant words used in intelligent software testing research.
Electronics 12 02109 g014
Figure 15. Word cloud of the most frequently used keywords in software testing research.
Electronics 12 02109 g015
Figure 16. Keywords co-occurrence network.
Electronics 12 02109 g016
Figure 17. Country collaboration world map.
Electronics 12 02109 g017
Figure 18. Country collaboration world map via VOS Viewer.
Electronics 12 02109 g018
Figure 19. Organizations co-authorship.
Electronics 12 02109 g019
Figure 20. Authors co-citation network.
Electronics 12 02109 g020
Figure 21. Journals co-citation network.
Electronics 12 02109 g021
Figure 22. Thematic map.
Electronics 12 02109 g022
Figure 23. Factorial map using multiple correspondence analysis of the most cited documents.
Electronics 12 02109 g023
Figure 24. Topic Dendrogram using multiple correspondence analysis.
Electronics 12 02109 g024
Figure 25. Conceptual structure map using multiple correspondence analysis.
Electronics 12 02109 g025
Figure 26. Factorial map using correspondence analysis of the most cited documents.
Electronics 12 02109 g026
Figure 27. Topic Dendrogram using correspondence analysis.
Electronics 12 02109 g027
Figure 28. Conceptual structure map using correspondence analysis.
Electronics 12 02109 g028
Figure 29. Topic Dendrogram using multidimensional scaling.
Electronics 12 02109 g029
Figure 30. Conceptual structure map using multidimensional scaling.
Electronics 12 02109 g030
Table 1. Main information.
DescriptionResults
Key Information
Timespan2012–2022
Sources162
Documents336
Average number of citations per document12.88
References11,280
Annual growth rate14.87%
Contents of Documents
Keywords Used by Authors (DE)1075
Keywords Plus (ID)280
Authors
Authors of Single-Authored Documents20
Authors of Multi-Authored Documents1033
Collaboration among Authors
Single-authored documents20
Co-authors per document3.64
International Co-authorships26.79%
Table 2. Corresponding authors’ countries.
CountryArticlesFrequencySingle-Country PublicationMultiple-Country PublicationMultiple-Country Publication Ratio
China670.19955120.179
India480.1434710.021
USA270.0801980.296
Brazil130.0391120.154
Malaysia130.039760.462
Germany100.030730.300
Korea90.027720.222
Spain90.027540.444
United Kingdom90.027540.444
Turkey80.024440.500
Table 3. Top ten globally cited authors.
Author, Year, JournalArticle TitleTotal CitationsTotal Citations per Year
CHEN TY, 2013, JOURNAL OF SYSTEMS AND SOFTWAREAN ORCHESTRATED SURVEY OF METHODOLOGIES FOR AUTOMATED SOFTWARE TEST CASE GENERATION32629.636
ARCURI A, 2014, ACM TRANSACTIONS ON SOFTWARE ENGINEERING AND METHODOLOGYA LARGE-SCALE EVALUATION OF AUTOMATED UNIT TEST GENERATION USING EVOSUITE11311.3
ARCURI A, 2013, IEEE TRANSACTIONS ON SOFTWARE ENGINEERINGGENERATING TEST DATA FROM OCL CONSTRAINTS WITH SEARCH TECHNIQUES888
ALI S, 2013, IEEE TRANSACTIONS ON SOFTWARE ENGINEERINGGENERATING TEST DATA FROM OCL CONSTRAINTS WITH SEARCH TECHNIQUES888
GAROUSI V, 2016, INFORMATION AND SOFTWARE TECHNOLOGYWHEN AND WHAT TO AUTOMATE IN SOFTWARE TESTING? A MULTI-VOCAL LITERATURE REVIEW779.625
ARCURI A, 2015, EMPIRICAL SOFTWARE ENGINEERINGACHIEVING SCALABLE MUTATION-BASED GENERATION OF WHOLE TEST SUITES647.111
KHARI M, 2019, SOFT COMPUTINGAN EXTENSIVE EVALUATION OF SEARCH-BASED SOFTWARE TESTING: A REVIEW244.8
KHARI M, 2013, INTERNATIONAL JOURNAL OF BIO-INSPIRED COMPUTATIONHEURISTIC SEARCH-BASED APPROACH FOR AUTOMATED TEST DATA GENERATION: A SURVEY232.091
KHARI M, 2018, SOFT COMPUTINGOPTIMIZED TEST SUITES FOR AUTOMATED TESTING USING DIFFERENT OPTIMIZATION TECHNIQUES223.667
GONG DW, 2016, AUTOMATED SOFTWARE ENGINEERINGTEST DATA GENERATION FOR PATH COVERAGE OF MESSAGE-PASSING PARALLEL PROGRAMS BASED ON CO-EVOLUTIONARY GENETIC ALGORITHMS182.25
Table 4. Frequency distribution of scientific productivity according to Lotka’s law.
Documents WrittenNumber of AuthorsProportion of Authors
19270.880
2960.091
3230.022
430.003
520.002
620.002
Disclaimer/Publisher’s Note: The statements, opinions and data contained in all publications are solely those of the individual author(s) and contributor(s) and not of MDPI and/or the editor(s). MDPI and/or the editor(s) disclaim responsibility for any injury to people or property resulting from any ideas, methods, instructions or products referred to in the content.