Article

How to Design and Evaluate mHealth Apps? A Case Study of a Mobile Personal Health Record App

1
School of Information Convergence, Kwangwoon University, Seoul 01897, Republic of Korea
2
School of Media & Communication, Kwangwoon University, Seoul 01897, Republic of Korea
3
Department of Industrial & Management Engineering, Incheon National University, Incheon 22012, Republic of Korea
4
Yeshcompany, Seoul 06231, Republic of Korea
*
Author to whom correspondence should be addressed.
Electronics 2024, 13(1), 213; https://doi.org/10.3390/electronics13010213
Submission received: 12 November 2023 / Revised: 15 December 2023 / Accepted: 18 December 2023 / Published: 3 January 2024
(This article belongs to the Special Issue Human-Computer Interactions in E-health)

Abstract

:
The rapid growth of the mHealth market has led to the development of several tools to evaluate user experience. However, there is a lack of universal tools specifically designed for this emerging technology. This study was conducted with the aim of developing and verifying a user experience evaluation scale for mHealth apps based on factors proposed in previous research. The initial draft of the tool was created following a comprehensive review of existing questionnaires related to mHealth app evaluation. The validity of this scale was then tested through exploratory and confirmatory factor analysis. The results of the factor analysis led to the derivation of 16 items, which were conceptually mapped to five factors: ease of use and satisfaction, information architecture, usefulness, ease of information, and aesthetics. A case study was also conducted to improve mHealth apps concerning personal health records using this scale. In conclusion, the developed user experience evaluation scale for mHealth apps can provide comprehensive user feedback and contribute to the improvement of these apps.

1. Introduction

The aging population and a growing interest in individual health care have fueled an increase in demand for eHealth services. eHealth uses information and communications technology to support health and health-related service fields [1]. Mobile health (mHealth), a subset of eHealth, leverages mobile wireless devices like cellular phones, tablets, smartphones, and other wireless devices to deliver health services and information [2]. In addition, the popularization of smart devices has created an environment where individuals can manage their health, promoting the demand for mHealth apps [3]. Moreover, the high portability of smartphones allows access to health information at any time [3].
Health information technology products fall into three categories: (1) those for administrative functions, (2) those for health management functions, and (3) those serving as medical devices [4]. Administrative functions are aimed at patient scheduling and billing, while health management functions are aimed at providing health care services to patients. Medical device functions are aimed at individuals who maintain, improve, or manage their health. Examples include telemedicine, appointment scheduling and notifications, self-diagnosis, habit tracking, fitness and well-being, mental health, and personal health records (PHRs). These functions allow users to check their health status and help medical service providers access patients alienated from the health system. Implicit in medical information management in the context of prescribing mHealth, the safety and efficacy of such technology are imperative for its evidence-based use.
However, many mHealth apps are developed with scant end-user feedback, often overlooking user requirements [5,6]. Among the requirements for users, health literacy is a critical and direct determinant of health [7]. Health literacy is defined as the cognitive and social skills determining the motivation and ability of individuals to gain access, understand, and use information in ways that promote and maintain good health [8]. It can improve population health and address health gaps [9]. Therefore, health literacy is a key factor in improving the accessibility and quality of health care. However, mHealth apps require a high level of health literacy because their contents often comprise medical terms and jargon that are difficult to understand [10]. Therefore, the popularity of mHealth apps is limited because they are difficult to use and interact with [11]. Thus, user experiential feedback should be considered to increase individual access to medical services and initiative in using health data. It is essential to develop mHealth apps that allow users to access health data easily. Therefore, developing a measurement tool that can obtain comprehensive user feedback on mHealth apps, including health literacy elements, and act as a checklist for designing new mHealth apps with a good user experience is necessary.
In recent years, PHR has been geared towards providing safer and more personalized health care to patients, with its use on a steady rise [12]. PHR collectively refers to electronic medical charts containing information such as patient medical data [13]. Using PHRs, users can record and manage their health data on a website or in an app, and they are gradually being provided in mHealth apps. Patients can access various medical information, such as their test results and prescriptions, earlier accessible only to medical service providers [13]. In addition, patients can check their health status by adding medical records such as personal information and medical history [14]. This helps patients remotely communicate symptoms and side effects to medical service providers [12]. Thus, PHR is a technology and service that empowers individuals to integrate and manage their medical data, providing and utilizing them as needed. PHR provides a user-led medical environment experience with self-determination using personal health data and is an important service for patient self-health-care. Because PHR is a patient-centered healthcare system, increasing patient participation by providing transparent and better information is necessary [14].
Among the cognitive factors influencing an individual’s motivation to use a health app, eHealth literacy plays a significant role in determining the app’s use, directly impacting the user’s intention to continue its use [15]. Moreover, PHR, which provides health information and is directly managed by patients, has high health literacy requirements, potentially excluding many users if strategies are not introduced to support their use [16]. Hence, PHR app design should consider patients with different levels of health literacy to positively influence the efficacy of the PHR app to support patient-centered care. Moreover, when individuals perceive the high ease of use of health apps, they may feel more confident in using them [15]. Therefore, research on improving the user experience and convenience of mHealth apps, such as PHR, is important. In addition, long-term research on evaluating the effects of PHR on health, design strategies, and functions needed is essential.
Given that the evaluation factors in measurement tools from previous studies solely focused on usability, usefulness, and quality [17,18], there was a need for an easy-to-use tool that could comprehensively measure a patient’s experience with mHealth apps. As a result, this study identified key factors for mHealth apps to consider and developed a comprehensive usability evaluation questionnaire for end users.
This study aims to develop and validate a user experience evaluation scale for mHealth apps, drawing on user experience factors proposed in prior studies [19,20,21,22,23,24]. In particular, the scale was newly developed to reflect health literacy, which is emphasized as an important element in mHealth apps. In addition, using the proposed user experience evaluation scale, we evaluated and improved the user experience and interface design of “My Health Record”, a currently commercialized PHR app.

2. Materials and Methods

2.1. Literature Reviews on Previous Mobile Health App Measurements

A variety of questionnaires have been employed to assess the usability of mHealth app services. Typically, the System Usability Scale (SUS), Mobile Application Rating Scale (MARS), and Post-Study System Usability Questionnaire (PSSUQ) have been used [17]. However, unlike MARS, SUS [25] and PSSUQ [26] were not developed to evaluate mHealth apps. These are standardized questionnaires configured for application to various systems and are widely used to measure users’ perceived satisfaction with websites, software, systems, or products. Hence, there is no consensus on usability measurement tools to understand the various factors of the mHealth app when using various measurement tools [27]. With the development of new technologies like smartphones and mHealth apps, there’s a need for new measurement tools for system evaluation.
To date, several attempts have been made to develop measurement tools that evaluate the usability of mHealth apps [18]. We compare four widely used representative methods in Table 1.
The Health Information Technology Usability Evaluation Scale (Health-ITUES) is a tool developed to assess the usability of health information technology systems, drawing upon various system usability assessment questionnaires [28]. The Health-ITUES questionnaire is not designed specifically for mHealth apps and can be applied to various systems. Schnall et al. evaluated psychometric properties for application to mHealth app usability studies [22]. Unlike other measurement tools, the items in Health-ITUES can be customized according to the specific elements (user–system–task–environment interaction) of the user-evaluated app [30]. Thus, the unique features provided by the corresponding mHealth apps can be measured conveniently by customizing the questions [22]. However, the benefits of custom-designing are meaningless to users with no experience in questionnaire development and undermine the questionnaire’s reliability [21]. In addition, Health-ITUES is a measurement tool developed around perceived usefulness and ease of use [27]; hence, the aesthetic and information components introduced in MARS and MARS User Version (uMARS) were not considered.
MARS was developed to evaluate the usability of mHealth apps and is widely used to measure the quality of factors of mHealth apps [27]. However, using MARS requires considerable training. To compensate for these shortcomings, uMARS, which can be easily used for evaluation by ordinary users other than healthcare experts, has been developed. MARS and uMARS include usability components, such as immersion, functionality, information quality, and aesthetic and subjective quality elements.
The mHealth app usability questionnaire (MAUQ), a recently developed tool, was designed to assess the usability of mHealth apps. It was developed based on several validated usability questionnaires, such as SUS; PSSUQ; Usefulness, Satisfaction, and Ease of Use (USE) [31]; and the Software Usability Measurement Inventory [32] used in previous mobile app usability studies. In addition, the questionnaire was developed considering the problems of MARS and Health-ITUES. This study was conducted with reference to the study that developed MAUQ. MAUQ has the reliability and validity necessary to evaluate the usability of mHealth apps but lacks factors and sub-items that consider health literacy, an important concept in mHealth apps. Monkman and Kushniruk recommended including health literacy-related assessments when testing the usability of patient web portals to improve the adoption of consumer health information systems and user health knowledge [33].
In addition, there are studies that have developed/evaluated tools targeting specific users and diseases. Examples include a study considering the elderly [34], a study in a diverse, low-income patient population [35], and a study specializing in mental health [36].

2.2. Derivation of User Experience Evaluation Scale Factors

Kim et al. analyzed user experience factors by studying the usability questionnaire for mHealth apps [23]. Factors were collected through a systematic literature review and in-depth interviews with mHealth app users. In Kim et al.’s study, the need for health literacy was identified based on the results of a literature review and in-depth interviews, and an ease-of-information factor was newly proposed. Ease of information signifies the quality of information that allows users to understand the information without difficulty. Finally, the user experience factors for mHealth apps were categorized into six factors: ease of use, satisfaction, information architecture, usefulness, ease of information, and aesthetics, as presented in Table 2. The six factors can also be considered in mHealth app usability evaluation. In this study, factors thought to be similar were merged based on the six derived user experience factors.

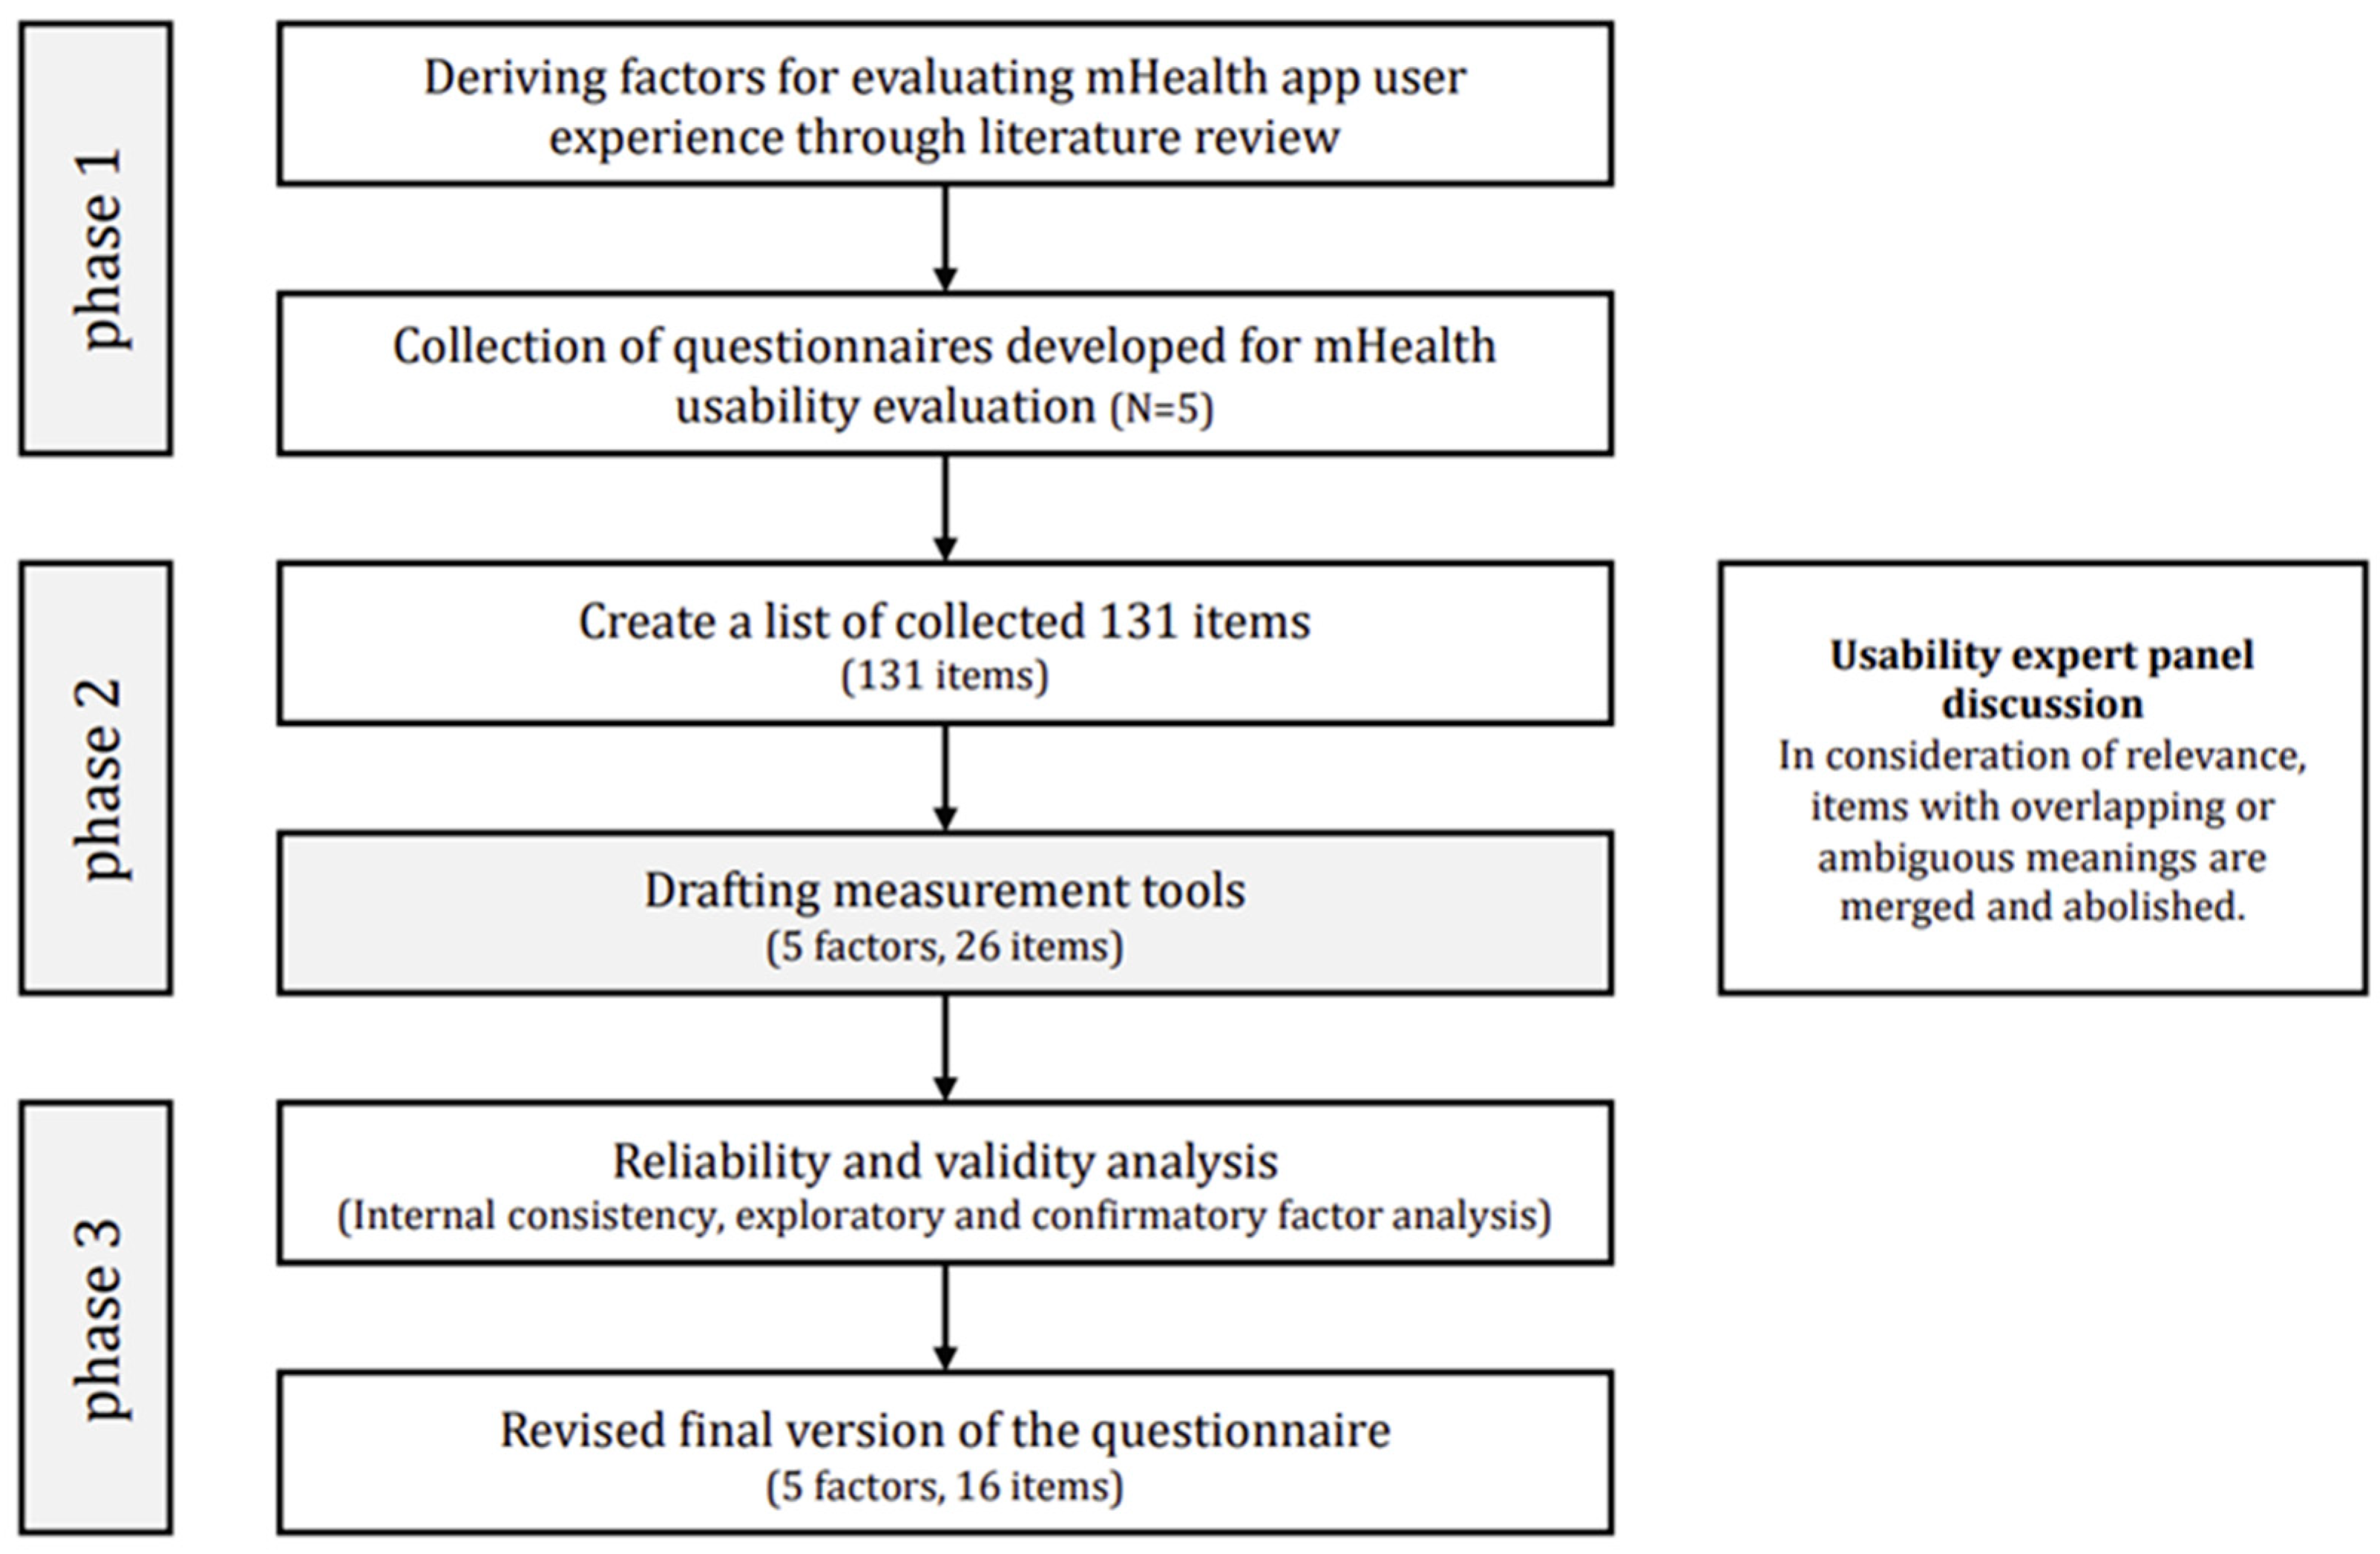
2.3. Development of the User Experience Evaluation Scale for mHealth Apps

Figure 1 presents the development flowchart for the user experience evaluation scale for mHealth apps. First, we derived factors for evaluating the user experience of mHealth apps. Second, we created a list of 131 items based on a questionnaire developed for mHealth app usability evaluation [19,20,21,22,24], collected through a literature review. Next, we merged or deleted items with overlapping or ambiguous meanings, considering content validity. We drafted a measurement tool by selecting 26 items that conceptually mapped to the five factors derived from the study by Kim et al. [23]. The sub-items consisted of 7 items related to ease of use and satisfaction, 4 items related to information architecture, 5 items related to usefulness, 6 items related to ease of information, and 4 items related to aesthetics. Finally, we developed the final questionnaire by verifying the reliability and validity of the draft measurement tool.

2.4. Validation Study for the User Experience Evaluation Scale for mHealth Apps

2.4.1. Study Participants

To validate the user experience evaluation scale for mHealth apps, we selected 70 participants (40 men and 30 women). Most of the participants had a high interest in health (high (46%), middle (53%), and low (1%)), and their average age was 31.9 years (SD = 12.8). Participants were recruited through the university’s online bulletin board. This study was conducted with the approval of the IRB (7001546-202110701-HR(SB)-007-03) of Kwangwoon University.

2.4.2. Study Design

The “My Health Record” PHR app, developed by the Korean government, was used for the study. The app enables users to assess health information, such as medication information, medical history, health check-ups, and vaccinations, that is dispersed across various institutions. The participants downloaded the PHR app from an app store; after the individual was authenticated in the app, their health information was automatically displayed. The purpose of the study and the tasks to be performed were explained to the participants. The participants were divided into two groups of 43 and 27, depending on the Android and iOS operating systems in their mobile phones, respectively. Participants completed the questionnaire in Table 3 after performing a task consisting of using seven representative functions of the “My Health Record” app. Participants responded to 26 items using a 7-point Likert scale (from “Strongly agree” (7 points) to “Strongly disagree” (1 point)). We used Jamovi ver.2.2.3 for the analysis, which uses R-based programs (a statistical programming language). The collected samples were verified for the construct validity of the measurement tool through exploratory and confirmatory factor analyses (EFA and CFA, respectively), and reliability was confirmed through internal consistency. The experiment was conducted in 2021 in South Korea, and COVID-19 vaccination history was also included.

3. Results

3.1. Validation Study for the User Experience Evaluation Scale for mHealth Apps

3.1.1. Results of Exploratory Factor Analysis

We used EFA to explore the sub-factor structure of the user experience evaluation scale for mHealth apps, which consists of 26 items. For factor extraction, we used the principal components method and the varimax rotation for factor rotation. Prior to EFA, we conducted a hypothesis test. The Kaiser–Meyer–Olkin (KMO) index is a statistical measure suitable for factor analysis. The lower the partial correlation coefficient between the variables, the higher the association between the related variables [37]. Hence, an ideal KMO index should exceed 0.8. The KMO index of the sample was 0.845; thus, the sample was judged to be suitable for factor analysis. In addition, Bartlett’s sphericity test index, indicating the suitability of factor analysis, was  x 2  = 1619 (df = 325), and the significance level of this index was p < 0.001. It was judged that there was a common factor suitable for factor analysis. The results of EFA are shown in Table 3.
Out of the 26 items, we removed those with a factor loading below 0.320 and a cross-factor loading above 0.320 [37]. Thus, eight items determined to be insufficient in explanatory power were removed. It was judged that the remaining 18 items compiled through EFA were appropriate based on the researcher’s theoretical background.
For reliability analysis, we used Cronbach’s α value, which estimates internal consistency reliability based on all possible correlations among collected items. The Cronbach’s α value ranges from 0.0 (no confidence) to 1.0 (perfect confidence); acceptable values range from 0.70 to 0.95 [38]. The Cronbach’s α value for the overall user experience evaluation scale for mHealth apps, which consisted of 18 items, was 0.925, indicating high reliability. Moreover, the Cronbach’s α values representing the internal consistency between the items constituting each sub-factor were between 0.731 and 0.940, as shown in Table 3.

3.1.2. Results of Confirmatory Factor Analysis

Two models were considered for CFA. First, we investigated whether the results of the EFA, which consisted of 18 items across five factors, are suitable for CFA through the path model. Comparative fit index (CFI), Tucker–Lewis index (TLI), and root-mean-squared error of approximation (RMSEA), which are indices that are less sensitive to the number of samples and reflect the simplicity of the model, were selected as goodness-of-fit indices for model evaluation [39]. In addition, the chi-square value was analyzed. As shown in Table 3, the goodness-of-fit indices of the five-factor model (18 items) were  x 2  = 186 (df = 125, p < 0.001) and RMSEA = 0.084. Since the goodness-of-fit index was not appropriate, CFA was repeated with 16 items, excluding Q4 and Q11, with relatively low standardization estimates. The second evaluation path model used for CFA is presented in Figure 2.
The goodness-of-fit indices of the CFA model consisting of five factors and 16 sub-items were  x 2  = 111 (df = 94, p = 0.115), CFI = 0.983, TLI = 0.978, and RMSEA = 0.050, as shown in Table 4. In general, CFI and TLI are judged to be good if the goodness-of-fit indices are above 0.95 [40], while RMSEA is considered very good if it is below 0.06 and good if it is below 0.08 [41]. The five-factor model with 16 sub-items presented in this study satisfies this for all  x 2 , CFI, TLI, and RMSEA values and shows that the relationship between measurement variables according to theory was appropriate.
This study verified common method variance by conducting Harman’s single-factor test [42]. Harman’s single-factor test was conducted using the SPSS program. The factor extraction method was principal axis factoring, where the factor to be extracted was set to 1 with a fixed number of factors. Factor rotation was analyzed without specifying the rotation method. As a result of the analysis, it was confirmed that the explanatory power for the total variance was 44.72%. According to the analysis results, it was confirmed that the error of common method variance was low in that it did not exceed 50%, which is the standard for the single-factor test [43,44].
In addition, as shown in Table 5, the factor coefficients of all sub-factors were statistically significant at p < 0.001. All the t-values were significant, and convergent validity was confirmed because the average variance extracted (AVE) values for testing convergent validity were greater than the general criterion of 0.5 for all latent variables. Furthermore, the construct reliability values were all greater than the general criterion of 0.7 [45]. As shown in Table 6, discriminant validity was verified because the square root of the AVE of all constructs was greater than the correlation coefficient [45]. The five factors were confirmed as appropriate for the 16 items in the evaluation model.

3.1.3. User Experience Evaluation Scale for mHealth Apps

The final user experience evaluation scale for mHealth apps consisted of 16 questions and is presented in Table 7. Based on the validity test, a questionnaire was conceptually developed to suit the goals set by the researchers prior to the development of measurement tools.

3.2. Case Study

3.2.1. Usability Testing of mHealth Apps

We conducted a case study aimed at improving mHealth apps, using the user experience evaluation scale as a basis. To this end, we conducted questionnaires and in-depth interviews with potential users.
Apps used in the case study. For this study, we used the “My Health Record” app, a representative of the Korean public PHR app. “My Health Record” allows users to experience a self-determined user-led medical environment using individual public medical data from health care providers. In addition, it is conducive to using individual-led health data and activating PHR apps. The “My Health Record” app is an interactive app that allows interaction between medical service providers and patient mHealth apps. It collectively checks individual health information scattered across public institutions and uses it for self-health management. The main information and functions provided by this app are medical check-ups, medication and vaccination histories, and health information (such as number of steps and sleep time) that can be directly inquired about, stored, and used. If the user wants, recorded health information may be transmitted to their desired place to receive medical treatment and health care services.
Case-study participants. Using a recruitment notice for usability testing, we enlisted 10 potential middle-aged users. The recruited participants did not participate in the validation study. Participants who own and use smart devices, such as smartphones, and were interested in health care were selected. Five men and five women participated, and their average age was 54.4 years (SD = 8.3). Participants were introduced to the “My Health Record” app and the evaluation purpose. This study was conducted with the approval of the IRB (7001546-202110701-HR(SB)-007-03) of Kwangwoon University.
Case-study design. Once participants had experienced seven representative functions of this app, they responded to the questionnaire (user experience evaluation scale for mHealth apps) and took part in an in-depth interview with a single moderator for approximately 30 min. The seven tasks were as follows: (1) log in through a state-operated digital one-pass to protect the patient’s personal information, (2) inquire about medical records for the past year from medical institution and pharmacy visits, (3) inquire about medication history, such as the ingredients/content of medicines dispensed at the hospital (pharmacy) in the last year, (4) inquire about the results of general check-ups, cancer screenings, and other health monitoring procedures conducted over the past 10 years, (5) inquire about vaccination history, such as vaccination order and date, (6) share and download information, such as medication information and medical history, in a PDF format, and (7) use personal health data such as walking and weight data in conjunction with Samsung Health. In-depth interviews used 25 semi-structured questions to understand users’ detailed experience. Questions included “Was this app easy to use?”, “Was it easy to understand the health/medical information provided by this app?”, “What is the biggest obstacle that you find difficulty understanding?”, and “Do you think the data collected or the ability to manage your health is useful?”. The moderator observed the users’ usage pattern and analyzed the comprehensive insight obtained through the in-depth interview.
Results of usability testing. The results of the user experience evaluation scale for mHealth apps are presented in Table 8. “Ease of information” showed the lowest user satisfaction, with an average value of 4.7. These results suggest that it is difficult for users to understand and use the health information provided by this app. It is judged that the “My Health Record” app requires high health literacy from users and lacks design considerations that reduce the health literacy requirements. In addition, “usefulness” shows an average value of 5. We further determined users’ motivations and context for the questionnaire results through in-depth interviews.
Details of the evaluation results and experience with the “My Health Record” app were comprehensively identified through in-depth interviews. The answers collected from the in-depth interviews were mapped to the five factors in the user experience evaluation scale for mHealth apps, as shown in Table 9.
Usability testing found three major limitations from the 17 key findings. First, the app needs to provide more information on medication and treatment results, as well as essential and meaningful information for health management. Specifically, medication terminology was difficult, and its usefulness was low due to the lack of efficacy and precautions. In addition, users felt that the app could have been more efficient because of its limited information on medical results. Second, the app does not provide information seamlessly. Information to match medical history and medication information was provided sporadically, causing user inconvenience. Third, the app lacks a guide or interaction for users to perform healthcare tasks, which impacts its usefulness. This problem was considered the most important part of the PHR app. Specific user comments included “I can’t decide what I should do with the information I received”, “I only provide medical information, but I don’t have an interaction with the app I need to manage”, and “I don’t know what information is in my health check”.

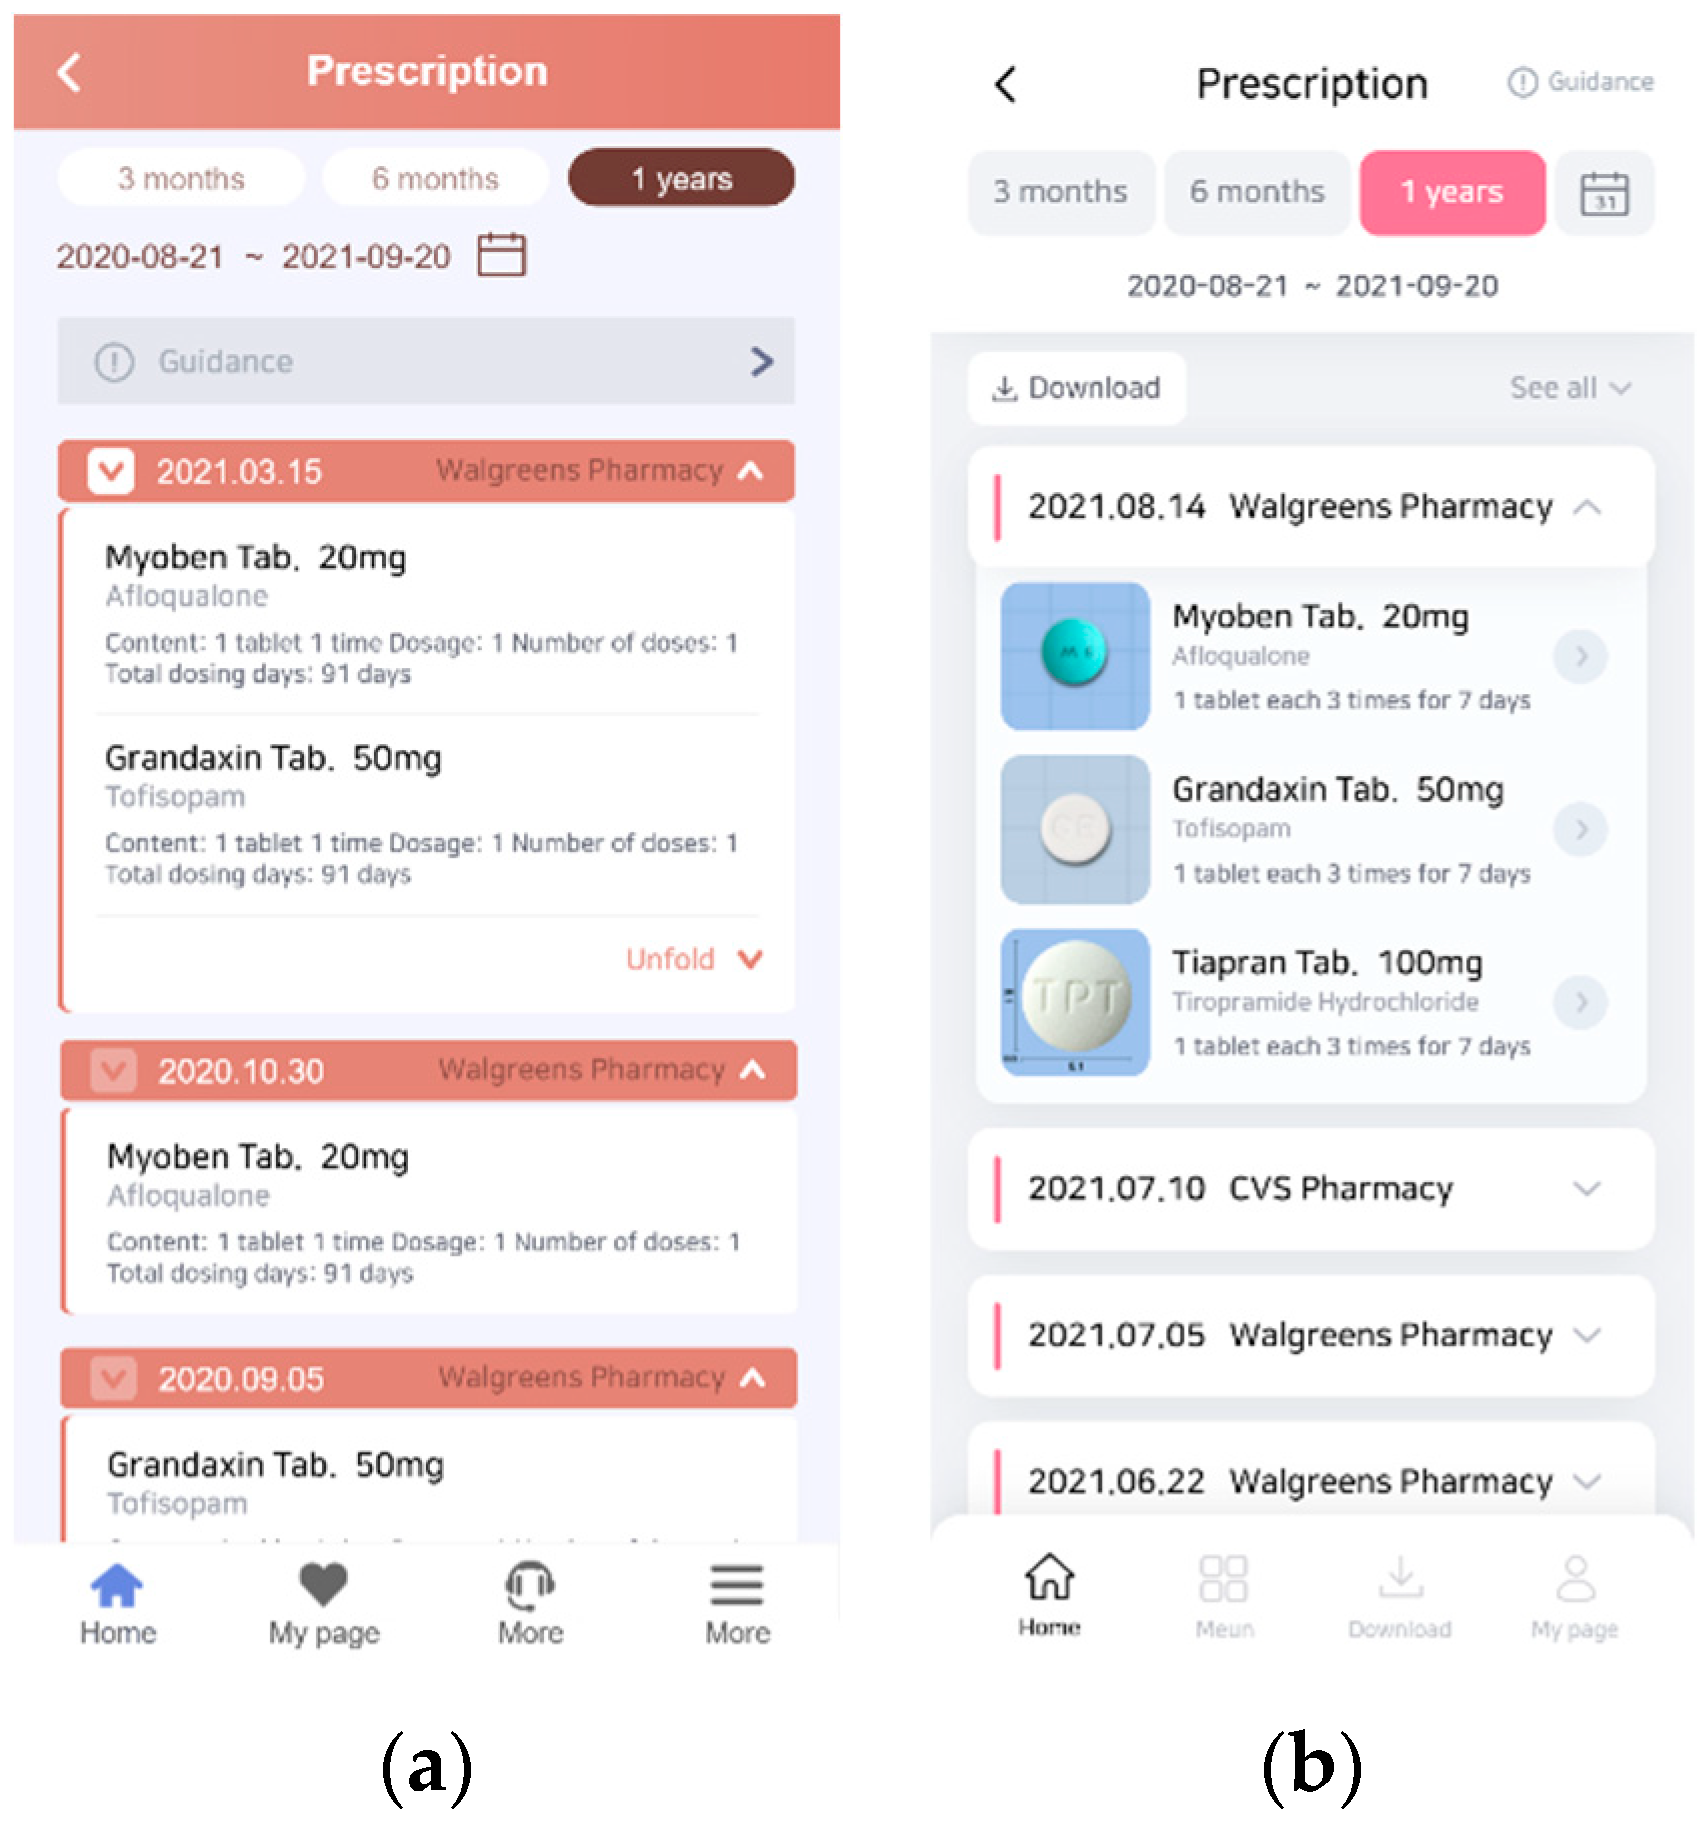
3.2.2. Prototyping a PHR App That Reflects User Experience

We conducted a heuristic evaluation with user experience experts based on app user experience and user interface (UI) improvements mapped to the five derived user experience factors. To improve the app, functions and design elements that are institutional and technically implementable were selected and defined. The app’s redesign was applied as follows and is summarized based on factors influencing user experience. The existing app and the redesigned app were written in Korean, but, to aid understanding, Figure 3, Figure 4, Figure 5 and Figure 6 are translated into English. The app’s design can also be found at the following link (https://github.com/Kimguyeop/case-study-phr (accessed on 17 December 2023)).
Ease of use and satisfaction. The main limitation based on the user experience was that “It is difficult to use because the menu button is small and the letters are not visible” and the button that should be intuitively pressed when observing the user’s usage pattern was not pressed. Therefore, we increased the visibility of the letters, as shown in Figure 3, and button functions were assigned to all boxes so that the user could be directly transferred to the corresponding health information.
Information architecture. The identified pain point in the user experience was “information alignment/classification is not user-friendly, making it difficult to understand functions and information”. In addition, an observed problem was an information structure in which many functions and menus overlap.
First, we improved the interface elements that hindered the basic user flow of the app. Detailed menus were reconstructed in terms of information structure, and menu structures were simplified and redesigned by integrating or removing overlapping menus. Finally, the visibility of the UI was increased, and the information alignment/classification was newly arranged to make it easier to understand health information.
Usefulness. The main pain point was the lack of information on medication and treatment results. There was a lack of essential and meaningful information for health management. Specifically, the medication terminology was difficult, and its usefulness was low due to the lack of efficacy and precautions. Therefore, as shown in Figure 4, the functionality was designed to increase “usefulness” within the limit of technical and institutional problems. A function was added to provide detailed information about the medication. A detailed information page was designed with images of the prescribed medication and to inform about the medication’s efficacy and precautions. In addition, it was configured to convey information about taking the prescribed medicine easily, which is important.
Ease of information. Many problems were found in the “ease of information” factor related to health information provided by the app. First, information was not seamlessly provided. Information to match medical history and medication information was provided sporadically, causing user inconvenience. Second, there was difficulty with the terminology on medicines, which was solved in “usefulness”. Third, “no guidance on the type and timing of vaccination” and a “lack of detailed explanation of vaccines” was provided. Fourth, it was difficult for patients to understand the health examination results due to numerical information being presented without technical terms and guidance, making it difficult to grasp their condition.
To solve these problems, we added intuitive visual elements that are easy to understand. The terms and images in the app were changed to improve information accessibility, and the information provision structure was redesigned to provide information seamlessly. In the vaccination history, the type and timing of vaccinations were added, and detailed explanations of the vaccine were provided, as shown in Figure 5. In addition, unlike in the original version, graphical support was provided to check the vaccination history easily. The medical check-up information function provided information regarding the derived result items and figures and showed the reference values for the figures in the form of sticker icons.
Aesthetic. Users’ opinions on the main page and the overall app design were contradictory. However, the design was considered tacky due to the excessive usage of colors and saturation. Moreover, important functions went unnoticed because they appeared complicated. The colors used in the app were newly selected, and the overall aesthetics were improved, as shown in Figure 6.

3.2.3. User Testing of the Improved PHR App

Based on the usability testing results, we conducted user testing to determine the level of user experience of the improved “My Health Record” prototype app. We gathered user opinions on the problem that we aimed to address through redesigning. Five participants (three men and two women), of an average age of 25.4 years (SD = 2.41), were recruited. Participants had experience in owning and using smart devices such as smartphones and no prior knowledge of the “My Health Record” app. We created the prototype app using Adobe XD and executed the target scenario on a smartphone, simulating a real-world usage situation. After experiencing the six representative functions of the app, excluding login, the participants filled out the questionnaire in Table 7 (user experience evaluation scale for mHealth apps) using a 7-point Likert scale and participated in an in-depth interview. The moderator observed the users’ usage patterns, and the usability of the prototype app was reviewed by analyzing the resulting pattern after the usability test. After filling out the questionnaire, the users’ internal motivation was confirmed through in-depth interviews.
The usability test revealed that the overall average value for each factor was high: ease of use and satisfaction—5.8, information architecture—6.6, usefulness—6.0, ease of information—6.6, and aesthetic—6.5. Thus, the questionnaire confirmed the high satisfaction of users.

4. Discussion

4.1. Principal Results

The evaluation model consisting of five factors and 16 items had sufficient content and construct validity, and the internal consistency of the measurement tool was good. In addition, given the researcher’s theoretical basis, the final question constructed through factor analysis can be used as an appropriate measurement variable to explain the five sub-factors of the evaluation model. The five factors are different from in the previous studies shown in Table 1. Four among the five factors, which were ease of use, usefulness, information architecture, and aesthetics, were derived similarly to previous studies [19,20,21,28,29], but it is significant that ease of information, which reflects the health literacy aspect, was newly added. This can be seen as a result that well reflects the direction pursued by recent health information technology products [7].
Using the user experience evaluation scale for mHealth apps, we carried out a case study to improve and evaluate the user experience of PHR apps. Based on the evaluation results, the case study used a user-centric approach to develop a prototype of the improved mHealth app (My Health Record). The insufficient “information architecture” and “ease of information” user experience elements showed significant improvement. User testing revealed that potential users were satisfied with the improved “My Health Record” prototype app and wanted to use it to manage their personal health data. In addition, limitations of the improvement and the future direction of development of PHR apps were found. Developers should consider user experience, functionality, and interface and apply them to app development and improvement, targeting users who lack health literacy to minimize gaps in health technology use [46].

4.2. Limitations

4.2.1. Review of a Validation Study of the User Experience Evaluation Scale for mHealth Apps

The limitations of this study and suggestions for subsequent studies are as follows. First, checking more diverse indicators for reliability testing is necessary. Reliability is the degree to which the measurement results and procedures produce the same results in repeated attempts [47]. There are three aspects of reliability: equivalence, stability, and internal consistency (homogeneity) [47]. Confirmation of this guides researchers to evaluate the reliability of research tools, such as questionnaires [48]. Reliability testing confirmed only the internal consistency using Cronbach’s α value. However, it is necessary to confirm stability with test–retest reliability and equivalence through alternate-form reliability [48].
Second, the validity needs to be verified with more samples. In factor analysis, there are various views and empirical laws regarding sample size. However, certain studies have stated that there are no general criteria for the minimum sample size to achieve a good solution [49]. For example, 60 samples were considered sufficient for 20 measurement variables to reproduce the factor structure of the population [50,51,52]. The results emphasize that data quality is more important than the sample size, and good results can be obtained even with a small sample size if it is composed of measurement variables with high commonality and factor loading values. A sample size that is too small is undesirable, but considering that factor analysis is an exploratory method, applying overly strict criteria for the sample size is unnecessary. However, conclusions should be drawn carefully, considering content validity evaluation and reliability analysis, when accepting factor analysis results and changing the existing concept–item relationship [53].
Third, the “information architecture” and “aesthetic” factors were composed of two items. However, a methodologically robust and theoretically stable analysis is only possible when there are three or more measurement variables to compose a latent variable [54]. Therefore, the results should be supplemented in subsequent studies. This study is meaningful because it conducted exploratory and confirmatory factor analysis necessary for developing and validating measurement tools.
Lastly, the user experience evaluation scale for mHealth apps could not consider all the characteristics of health-related data. Privacy and safety aspects should also be considered in future research.

4.2.2. Review of Case Study Results to Improve PHR Apps

The usability test revealed limitations in existing apps in terms of collecting and viewing various health data. Because users often use mobile PHR apps to manage personal health data, they should allow users to determine medical practices by delivering processed and not fragmented information. In addition, problems with interoperability, personalization, usability, and data quality were discovered. The goals of PHR include improving patient experience and communication with healthcare providers and promoting interoperability [55]. Thus, personalized information and health management services should be provided to the patient. Mobile PHR apps can provide patients with a certain level of convenience and authority, but they fail to provide adequate information compared with clinical visits because users can enter only limited types of personal health data. Therefore, when using the PHR portal or app, providing a wide range of user-friendly and patient-centered features to self-manage user conditions is necessary.
Most services provide information recording or viewing functions. In the future, more services are expected to provide programs that advise or intervene in health care by analyzing existing health record data. Doctors need to be involved in these services, but continuous research is needed from a user viewpoint to improve service quality and stability.
This study is limited by the self-diagnosis of the health status of the participants. Since most participants rated their health as good or excellent, the derived needs and preferences may represent a specific user group. Results may vary if participants have a chronic illness or other major health problem that needs managing.

5. Conclusions

Along with the growth of the mHealth market, numerous measurement tools have been developed to evaluate the user experience of mHealth apps. However, no universal evaluation framework covers the user experience factors identified as important in mHealth app evaluation [56]. In addition, since most evaluation measurement tools were developed with a focus on usability, they lacked detailed considerations of health literacy and aesthetics. Therefore, this study proposes a novel evaluation framework that can incorporate all evaluation criteria and provide comprehensive guidance on mHealth app evaluation. Moreover, the developed tool was verified for its validity and reliability. The performance of the measurement tool was qualitatively verified through a case study that improved and evaluated the mHealth app user experience. As a result, five factors (ease of use and satisfaction, information architecture, usefulness, ease of information, and aesthetics) were confirmed as appropriate in user experience evaluation scales for mHealth apps. Proven user experience evaluation scales for mHealth apps can improve mHealth apps for patients continuously and repeatedly. The user experience evaluation scale for mHealth apps can provide comprehensive user feedback on the app. Based on the five factors in the user experience evaluation scale for mHealth apps, the design of an existing mHealth app was significantly improved. The process developed in this study can aid in designing mHealth apps that increase user satisfaction by considering usability requirements and encourage user participation in health care, thereby improving healthcare quality. The results of this study can be used in the future evaluation and development of various mHealth apps.

Author Contributions

Conceptualization: H.K.K. and E.-S.H.; methodology and experiment: H.K.K. and G.K.; prototype: G.K.; data analysis: G.K., J.P. and D.H.; writing—original draft preparation: G.K.; writing—review and editing: H.K.K., J.P., D.H. and E.-S.H. All authors have read and agreed to the published version of the manuscript.

Funding

This research is supported the Year 2021 Culture Technology R&D Program of the Ministry of Culture, Sports and Tourism and the Korea Creative Content Agency (Project name: Development of social XR showroom technology for the distribution of cultural products by one-person enterprises and small business owners; Project Number: R2021070007, Contribution Rate: 50%) and by a Research Grant from Kwangwoon University awarded in 2023 (Contribution Rate: 50%).

Institutional Review Board Statement

Approval of the IRB (7001546-202110701-HR(SB)-007-03) of Kwangwoon University.

Informed Consent Statement

Informed consent was obtained from all subjects involved in the study.

Data Availability Statement

The data presented in this study are available on request from the corresponding author.

Conflicts of Interest

Author Eui-Seok Hwang was employed by the company Yeshcompany. The remaining authors declare that the research was conducted in the absence of any commercial or financial relationships that could be construed as a potential conflict of interest.

Abbreviations

Abb.Definition
mHealthMobile health
PHRsPersonal health records
Questionnaires
SUSSystem Usability Scale
PSSUQPost-Study System Usability Questionnaire
Health-ITUESHealth Information Technology Usability Evaluation Scale
MARSMobile Application Rating Scale
uMARSMobile Application Rating Scale, User Version
MAUQmHealth App Usability Questionnaire
USEUsefulness, Satisfaction, and Ease of Use
SUMISoftware Usability Measurement Inventory
Statistical terminology
EFAExploratory factor analysis
CFAConfirmatory factor analysis
KMOKaiser–Meyer–Olkin index
TLITucker–Lewis Index
SEStandard error
CRComposite reliability
AVEAverage variance extracted
dfDegree of freedom
CFIComparative fit index
RMSEARoot-mean-squared error of approximation
CMVCommon method variance

References

  1. World Health Organization. [WHO Guideline]: Recommendations on Digital Interventions for Health System Strengthening; World Health Organization: Geneva, Switzerland, 2019.
  2. Schnall, R.; Bakken, S.; Rojas, M.; Travers, J.; Carballo-Dieguez, A. Mhealth technology as a persuasive tool for treatment, care and management of persons living with HIV. AIDS Behav. 2015, 19 (Suppl. S2), 81–89. [Google Scholar] [CrossRef]
  3. Aitken, M.; Lyle, J. Patient Adoption of Mhealth: Use, Evidence and Remaining Barriers to Mainstream Acceptance; IMS Institute for Healthcare Informatics: Parsippany, NJ, USA, 2015. [Google Scholar]
  4. Cortez, N.G.; Cohen, I.G.; Kesselheim, A.S. FDA regulation of mobile health technologies. New Engl. J. Med. 2014, 371, 372–379. [Google Scholar] [CrossRef]
  5. Byambasuren, O.; Sanders, S.; Beller, E.; Glasziou, P. Prescribable mhealth apps identified from an overview of systematic reviews. NPJ Digit. Med. 2018, 1, 12. [Google Scholar] [CrossRef]
  6. Cho, H.; Yen, P.Y.; Dowding, D.; Merrill, J.A.; Schnall, R. A multi-level usability evaluation of mobile health applications: A case study. J. Biomed. Inform. 2018, 86, 79–89. [Google Scholar] [CrossRef]
  7. Emerson, M.R.; Buckland, S.; Lawlor, M.A.; Dinkel, D.; Johnson, D.J.; Mickles, M.S.; Fok, L.; Watanabe-Galloway, S. Addressing and evaluating health literacy in mhealth: A scoping review. mHealth 2022, 8, 33. [Google Scholar] [CrossRef]
  8. Nutbeam, D. Health promotion glossary. Health Promot. 1986, 1, 113–127. [Google Scholar] [CrossRef]
  9. Pelikan, J.M.; Ganahl, K.; Roethlin, F. Health literacy as a determinant, mediator and/or moderator of health: Empirical models using the European Health Literacy Survey dataset. Glob. Health Promot. 2018, 25, 1757975918788300. [Google Scholar] [CrossRef]
  10. Smith, B.; Magnani, J.W. New technologies, new disparities: The intersection of electronic health and digital health literacy. Int. J. Cardiol. 2019, 292, 280–282. [Google Scholar] [CrossRef]
  11. Kim, H.; Xie, B. Health literacy in the ehealth era: A systematic review of the literature. Patient Educ. Couns. 2017, 100, 1073–1082. [Google Scholar] [CrossRef] [PubMed]
  12. Caligtan, C.A.; Dykes, P.C. Electronic health records and personal health records. Semin. Oncol. Nurs. 2011, 27, 218–228. [Google Scholar] [CrossRef] [PubMed]
  13. Yamin, C.K.; Emani, S.; Williams, D.H.; Lipsitz, S.R.; Karson, A.S.; Wald, J.S.; Bates, D.W. The digital divide in adoption and use of a personal health record. Arch. Intern. Med. 2011, 171, 568–574. [Google Scholar] [CrossRef] [PubMed]
  14. Heart, T.; Ben-Assuli, O.; Shabtai, I. A review of PHR, EMR and EHR integration: A more personalized healthcare and public health policy. Health Policy Technol. 2017, 6, 20–25. [Google Scholar] [CrossRef]
  15. Cho, J.; Park, D.; Lee, H.E. Cognitive factors of using health apps: Systematic analysis of relationships among health consciousness, health information orientation, ehealth literacy, and health app use efficacy. J. Med. Internet Res. 2014, 16, e125. [Google Scholar] [CrossRef] [PubMed]
  16. Hemsley, B.; Rollo, M.; Georgiou, A.; Balandin, S.; Hill, S. The health literacy demands of electronic personal health records (e-PHRs): An integrative review to inform future inclusive research. Patient Educ. Couns. 2018, 101, 2–15. [Google Scholar] [CrossRef] [PubMed]
  17. Hajesmaeel-Gohari, S.; Khordastan, F.; Fatehi, F.; Samzadeh, H.; Bahaadinbeigy, K. The most used questionnaires for evaluating satisfaction, usability, acceptance, and quality outcomes of mobile health. BMC Med. Inform. Decis. Mak. 2022, 22, 22. [Google Scholar] [CrossRef]
  18. Azad-Khaneghah, P.; Neubauer, N.; Miguel Cruz, A.; Liu, L. Mobile health app usability and quality rating scales: A systematic review. Disabil. Rehabil. Assist. Technol. 2021, 16, 712–721. [Google Scholar] [CrossRef]
  19. Stoyanov, S.R.; Hides, L.; Kavanagh, D.J.; Zelenko, O.; Tjondronegoro, D.; Mani, M. Mobile app rating scale: A new tool for assessing the quality of health mobile apps. JMIR mHealth uHealth 2015, 3, e27. [Google Scholar] [CrossRef]
  20. Stoyanov, S.R.; Hides, L.; Kavanagh, D.J.; Wilson, H. Development and validation of the user version of the Mobile Application Rating Scale (uMARS). JMIR mHealth uHealth 2016, 4, e72. [Google Scholar] [CrossRef]
  21. Zhou, L.; Bao, J.; Setiawan, I.M.A.; Saptono, A.; Parmanto, B. The Mhealth App Usability Questionnaire (MAUQ): Development and validation study. JMIR mHealth uHealth 2019, 7, e11500. [Google Scholar] [CrossRef]
  22. Schnall, R.; Cho, H.; Liu, J. Health Information Technology Usability Evaluation Scale (Health-ITUES) for usability assessment of mobile health technology: Validation study. JMIR mHealth uHealth 2018, 6, e4. [Google Scholar] [CrossRef]
  23. Kim, G.; Kim, H.K.; Shin, Y.; Park, G.; Park, S.; Lee, Y. Analyzing user satisfaction factors for mobile health apps. In Proceedings of the Korean Society of Broadcast Engineers Conference, Online, November 2021; pp. 129–131. [Google Scholar]
  24. Kayser, L.; Karnoe, A.; Furstrand, D.; Batterham, R.; Christensen, K.B.; Elsworth, G.; Osborne, R.H. A multidimensional tool based on the ehealth literacy framework: Development and initial validity testing of the ehealth literacy questionnaire (eHLQ). J. Med. Internet Res. 2018, 20, e36. [Google Scholar] [CrossRef] [PubMed]
  25. Sus, B.J. A quick and dirty usability scale. In Usability Evaluation in Industry; Jordan, P.W., Thomas, B., Weerdmeester, B.A., McClelland, I.L., Eds.; CRC Press: London, UK, 1996. [Google Scholar]
  26. Lewis, J.R. Psychometric evaluation of the PSSUQ using data from five years of usability studies. Int. J. Hum. Comput. Interact. 2002, 14, 463–488. [Google Scholar] [CrossRef] [PubMed]
  27. Muro-Culebras, A.; Escriche-Escuder, A.; Martin-Martin, J.; Roldán-Jiménez, C.; De-Torres, I.; Ruiz-Muñoz, M.; Gonzalez-Sanchez, M.; Mayoral-Cleries, F.; Biró, A.; Tang, W.; et al. Tools for evaluating the content, efficacy, and usability of mobile health apps according to the consensus-based standards for the selection of health measurement instruments: Systematic review. JMIR mHealth uHealth 2021, 9, e15433. [Google Scholar] [CrossRef] [PubMed]
  28. Yen, P.Y.; Wantland, D.; Bakken, S. Development of a customizable health IT usability evaluation scale. AMIA Annu. Symp. Proc. 2010, 2010, 917–921. [Google Scholar] [PubMed]
  29. Terhorst, Y.; Philippi, P.; Sander, L.B.; Schultchen, D.; Paganini, S.; Bardus, M.; Santo, K.; Knitza, J.; Machado, G.C.; Schoeppe, S.; et al. Validation of the Mobile Application Rating Scale (MARS). PLoS ONE 2020, 15, e0241480. [Google Scholar] [CrossRef] [PubMed]
  30. Yen, P.Y.; Sousa, K.H.; Bakken, S. Examining construct and predictive validity of the Health-IT Usability Evaluation Scale: Confirmatory factor analysis and structural equation modeling results. J. Am. Med. Inform. Assoc. 2014, 21, e241–e248. [Google Scholar] [CrossRef] [PubMed]
  31. Lund, A.M. Measuring usability with the use questionnaire. Usability Interface 2001, 8, 3–6. [Google Scholar]
  32. Sumi, C.N. (Software Usability Measurement Inventory) as a Knowledge Elicitation Tool for Improving Usability; Department of Applied Psychology, University College Cork: Cork, Ireland, 1993. [Google Scholar]
  33. Monkman, H.; Kushniruk, A. Applying usability methods to identify health literacy issues: An example using a Personal Health Record. Stud. Health Technol. Inform. 2013, 183, 179–185. [Google Scholar]
  34. Wang, Q.; Liu, J.; Zhou, L.; Tian, J.; Chen, X.; Zhang, W.; Wang, H.; Zhou, W.; Gao, Y. Usability evaluation of mHealth apps for elderly individuals: A scoping review. BMC Med. Inform. Decis. Mak. 2022, 22, 317. [Google Scholar] [CrossRef]
  35. Sharma, S.; Barnett, K.G.; Maypole, J.J.; Mishuris, R.G. Evaluation of mHealth Apps for Diverse, Low-Income Patient Populations: Framework Development and Application Study. JMIR Form. Res. 2022, 6, e29922. [Google Scholar] [CrossRef]
  36. Voth, M.; Chisholm, S.; Sollid, H.; Jones, C.; Smith-MacDonald, L.; Brémault-Phillips, S. Efficacy, effectiveness, and quality of resilience-building mobile health apps for military, veteran, and public safety personnel populations: Scoping literature review and app evaluation. JMIR mHealth uHealth 2022, 10, e26453. [Google Scholar] [CrossRef] [PubMed]
  37. Tabachnick, B.G.; Fidell, L.S.; Ullman, J.B. Using Multivariate Statistics; Pearson: Boston, MA, USA, 2007; Volume 5. [Google Scholar]
  38. Tavakol, M.; Dennick, R. Making sense of Cronbach’s alpha. Int. J. Med. Educ. 2011, 2, 53–55. [Google Scholar] [CrossRef] [PubMed]
  39. Hong, S.H. The criteria for selecting appropriate fit indices in structural equation modeling and their rationales. Korean J. Clin. Psychol. 2000, 19, 161–177. [Google Scholar]
  40. Bentler, P.M. Comparative fit indexes in structural models. Psychol. Bull. 1990, 107, 238–246. [Google Scholar] [CrossRef] [PubMed]
  41. Bollen, K.A.; Long, J.S. Testing Structural Equation Models; Sage: Newbury Park, CA, USA, 1993; Volume 154. [Google Scholar]
  42. Harman, H.H. Modern Factor Analysis; University of Chicago Press: Chicago, IL, USA, 1976. [Google Scholar]
  43. Malhotra, N.K.; Kim, S.S.; Patil, A. Common method variance in IS research: A comparison of alternative approaches and a reanalysis of past research. Manag. Sci. 2006, 52, 1865–1883. [Google Scholar] [CrossRef]
  44. Podsakoff, P.M.; MacKenzie, S.B.; Lee, J.Y.; Podsakoff, N.P. Common method biases in behavioral research: A critical review of the literature and recommended remedies. J. Appl. Psychol. 2003, 88, 879–903. [Google Scholar] [CrossRef] [PubMed]
  45. Hair, J.F.; Black, W.C.; Babin, B.J.; Anderson, R.E.; Tatham, R. Multivariate Data Analysis; Pearson Prentice Hall: Upper Saddle River, NJ, USA, 2006; Volume 6. [Google Scholar]
  46. Bauer, A.M.; Rue, T.; Munson, S.A.; Ghomi, R.H.; Keppel, G.A.; Cole, A.M.; Baldwin, L.M.; Katon, W. Patient-oriented health technologies: Patients’ perspectives and use. J. Mob. Technol. Med. 2017, 6, 1–10. [Google Scholar] [CrossRef]
  47. Wong, K.L.; Ong, S.F.; Kuek, T.Y. Constructing a survey questionnaire to collect data on service quality of business academics. Eur. J. Soc. Sci. 2012, 29, 209–221. [Google Scholar]
  48. Bolarinwa, O.A. Principles and methods of validity and reliability testing of questionnaires used in social and health science researches. Niger. Postgrad. Med. J. 2015, 22, 195–201. [Google Scholar] [CrossRef]
  49. Hogarty, K.Y.; Hines, C.V.; Kromrey, J.D.; Ferron, J.M.; Mumford, K.R. The quality of factor solutions in exploratory factor analysis: The influence of sample size, communality, and overdetermination. Educ. Psychol. Meas. 2005, 65, 202–226. [Google Scholar] [CrossRef]
  50. MacCallum, R.C.; Widaman, K.F.; Zhang, S.; Hong, S. Sample size in factor analysis. Psychol. Method 1999, 4, 84–99. [Google Scholar] [CrossRef]
  51. Arrindell, W.A.; Van der Ende, J. An empirical test of the utility of the observations-to-variables ratio in factor and components analysis. Appl. Psychol. Meas. 1985, 9, 165–178. [Google Scholar] [CrossRef]
  52. Barrett, P.T.; Kline, P. The observation to variable ratio in factor analysis. Personal. Stud. Group Behav. 1981, 1, 23–33. [Google Scholar]
  53. Kang, H. A guide on the use of factor analysis in the assessment of construct validity. J. Korean Acad. Nurs. 2013, 43, 587–594. [Google Scholar] [CrossRef] [PubMed]
  54. Zwick, W.R.; Velicer, W.F. Comparison of five rules for determining the number of components to retain. Psychol. Bull. 1986, 99, 432–442. [Google Scholar] [CrossRef]
  55. Tang, P.C.; Ash, J.S.; Bates, D.W.; Overhage, J.M.; Sands, D.Z. Personal health records: Definitions, benefits, and strategies for overcoming barriers to adoption. J. Am. Med. Inform. Assoc. 2006, 13, 121–126. [Google Scholar] [CrossRef]
  56. Hensher, M.; Cooper, P.; Dona, S.W.A.; Angeles, M.R.; Nguyen, D.; Heynsbergh, N.; Chatterton, M.L.; Peeters, A. Scoping review: Development and assessment of evaluation frameworks of mobile health apps for recommendations to consumers. J. Am. Med. Inform. Assoc. 2021, 28, 1318–1329. [Google Scholar] [CrossRef]
Figure 1. Development flowchart for the user experience evaluation scale for mHealth apps.
Electronics 13 00213 g001
Figure 2. Model of the study (CFA).
Electronics 13 00213 g002
Figure 3. Example of a prototype app page with improved “ease of use and satisfaction”: (a) existing main page and (b) improved main page.
Electronics 13 00213 g003
Figure 4. Example of a prototype app page with improved “usefulness”: (a) the existing prescription page and (b) the improved prescription page.
Electronics 13 00213 g004
Figure 5. Example of a prototype app page with improved “ease of information”: (a) existing vaccination page, (b) improved vaccination page, and (c) improved vaccination page.
Electronics 13 00213 g005
Figure 6. Example of a “Health Record” page in the prototype app: (a) health record and (b) number of steps.
Electronics 13 00213 g006
Table 1. Mobile health app measurements.
MeasurementAuthor(s)Dimensions
(Number of Items)
Reliability TestingValidity
Testing
Health-ITUESYen et al. [28]Impact (3)
Perceived usefulness (9)
Perceived ease of use (5)
User control (3)
Internal consistency
Inter-rater reliability
Construct validity
Criterion validity
MARSStoyanov et al. [19]
Terhorst et al. [29]
Engagement (5)
Functionality (4)
Aesthetics (3)
Information (7)
App subjective quality (4)
Internal consistency
Inter-rater reliability
Construct validity
Criterion validity
uMARSStoyanov et al. [20]Engagement (5)
Functionality (4)
Aesthetics (3)
Information (4)
App subjective quality (4)
Internal consistency
Test–retest reliability
None
MAUQZhou et al. [21]Ease of use and
Satisfaction (8)
System information
Arrangement (6)
Usefulness (7)
Internal consistencyContent validity
Construct validity
Criterion validity
Note. Health-ITUES = Health Information Technology Usability Evaluation Scale, MARS = Mobile Application Rating Scale, uMARS = Mobile Application Rating Scale, User Version, MAUQ = mHealth App Usability Questionnaire.
Table 2. Factors influencing user experience evaluation scale for mHealth apps.
FactorsContents
Ease of Use and
Satisfaction
Evaluate the overall usability and satisfaction, such as convenience and learnability.
Information
Architecture
Evaluate the quality of factors such as interface and interaction.
UsefulnessEvaluate whether users have achieved the right results to meet their needs and expectations.
Ease of
Information
Evaluate whether the design considers the user’s health literacy.
AestheticEvaluate the app’s overall design and whether the color, font, and font size are user-appropriate.
Table 3. Results of the exploratory factor analysis (EFA) (N = 70).
Factor (Item)Factor Loading Cronbach s   α
Ease of Use and Satisfaction
Q1. This app was easy to use.0.8480.900
(5 items)
Q2. I was able to use all the functions provided by the app.0.752
Q3. It is comfortable to use this app in everyday environments.0.806
Q4. The amount of time involved in using this app fits me.0.756
Q5. Overall, I am satisfied with this app.0.860
Information Architecture
Q6. Whenever I made a mistake using the app, I could recover easily and quickly.0.6100.731
(2 items)
Q7. Moving between screens or between functions was consistently possible in the same way.0.770
Usefulness
Q8. This app has all the functions and capabilities I expect it to have.0.8290.920
(5 items)
Q9. This app will be useful for my health care.0.886
Q10. This app will help me manage my health effectively.0.881
Q11. This mHealth app provided an acceptable way to receive health care services.0.728
Q12. This app has improved access to medical services.0.672
Ease of Information
Q13. This app’s medical/health information is well-written, accurate, and relevant to the app’s purpose.0.8180.940
(4 items)
Q14. The information provided by this app is comprehensive and concise.0.859
Q15. The visual information provided by this app (charts, graphs, images, etc.) is logically and clearly descriptive0.825
Q16. The information provided by this app was easy to understand.0.847
Aesthetic
Q17. This app uses suitable colors.0.8850.936
(2 items)
Q18. I like the menu structure and design of the app, and it’s easy to use.0.890
Note. Overall Cronbach’s α = 0.925.
Table 4. Results for the goodness-of-fit index of the CFA model.
Variables x 2 dfpCFITLIRMSEA
Five-factor model
(18 Items)
186125<0.0010.9440.9310.084
Five-factor model
(16 Items)
111940.1150.9830.9780.050
Note. df: degrees of freedom, CFI: comparative fit index, TLI: Tucker–Lewis index, RMSEA: root-mean-squared error of approximation.
Table 5. Results of the CFA of the evaluation model (N = 70).
FactorVariablesEstimateSEt-ValueStandardized EstimateCRAVE
Ease of Use and SatisfactionQ11.000 0.7550.8940.682
Q21.4250.2106.80 ***0.767
Q31.1070.1606.90 ***0.775
Q51.1910.1388.66 ***0.984
Information ArchitectureQ61.000 0.7900.7330.579
Q70.8720.1914.57 ***0.731
UsefulnessQ81.000 0.9000.9340.782
Q91.0890.07514.63 ***0.966
Q101.2470.08614.52 ***0.962
Q120.7610.1106.94 ***0.679
Ease of InformationQ131.000 0.7880.9430.807
Q141.0340.1129.21 ***0.924
Q151.0370.1119.31 ***0.935
Q161.1700.1259.34 ***0.937
AestheticQ171.000 0.9530.9370.881
Q181.0190.1278.03 ***0.924
Note. ***: p < 0.001, SE: standard error, CR: composite reliability, AVE: average variance extracted.
Table 6. Discriminant validity of the construct.
ConstructEase of Use and SatisfactionInformation ArchitectureUsefulnessEase of InformationAesthetic
Ease of Use and Satisfaction0.826 *----
Information Architecture0.5680.761 *---
Usefulness0.4470.4730.885 *--
Ease of Information0.3530.4860.5880.898 *-
Aesthetic0.4010.5340.3860.2540.939 *
Note. *: square root of the AVE; discriminant validity:  A V E  > Corr.
Table 7. User experience evaluation scale for mHealth apps.
ComponentsQuestions
Ease of Use and Satisfaction1. This app was easy to use.
2. I was able to use all the functions provided by the app.
3. It is comfortable to use this app in everyday environments.
4. Overall, I am satisfied with this app.
Information Architecture5. Whenever I made a mistake using the app, I could recover easily and quickly.
6. Moving between screens or between functions was consistently possible in the same way.
Usefulness7. This app has all the functions and capabilities I expect it to have.
8. This app will be useful for my health care.
9. This app will help me manage my health effectively.
10. This app has improved access to medical services.
Ease of Information11. This app’s medical/health information is well-written, accurate and relevant to the app’s purpose.
12. The information provided by this app is comprehensive and concise.
13. The visual information provided by this app (charts, graphs, images, etc.) is logically and clearly descriptive
14. The information provided by this app was easy to understand.
Aesthetic15. This app uses suitable colors.
16. I like the menu structure and design of the app, and it’s easy to use.
Table 8. Results of the user experience evaluation scale for mHealth apps (N = 10).
FactorEase of Use and SatisfactionInformation ArchitectureUsefulnessEase of InformationAesthetic
mean5.25.15.04.75.7
Note. 7-point Likert scale.
Table 9. Examples of in-depth interview results.
ComponentsContents
Ease of Use and Satisfaction- Membership (digital one-pass) and login procedures are complicated.
- Manual data entry is cumbersome.
- The menu buttons are small, and the letters are hard to see, making it difficult to use.
- The app is intuitive and easy to use in everyday environments.
Information Architecture- Information sorting/classification is not user-friendly and difficult to understand.
- Easy-to-find functions are provided by the app.
Usefulness- The information provided by this app is unlikely to help me manage my health.
- Lack of interaction and motivation with apps to manage health.
- No guide for health care.
Ease of Information- Lack of information on detailed medication (effectiveness and precautions unknown).
- Lack of medical information (disease name, doctor’s opinion).
- Drug terminology is difficult.
- No detailed explanation on timing of the vaccine.
- No information on what items and figures are in the medical check-up.
- Information visibility (lack of visual elements).
Aesthetic- Opinions of users about the design of the main screen are conflicting.
- The app has too many colors, so the design is tacky.
Disclaimer/Publisher’s Note: The statements, opinions and data contained in all publications are solely those of the individual author(s) and contributor(s) and not of MDPI and/or the editor(s). MDPI and/or the editor(s) disclaim responsibility for any injury to people or property resulting from any ideas, methods, instructions or products referred to in the content.

