4.1. Dataset and Evaluation Protocols
VeRi-776 [
39] is collected from 20 real-world surveillance cameras in an urban district; there are more than 50,000 images of 776 vehicles in total. The images have diverse labels containing identity annotations, vehicle attributes and spatio-temporal information. The dataset is divided into two subsets for training and testing. The training set includes 37,781 images of 576 vehicles and the test set includes 11,579 images of 200 vehicles.
VehicleID [
40] is a dataset of vehicle images captured by real-world cameras during the daytime. Each subject in VehicleID has a massive number of images collected from the front and back, and some of the images are annotated with various aspects of model information to facilitate the Ve-ID. Its training set includes 110,178 images of 13,134 vehicles. Its test set is divided into three sections; they are as follows: Test800 is made up of 6532 probe images and 800 gallery images of 800 vehicles, Test1600 is comprised of 11,385 probe images and 1600 gallery images of 1600 vehicles, and Test2400 is composed of 17,638 probe images and 2400 gallery images of 2400 vehicles.
VERI-Wild [
41] contains 416,314 images of 40,671 subjects. The vehicle images are captured by 174 high-definition cameras scattered randomly in the wild. Different from the training set with 277,797 images of 30,671 identities, the testing set is divided as follows: Test3000 with 41,816 images, Test5000 with 69,389 images, and Test10000 with 138,517 images, respectively.
Probe refers to the collection of vehicle images which need to be queried. Gallery is a candidate image set that contains all identity vehicles. The task of vehicle Re-ID is the process of matching vehicle images with the same identity as the probe in the gallery through a probe. That is to say, the difference between the two is that the probe is the target vehicle to be retrieved, and the gallery is used to provide the probe for matching. Due to limitations in computing power, we extracted 30,000 images from the training sets of VeRi-776 and VERI-Wild as the target domains for training, respectively.
The detailed statistics of the above-mentioned three vehicle Re-ID datasets are shown in
Table 1.
For the cross-domain vehicle Re-ID task, the Rank-n accuracy (i.e., n = 1 or 5), and the mean average precision (mAP) are utilized to evaluate overall performance for test images.
Calculation of Rank-
n. The Rank-
n is used to represent the hit probability of the vehicle Re-ID ranking result, which represents the probability that the probe image
i finds the positive candidate sample within the top-
n retrieval results,
where
M represents the total number from the probe set to be queried, and
is a two-value logic function. When there are positive samples
i in the top-
n ranking results, the value of
is equal to 1, otherwise it is 0.
Calculation of mAP. For each probe image, the average precision (AP) is computed as
where
N is the total number of images in the gallery set. Values
and
represent the precision at the
j-th position in the ranking list and a two-value logic function, respectively. If a probe matches the
j-th element, then
gt(
j) = 1; otherwise,
gt(
j) = 0.
Then, the average accuracy mAP of each probe image by the value of AP can be calculated as
where
M represents the total number from the probe set to be queried, and AP(
i) represents the accuracy AP calculated for each probe image
i.
Calculation of Macro-averaged F1 score. The F1 score is the harmonic mean of precision and recall, and it is commonly used to determine the accuracy of classification tasks. Precision refers to the proportion of correctly identified positive items to all identified positive items, while recall refers to the proportion of correctly identified positive items to all actual positive items. The F1 score can be calculated as
where
TP (i.e., true positive) represents items correctly identified as positive,
FP (i.e., false positive) represents items incorrectly identified as positive, and
FN (i.e., false negative) represents items incorrectly identified as negative.
The Macro-F1 score used in this paper evaluates the overall classification performance of vehicle Re-ID by calculating the arithmetic mean of all label F1 scores in the gallery. The formula for Macro-F1 score is written as
where
,
, and
represent the number of true positives, false positives, and false negatives for class
l in all samples in the gallery set, respectively.
L represents the number of categories for all vehicles in the gallery set. The larger the value of Macro-F1, the better the classification performance of the vehicle.
4.3. Ablation Studies
To evaluate the effectiveness of the proposed method in cross-domain tasks, we conducted a sequence of detailed ablation analyses, as described in this section.
Effectiveness of each module. To verify the contribution of each individual module,
Table 2 reports the performance of different modules in cross-domain vehicle Re-ID. Each module is explained as follows:
“Direct Transfer” means adopting the traditional cross-domain Re-ID method, using ResNet-50 as the backbone.
The term “w/o (O + A)” means adopting the traditional cross-domain Re-ID method, using PLPNet as the backbone.
The term “w/o O” means not using the meta-orientation adaptation learning strategy and only using the angle invariance pre-training method for cross-domain Re-ID tasks.
The term “w/o A” means not using the angle invariance pre-training method and only using the meta-orientation adaptation learning strategy for cross-domain Re-ID tasks.
“Ours” means using all proposed modules.
As can be seen from the experimental results, the performance of the “Direct Transfer” method is the worst. The key reason is that the negative impacts of viewpoint variations on pre-training and downstream tasks are not considered. Compared with “Direct Transfer,” the “w/o (O + A)” method greatly improves the accuracy of mAP and Rank. It is further confirmed that the fine-grained features extracted by PLPNet in the source domain pre-training can improve the accuracy of downstream tasks. It is noteworthy that “Our” method achieves better performance than “w/o O” and “w/o A”. This result proves that our method combines the advantages of angle-level viewpoint invariance and orientation-level viewpoint generalization.
Effectiveness of different pre-training models. To demonstrate the superiority of PLPNet as a pre-training model, we further explore the three backbones of ResNet-50, PCB, and DenseNet for pre-training. Specifically, the ResNet-50 is a widely used traditional baseline for feature extraction tasks, one which achieved high accuracy on each large target classification dataset. PCB is a strong baseline for learning part-informed features, which can better capture fine-grained features and context information between vehicle-part regions. Compared with ResNet, DenseNet has a smaller number of parameters, and its bypass enhances feature reuse with better resistance to fit. However, the complementary parsing of coarse-grained features and fine-grained feature information plays an important role in vehicle re-identification, one which is lacking in these three backbones above. PLPNet adopts the advantages of pyramidal convolution, which can both accurately capture fine-grained features and explore the relationship between different levels of feature information. Thus, PLPNet improves the resolution accuracy of different angle-level viewpoints of the same vehicle. As shown in
Table 3, PLP-Net performs the best compared with all the other pre-training models in both mAP and Rank-1 accuracy in the two datasets, which verifies that PLPNet is a competitive pre-training model in the cross-domain Re-ID task.
The influence of different orientation-level view partitions N. The selection of different orientation-level view partitions will be analyzed first, as it will directly affect the precision of dual-level view definition at the orientation level. We evenly divide the orientation-level view labels into 9, 12, 18, and 36 parts in the entire angle-level range.
Table 4 shows the influence of different selections on UDA Re-ID performance. In the experimental results, it can be seen that our method yields the best Rank-1, Rank-5, and mAP when the partition
N is equal to 18. Therefore, the more orientation-level view labels are divided, the performance of Re-ID may be increasingly affected, and it should be maintained within an appropriate range.
Sensitivity analysis on meta-learning split ratio. To find the best split ratio of meta-orientation training step and meta-orientation testing step, we set a parameter
between 0 and 1.
Table 5 compares the Rank-1, Rank-5, and mAP of different
in a meta-learning manner. Notably, the proposed method achieves 83.10% Rank-1 and 37.80% mAP accuracy when
is set to 0.6 on VeRi-776. The interval accuracy of the value of parameter
is close to 0.6. It can be observed that during the training process of using two datasets as target domains, the highest Re-ID performance is achieved when parameter
is in a range close to 0.5 to 0.7, and when parameter
is far from this range, it will make the Re-ID performance more sensitive. That is to say, the selection of parameter
will change the distribution of vehicle viewpoint in the meta-learning process, thereby affecting the Re-ID performance. On the other hand, the closer the value of parameter
is to the range of 0.5 to 0.7, the more evenly distributed the viewpoint information contained in the partitioned meta-orientation training and meta-orientation testing. This also fully verifies the robustness of our dual-level viewpoint-annotation proposal method, which can calculate the viewpoint information of each sample in datasets with different data distributions.
4.4. Qualitative Visualization Analysis
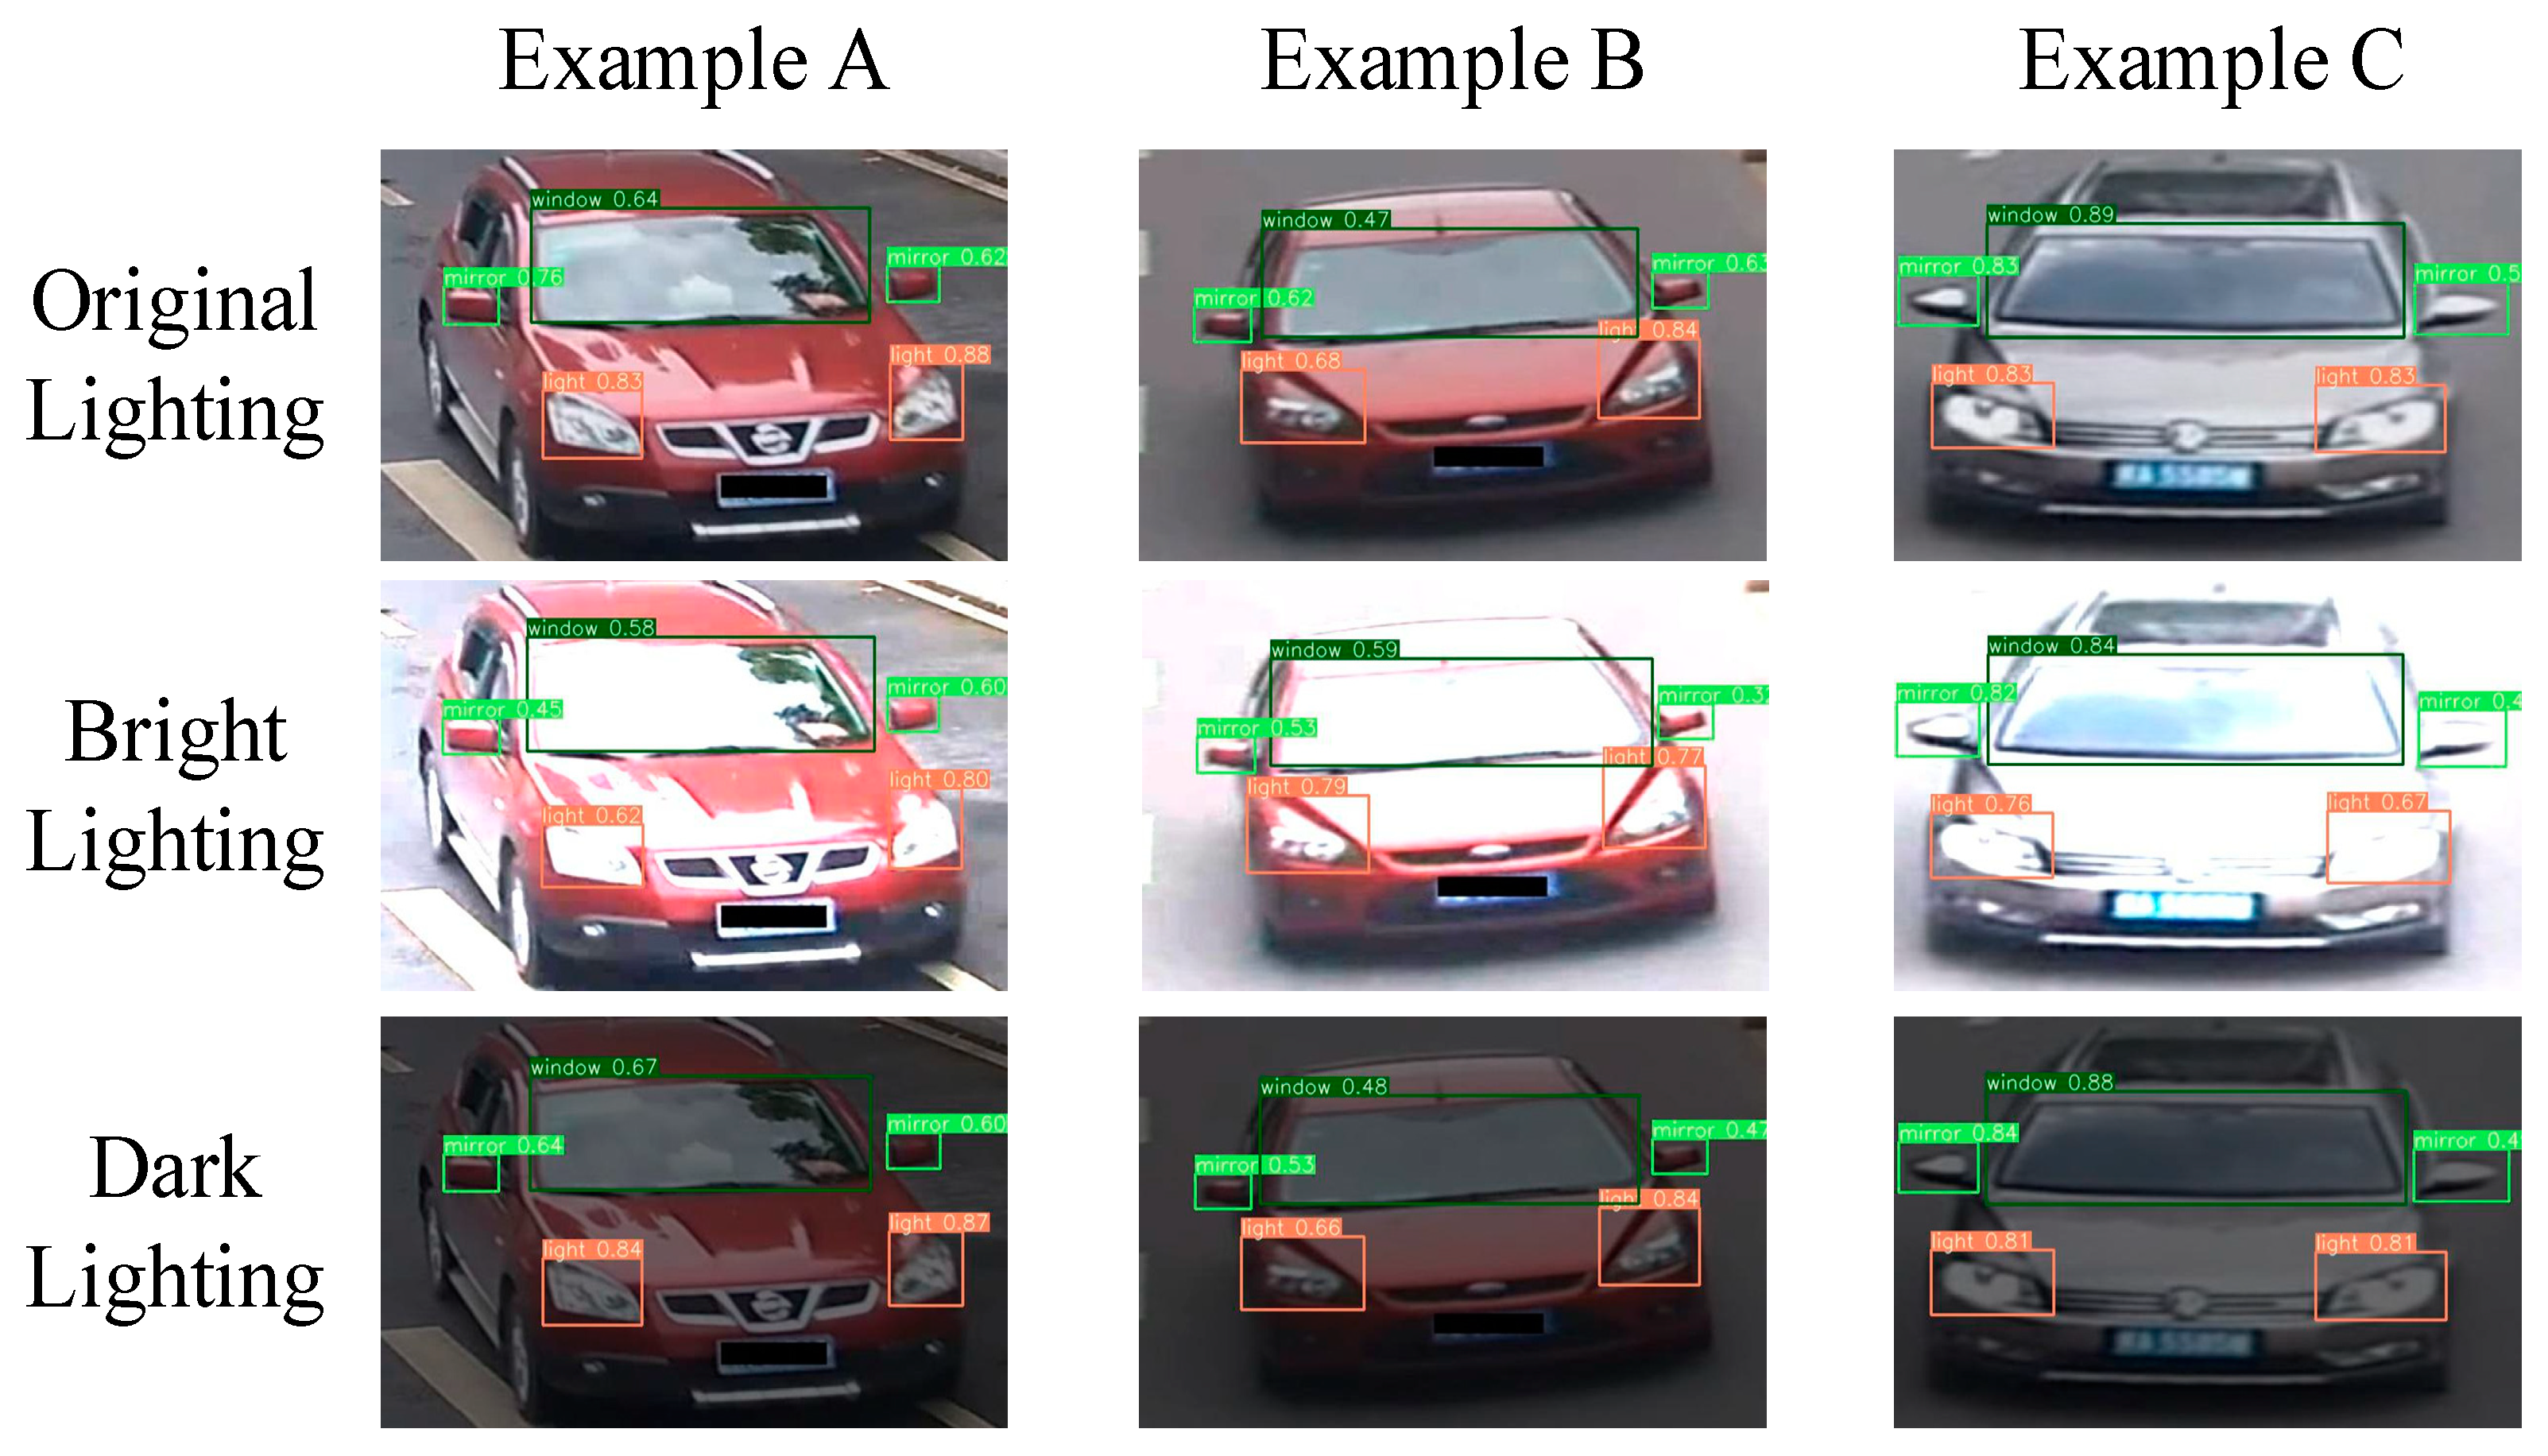
Comparison of vehicle-part detection under different lighting conditions. To verify the robustness of YOLOv4 under different lighting conditions, we visualize the detection results of vehicle parts under bright and dark lighting conditions, as shown in
Figure 4. It can be observed that the YOLOv4 model can accurately detect predefined vehicle-part bounding boxes under different lighting conditions. For instance, Example B can accurately detect car windows, even if the surrounding background and reflective window are extremely similar in color, under bright lighting conditions.
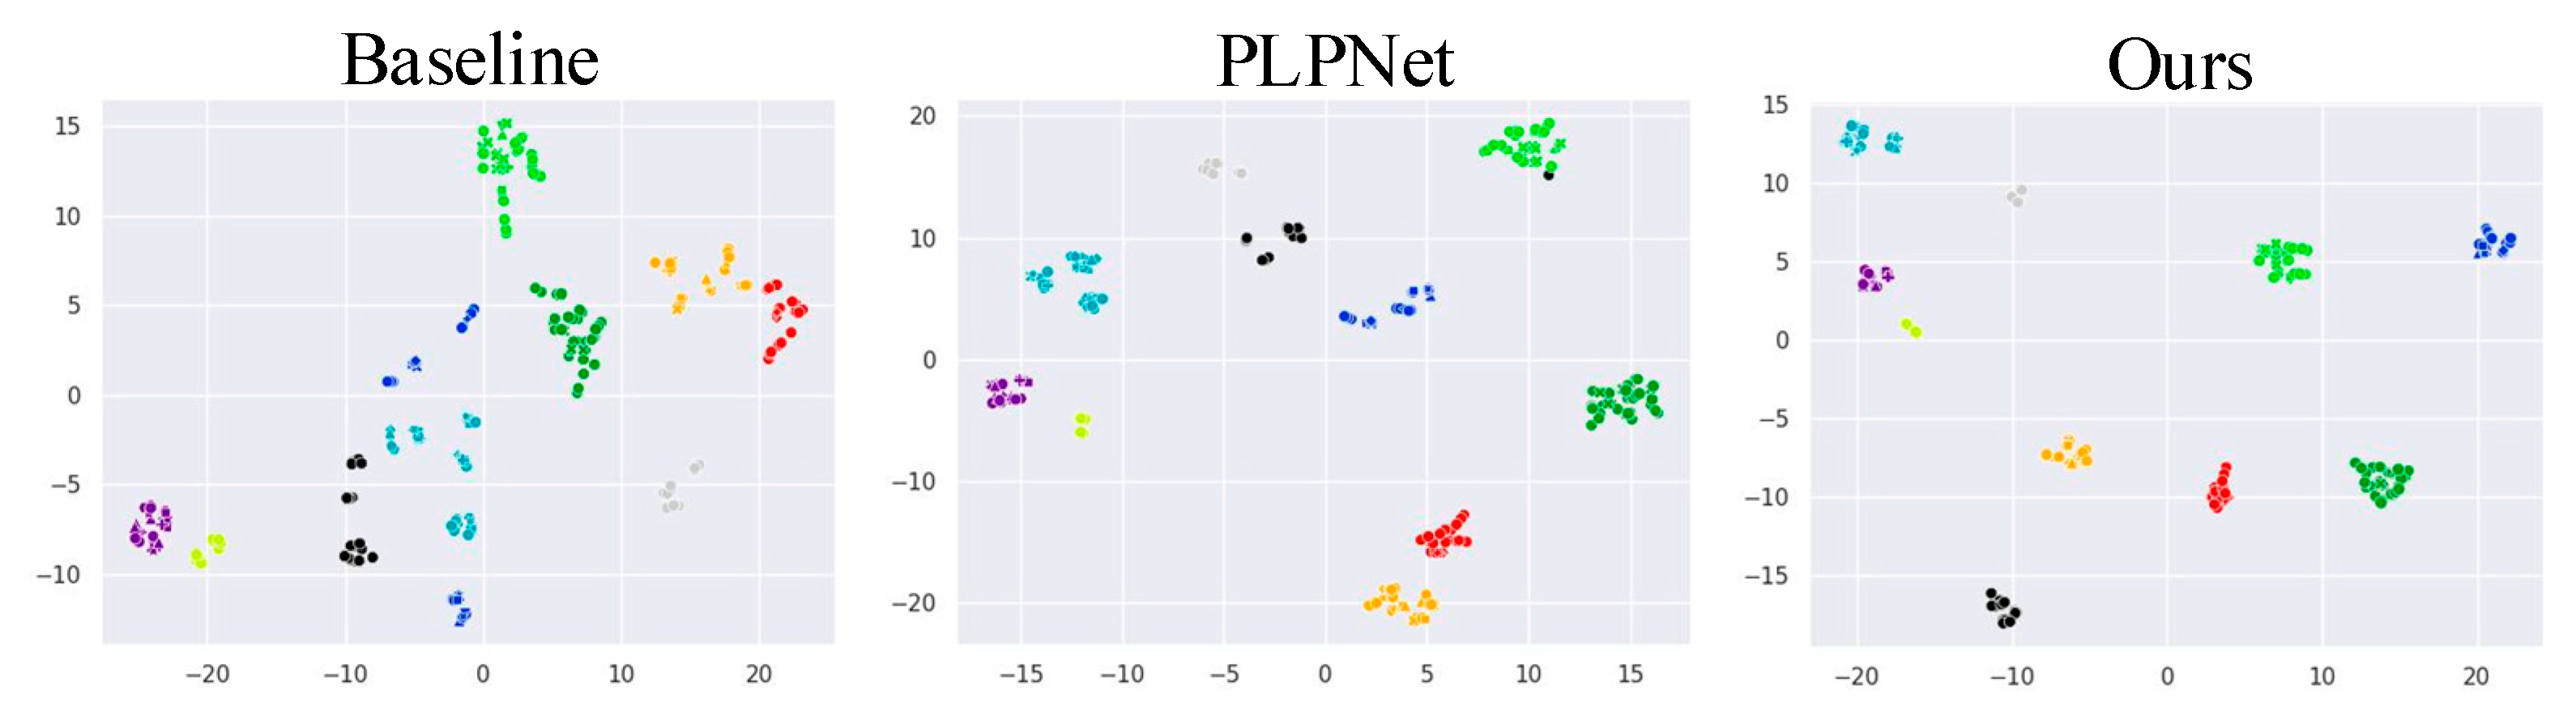
The t-Distributed Stochastic Neighbor Embedding (t-SNE) visualization. We visualize the t-SNE feature map of 10 classes of vehicles randomly sampled from the VeRi-776 dataset under different settings. It is worth noting that t-SNE is a non-linear dimensionality reduction technique used to map high-dimensional data to a two-dimensional spatial coordinate system. Therefore, the x-axis and y-axis represent the position information of the vehicle sample in the reduced two-dimensional space, respectively. As shown in
Figure 5, different colors denote vehicle instance examples with different IDs, and different shapes represent different viewpoints. “Ours” means using all proposed modules. “Baseline” and “PLPNet” indicate that ResNet-50 and PLPNet are adopted as backbones for the traditional cross-domain Re-ID method. It can be seen that PLPNet and our model achieve more separable results among different classes than does the baseline model. Specifically, the features of the same category extracted by PLPNet are most compact in the feature space. What is more, the clusters of different categories are pulled away from each other. This indicates that our model is not only able to learn angle invariance features by capturing the fine-grained features of vehicles, but also has strong generalization ability to vehicle viewpoint variations.
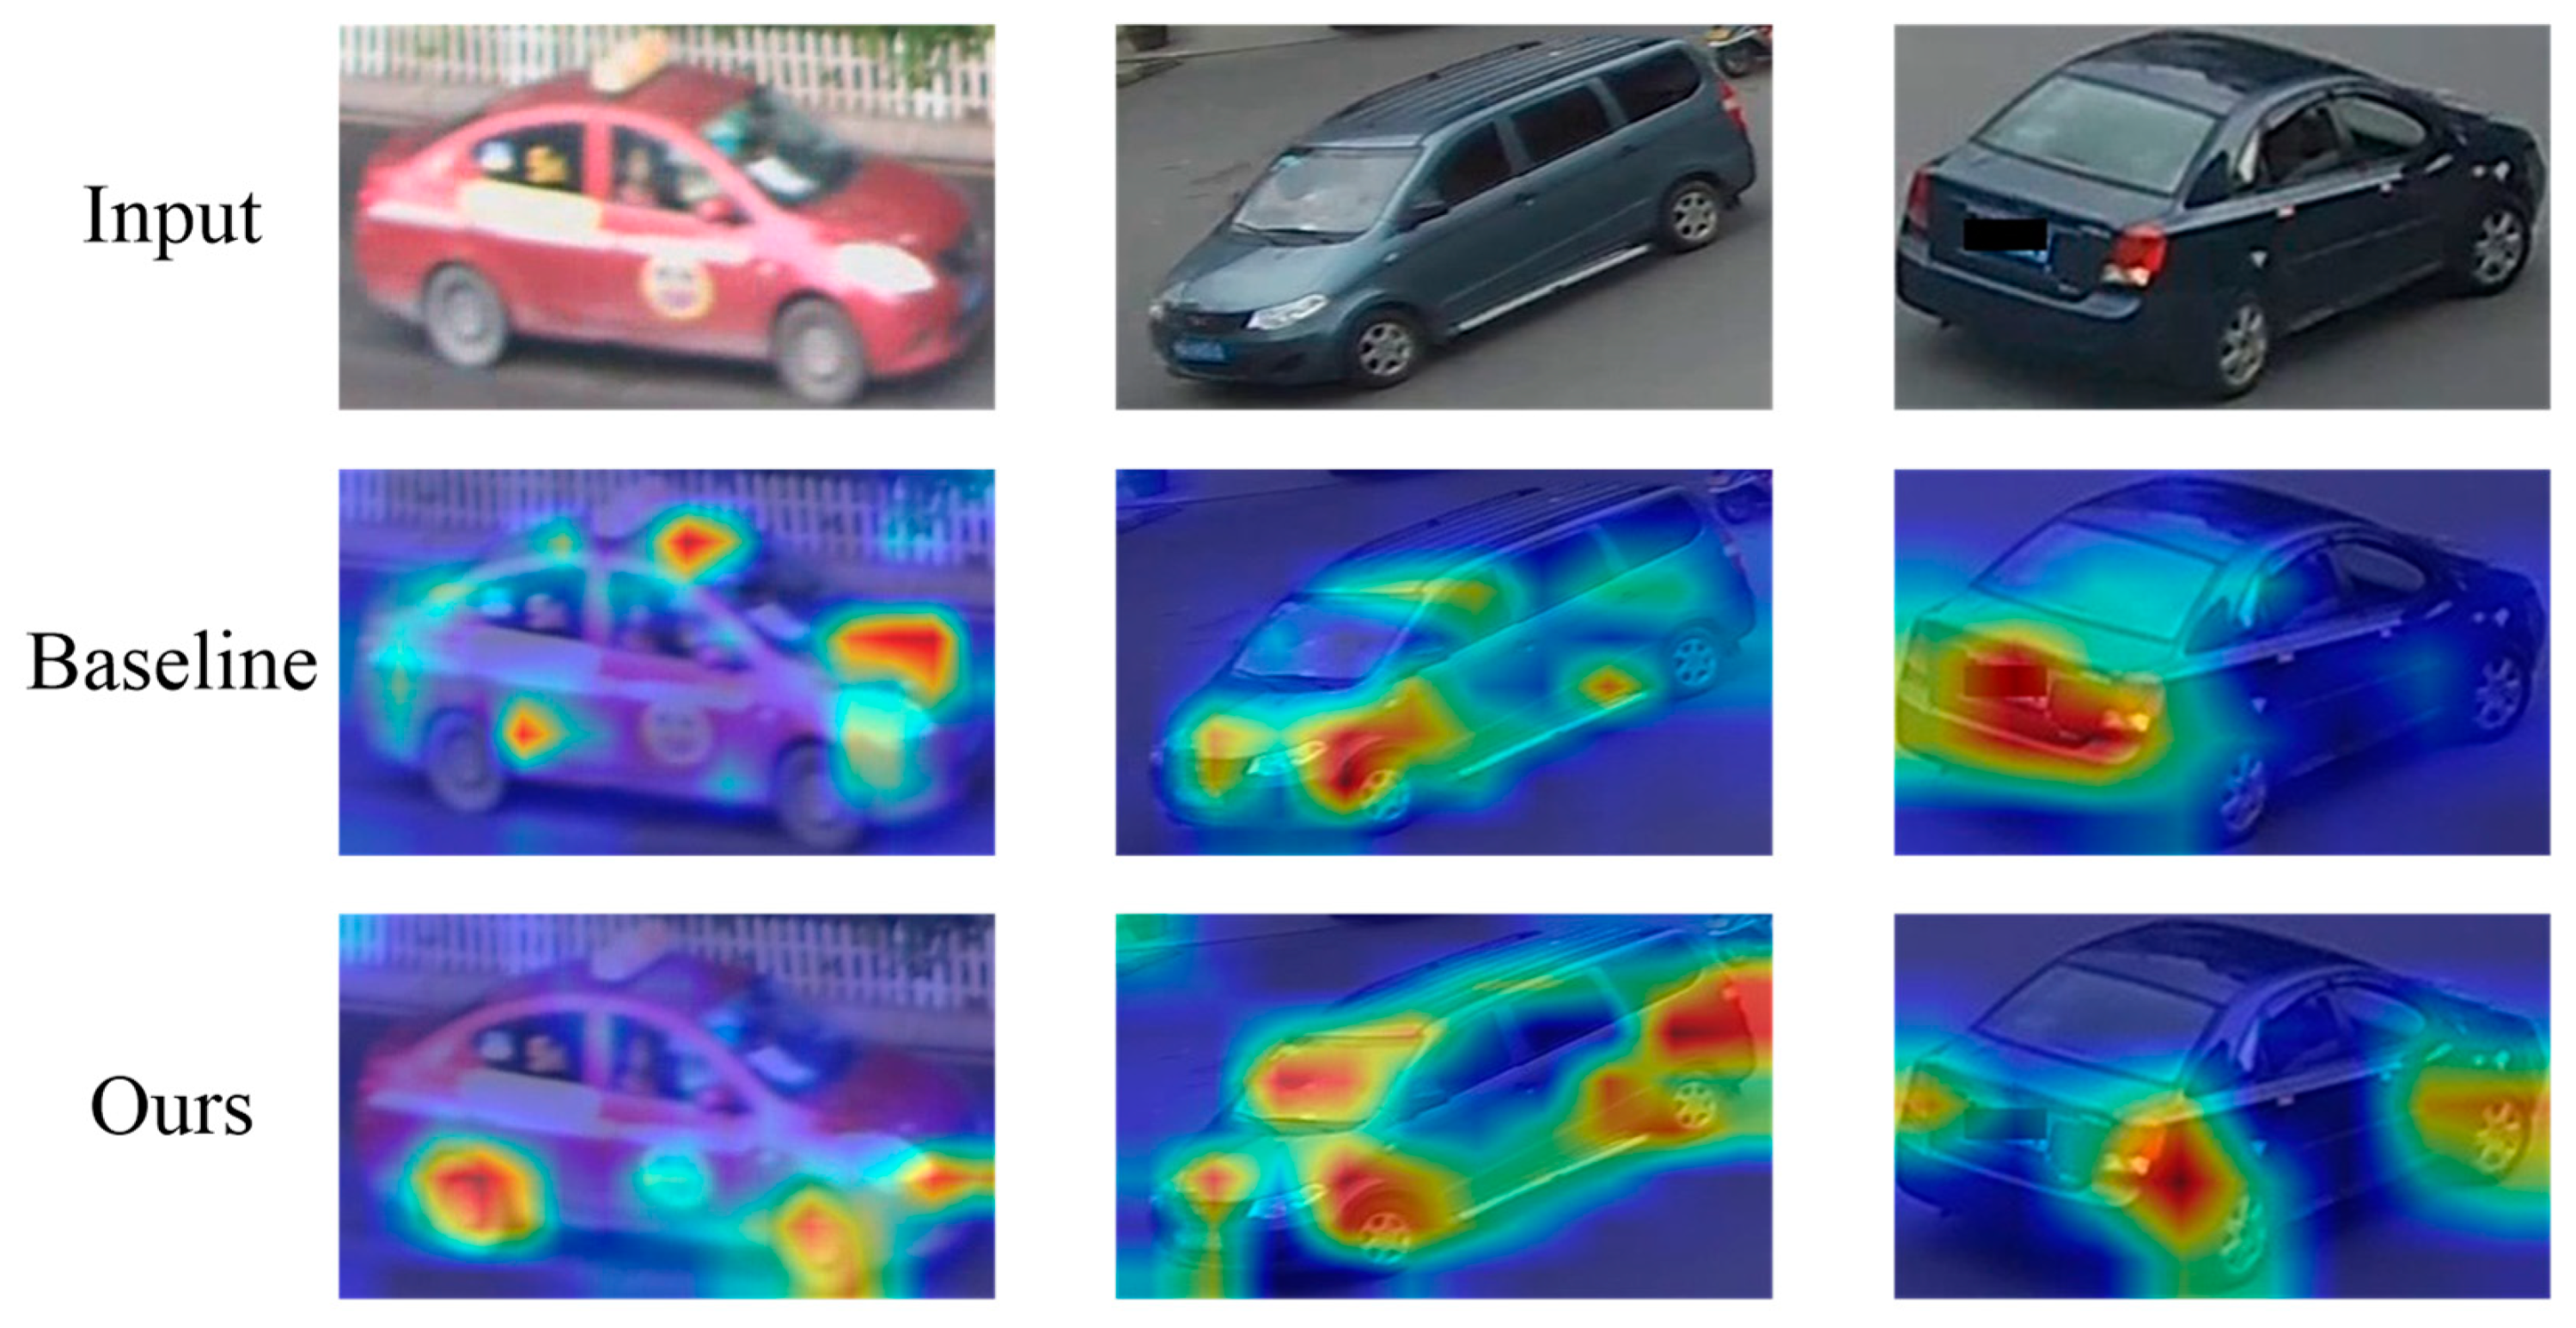
Feature attention map visualizations. To further evaluate the validity of the features generated from PLPNet in the “Ours” method, we randomly selected three images from the VeRi-776 and compared them with the feature attention maps obtained from the baseline (i.e., ResNet-50). As shown in
Figure 6, it can be observed that the feature maps obtained from the baseline only concentrate on some relatively fuzzy regions. The “Ours” method using PLPNet focuses on more discriminative and fine-grained details of the vehicle, like headlights and wheels, which are superior in capturing discriminative cues from the vehicle image.
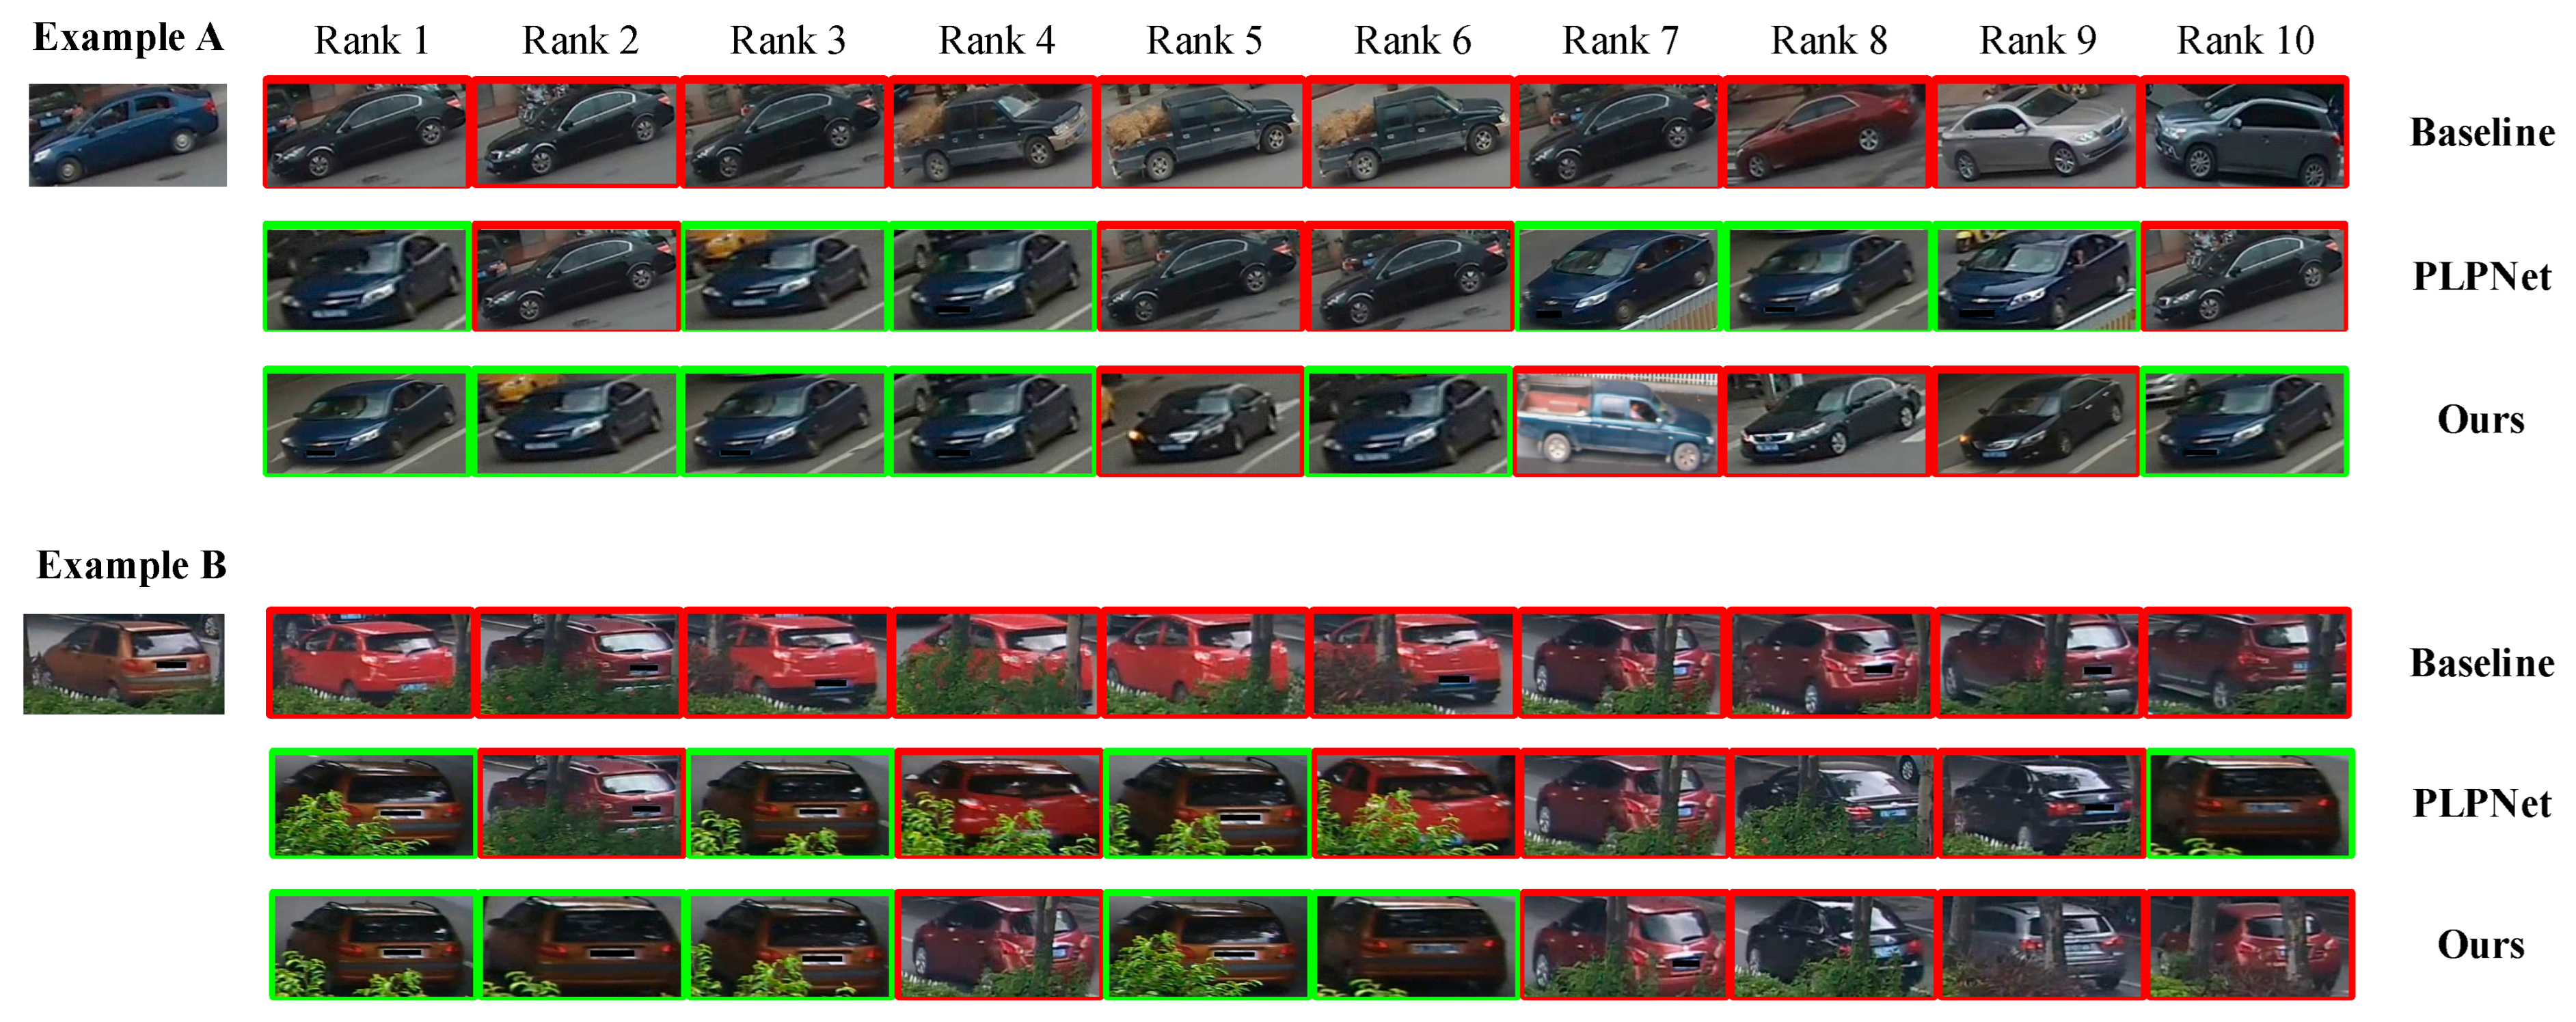
The ranking results visualization. For each group, we list the top-10 ranking results produced by the “Baseline”, “PLPNet”, and “Our” models in
Figure 7, respectively. The green bounding boxes indicate correct results and red ones correspond to false results. Clearly, the “Baseline” model mainly identifies the different vehicles with the same viewpoint, as the correct matchings are evident in both examples. However, “Our” model can hit the highest number of correctly matched vehicles with different viewpoints in the earlier ranking, and also achieves better performance than PLPNet. The main reason is that there are frequent cases of the same vehicle with different viewpoints, which easily confuses the Re-ID model. For Example B, the proposed dual-level viewpoint-proposal method is used to calculate the viewpoint of the rear vehicle image. Subsequently, during the training process, the appearance of vehicles from different viewpoints is learned to obtain the ability to identify and track vehicles in different directions. Finally, the similarities of feature vectors extracted between Example B and the candidate image sets are used to determine whether it is the tracked target. Previous methods based on vehicle-part detection mainly tracked specific targets via the region information of vehicle-part bounding boxes. Unlike these methods, our method utilizes the position information of vehicle-part bounding boxes to assist the Re-ID model in learning viewpoint-sensitive appearance features for tracking targets, rather than relying on the appearance information inside the part bounding boxes. Therefore, the “Ours” model combines PLPNet with a meta-learning strategy to further improve the performance. In cases where different vehicles have similar viewpoints, PLPNet can notice more subtle differences in vehicles and discover additional clues, and the meta-learning strategy makes the Re-ID model more sensitive to unseen-viewpoint perception.
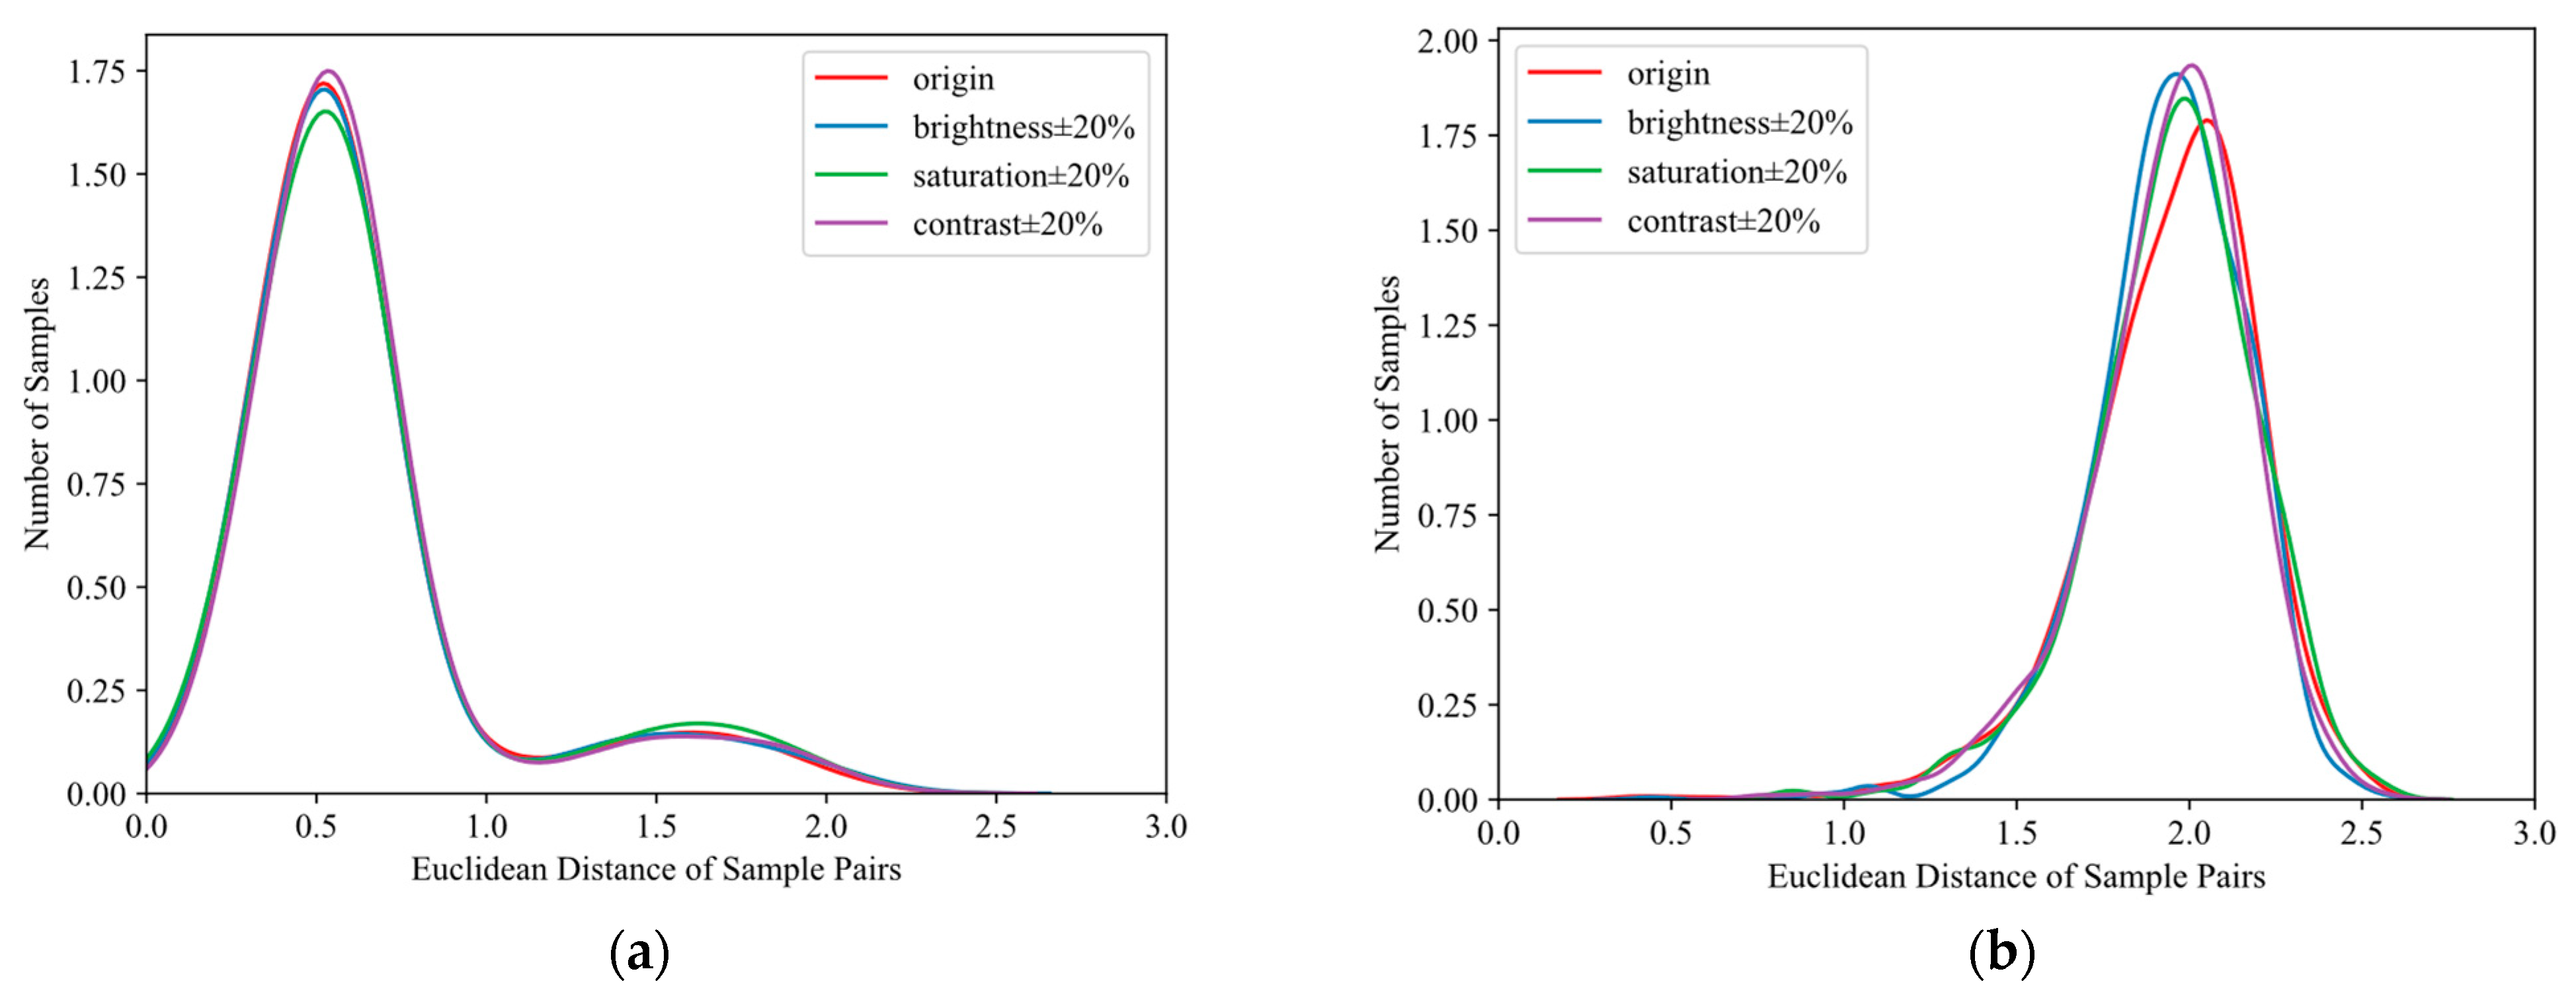
Sample pair distances under different image attribute settings. To verify the robustness of this article, we randomly selected 1500 pairs of positive and negative sample pairs from the VeRi-776 dataset for Euclidean distance calculation. Subsequently, we randomly increased or decreased brightness, contrast, and saturation by 20% for these sample pairs to simulate different image attribute variations.
Figure 8 shows the similarity distributions of these sample pairs in the context of image brightness, contrast, and saturation. From
Figure 8a, it can be observed that the distance between the positive sample pairs of the original image and the distance between the positive sample pairs after changing brightness, contrast, and saturation are very similar, and the Euclidean distance value is small. The distance distributions of the negative sample pairs after changing various image attributes in
Figure 8b are also similar and have a large Euclidean distance value. This indicates that the proposed method can robustly bring positive sample pairs closer and push negative sample pairs farther in an image context that changes brightness, contrast, and saturation.
4.5. Comparison with State-of-the-Art Approaches
To demonstrate the superiority of the dual-level viewpoint-learning framework, we compare the proposed method with the state-of-the-art methods on two UDA Re-ID tasks, including VehicleID-to-VeRi-776 and VehicleID-to-VERI-Wild. The experimental results are summarized in
Table 6. Our method achieves a performance of 37.80% on mAP and 83.10% on Rank-1 accuracy with VehicleID-to-VeRi-776. MMT combines hard and soft pseudo labels in a collaborative training manner to tackle the problem of noisy pseudo labels in the clustering phase. Although MMT has achieved remarkable clustering results, the noise introduced by changes in vehicle perspective still reduces the accuracy of clustering. Compared with the MMT, our method shows increases of 14.71% on mAP and 22.73% on Rank-1 accuracy with VehicleID-to-VeRi-776. Additionally, our method gains improvements of 8.91% mAP and 14.60% in Rank-1 accuracy over the second-best performance method AE when tested on VeRi-776. Although AE minimizes distances between similar identity instances to address the domain-shift problem, it does not consider the differences between different views of the same identity. For this purpose, our method overcomes the shortcomings of the AE by combining dual-level viewpoint-information during the training process.
When using VehicleID as the source domain and VERI-Wild as the target domain, we also achieve the best performance, of 31.40%, on mAP and 59.90% on Rank-1 accuracy, which are 3.40% and 4.30% higher than AE. To further verify the effectiveness of our proposed method, we also compare it with state-of-the-art ones, i.e., DomainMix and SpCL, for viewpoint-aware problems in meta-learning for UDA vehicle Re-ID. It should be noted that our method has a significant performance gain compared with them on each of the three subsets of VERI-Wild. The proposed method outperforms the previous methods by a considerable margin, which proves the superiority of dual-level viewpoint-learning framework in alleviating the challenge of viewpoint variations.
To further validate the performance and efficiency of the proposed method in cross-domain tasks,
Table 7 reports the comparison of the proposed method with existing methods in Macro-averaged F1 score and time complexity. Compared to the well-performing SpCL and MMT methods, the proposed method still maintains the best performance on the Macro-averaged F1 score. The main reason is that these methods did not take into account the challenge of vehicle viewpoint variations during the training process, while the proposed method utilizes redefined dual-level viewpoint-information to fully explore the visual appearance variations within and between domains.
In terms of computational time, the proposed method may not have the fastest training speed due to the time cost of viewpoint calculation. Compared to other methods, the computational time of our method is still within an acceptable range, and it is reasonable to sacrifice a small portion of time to improve the Re-ID performance. In summary, the proposed method can achieve excellent cross-domain vehicle Re-ID performance within a reasonable calculation time interval.


 ,
, 
