


Immunity-Empowered Collaboration Security Protection for Mega Smart Cities


Abstract
1. Introduction
2. Models and Methods
2.1. The Basic Principles of CPCSIS
2.2. The Basic Components of CPCSIS
2.2.1. Functional Module Composition of the Three Lines of Defense
2.2.2. Analysis of the Working Principle of the First Line of Defense
2.2.3. Analysis of the Working Principle of the Second Line of Defense
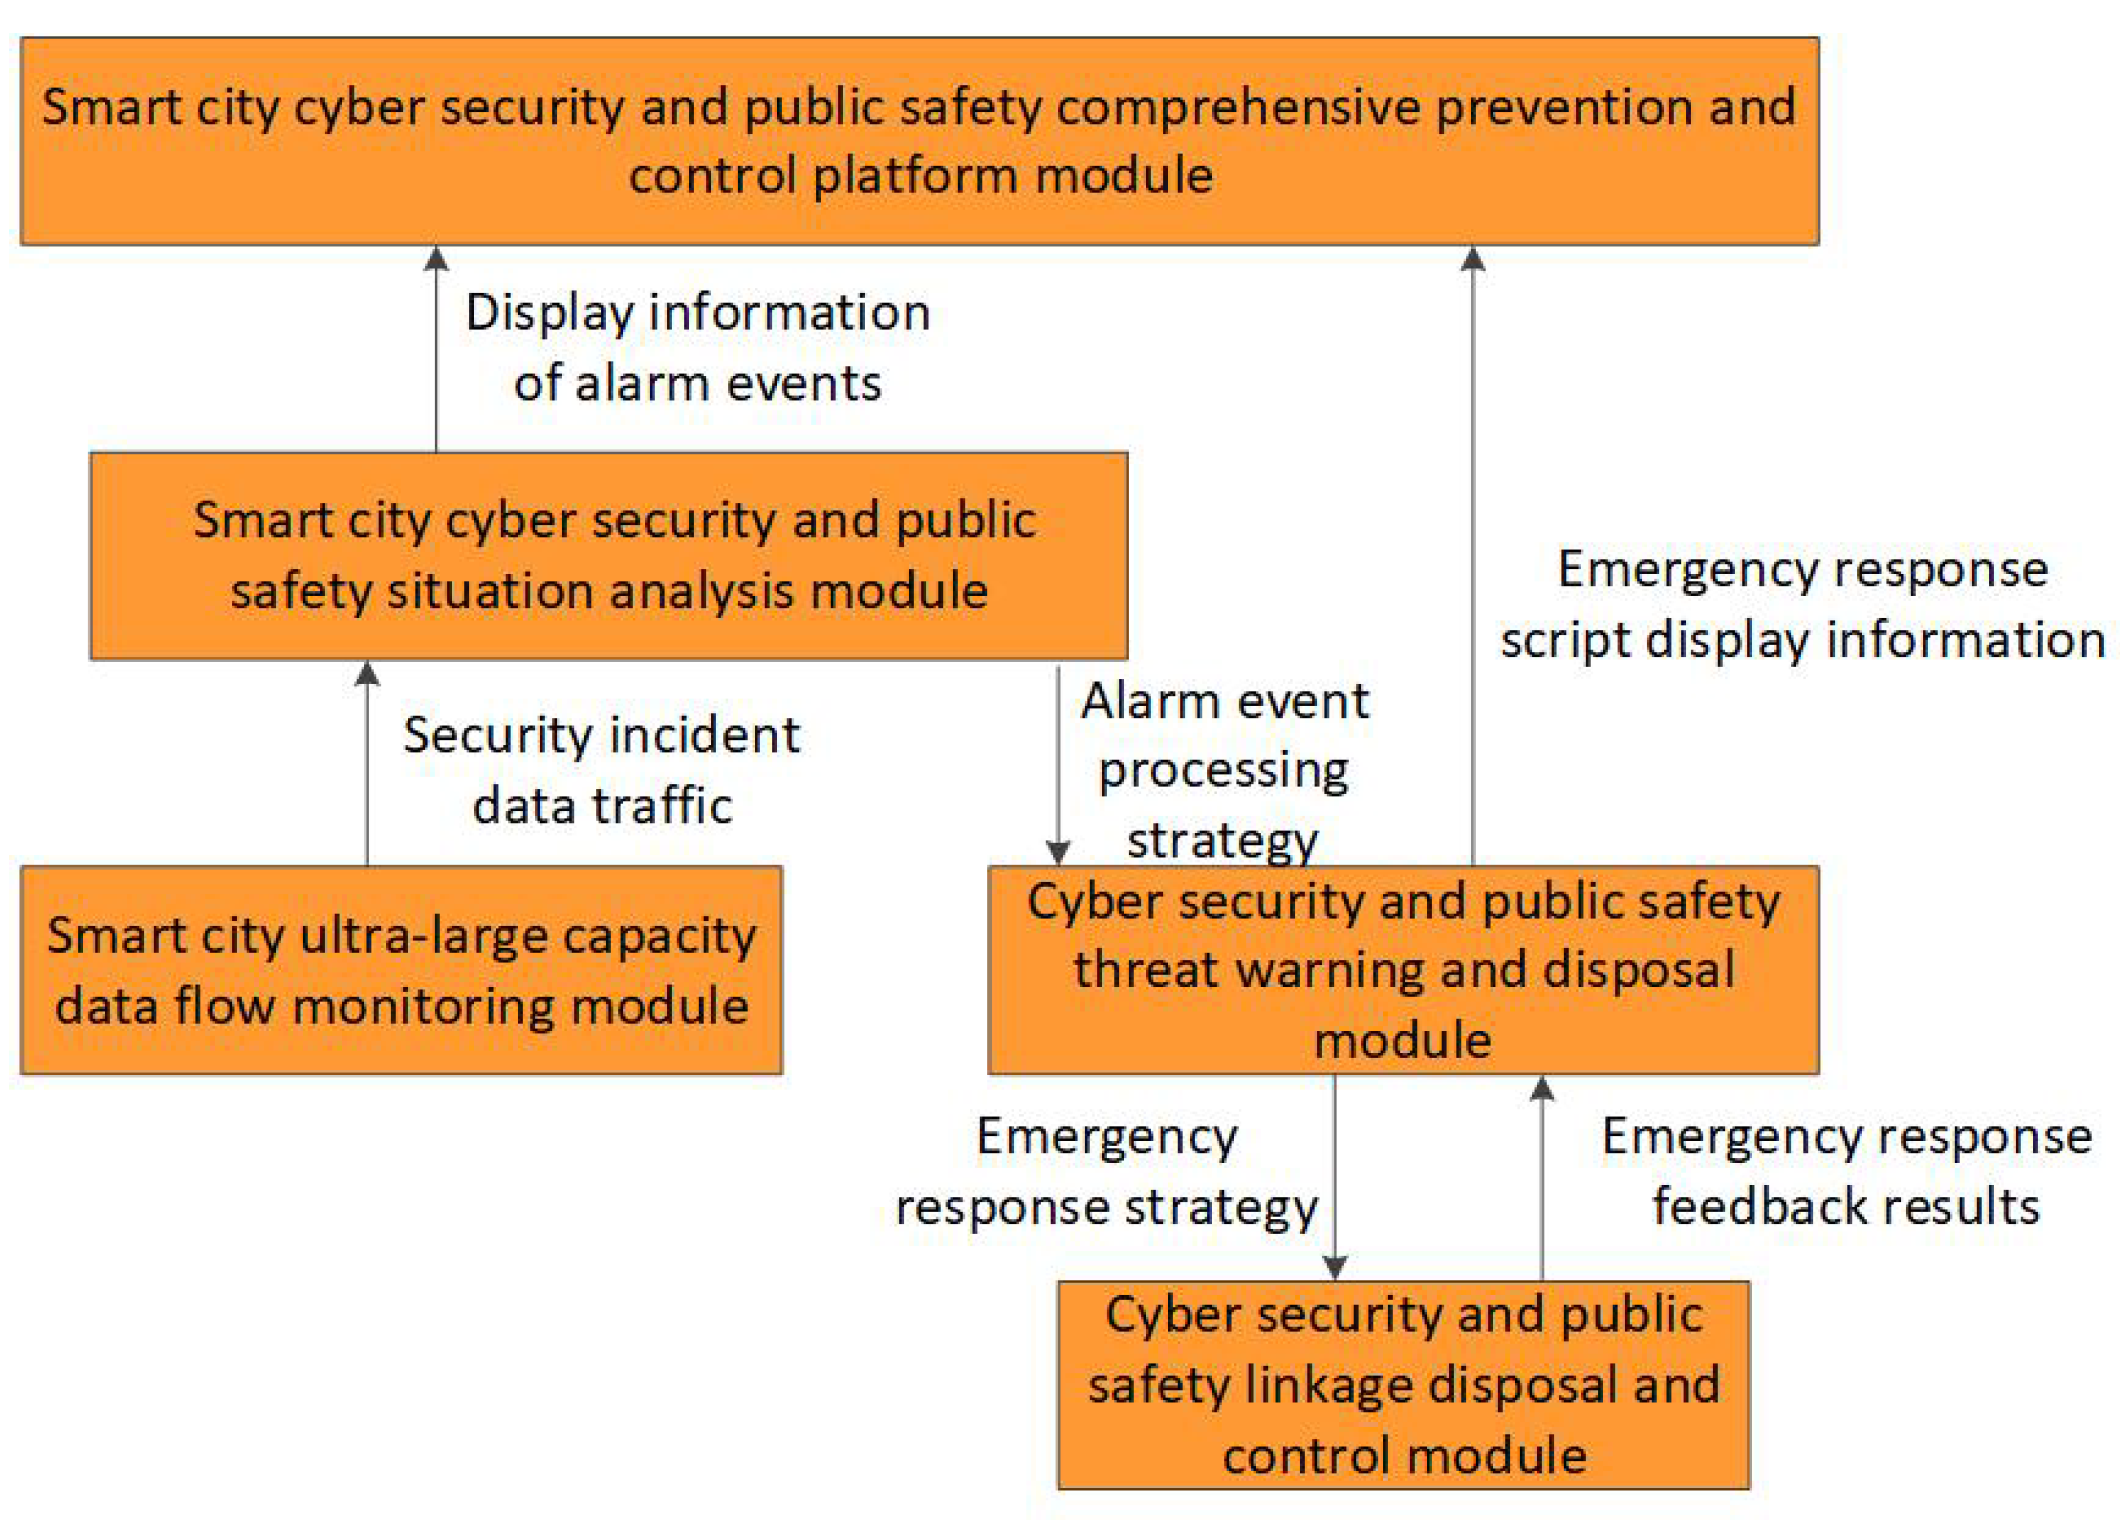
2.2.4. Analysis of the Working Principle of the Third Line of Defense
2.3. The Collaborative Protection Method of CPCSIS
| Algorithm 1 Part of the Smart City Cybersecurity Threat Level |
|
- (a)
- > : Public safety disposal or scenarios with high attention, such as natural disasters;
- (b)
- = : Scenarios where public safety factors are of equal concern to cybersecurity factors, such as handling public health incidents, among others;
- (c)
- < : Scenarios with high cybersecurity disposal or attention, such as being subjected to organized large-scale network attacks, among others.
3. Experiment and Analysis of Models
3.1. Experimental Purpose
3.2. Experimentation
- (1)
- Implement the functional module structure of the CPCSIS through open source software and programming development. Use four common public safety protection devices—video cameras, temperature sensors, position sensors, access control sensors, and gas sensors—to build a public safety experimental environment. Build a cybersecurity experimental environment using firewalls, routers, switches, and intrusion detection systems.
- (2)
- Public safety dataset: Use the CIFAR-10 dataset and label the images in the dataset with different labels representing different levels of threat to public safety: 1, 2, 3, and 4. Then, send the image data to the CPCSIS for testing.
- (3)
- Cybersecurity dataset: Use the IoT-23 dataset to simulate DDoS attacks, IoT botnet attacks, and other attack methods.
- (4)
- Based on testing the information entropy of the experimental environment, the value in Table 2 comes out to 135.
3.3. Experimental Result
4. Discussion and Conclusions
Author Contributions
Funding
Data Availability Statement
Conflicts of Interest
References
- National Cybersecurity Strategy. White House. 2023. Available online: https://www.whitehouse.gov/wp-content/uploads/2023/03/National-Cybersecurity-Strategy-2023.pdf (accessed on 21 February 2024).
- Lisova, E.; Sljivo, I.; Čaušević, A. Safety and Security Co-Analyses: A Systematic Literature Review. IEEE Syst. J. 2019, 1, 2189–2200. [Google Scholar] [CrossRef]
- Suciu, G.; Hussain, I.; Iordache, G.; Beceanu, C.; Kecs, R.A.; Vochin, M.C. Safety and Security of Citizens in Smart Cities. In Proceedings of the 2021 20th RoEduNet Conference: Networking in Education and Research (RoEduNet), Iasi, Romania, 4 November 2021. [Google Scholar]
- Liu, Z.; Wang, Q.; Li, Y.; Zhao, Y. CMSS: Collaborative Modeling of Safety and Security Requirements for Network Protocols. In Proceedings of the 2021 IEEE Intl Conf on Parallel & Distributed Processing with Applications, Big Data & Cloud Computing, Sustainable Computing & Communications, Social Computing & Networking (ISPA/BDCloud/SocialCom/SustainCom), New York City, NY, USA, 30 September–3 October 2021. [Google Scholar]
- Fan, J.; Hu, K.; Chen, Z.; Li, J. Research on Information Sharing and Fusion of Public Security Information Under Big Data Environment. Fresenius Environ. Build. 2022, 31, 6115–6123. [Google Scholar]
- Dimitrov, W.; Spasov, K.; Trenchev, I.; Syarova, S. Complexity Assessment of Research Space for Smart City Cybersecurity. IFAC Workshop Control. Smart Cities (CSC) 2022, 15, 1–6. [Google Scholar] [CrossRef]
- Subramaniyaswamy, S.; Nair, V.; Indragandhi, S.K.; Manikandan, V.; Ravi, J.L. Enhancing cyber–physical systems with hybrid smart city cyber security architecture for secure public data-smart network. Future Gener. Comput. Syst. 2020, 112, 724–737. [Google Scholar]
- Fang, W.; Cui, N.; Chen, W.; Zhang, W.; Chen, Y. A trust-based security system for data collection in smart city. IEEE Trans. Ind. Inform. 2020, 17, 4131–4140. [Google Scholar] [CrossRef]
- Paul, R.; Ghosh, N.; Sau, S.; Chakrabarti, A.; Mohapatra, P. Blockchain based secure smart city architecture using low resource IoTs. Comput. Netw. 2021, 196, 198–207. [Google Scholar] [CrossRef]
- Farzadnia, E.; Shirazi, H.; Nowroozi, A. A novel sophisticated hybrid method for intrusion detection using the artificial immune system. J. Inf. Secur. Appl. 2021, 58, 199–223. [Google Scholar] [CrossRef]
- Prathyusha, D.J.; Kannayaram, G. A cognitive mechanism for mitigating DDoS attacks using the artificial immune system in a cloud environment. Evoluationary Intell. 2021, 14, 607–618. [Google Scholar] [CrossRef]
- Grigorieva, N.M.; Petrenko, S.A. Biological Metaphor for Cyber Immunity. In Proceedings of the 2023 XXVI International Conference on Soft Computing and Measurements (SCM), Saint Petersburg, Russia, 24–26 May 2023. [Google Scholar]
- Jim, L.E.; Islam, N.; Gregory, M.A. Enhanced MANET security using artificial immune system based danger theory to detect selfish nodes. Comput. Secur. 2022, 113, 67–69. [Google Scholar] [CrossRef]
- He, J.; Li, T.; Li, B.; Lan, X.; Li, Z.; Wang, Y. An immune-based risk assessment method for digital virtual assets. Comput. Secur. 2021, 102, 102–134. [Google Scholar] [CrossRef]
- Fotohi, R. Securing of Unmanned Aerial Systems (UAS) against security threats using human immune system. Reliab. Eng. Syst. Saf. 2019, 193, 237–253. [Google Scholar] [CrossRef]
- Yang, B. Network Layer Security Detection Model of Internet of Things Based on Immune System. In Proceedings of the Annual International Conference on Information System and Artificial Intelligence (ISAI), Zhejiang, China, 22–23 May 2020. [Google Scholar]
- He, H.; Zhu, Z.; Zhang, J. An immune system-based defence system of robot network security. J. Phys. Conf. Ser. 2021, 1873, 012082. [Google Scholar] [CrossRef]
- Kodati, S.; Sreekanth, N.; Sarma, K.S.R.K.; Reddy, P.C.S.; Saxena, A.; Narasaiah, B. Ensemble Framework of Artificial immune system based on Network Intrusion Detection System for Network Security Sustainability. In Proceedings of the International Conference on Materials Processing and Characterization (ICMPC 2023), Newcastle upon Tyne, UK, 15 February 2024. [Google Scholar]
- Melo, R.V.; Douglas, D.J.M.; Diego, K.; Alessandra, D.B.; Mauricio, M.F. ISM-AC: An immune security model based on alert correlation and software-defined networking. Int. J. Inf. Secur. 2022, 21, 191–205. [Google Scholar] [CrossRef]
- Carrie, B.S.; Debra, L. New public management and the extension of police control: Community safety and security networks in Canada. Polic. Soc. 2019, 29, 566–578. [Google Scholar]
- Naveed, K.; Celosia, H.W. An Immune-Inspired Anomaly Detection Framework for IoT Devices. In Proceedings of the IEEE Conference on Local Computer Networks (LCN), Sydney, NSW, Australia, 16–19 November 2020. [Google Scholar]
- Popa Tache, C.E.; Săraru, C.-S. Lawfare, Between its (Un)Limits and Transdisciplinarity. Preced. Rev. Jurid. 2023, 23, 37–66. [Google Scholar] [CrossRef]
- Wolf-Ostermann, H. The role of collagen in immune health. NutraCos 2021, 20, 8–10. [Google Scholar]
- Robert, S.; Jolanta, K.; Maciej, C. Mechanisms of evasion of the innate immune system response by human coronaviruses. Alerg. Astma Immunol. 2023, 28, 85–94. [Google Scholar]
- Chiara, M.; Mauro, T.; Fernanda, M.; Rotondo, T.E.; Charles, J. Probiotics Mechanism of Action on Immune Cells and Beneficial Effects on Human Health. Cells 2023, 12, 184. [Google Scholar] [CrossRef]
- Shao, Z.; Chen, L.; Zhang, T. Dynamic Deployment of Power IoT Security Components with Unified Resource Scheduling. In Proceedings of the IEEE Joint International Information Technology and Artificial Intelligence Conference (ITAIC), Chongqing, China, 11–13 December 2020. [Google Scholar]
- Mahfouzi, R.; Aminifar, A.; Samii, S.; Eles, P.; Peng, Z. Security-aware Routing and Scheduling for Control Applications on Ethernet TSN Networks. ACM Trans. Des. Autom. Electron. Syst. 2020, 25, 1–26. [Google Scholar] [CrossRef]
- Jing, X.; Qin, W.; Yao, H.; Han, X.; Wang, P. Resilience-oriented planning strategy for the cyber-physical ADN under malicious attacks. Appl. Energy 2024, 353, 1510–1524. [Google Scholar] [CrossRef]
- Ibrahim, J.; Gajin, S. Entropy-based Network Traffic Anomaly Classification Method Resilient to Deception. Comput. Sci. Inf. Sysstems 2022, 19, 87–116. [Google Scholar] [CrossRef]
- Yang, S.; Ning, L.; Cai, X.; Liu, M. Dynamic Spatiotemporal Causality Analysis for Network TrafficFlow Based on Transfer Entropy and Sliding Window Approach. J. Adv. Trans. 2021, 2021, 234–251. [Google Scholar] [CrossRef]
- Chen, D.; Xu, G.; Meng, L.; Yang, P. CPR-TOPSIS: A novel algorithm for finding influential nodes in complex networks based on communication probability and relative entropy. Phys.-Asia Stat. Mech. Its Appl. 2022, 603, 435–448. [Google Scholar]
- Guo, H.; Cheng, L.; Li, S.; Lin, H. Regional risk assessment methods in relation to urban public safety. Process. Saf. Environ. Prot. 2020, 143, 361–366. [Google Scholar]
- Imanbayeva, A.; Tursynbek, Y.; Syzdykova, R.; Mukhamedova, A. Evaluating the effectiveness of information security based on the calculation of information entropy. In Proceedings of the Annual Conference on Science and Technology Research (ACOSTER), Medan, Indonesia, 20–21 June 2020. [Google Scholar]
- Kaššaj, M.; Peráček, T. Sustainable Connectivity—Integration of Mobile Roaming, WiFi4EU and Smart City Concept in the European Union. Sustainability 2024, 16, 788. [Google Scholar] [CrossRef]
- Khan, R.A.; Khan, M.W. Cyber Security’s Influence on Smart Cities: Challenges and Solutions. Contemp. Innov. Eng. Manag. 2023, 2821, 040033. [Google Scholar] [CrossRef]
- Sha, Y.; Li, M.; Xu, H.; Zhang, S.; Feng, T. Smart City Public Safety Intelligent Early Warning and Detection. Sci. Program. 2022, 2022, 7552601. [Google Scholar] [CrossRef]


| The Basic Properties of Immunity | Human Immunity | CPCSIS |
|---|---|---|
| Immune mode | The immune system of the human body includes a series of processes such as the exclusion or elimination of foreign objects (such as allergic reactions, rejection reactions), as well as intervention measures such as planned immunity (vaccination). | The comprehensive prevention and control of cyber security in smart cities can also be divided into the process of discovering or disposing of cybersecurity and public safety threats (crossdomain denial of security threats, dynamic adjustment of security strategies), as well as monitoring and warning of unknown threats through behavior learning and other methods. |
| Immunity | The human immune function includes three main tasks: immune monitoring, immune response, and immune memory. Immune surveillance identifies pathogens such as bacteria, viruses, fungi, etc. The immune response extensively clears invading pathogens and implements precise strikes against them; immune memory exerts a stronger immune response, thus enabling complete elimination of pathogens. | The comprehensive immunity of smart city network information security has achieved security functions such as anomaly detection, threat identification, asset protection, emergency response, state recovery, and attack blocking through cybersecurity components and prevention and control measures, thus maintaining the smooth operation of the network environment. |
| Immune components | There are three immune defense lines in the human body: The first line of defense includes skin, mucous membranes, etc.; The second line of defense includes phagocytosis, bactericidal substances, neutrophils, etc. The first two lines of defense are natural defense functions gradually established by humans in the process of evolution. They do not target a specific pathogen and have defensive effects against multiple pathogens. The third line of defense is lymphocytes, a type of white blood cell that is responsible for combating external infections and monitoring cellular mutations in the body. | Based on the principle of human immune components, the immune components of smart cities are also composed of three lines of defense: The first line of defense emphasizes environmental awareness, scene awareness, and access control capabilities. The second line of defense completes functions such as information fusion, threat detection, and element rights confirmation. The third line of defense is equipped with safety isolation, coordinated disposal, and learning modeling. |
| Grade | Value Range | Threat Level |
|---|---|---|
| 1 | Normal | |
| 2 | Low | |
| 3 | Medium | |
| 4 | High | |
| 5 | Extremely high |
| Functional Module | Grade 1 | Grade 2 | Grade 3 | Grade 4 | Grade 5 |
|---|---|---|---|---|---|
| Cybersecurity monitoring data collection module | • | • | • | • | • |
| Intelligent public safety gateway module | • | • | |||
| Multisource heterogeneous data collection module | • | • | • | ||
| Network asset mapping module | • | ||||
| Cybersecurity vulnerability scanning module | • | • | • | ||
| Public safety multirisk linkage analysis and accurate warning module | • | • | • | • | |
| Public safety monitoring platform module based on video surveillance | • | • | • | • | |
| Public safety and cybersecurity strategy visualization module | • | • | • | • | • |
| Functional Module | Grade 1 | Grade 2 | Grade 3 | Grade 4 | Grade 5 |
|---|---|---|---|---|---|
| Urban data sharing and exchange module | • | • | • | • | |
| Distributed public key infrastructure module | • | ||||
| Fine-grained permission management module | • | • | • | ||
| Multidimensional data authorization module | • | • | |||
| Smart city cybersecurity simulation and verification module | • | ||||
| Comprehensive threat detection module for smart cities | • | • | • | • |
| Functional Module | Grade 1 | Grade 2 | Grade 3 | Grade 4 | Grade 5 |
|---|---|---|---|---|---|
| Smart city ultralarge capacity data flow monitoring module | • | • | |||
| Cybersecurity and public safety linkage disposal and control module | • | ||||
| Cybersecurity and public safety threat warning and disposal module | • | • | • | ||
| Smart city cybersecurity and public safety situation analysis module | • | • | • | • | |
| Smart city cybersecurity and public safety comprehensive prevention and control platform module | • | • | • | • | • |
Disclaimer/Publisher’s Note: The statements, opinions and data contained in all publications are solely those of the individual author(s) and contributor(s) and not of MDPI and/or the editor(s). MDPI and/or the editor(s) disclaim responsibility for any injury to people or property resulting from any ideas, methods, instructions or products referred to in the content. |
© 2024 by the authors. Licensee MDPI, Basel, Switzerland. This article is an open access article distributed under the terms and conditions of the Creative Commons Attribution (CC BY) license (https://creativecommons.org/licenses/by/4.0/).
Share and Cite
Lan, K.; Li, J.; Huang, W.; Li, G. Immunity-Empowered Collaboration Security Protection for Mega Smart Cities. Electronics 2024, 13, 2001. https://doi.org/10.3390/electronics13112001
Lan K, Li J, Huang W, Li G. Immunity-Empowered Collaboration Security Protection for Mega Smart Cities. Electronics. 2024; 13(11):2001. https://doi.org/10.3390/electronics13112001
Chicago/Turabian StyleLan, Kun, Jianhua Li, Wenkai Huang, and Gaolei Li. 2024. "Immunity-Empowered Collaboration Security Protection for Mega Smart Cities" Electronics 13, no. 11: 2001. https://doi.org/10.3390/electronics13112001
APA StyleLan, K., Li, J., Huang, W., & Li, G. (2024). Immunity-Empowered Collaboration Security Protection for Mega Smart Cities. Electronics, 13(11), 2001. https://doi.org/10.3390/electronics13112001