Article

Semantic-Based Public Opinion Analysis System

1
School of Computer Science and Technology, Shandong University of Technology, Zibo 255000, China
2
Department of Data Science, Soochow University, Taipei City 10048, Taiwan
3
Department of Computer Science and Information Engineering, National Central University, Taoyuan 32001, Taiwan
4
Department of Drama and Theatre, National Taiwan University, Taipei City 10617, Taiwan
5
Department of Computer Science and Information Engineering, Fu Jen Catholic University, New Taipei City 24205, Taiwan
6
Faculty of Digital Technology, University of Technology and Education—The University of Danang, Danang 550000, Vietnam
7
AI Research Center, Hon Hai Research Institute, New Taipei City 236, Taiwan
*
Authors to whom correspondence should be addressed.
Electronics 2024, 13(11), 2015; https://doi.org/10.3390/electronics13112015
Submission received: 16 April 2024 / Revised: 14 May 2024 / Accepted: 17 May 2024 / Published: 22 May 2024
(This article belongs to the Special Issue Advances in Human-Centered Digital Systems and Services)

Abstract

:
In the research into semantic sentiment analysis, researchers commonly use some factor rules, such as the utilization of emotional keywords and the manual definition of emotional rules, to increase accuracy. However, this approach often requires extensive data and time-consuming training, and there is a need to make the system simpler and more efficient. Recognizing these challenges, our paper introduces a new semantic sentiment analysis system designed to be both higher in quality and more efficient. The structure of our proposed system is organized into several key phases. Initially, we focus on data training, which involves studying emotions and emotional psychology. Utilizing linguistic resources such as HowNet and the Chinese Knowledge and Information Processing (CKIP) techniques, we develop emotional rules that facilitate the generation of sparse representation characteristics. This process also includes constructing a sparse representation dictionary. We can map these back to the original vector space by resolving the sparse coefficients, representing two distinct categories. The system then calculates the error compared to the original vector, and the category with the minimum error is determined. The second phase involves inputting topics and collecting relevant comments from internet forums to gather public opinion on trending topics. The final phase is data classification, where we assess the accuracy of classified issues based on our data training results. Additionally, our experimental results will demonstrate the system’s ability to identify hot topics, thus validating our semantic classification models. This comprehensive approach ensures a more streamlined and effective system for semantic sentiment analysis.

1. Introduction

In the past decade, with the widespread use of the Internet and the advent of the Internet of Things (IoT) era, the application of Big Data has become the trend and direction of current technology [1,2,3,4,5]. Internet resources have become indispensable in our daily lives, and textual communication in various forums has become a daily hobby for many people. In an era where opportunities are everywhere, exploring the needs and preferences of the public may provide insights by analyzing the trending topics and data from current forums.
There are many specialized opinion research centers in society, such as election polling centers and consumer brand research centers, which employ traditional methods of distributing questionnaires and conducting interviews to conduct various opinion surveys [6,7,8]. Online survey websites have also been continuously developed, although they mainly employ digital versions of questionnaires. Furthermore, with the rise of online social media and the prevalence of the mobile internet, people can express their opinions anytime and anywhere. Many individuals share textual information through the internet, which is stored on internet servers. Emerging web scraping techniques can extract this information and acquire large amounts of data through research. According to statistics from the renowned website Qmee, 278,000 tweets are generated every minute, and Facebook sees 41,000 posts per second. Understanding public opinion has become crucial for stakeholders, including businesses, governments, and social scientists. The explosion of data available on social media platforms, online forums, and news outlets provides a rich source of public sentiment and opinions. However, this data’s sheer volume and complexity make manual analysis impractical, necessitating automated systems. Semantic-based public opinion analysis systems emerge as a powerful solution to this challenge, leveraging advanced machine learning and natural language processing (NLP) techniques to analyze and interpret vast amounts of unstructured text data [9,10,11].
Several earlier studies have been conducted to analyze and process opinion systems. In addition, researchers have employed the Manhattan hierarchical cluster measure to choose pertinent features within the domain of opinion mining [12]. In machine learning, decision trees are frequently applied for classification purposes, and the feature selection process plays a pivotal role in enhancing the efficiency and interpretability of the model. The effectiveness of decision tree algorithms was showcased in various applications beyond the original context [13,14,15,16]. However, decision tree algorithms are prone to overfitting, creating overly complex models that perform poorly on new data. Their sensitivity to minor data variations and bias towards features with more levels can limit their generalization and decision-making effectiveness. Another paper presents a novel approach using a recurrent random forest algorithm to analyze content and emotional tone in tweets, highlighting Donald Trump’s strategic and engaging tweeting style that enhanced his social media presence [17]. It also compares the tweeting styles of various presidential candidates and examines the correlation between emotional content in their tweets and social media popularity indices. Moreover, a random forest algorithm and text mining combination have been proposed to analyze the influence of stock market movements [18]. A random forest algorithm has been used to categorize and understand consumer sentiments in the context of social media [5,19].
Although these algorithms are highly beneficial in analyzing public opinion, their complexity presents challenges. For instance, random forests and decision trees are often considered as black boxes due to their intricate structure and complicated interpretation. This is particularly problematic when it is essential to understand the decision-making process. Additionally, their performance may suffer in high-dimensional data scenarios, especially when many features are extraneous. Moreover, these algorithms are resource-intensive, both computationally and in terms of memory, which can hinder dealing with large datasets or resource-limited environments. While these algorithms provide improved accuracy and robustness in semantic-based public opinion analysis, they necessitate thoughtful consideration of their implementation complexity and computational requirements.
In this study, we introduce an advanced and efficient semantic sentiment analysis system based on [20]. Initially, we focus on training the system using emotions and emotional psychology, supported by linguistic resources like HowNet and the CKIP report. This involves creating rules for sparse representation and a corresponding dictionary. The system then categorizes emotions by comparing sparse coefficients to the original vectors, identifying the category with minimal error. Next, we collect internet forum comments on various topics to understand public sentiment. The final step is classifying this data and validating its accuracy through our experiments, demonstrating the system’s ability to detect trending topics. This streamlined approach enhances efficiency in semantic sentiment analysis.

2. Materials and Methods

2.1. Sentiment Analysis

Sentiment analysis can be divided into three main parts: data acquisition, training data, and data classification. Sentiment data is often time-sensitive, aiming to understand specific events’ sentiment orientation quickly. It primarily utilizes web mining techniques to acquire various data related to specific keywords, enabling multidimensional filtering, feature selection, and classification.
Chinese word segmentation is mainly used to segment the content of sentences into words. Several commonly used Chinese word segmentation tools include:
  • CKIP 1.0 tool kit [21].
  • Jieba 0.42 tool kit [22].
  • Stanford Word Segmenter 4.2 [23].
There may be slight differences in the word segmentation results obtained from various segmentation systems, as shown in Table 1. In this study, we used the CKIP tool kit developed by the Chinese Word Knowledge Group at Academia Sinica for word segmentation.
In data classification, the selection of features is crucial. The previous study employed the frequency-inverse document frequency (TF–IDF) method to identify the features [24]. TF–IDF is a commonly used weighting technique in information retrieval and text mining, which assesses the importance of a term in a collection of documents or a corpus to a document. TF–IDF filters out common words and typically retains important ones.
The TF mathematical expression is represented as Equation (1). Here, f t , d denotes the frequency of the term t in document d , and t d f t , d represents the sum of frequencies of all terms in document d .
T F ( t , d ) = f t , d t d f t , d
IDF mathematical expression is represented as Equation (2). Here, D represents the total number of documents in the corpus, and d D : t d represents the number of documents that contain term t . If the term is not present in the corpus, it is considered as zero.
I D F ( t , D ) = log D 1 + d D :   t d
After combining the TF and IDF mathematical formulas, we obtain the mathematical representation of TF–IDF, as shown in Equation (3).
T F I D F ( t , d , D ) = T F ( t , d ) × I D F ( t , D )
Furthermore, Zhu et al. [25] proposed data mining techniques to discover the correlations between sentences, and their utilization as feature values for classification using Support Vector Machines (SVM). In the field of classifiers, Guo et al. [26] compared SVM, K-Nearest Neighbors algorithm (KNN) and Naive Bayes classifier (NB) for classification purposes.
SVM [27,28,29,30] is a classification method developed by Vapnik in 1979. SVM has two significant advantages: firstly, it has a clear theoretical framework and complete structure, making it easy to implement and perform efficiently. Secondly, SVM is particularly suitable for situations with limited data, as its theory only requires a few key support vectors to achieve the classification objective. Figure 1 illustrates the concept of SVM classification.
In the figure, SVM defines a decision function D(x) to find a hyperplane that separates the data into two classes. The hyperplane is defined by D(x) = 0, and the data points closest to the hyperplane are referred to as support vectors. The values of the Decision Function when the support vectors are substituted are D(x) = 1 and D(x) = −1, represented by the two dashed lines in the figure. Data points with a Decision Function value greater than 0 belong to one class, while those with less than 0 belong to the other.
The k-nearest Neighbor Algorithm (kNN) [31] is a simple and commonly used classification method, where its k-nearest neighbors represent each test data point. To determine the class of a test data point, the algorithm identifies the k closest training data points and predicts the class based on their majority, as illustrated in Figure 2. This diagram demonstrates the concept of kNN for k = 1, k = 2, and k = 3.
The studies mentioned above have proposed different methods to improve classification results. However, many factors affect classification. Based on these research results, this study analyzes the concepts and meanings related to the words rather than analyzing the words themselves. This article adopts the Sparse Representation Classifier (SRC) [25,32] to enhance classification performance. SRC originates from sparse representation theory [33].

2.2. Proposed Method

The experimental system architecture is primarily based on Lin [20], adopting different input topics for research purposes, as shown in Figure 3. The original SVM classifier is replaced with the SRC classifier [24,32]. The study employs a specialized approach to extract diverse trending topics and employs a similar training data process to obtain results for feature analysis. Finally, the research findings are implemented and analyzed using the SRC classification framework. The system architecture of the experiment consists of three main components: Comment Data Acquisition, which involves web scraping specific topic-related online comments and storing them in a particular format; next, extracting the comment section from the original data source and reformatting it to obtain reference data [34]; the reference data, through the training process of the experiment, yields the SRC classification model; finally, using the methods above, the system can classify different discussion topics separately and obtain sentiment analysis results for each discussion topic.
Research data can be obtained quickly, free of charge, and openly through online forums, blogs, and weblogs containing comment content. Data can be saved as a JSON database using a self-developed web scraper and specially designed analysis techniques, as illustrated in Figure 4. The PPT Forum will be the primary data source for analysis and research in the following experiments. In the following subsections, we will explain the modules depicted in Figure 4, including Data Source Acquisition and JSON Database. Since the corpus is collected through a web crawler, a balanced corpus is collected for positive and negative emotional data for conducting experiments.

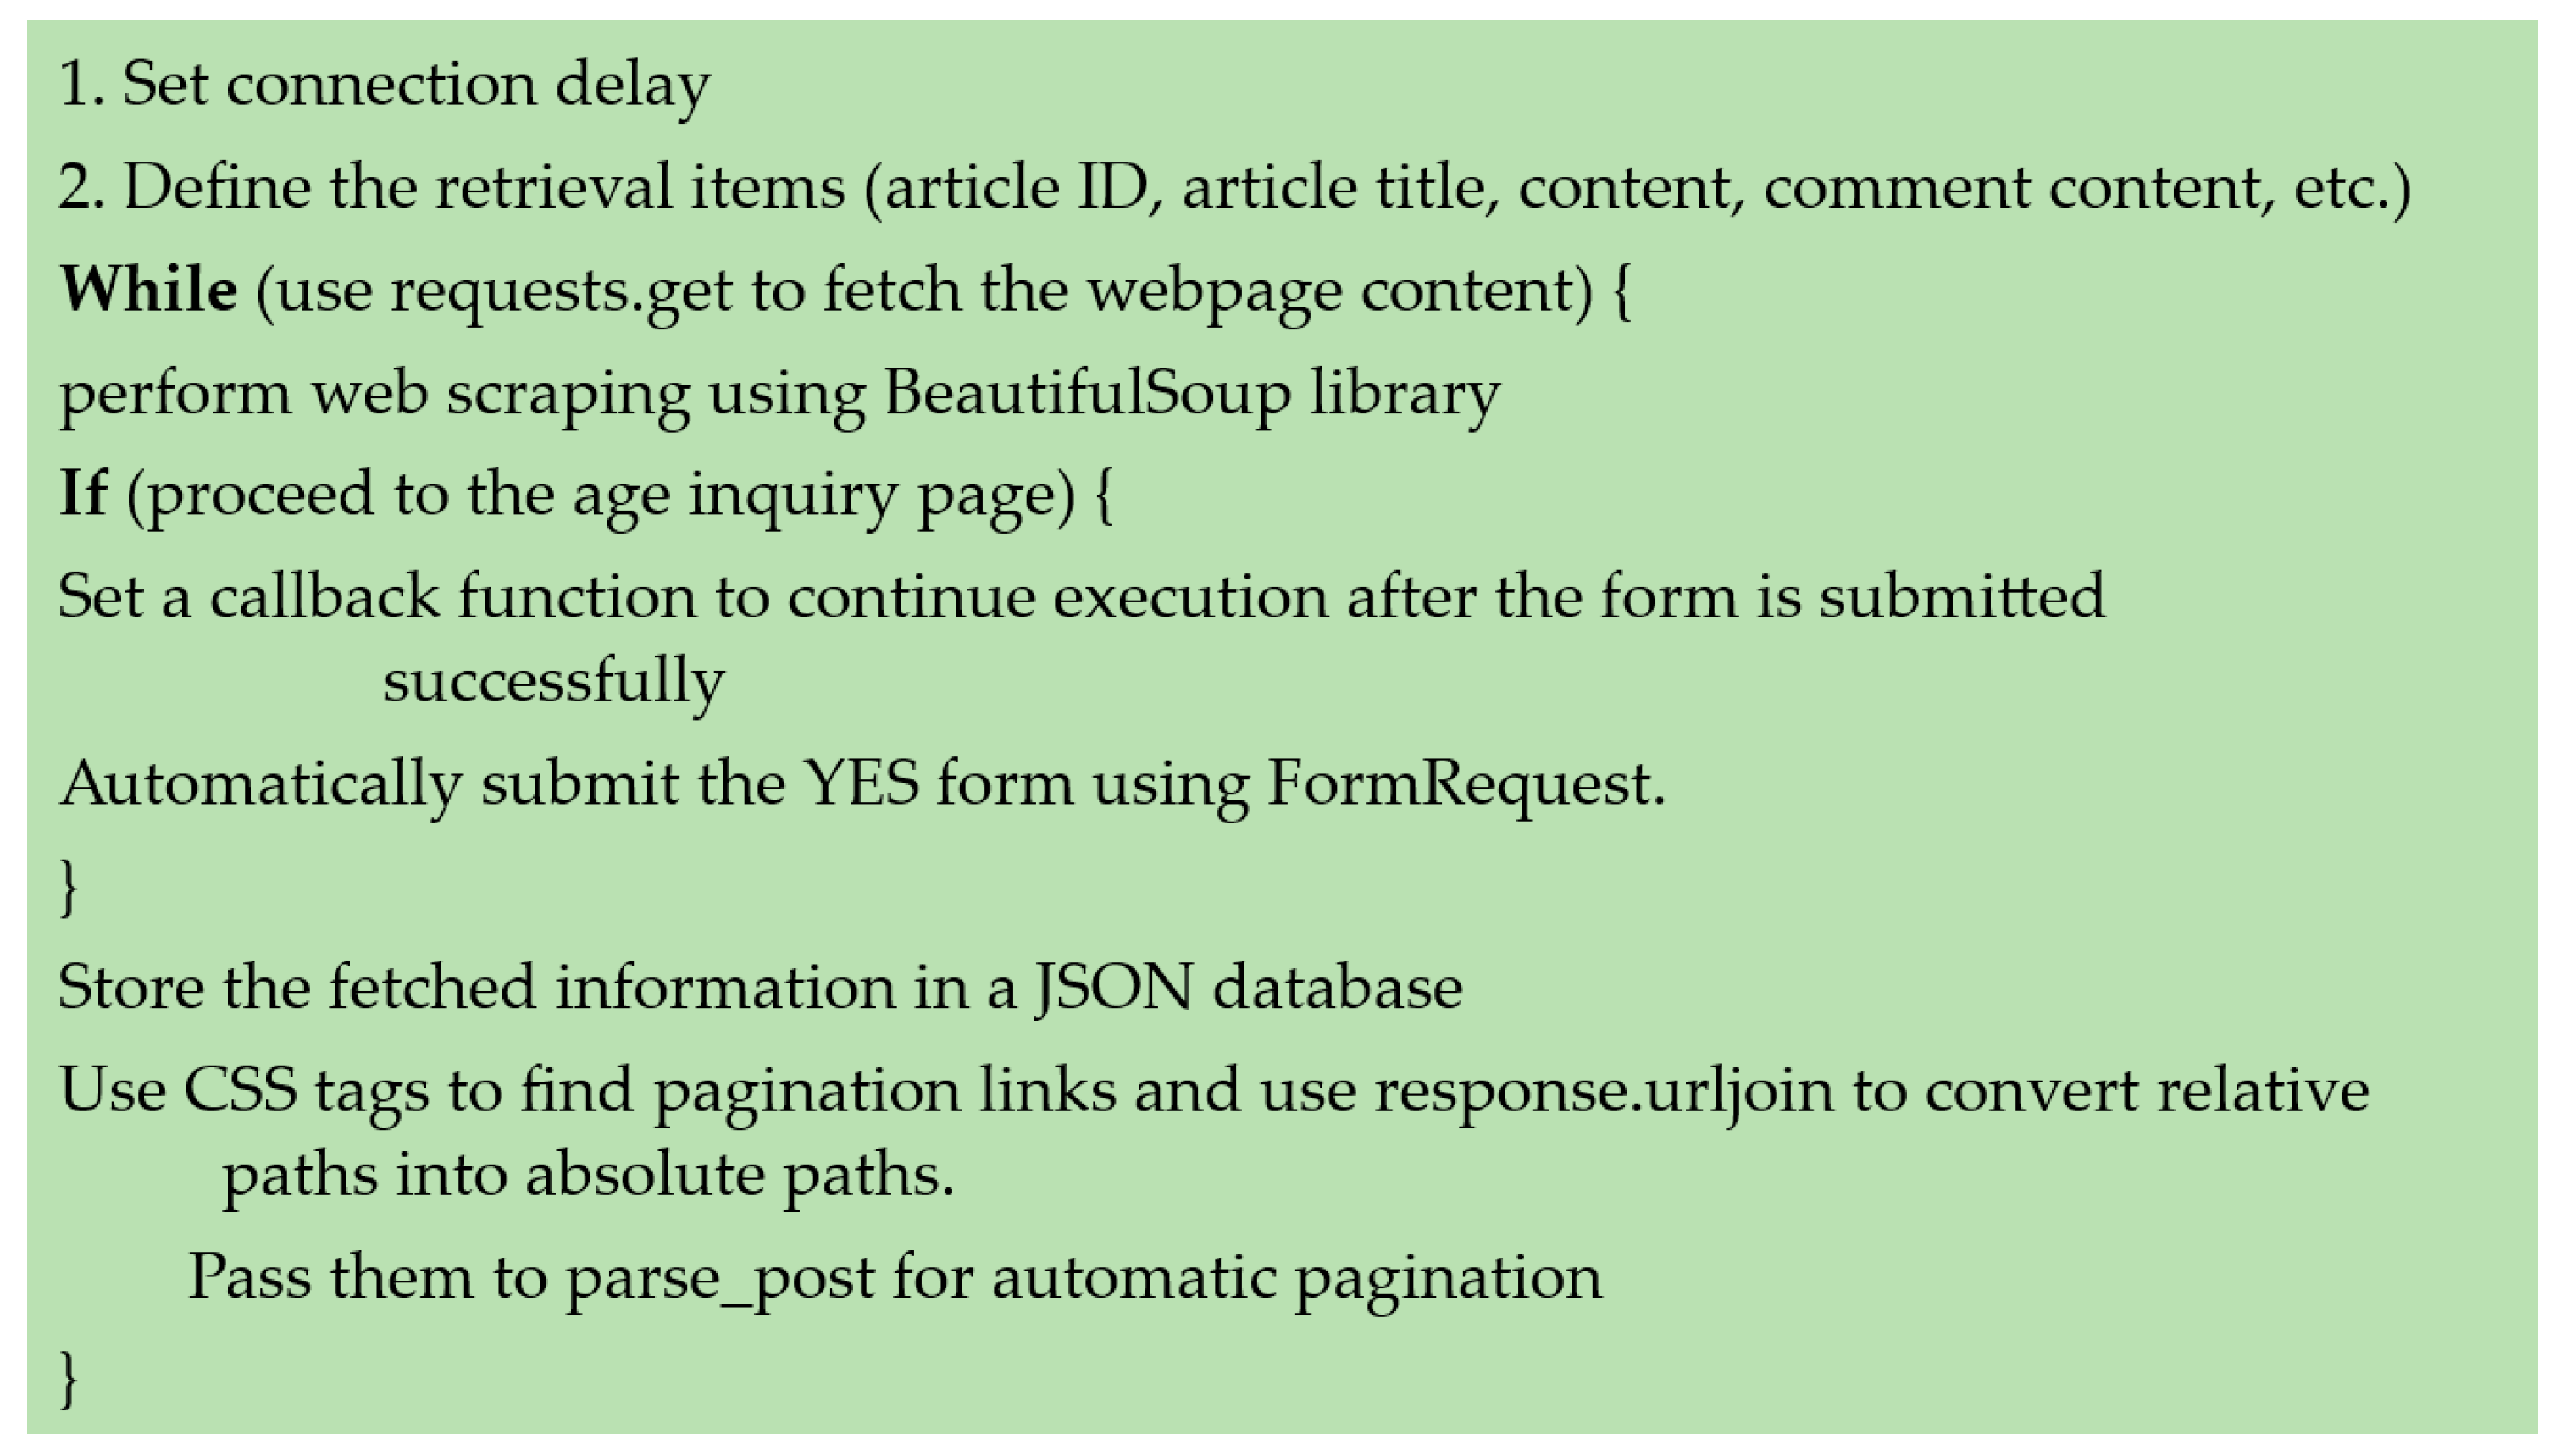
2.2.1. Data Source Acquisition

Existing text scraping software (beautifulsoup4 4.12 and requests 2.31) can quickly obtain comment content from forums. Among them, web scraping software, which utilizes HTTP requests for data retrieval, is the most convenient. Internet pages are essentially composed of HTML code and web scraping software obtains data by directly scraping the HTML code. By analyzing and filtering this data, it achieves the retrieval of resources, such as images and text. The web scraper used in this study is the Beautifulsoup4 and requests packages in Python. The code is detailed in Figure 5. In the web scraping software, the target is directed towards a specific PTT forum URL, where it fetches the comment data, including the title, content, and comments themselves, and stores them in the JSON database format.

2.2.2. JSON Database

The JSON format is a structure for storing and transmitting data in plain text format. The experiment captures data from the web using web scraping software and stores it as a JSON database. An exceptional pre-processing flow is required to extract the relevant comment information from the JSON database. The content of the JSON format is shown in Table 2. The data is primarily stored using arrays in lists, with corresponding article IDs and comment quantities assigned. In the following experiment, these formatted data will be used for training and analysis to obtain experimental results.

2.2.3. Training Data

There are three central databases for data training: the primary emotional characteristics database, the CNKI ontology corpus database, and the vocabulary hierarchical relationship database, as shown in Figure 6.
  • Primary emotional feature database: This database is created through collaboration between WordNet and emotion-related words to organize emotional features. These features are stored in the database in the form of tags.
  • HowNet ontology corpus: This database stores sentence formats and related tags. The sentence processor can parse the emotional feature tags between single words and sentences.
  • Single-word hierarchical relationship database: This database uses data mining technology to discover the correlation between single words and sentences. It uses a word-hierarchical relational database to analyze similarity and train an SRC (Support Vector Machine Recursive Removal) classifier.
Russell [35,36,37] proposed the circumplex model of affect for classifying emotions. He suggested that emotions can be divided into valence and arousal. Valence encompasses positive and negative emotions, while arousal encompasses high and low activation levels [38]. Negative emotional adjectives are on the left side, while positive emotional adjectives are on the right. This study primarily adopts these 28 emotions as the primary emotional terms, as shown in Figure 7 below.
HowNet is a Chinese corpus containing 96,744 Chinese words. Numerous researchers continuously update the database to make it more comprehensive. The general content and methods involve representing single-word concepts as objects and storing them as a common-sense knowledge base. HowNet aims to reveal the relationships between concepts, as well as the relationships between concepts and their properties. The word structure in HowNet can be decomposed into conceptual features (Table 3). There are currently 1618 conceptual features in HowNet, and their structure and characteristics are shown in Table 4.
Implementation of the HowNet Database:
  • Main Emotion Feature Database:
By integrating emotional vocabulary with the 15 specific emotional semantic labels mentioned by Lin [20] and the conceptual features of CWN, 223 conceptual features were organized to express the main emotion features. They were stored as an SQL database using SQLite, which became this study’s central emotion feature database.
2.
HowNet Ontology Corpus Database:
The structure of HowNet allows the decomposition of words into conceptual features. To facilitate the querying of conceptual features of words, this research stores the data as an SQLite database and utilizes SQL syntax for convenient data retrieval. This SQLite database is called the HowNet Ontology Corpus Database in this study.
The conceptual features in HowNet also contain components related to relationships. These relationships include the relation between parts and wholes (%), attributes and hosts (&), materials and products (?), agents and events (), patients and events ($), instruments and events (), locations and events (@), as well as additional concept attributes (#). Direct attributes do not have specific symbols. In total, there are eight types of relationship symbols:
  • Employer: DEF = human|human, *employ|employ
  • Employee: DEF = human|human, $employ|employ
The employer is the actor in the employment relationship, while the employee is the recipient. Therefore, respective relational symbols can provide a clearer understanding of the relationship between the terms.
3.
Lexical Hierarchy Relationship Database:
In the HowNet, there are 1618 concept features, and a hierarchical relationship exists between concept features. The conceptual tree structure of event types is illustrated in Figure 8.
In the Concept Features of the HowNet, there are nine tree-like structures. These nine tree-like structures encompass the relationships among all 1618 concept features. This study defines this structure as the Word Hierarchy Relationship Database.
  • event
  • entity
  • attribute
  • aValue|Attribute value
  • AttributeValue|Attribute and attribute value
  • syntax
  • qValue|Quantiity value
  • SecondaryFeature|Secondary Feature
  • EventRoleAndFeatures|Dynamic role and feature

2.2.4. Sentence Processor

Through the Chinese word segmentation system, sentences are transformed into word-level structures. After segmentation, the concept features of the words are obtained from the HowNet OntoNotes corpus database. In conjunction with the primary emotional feature database, whether the sentence contains primary emotional features is determined. The sentence is then transformed into a data string consisting of primary and general emotional features. Subsequently, data mining techniques can be employed to explore the interrelationships between sentences.
Research on Chinese word segmentation primarily focuses on the Stanford Word Segmenter developed by Stanford University and the Chinese Word Segmentation System developed by the Chinese Knowledgebase team at the Institute of Linguistics, Academia Sinica. In the following experiments, the Chinese Word Segmentation System developed by the Chinese Knowledgebase team was used to segment the text, breaking down sentences into units of words.
Using a word segmentation system to segment the words, we can search through the central emotional vocabulary database to determine whether it contains the primary emotion. For example:
  • Analysis:
  • I finally finished my paper today (I finally finished the paper today.)
  • After Chinese word segmentation:
  • I (Nh) finally (ADV) finished (VC) the paper (Na) today (Nd)
Query the central emotion lexicon database, excluding Nh (pronouns), Na (temporal nouns), P (prepositions), ASP (aspect markers), and other parts of speech that do not contribute to the emotional analysis of sentences. In the central emotion lexicon database, ‘finished (VC)’ is defined as achieving the primary emotional expression.
  • Result Analysis:
  • thesis (Na) [implement]
The term “thesis (Na)” concept features can be queried in the OntoSense ontology corpus database. text #research
  • The result is:
  • text #research [implement]
After subjecting all sentences to syntactic analysis, they are transformed into a structure of the sentences’ main emotional words and conceptual features. If a sentence, after syntactic analysis, does not contain any main emotional words or only contains main emotional words without conceptual features, such sentences are considered neutral, devoid of emotions, and excluded from emotional judgment.
We filter out the emotional sentences for analysis, which are eventually transformed into the structure. We can then proceed to analyze the characteristics of these emotional sentences.

2.2.5. Data Mining

We aim to identify the critical influential features of positive and negative sentiment sentences. For positive sentiment sentences, we seek to uncover the primary influential features contributing to positive emotions. Similarly, for negative sentiment sentences, we aim to identify the main influential features that contribute to negative emotions. This analysis will explore the data for positive and negative sentiment sentences to uncover their respective correlations.
Association rules [39,40] are a data mining technique that discovers valuable relationships between items in large datasets, uncovering correlations between data items. The most famous example is the association between beer and diapers. When analyzing customer purchasing habits, a large chain supermarket used association rules to find that people who buy diapers also tend to purchase beer. Further investigation revealed that fathers, who are typically the ones buying diapers, often buy beer because they cannot go to a bar at that time.
There are three main concepts in association rules:
  • Itemset:
    The total number of combinations of items can be calculated using the formula 2n − 1, where ‘n’ represents the number of items. For example, if a record contains three items {A, B, C}, the total number of combinations would be {A}, {B}, {C}, {A,B}, {A,C}, {B,C}, and {A, B, C}.
  • Support:
    Set a rule requiring minimum data points, including objects’ probability in A∩B.
  • Confidence:
    The Apriori algorithm is the most representative algorithm that allows for discovering meaningful association rules by setting rules through the “support” stage to control their confidence strength. The algorithm then identifies association rules that satisfy the specified support and confidence thresholds. The execution steps of the Apriori algorithm are as follows:
    • Set the support and confidence thresholds.
    • Consider all data as candidate item sets. Calculate the occurrence frequency of each candidate item set and retain those with occurrence frequency greater than or equal to the support threshold, creating them as one-dimensional candidate item sets.
    • Calculate the frequency of association combinations from the previously filtered one-dimensional candidate items and eliminate association candidate item combinations with low support using the same method. Repeat this process until the maximum number of candidate item sets in the data is calculated.
    • The final remaining strongly associated candidate item sets are the main links in the entire data association. We can identify the leading associations that affect positive and negative sentiment sentences through association rules. These associations can be categorized into three types, as shown in Table 5.
This study will only retain the ‘primary emotional word -> conceptual feature’ connections in these associations. This study focuses on the relationship where primary emotional words correspond to conceptual features, which serves as the primary association feature rule for distinguishing between positive and negative emotion sentences.
After sentence analysis, our sentences are divided into main emotional words + concept features. The discovered associated feature rules follow the main emotional words + concept features pattern. The main emotional words confirm the presence of emotions in the sentence, while the concept features are the key elements we analyze. Based on the word hierarchy database, we can determine the position of concept features within the word hierarchy. Then, referring to Lin’s [28] proposed knowledge network similarity algorithm for modification, with the help of different knowledge network structure trees and given parameters of various depths, we obtain Equation (4) as follows.
V P D i ,   D j = 1 ,     i f   D i = D j L D i , D j F 1 N L D i , D j F D i , D j 1 , i f   D i D j
where
  • D i , D j : Represents the concept feature.
  • L D i ,   D j : Represents the maximum length of the shared path between two concept features.
  • N L D i ,   D j : Indicates the number of sub-nodes in that path.
  • F: Represents the maximum depth of the concept feature tree for a given set.
  • V P D i ,   D j : Calculates the similarity between two concept features based on F.
According to the Knowledge Graph, the relationship symbols are further classified into four levels (Table 6).
To obtain the relationship symbols for each level of similarity between two conceptual features (Function (5)), a given α value is required, such that:
V r D i , D j = V P D i , D j × α
Suppose we extend it to sentence pairs and their main relevant features when a sentence has multiple conceptual features. In that case, we calculate the similarity between each conceptual feature of the sentence and the main relevant feature separately and then take the average results to obtain the final similarity value between the sentence pair and the main relevant feature.

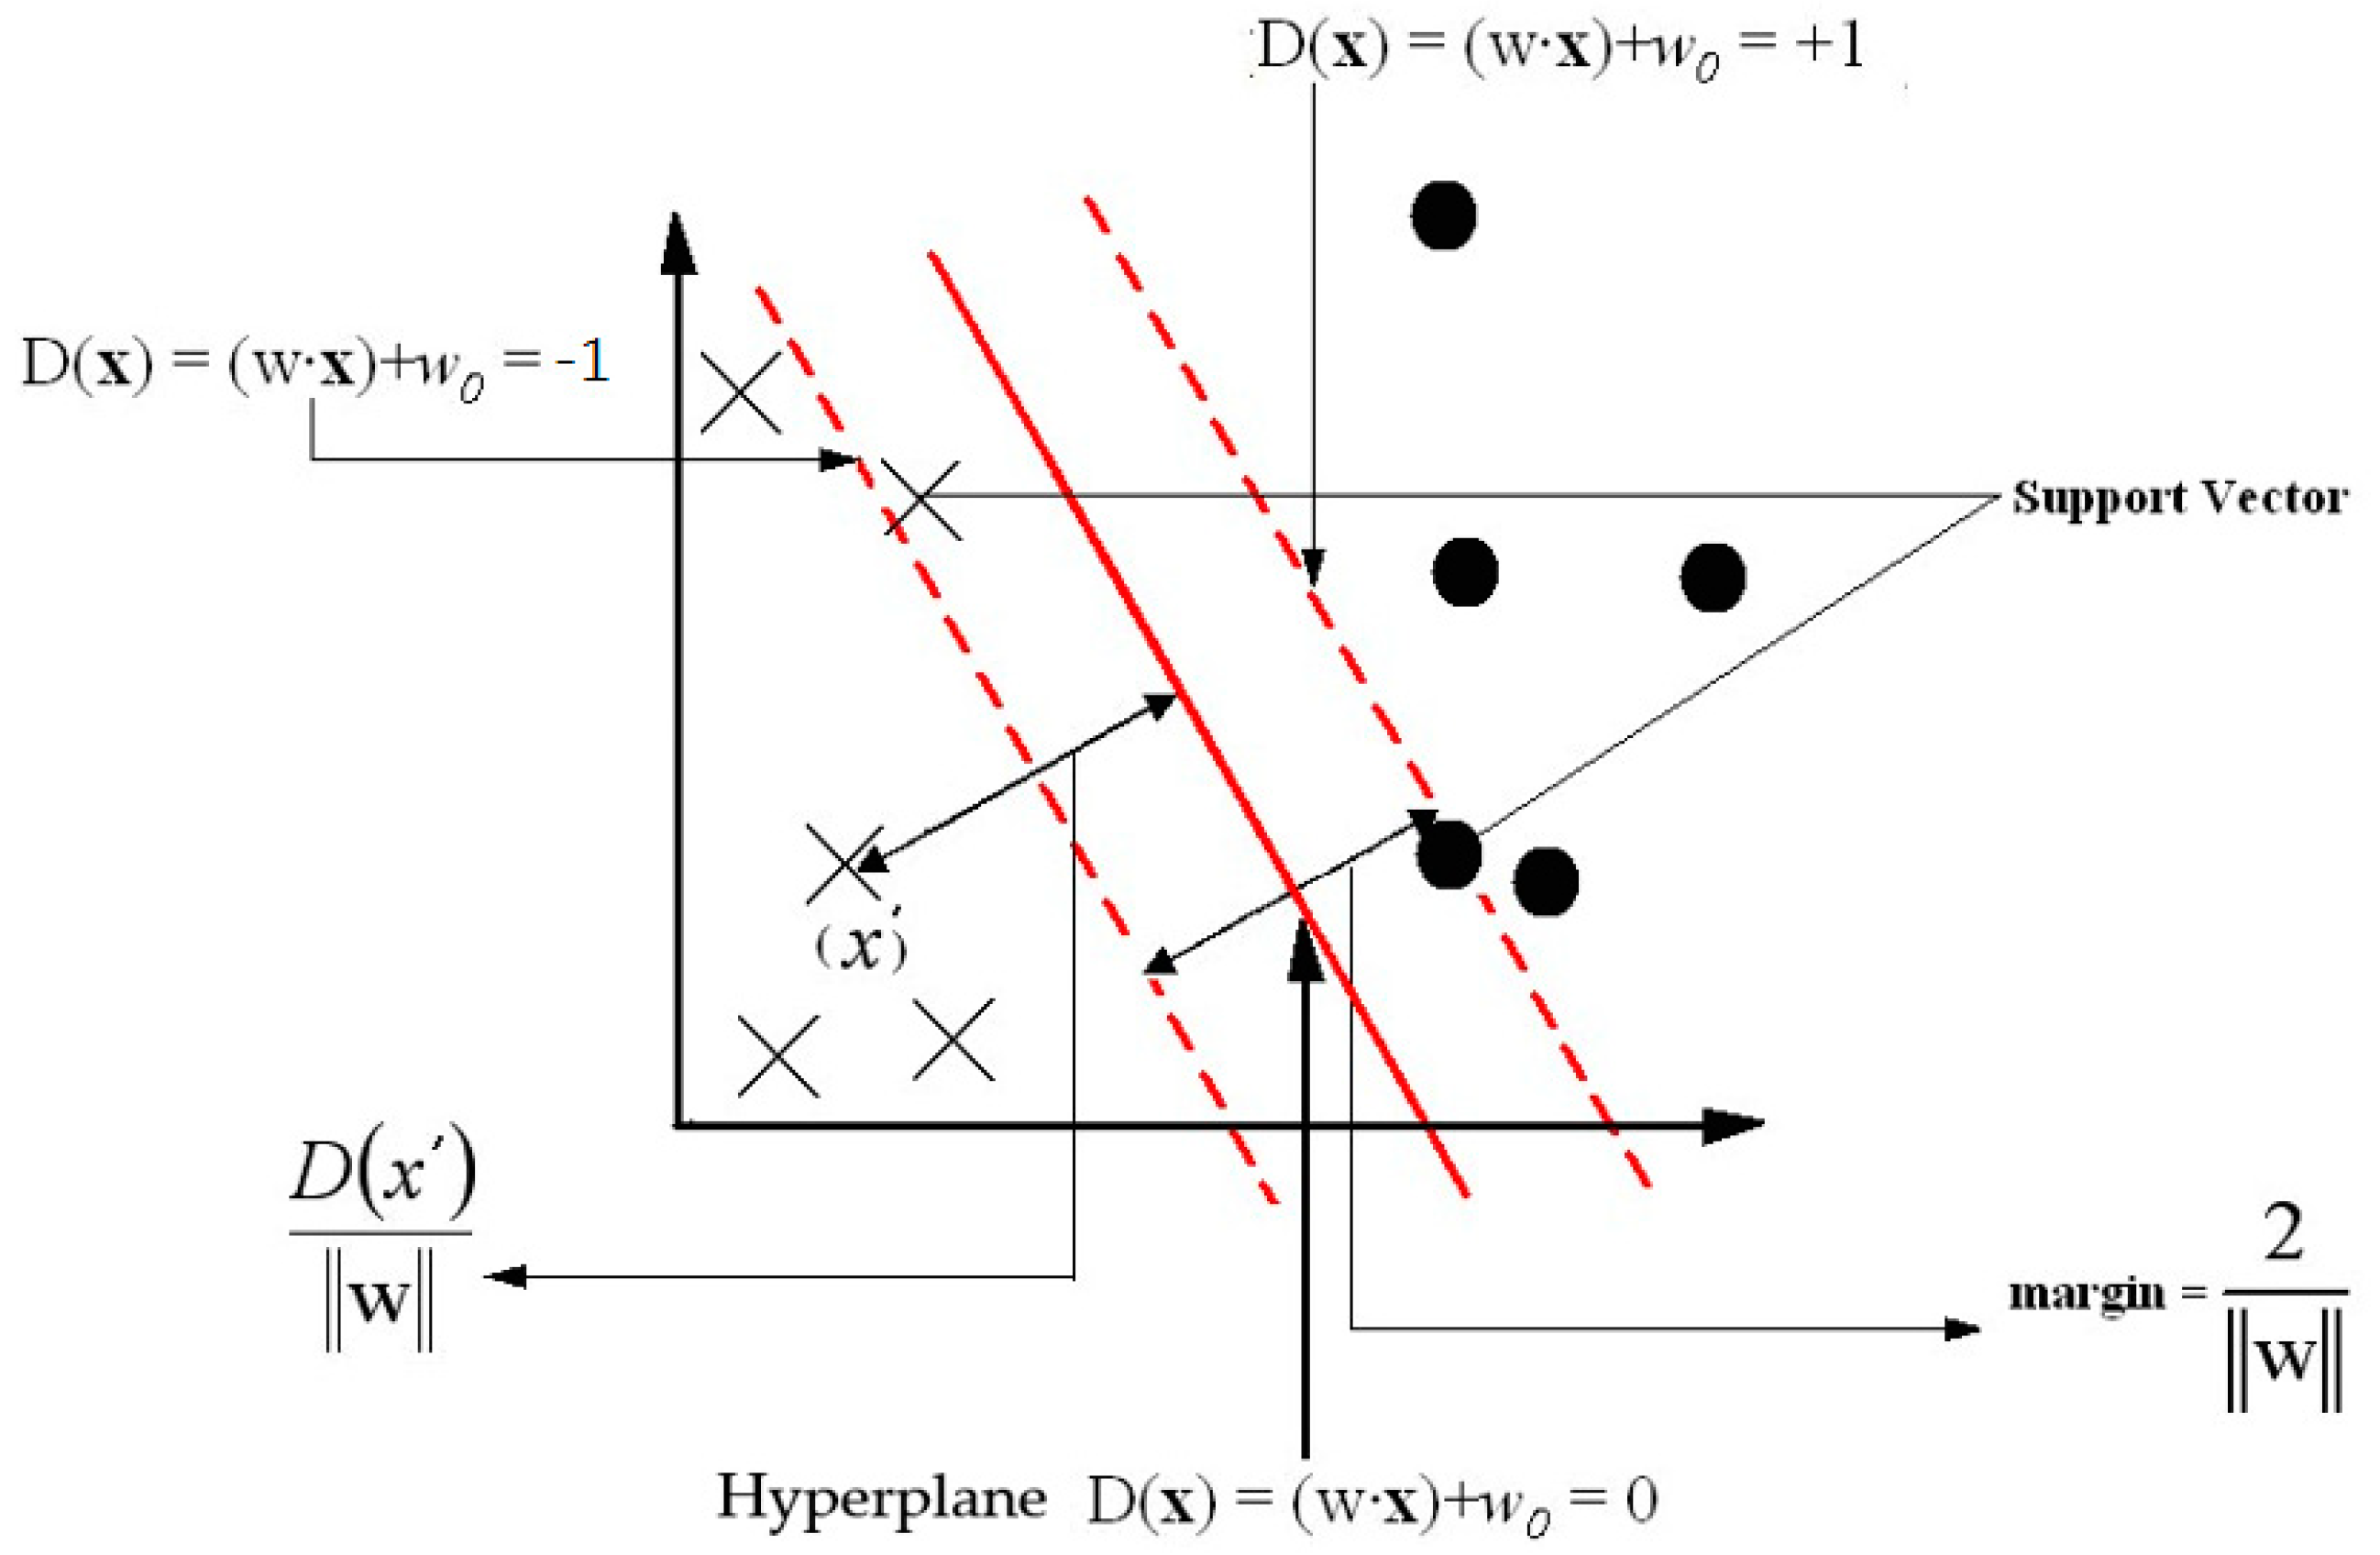
2.2.6. Sparse Representation Classification Model

Sparse Representation Classifier (SRC) [24,32] is primarily used for classification tasks, aiming to enhance the efficiency of signal processing and computations by representing signals using sparse bases. It avoids the limitations of Shannon–Nyquist sampling by using lower sampling frequencies while still being able to reconstruct the signal fully. In this study, Sparse Representation is employed to leverage its discriminative characteristics.
The architecture and algorithm are as follows: there are two classes of emotions (positive and negative). The training data can be obtained through feature analysis, yielding a fixed-dimensional representation formula [24]. We gather the training data of positive emotions, forming a matrix D_h, denoted as: D_h = [v_(h,1) v_(h,2) ⋯ v_(h, n)] which is referred to as the dictionary of positive emotion class. Assuming a sentence belongs to the positive emotion class y, its feature vector can be obtained after feature analysis. It can be represented by linearly combining feature vectors from the same class, thereby reconstructing the vector (as shown in Equation (6)).
y = α h , 1 v h , 1 + α h , 2 v h , 2 + + α h , n v h , n
where x i = α h , 1 α h , 2 α h , n represents real values.
In the context of practical sentiment analysis where the test data labels are unknown, we need to construct a global dictionary, denoted as D. The approach involves merging dictionaries of positive and negative sentiment sentences (as shown in Equation (7)).
D = D h   D s ϵ R m × n
In the given situation where y and D are known, we aim to find the sparse coefficients x = x h x s that minimize the error between the original vector and the reconstructed vector. Additionally, x should satisfy the sparsity constraint as shown in Equation (8). This is an optimization problem typically solved using linear programming.
m i n   x y D x 2 2 + λ x 1
After obtaining the sparse coefficients, in the decision-making process, the dictionaries D h and D s , as well as the coefficients x h and x s , are used to reconstruct the original vectors. The error is then computed by comparing the reconstructed vectors with the original vectors. The class with the smallest error is considered the belonging class, as shown in Equation (9).
i = a r g m i n i y D i x i 2 2
Figure 9, Figure 10, Figure 11 and Figure 12 illustrate how to classify unknown data into a positive or negative sentiment category. In the beginning, we have the spatial distribution of positive and negative sentiments. When unknown data is to be identified as positive or negative, if the error is smaller than the forward category vector, the unknown data belongs to the forward category. The schematic diagram of the dictionary for positive and negative emotions is shown in Figure 9.
The label of the test data is unknown, as shown in Figure 10.
Restore the original vector from the positive emotion dictionary, as shown in Figure 11.
Restore the original vector from the reverse emotion dictionary, as shown in Figure 12.
Then, we calculate the error with the original vector to obtain that with the minimum error, which corresponds to the corresponding category.

2.3. Data Classification

To classify the data, it is necessary first to retrieve the comment data of the topics from the JSON database. Then, the main emotional and conceptual features related to the data are extracted through a sentence processor. Using trained association rules, similarity analysis is performed to generate a matrix representation of the results. The sparse representation classifier is employed to calculate the errors between respective dictionaries, resulting in the sentiment analysis outcome. The process is illustrated in Figure 13.

3. Experimental Results

3.1. Experimental Setup and Environment

The programs used in this study were developed on a personal computer, except for the Chinese word segmentation system. The data for comments was obtained using Python 3.6 development, the training data was developed using C 99 language, and the sparse representation classification model was implemented using MATLAB R2015b for classification. The data source primarily consisted of comments from the PTT platform.

3.2. Experimental Corpus

For this study, the test corpus was selected from the June articles of the PTT Gossiping board, with approximately 40,000 articles excerpted for testing. Several specific topics were chosen for research. Keywords for the study include Uber, baseball, and Zhongxiao Bridge.

3.2.1. Uber

Due to the frequent controversies and disputes surrounding Uber, this research aims to examine the opinions of users on the PTT forum regarding Uber. From over 40,000 articles, titles related to the Uber topic were identified, and their comments were used as test data, as shown in Table 7. The sentiment judgments were based on the upvotes and downvotes to evaluate the effectiveness of the classification method employed in this study.
The sentiment analysis of Uber-related comments reveals varying degrees of accuracy across different platforms. The overall accuracy stands at 62%, with tweet comments and downvote comments showing 59% and 73% accuracy, respectively. The higher accuracy in downvote comments could indicate a clearer expression of sentiment, facilitating more precise classification. These results underscore the challenges in sentiment analysis, particularly in accurately categorizing emotions in short-form social media content, where context and subtlety can significantly impact interpretation. The findings suggest that, while sentiment analysis tools are moderately effective, there is room for improvement, especially in understanding the nuanced language of tweets.

3.2.2. Baseball Game Analysis

Due to the championship victory of the Chinatrust Brothers in June and the World Little League Baseball competition, the keyword “baseball” was chosen to assess public opinion. The sentiment analysis of baseball-related comments yields an overall accuracy of 68%, with tweet comments showing notably higher accuracy at 75% compared to downvote comments at 28%, as shown in Table 8. This suggests that the language used in tweets may be more straightforward or emotionally expressive, allowing for more accurate sentiment classification. The stark contrast with downvote comments hints at the possible complexity or subtlety in these expressions, which the current model struggles to interpret accurately. The results prompt a discussion about the necessity for more advanced or specialized machine learning models that can better capture the nuances of negative sentiments and the potential need for customized approaches for different types of social media interactions. The findings also underline the importance of considering the context and platform-specific linguistic traits when conducting sentiment analysis to ensure more reliable and nuanced results. This analysis serves as a critical reflection on the evolving field of sentiment analysis, pushing for innovations that can adeptly handle the intricacies of human communication in the digital age.
Eventually, it was discovered that the accuracy rate of classifying baseball comments reached 68%. The accuracy rate was particularly low for negative comments, mainly due to many comments about controversial aspects of the Little League World Series game. This led to sarcastic language in the comments and increased the likelihood of misjudging them as positive comments. For example:
  • The second pitch was a strike; can you believe it?
  • The catcher was squatting in the left-handed batter’s box, constantly pulling the glove back, and the home plate umpire kept falling for it.
  • The kids are happy playing ball and growing taller and more muscular. They’ll seek revenge when they grow up.
  • The video is so biased. Except for the first pitch being a beautiful strike, the rest is a complete black box.
  • Suddenly, I feel like the Chinese Professional Baseball League (CPBL) seems better.

3.2.3. Analysis of the Demolition of Zhongxiao Bridge

The broadcast of a documentary about the demolition of Zhongxiao Bridge has sparked discussions about the impact of the documentary. The sentiment analysis on the Zhongxiao Bridge demolition discussion reflects an overall accuracy of 72.8%. Tweet comments demonstrated a 72% accuracy in emotional tagging, with a predominant share of positive sentiments, as shown in Table 9. Downvote comments yielded a higher accuracy at 76%, despite the smaller sample size. The data suggests nuanced sentiment detection capabilities, with tweet sentiments being identified with reasonable accuracy. However, the marginally better performance in downvote comments could indicate that certain types of expressions are more straightforward for sentiment algorithms to classify. This analysis could inform strategies for improving sentiment detection, especially in the context of infrastructure-related public discourse.
The sentiment analysis conducted on Uber, Baseball, and Zhongxiao Bridge demolition data reveals varying levels of accuracy: 62% for Uber, 68% for Baseball, and 72.8% for the Zhongxiao Bridge, indicating a context-dependent performance of machine learning models. This result indicates that the training rules of this system have achieved initial adaptability and a certain level of accuracy, while also achieving a preliminary understanding of semantic content. The results highlight the potential of fine-tuning these models for specific types of data and the importance of contextual understanding in sentiment analysis.

4. Conclusions

This paper utilized Chinese word sense analysis techniques from the Chinese Word Knowledge Network and the Chinese Word Knowledge Base team at Academia Sinica as reference materials to obtain conceptual meanings of words. Utilizing sophisticated data mining techniques, we were able to craft sentiment rules that effectively translate sentences into a vector space format. This transformation is a critical step in our methodology, setting the stage for applying sparse representation classification techniques. These techniques play a pivotal role in accurately distinguishing between various sentiments expressed in text. From the experimental results, an accuracy rate of 70% was achieved, indicating a certain level of discernment regarding the trends of online public opinion. This can serve as a reference for monitoring online public opinion.
This significant achievement underscores our method’s effectiveness in discerning trends in online public opinion. Such accuracy holds immense potential for applications in monitoring and analyzing online public sentiment. Nonetheless, it is essential to acknowledge a limitation in our current approach. Discerning sarcasm within sentences has presented a challenge, with less than satisfactory results. The identification of sarcasm in sentences poses a challenge, but the results are unsatisfactory. Recognizing the importance of this aspect, we will collect more corpus in the future for texts expressing sarcasm and strengthen the use of sarcastic terms in texts. This improvement can greatly improve our understanding and analysis of sarcastic expressions. In addition to identifying online emotions, the emotion recognition of phrases can also be extended to speech synthesis by adding emotional pronunciation, and the generated speech can express emotional characteristics, thereby being closer to real-life speech. Using only one platform (PTT) may limit the generalizability of the results. In future research, we will collect data from multiple platforms to verify the model’s effectiveness in different online environments. In addition to discerning online sentiment, the sentiment recognition of phrases can also be ex-tended to speech synthesis. By incorporating emotional pronunciation in speech synthesis, the generated voice can exhibit emotional characteristics resembling real-life speech more closely.

Author Contributions

Conceptualization, J.-C.W.; methodology, Y.-Z.Z.; resources, V.C.-M.C. and Y.-H.L.; writing—original draft preparation, Y.-Z.Z.; writing—review and editing, J.-H.W., M.-H.S., P.T.L., T.P. and X.L. All authors have read and agreed to the published version of the manuscript.

Funding

This research received no external funding.

Data Availability Statement

Data are contained within the article.

Conflicts of Interest

The authors declare no conflicts of interest.

References

  1. Cheung, K.S.; Leung, W.K.; Seto, W.K. Application of big data analysis in gastrointestinal research. World J. Gastroenterol. 2019, 25, 2990. [Google Scholar] [CrossRef] [PubMed]
  2. Majumdar, J.; Naraseeyappa, S.; Ankalaki, S. Analysis of agriculture data using data mining techniques: Application of big data. J. Big Data 2017, 4, 20. [Google Scholar] [CrossRef]
  3. Wu, J.; Wang, J.; Nicholas, S.; Maitland, E.; Fan, Q. Application of big data technology for COVID-19 prevention and control in China: Lessons and recommendations. J. Med. Internet Res. 2020, 22, e21980. [Google Scholar] [CrossRef] [PubMed]
  4. Ding, H.; Tian, J.; Yu, W.; Wilson, D.I.; Young, B.R.; Cui, X.; Xin, X.; Wang, Z.; Li, W. The application of artificial intelligence and big data in the food industry. Foods 2023, 12, 4511. [Google Scholar] [CrossRef] [PubMed]
  5. Jin, K.; Zhong, Z.Z.; Zhao, E.Y. Sustainable digital marketing under big data: An AI random forest model approach. IEEE Trans. Eng. Manag. 2024, 71, 3566–3579. [Google Scholar] [CrossRef]
  6. Demchenko, Y.; Belloum, A.; Los, W.; Wiktorski, T.; Manieri, A.; Brocks, H.; Becker, J.; Heutelbeck, D.; Hemmje, M.; Brewer, S. EDISON data science framework: A foundation for building data science profession for research and industry. In Proceedings of the 2016 IEEE International Conference on Cloud Computing Technology and Science (CloudCom), Luxembourg, 12–15 December 2016; pp. 620–626. [Google Scholar]
  7. Murphy, J.; Link, M.W.; Childs, J.H.; Tesfaye, C.L.; Dean, E.; Stern, M.; Pasek, J.; Cohen, J.; Callegaro, M.; Harwood, P. Social media in public opinion research: Executive summary of the AAPOR task force on emerging technologies in public opinion research. Public Opin. Q. 2014, 78, 788–794. [Google Scholar] [CrossRef]
  8. Cuadrado, A.; Cardoso, M.; Jouve, N. Physical organisation of simple sequence repeats (SSRs) in Triticeae: Structural, functional and evolutionary implications. Cytogenet. Genome Res. 2008, 120, 210–219. [Google Scholar] [CrossRef] [PubMed]
  9. Liu, L.; Cao, Z.; Zhao, P.; Hu, P.J.H.; Zeng, D.D.; Luo, Y. A deep learning approach for semantic analysis of COVID-19-related stigma on social media. IEEE Trans. Comput. Soc. Syst. 2022, 10, 246–254. [Google Scholar] [CrossRef]
  10. Patano, M.; Camarda, D. Managing Complex Knowledge in Sustainable Planning: A Semantic-Based Model for Multiagent Water-Related Concepts. Sustainability 2023, 15, 11774. [Google Scholar] [CrossRef]
  11. Gu, Z.; He, K. Affective Prompt-Tuning-Based Language Model for Semantic-Based Emotional Text Generation. Int. J. Semant. Web Inf. Syst. (IJSWIS) 2024, 20, 1–19. [Google Scholar] [CrossRef]
  12. Jotheeswaran, J.; Kumaraswamy, Y.S. Opinion mining using decision tree based feature selection through Manhattan hierarchical cluster measure. J. Theor. Appl. Inf. Technol. 2013, 58, 72–80. [Google Scholar]
  13. Thomas, E.H.; Galambos, N. What satisfies students? Mining student-opinion data with regression and decision tree analysis. Res. High. Educ. 2004, 45, 251–269. [Google Scholar] [CrossRef]
  14. Ramadhan, N.G.; Wibowo, M.; Rosely, N.F.L.M.; Quix, C. Opinion mining indonesian presidential election on twitter data based on decision tree method. J. Infotel 2022, 14, 243–248. [Google Scholar] [CrossRef]
  15. Sanjay, K.S.; Danti, A. Detection of fake opinions on online products using Decision Tree and Information Gain. In Proceedings of the 2019 3rd International Conference on Computing Methodologies and Communication (ICCMC), Erode, India, 27–29 March 2019; pp. 372–375. [Google Scholar]
  16. Es-Sabery, F.; Es-Sabery, K.; Qadir, J.; Sainz-De-Abajo, B.; Hair, A.; García-Zapirain, B.; De La Torre-Díez, I. A MapReduce opinion mining for COVID-19-related tweets classification using enhanced ID3 decision tree classifier. IEEE Access 2021, 9, 58706–58739. [Google Scholar] [CrossRef]
  17. Tavazoee, F.; Conversano, C.; Mola, F. Recurrent random forest for the assessment of popularity in social media: 2016 US election as a case study. Knowl. Inf. Syst. 2020, 62, 1847–1879. [Google Scholar] [CrossRef]
  18. Elagamy, M.N.; Stanier, C.; Sharp, B. Stock market random forest-text mining system mining critical indicators of stock market movements. In Proceedings of the 2018 2nd International Conference on Natural Language and Speech Processing (ICNLSP), Algiers, Algeria, 25–26 April 2018; pp. 1–8. [Google Scholar]
  19. Karthika, P.; Murugeswari, R.; Manoranjithem, R. Sentiment analysis of social media network using random forest algorithm. In Proceedings of the 2019 IEEE International Conference on Intelligent Techniques in Control, Optimization and Signal Processing (INCOS), Tamilnadu, India, 11–13 April 2019; pp. 1–5. [Google Scholar]
  20. Wu, C.-H.; Chuang, Z.-J.; Lin, Y.-C. Emotion recognition from text using semantic labels and separable mixture models. ACM Trans. Asian Lang. Inf. Process. (TALIP) 2006, 5, 165–183. [Google Scholar] [CrossRef]
  21. Li, P.H.; Fu, T.J.; Ma, W.Y. Why attention? Analyze BiLSTM deficiency and its remedies in the case of NER. AAAI Conf. Artif. Intell. 2020, 34, 8236–8244. [Google Scholar] [CrossRef]
  22. Ding, Y.; Teng, F.; Zhang, P.; Huo, X.; Sun, Q.; Qi, Y. Research on text information mining technology of substation inspection based on improved Jieba. In Proceedings of the 2021 International Conference on Wireless Communications and Smart Grid (ICWCSG), Hangzhou, China, 13–15 August 2021; pp. 561–564. [Google Scholar]
  23. Wang, M.; Manning, C.D. Cross-lingual projected expectation regularization for weakly supervised learning. Trans. Assoc. Comput. Linguist. 2014, 2, 55–66. [Google Scholar] [CrossRef]
  24. Wiki, TF-IDF. Available online: https://zh.wikipedia.org/wiki/TF-IDF (accessed on 27 March 2024).
  25. Zhu, R.M.; Wang, F.Y.; Hirata, I.; Katsu, K.I.; Xiao, S.D.; Yu, Z.L.; Zhang, Z.H.; Xu, Z.M. Differences in endoscopic classification of early colorectal carcinoma between China and Japan: A comparative study. World J. Gastroenterol. 2003, 9, 1985. [Google Scholar] [CrossRef]
  26. Guo, G.; Neagu, D. Fuzzy kNNmodel applied to predictive toxicology data mining. Int. J. Comput. Intell. Appl. 2005, 5, 321–333. [Google Scholar] [CrossRef]
  27. Campbell, W.M.; Campbell, J.P.; Reynolds, D.A.; Singer, E.; Torres-Carrasquillo, P.A. Support vector machines for speaker and language recognition. Comput. Speech Lang. 2006, 20, 210–229. [Google Scholar] [CrossRef]
  28. LIBSVM. Available online: http://www.csie.ntu.edu.tw/~cjlin/libsvmH (accessed on 27 March 2024).
  29. Wang, J.-C.; Lin, C.-H.; Chen, B.-W.; Tsai, M.-K. Gabor-Based Nonuniform Scale-Frequency Map for Environmental Sound Classification in Home Automation. IEEE Trans. Autom. Sci. Eng. 2014, 17, 607–613. [Google Scholar] [CrossRef]
  30. Wang, J.-C.; Lee, Y.-S.; Lin, C.-H.; Siahaan, E.; Yang, C.-H. Robust Environmental Sound Recognition With Fast Noise Suppression for Home Automation. IEEE Trans. Autom. Sci. Eng. 2015, 12, 1235–1242. [Google Scholar] [CrossRef]
  31. Ma, C.M.; Yang, W.S.; Cheng, B.W. How the parameters of k-nearest neighbor algorithm impact on the best classification accuracy: In case of parkinson dataset. J. Appl. Scie Nces 2014, 14, 171–176. [Google Scholar] [CrossRef]
  32. Wang, J.C.; Chin, Y.H.; Chen, B.W.; Lin, C.H.; Wu, C.H. Speech emotion verification using emotion variance modeling and discriminant scale-frequency maps. IEEE/ACM Trans. Audio Speech Lang. Process. 2015, 23, 1552–1562. [Google Scholar] [CrossRef]
  33. Chin, Y.-H.; Wang, J.-C.; Huang, C.-L.; Wang, K.-Y.; Wu, C.-H. Speaker Identification Using Discriminative Features and Sparse Representation. IEEE Trans. Inf. Forensics Secur. 2017, 12, 1979–1987. [Google Scholar] [CrossRef]
  34. JavaScript Object Notation. Available online: http://www.JSON.org/ (accessed on 27 March 2024).
  35. Russell, J.A.; Pratt, G. A description of the affective quality attributed to environments. J. Personal. Soc. Psychol. 1980, 38, 311. [Google Scholar] [CrossRef]
  36. Larsen, R.J.; Diener, E. Promises and Problems with the Circumplex Model of Emotion; Sage Publications, Inc.: Thousand Oaks, CA, USA, 1992. [Google Scholar]
  37. Posner, J.; Russell, J.A.; Peterson, B.S. The circumplex model of affect: An integrative approach to affective neuroscience, cognitive development, and psychopathology. Dev. Psychopathol. 2005, 17, 715–734. [Google Scholar] [CrossRef]
  38. Chin, Y.-H.; Wang, J.-C.; Wang, J.-C.; Yang, Y.-H. Predicting the Probability Density Function of Music Emotion using Emotion Space Mapping. IEEE Trans. Affect. Comput. 2016, 9, 541–549. [Google Scholar] [CrossRef]
  39. Chauhan, H.; Chauhan, A. Implementation of the Apriori algorithm for association rule mining. Compusoft 2014, 3, 699. [Google Scholar]
  40. Chawla, A.; Dhindsa, K.S. Implementation of association rule mining using reverse apriori algorithmic approach. Int. J. Comput. Appl. 2014, 93, 24–28. [Google Scholar] [CrossRef]
Figure 1. A schematic diagram of SVM classification.
Electronics 13 02015 g001
Figure 2. kNN Illustration [31].
Electronics 13 02015 g002
Figure 3. System Architecture.
Electronics 13 02015 g003
Figure 4. Data Acquisition for Comments.
Electronics 13 02015 g004
Figure 5. Web Scraping Program Pseudo Code.
Electronics 13 02015 g005
Figure 6. Data Training Process.
Electronics 13 02015 g006
Figure 7. Illustrates the circular pattern of emotion classification terms [38].
Electronics 13 02015 g007
Figure 8. Conceptual Tree Structure of Event Types.
Electronics 13 02015 g008
Figure 9. Dictionary of Positive and Negative Emotions.
Electronics 13 02015 g009
Figure 10. Labels of the test data.
Electronics 13 02015 g010
Figure 11. Reverse Engineering of the Positive Emotion Lexicon to Original Vectors.
Electronics 13 02015 g011
Figure 12. Reversing the sentiment dictionary to restore the original vector.
Electronics 13 02015 g012
Figure 13. Data Classification Process.
Electronics 13 02015 g013
Table 1. Disparities among various segmentation systems sample: The weather is sunny today.
Example Sentences: 今天天氣晴朗 (The weather is sunny today)
CKIP tool kit今天 (today) 天氣 (weather) 晴朗 (sunny)
Jieba tool kit今天天氣 (today weather) 晴朗 (sunny)
Stanford Word Segmenter今天 (today) 天氣 (weather) 晴朗 (sunny)
Table 2. JSON Database Format.
KeyInstruction
article_idThe ID of the article
article_titleThe title of the article
boardPTT message board name
contentContent of the article
message_countNumber of messages
messagesSave all messages
Table 3. Word Structure in HowNet.
NO. = 058773
W_C = delicious
G_C = ADJ
E_C =
W_E = dainty
G_E = ADJ
E_E =
DEF = aValue, taste, good, desired
Table 4. Word Features of HowNet.
TermsConceptual features
DeliciousaValue, taste, good, desired
Not badaValue, GoodBad, good, desired
Goodresult, #estimate, good
Experthuman, able, desired
Table 5. Types of Association Rules.
[implement] -> text researchprimary emotional word -> conceptual feature
fact -> nightconceptual feature -> conceptual feature
[achieve] -> [obtain]primary emotional word -> primary emotional word
Table 6. Relationship Symbol Levels.
First level@
Second level*, $
Third level%, &, ?
Fourth level#
Table 7. Uber Analysis.
Conditions for Judging Emotions
All CommentsTweet
Comments
Downvote
Comments
-> Comments
Uber68328273328
Experimental Results
UberAllEmotion
Tagging
PositiveNegativeAccuracy
Tweet Comments2821891127759%
Downvote Comments7352143873%
Correct Categorization 2411123862%
The accuracy rate is 62
Table 8. Baseball Analysis.
Conditions for Judging Emotions
All CommentsTweet
Comments
Downvote
Comments
-> Comments
Baseball1284578208498
Experimental Results
BaseballAllEmotion
Tagging
PositiveNegativeAccuracy
Tweet Comments5783362558175%
Downvote Comments20864461828%
Correct Categorization 4002551868%
The accuracy rate is 68
Table 9. Analysis of the Demolition of Zhongxiao Bridge.
Emotional Evaluation Criteria
All CommentsTweet
Comments
Downvote
Comments
-> Comments
Zhongxiao Bridge1535116356316
Experimental Results
BaseballAllEmotion TaggingPositiveNegativeAccuracy
Tweet Comments116339528610972%
Downvote Comments563482676%
Correct Categorization 4292862672.8%
The accuracy rate is 72
Disclaimer/Publisher’s Note: The statements, opinions and data contained in all publications are solely those of the individual author(s) and contributor(s) and not of MDPI and/or the editor(s). MDPI and/or the editor(s) disclaim responsibility for any injury to people or property resulting from any ideas, methods, instructions or products referred to in the content.

