Article

Aggregation Equivalence Method for Direct-Drive Wind Farms Based on the Excitation–Response Relationship

1
Key Laboratory of Modern Power System Simulation and Control and Renewable Energy Technology, Ministry of Education, Northeast Electric Power University, Jilin 132011, China
2
School of Electrical Engineering, Northeast Electric Power University, Jilin 132011, China
*
Author to whom correspondence should be addressed.
Electronics 2024, 13(11), 2124; https://doi.org/10.3390/electronics13112124
Submission received: 4 May 2024 / Revised: 25 May 2024 / Accepted: 28 May 2024 / Published: 29 May 2024

Abstract

:
The grid interconnections for direct-drive wind farms have triggered multiple new sub-synchronous oscillation events, which can prevent the power system from operating safely and stably. However, the excessively high order of the detailed model for large-scale wind farms with multiple direct-drive permanent magnet synchronous generators (PMSGs) connected to power systems poses a challenge when investigating small disturbance stability and instability mechanisms. This study establishes a model of the grid-connected PMSG system based on the voltage/power excitation–response relationship to describe the dynamic characteristics of the port of the PMSG, and the analysis of active and reactive response characteristics of PMSG lays the foundation for model simplification. Based on the unit model, a direct-drive wind farm aggregation equivalence method based on the excitation–response relationship is proposed. The equivalent model obtained by this method is suitable for the small disturbance stability analysis of direct-drive wind farms grid connected system, with good accuracy. The simulation verified the effectiveness of the aggregation model.

1. Introduction

With the rapid development of new energy represented by wind power, direct-drive permanent magnet synchronous generators (PMSGs) have been widely used due to their high efficiency and low failure rate. PMSGs use a power electronic converter as their interface with the grid, resulting in completely different dynamic characteristics from conventional synchronous generators. However, the converter–grid interaction can induce resonance or oscillation problems, leading to unit tripping and even equipment damage, which affect the steady and safe operation of the power system [1,2,3]. Generally speaking, a direct-drive wind farm contains hundreds of PMSGs. However, detailed modeling of a direct-driven wind farm faces the curse of dimensionality problem. Taking the Hami region of Xinjiang, China, in 2015 as an example, there were 18 wind farms in the region, with direct-drive wind turbines as the main model and a total scale of 1500 MW. The frequent occurrence of power oscillations makes it urgent to strengthen the research on aggregation equivalence modeling of direct-drive wind farms [4,5,6].
To improve the accuracy of equivalence, the most commonly used method for establishing equivalence models for new energy stations is the multi-machine equivalence method [7,8,9,10,11,12,13]. This method classifies new energy stations into a number of clusters based on the principle of similar operating states and then applies single-machine equivalence to the clusters [7,8]. Essentially, it is no different from the single-machine equivalent method [9]. When clustering, it is necessary to use the operating data of each PMSG as the clustering indicator. However, in the planning stage of the wind farm, obtaining these data requires nonlinear simulation, which will greatly increase the computational workload [10,11]. In the single-machine equivalence process, the equivalence model parameters are generally acquired using the capacity-weighted method [12,13], where the internal power loss of the wind farm remains unchanged before and after equivalence at the rated operation state. Therefore, insufficient consideration is given to whether the dynamic characteristics of the wind farm remain consistent, which means that the accuracy of the results cannot be guaranteed when using the capacity-weighted average model to analyze the subsynchronous oscillation of grid-connected wind farms. The parameter identification method can also be used to obtain equivalence model parameters, which converts the calculation of equivalence model parameters into a nonlinear optimization problem. The use of intelligent optimization algorithms such as the genetic algorithm and particle swarm optimization algorithm [14,15,16,17] will greatly increase computational complexity.
The traditional aggregation method only focuses on whether the response at the aggregation point is consistent with the actual model, masking many internal physical mechanisms of the new energy station, making it difficult to analyze the dynamic interaction between the new energy station and the external power grid. Studies in the literature [18,19] proposed a decoupling analysis and equivalence method for the small disturbance stability of wind power grid-connected systems. However, the decoupling analysis method and the related equivalence model are obtained under the same conditions as the linearization model for PMSGs in the wind farm. In actual wind farms, due to the dispersion of operating conditions, the linearization model of PMSGs in the same wind farm is usually different. The study in [20] proposed a new energy station adaptive equivalence method that maintained the dominant characteristic roots of the system before and after equivalence, considering that all PMSGs in the wind farm are operating in rated conditions, but the research focused on stability analysis during the planning stage of the wind farm. The study in [21] proposed a small-signal impedance network modeling method for new energy grid-connected systems, which evaluates system stability through impedance aggregation. However, the dynamic characteristics of internal variables in PMSGs cannot be reflected from the impedance model. The study in [22] proposed an aggregation modeling method for grid-connected VSCs based on structure preservation. Although the model is only suitable for the small disturbance stability analysis of grid-connected VSCs under an AC current control time scale, the idea of a “recurrence” of unit-by-unit aggregation opens up new ideas for wind farm equivalence.
The problem associated with the wind farm aggregation equivalent model when it is used to analyze the small disturbance stability of wind farm grid-connected system was investigated in this study. The main contributions of this article are summarized as follows:
(1)
Using the amplitude and phase of the terminal voltage and the output active and reactive power as the boundary signals for the grid-connected PMSG model, an excitation–response relationship model of the voltage/power of the grid side converter (GSC) of the PMSG is established to describe the dynamic characteristics of the port of the PMSG. The eigenvalues of the new model are highly consistent with those of the state-space equation model.
(2)
Based on the unit model, an aggregation equivalent method for a direct-drive wind farm based on the excitation–response relationship is proposed. The proposed method takes into account the differences in operating conditions of PMSGs and the length of collecting power lines; therefore, it has good accuracy in small disturbance stability analysis of wind farm grid-connected systems, and the proposed method is simple and convenient for modification and analysis.
The rest of the article is organized as follows: Section 2 establishes the excitation–response relationship model of the terminal voltage/output power for the grid-connected PMSG system. Section 3 derives the excitation–response relationship of the voltage/power at the convergence busbar for the PMSGs. Section 4 proposes a direct-drive wind farm aggregation equivalence method based on the excitation–response relationship. In Section 5, the accuracy of the proposed small-signal model of the PMSG based on the excitation–response relationship and the effectiveness of the proposed aggregation equivalent model in the small-signal stability analysis of wind power grid-connected systems are verified through simulation examples. Finally, Section 6 draws the conclusion.

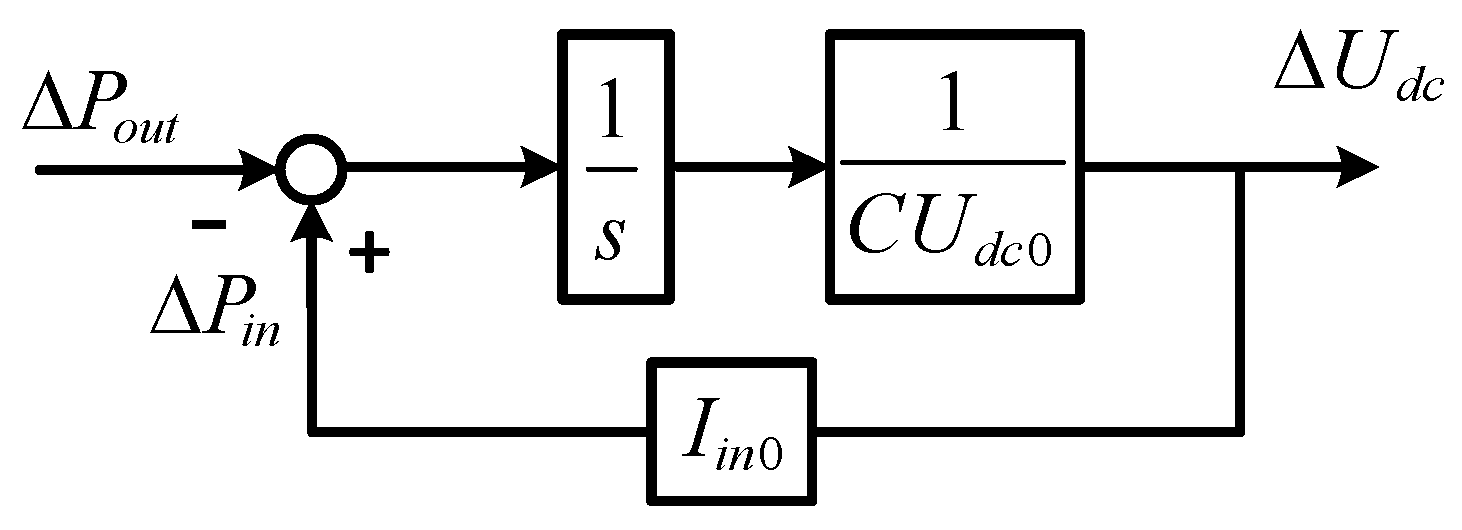
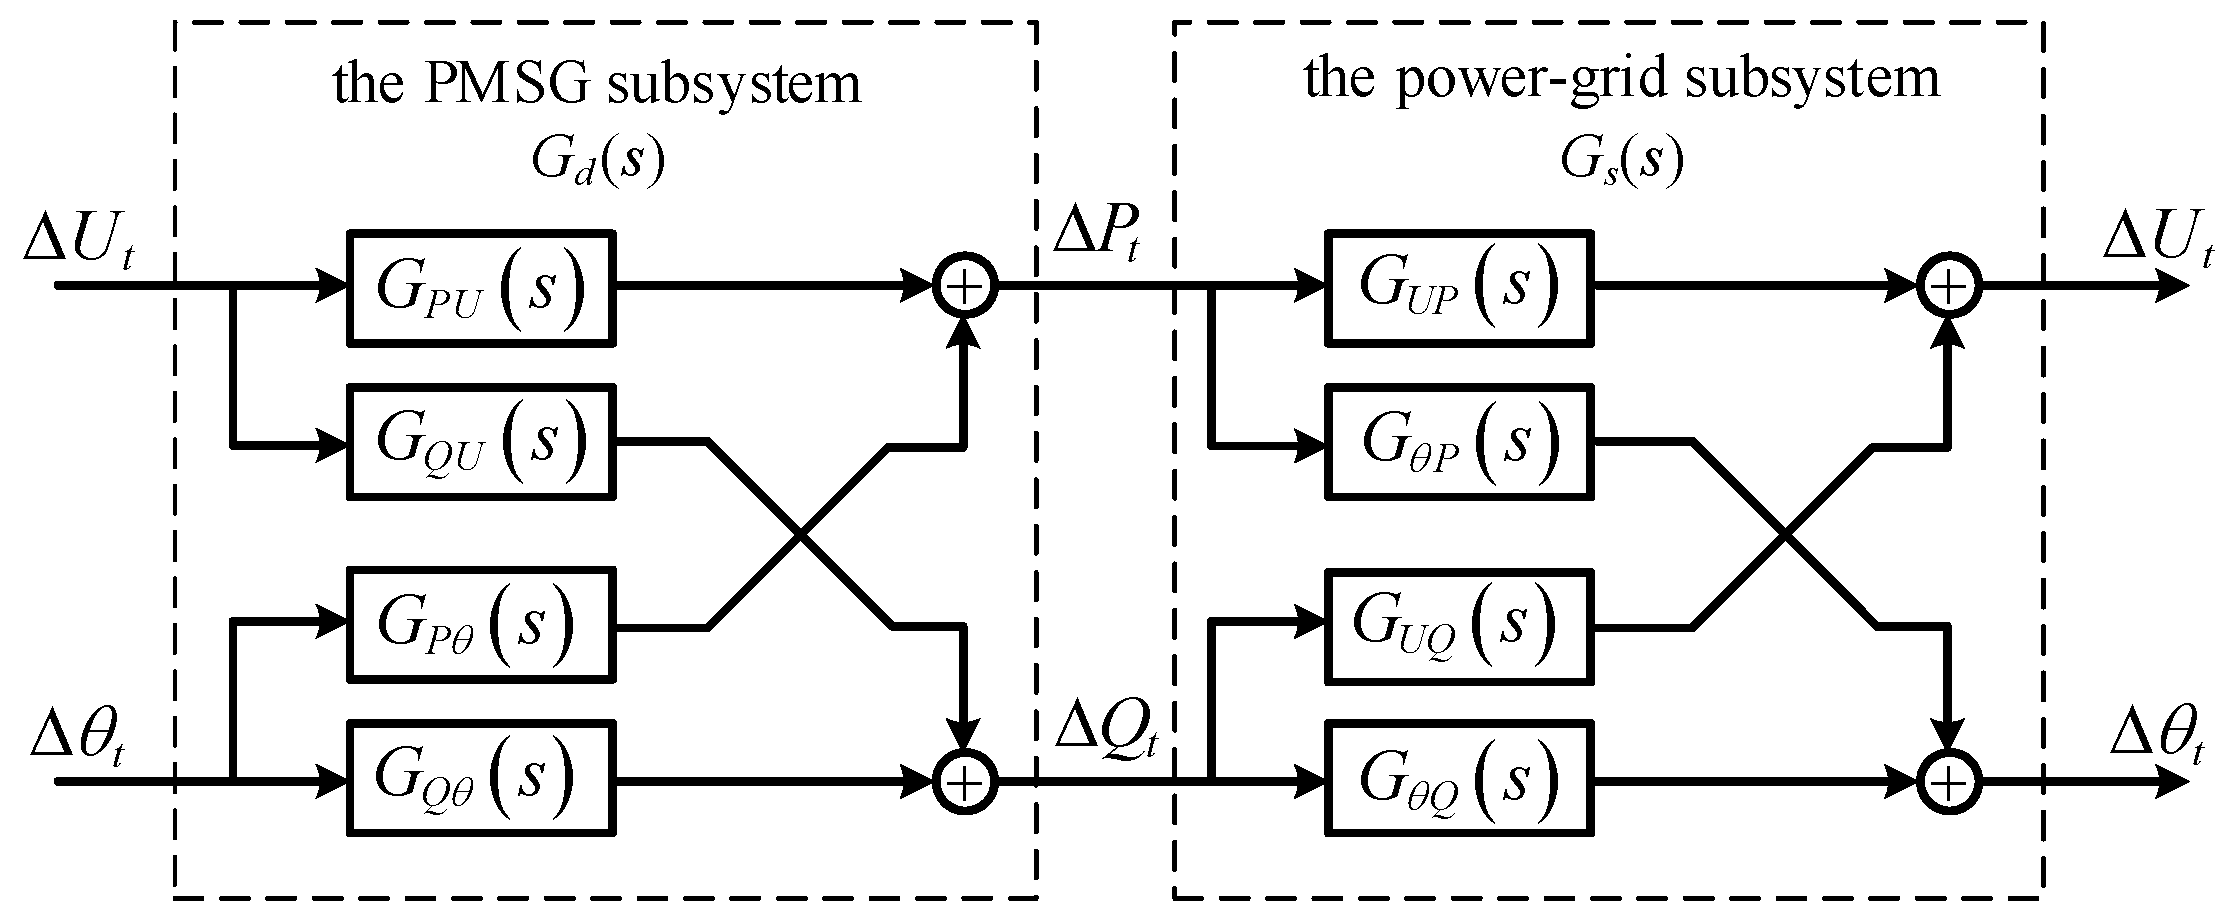
2. Excitation–Response Relationship Model of the Terminal Voltage/Output Power for the Grid-Connected PMSG System

The structure of a grid-connected PMSG is shown in Figure 1. U t     θ t is the voltage at the point connecting the PMSG to the external AC power grid (the terminal voltage of PMSG). U t d ,   U t q and I d , I q are the currents and voltages measured in the DQ reference frame, respectively. The D-axis and Q-axis components of the internal voltage are represented as E d / E q . P t represents the active power, and Q t represents the reactive power of the PMSG. L f is the filtering inductance of the GSC of the PMSG, L g is the equivalent inductance of the external AC power grid, and θ p l l is the output phase angle of the phase-locked loop (PLL).
For an external AC power grid, the PMSG can be considered as a controllable current source. When the system is stable, the PMSG-injected active and reactive power remains constant in the power grid and the terminal voltage of PMSG has a stable amplitude and phase. When the system is disturbed, the terminal voltage of the PMSG changes in amplitude and phase, which alters the injected current, and the active and reactive power exchange between the PMSG and the AC grid begins to be unbalanced. At the same time, the unbalanced power drives the action of the GSC’s controller, changing the amplitude and phase of the internal potential of the PMSG to maintain the system’s rebalancing, which reflects the dynamic characteristics of the PMSG itself. The changes in active and reactive power injected into the power grid will affect the amplitude and phase changes of the PMSG’s terminal voltage, manifested as the dynamic characteristics of the power grid.
The dynamic characteristics of the PMSG and the power grid form a complete closed loop and determine the dynamic behavior of the power system. The terminal voltage of the PMSG serves as the only interface between the PMSG and the external AC power grid, and the active and reactive power output by the PMSG serve as the interface signals. Therefore, the GSC grid-connected model for the PMSG can be represented by two dynamic subsystems connected through feedback, as shown in Figure 2.
For the PMSG, changes in the amplitude and phase of the terminal voltage will alter the active and reactive power of the PMSG. Therefore, U t and θ t are the input signals of the PMSG subsystem and P t and Q t are its output signals. Here, G d ( s ) represents the transfer function relationship of the PMSG subsystem. For the power grid, changes in the power injected into the power grid will alter the amplitude and phase of the terminal voltage. Therefore, P t and Q t become input signals, and U t and θ t become output signals. Here, G s ( s ) represents the transfer function relationship of the power grid subsystem.
According to the dimensionality of the excitation–response relationship, both G d ( s ) and G s ( s ) are transfer function matrices of 2 × 2 dimensions. Namely,
G d ( s ) = G P U ( s ) G P θ ( s ) G Q U ( s ) G Q θ ( s )   G s ( s ) = G U P ( s ) G θ P ( s ) G U Q ( s ) G θ Q ( s )

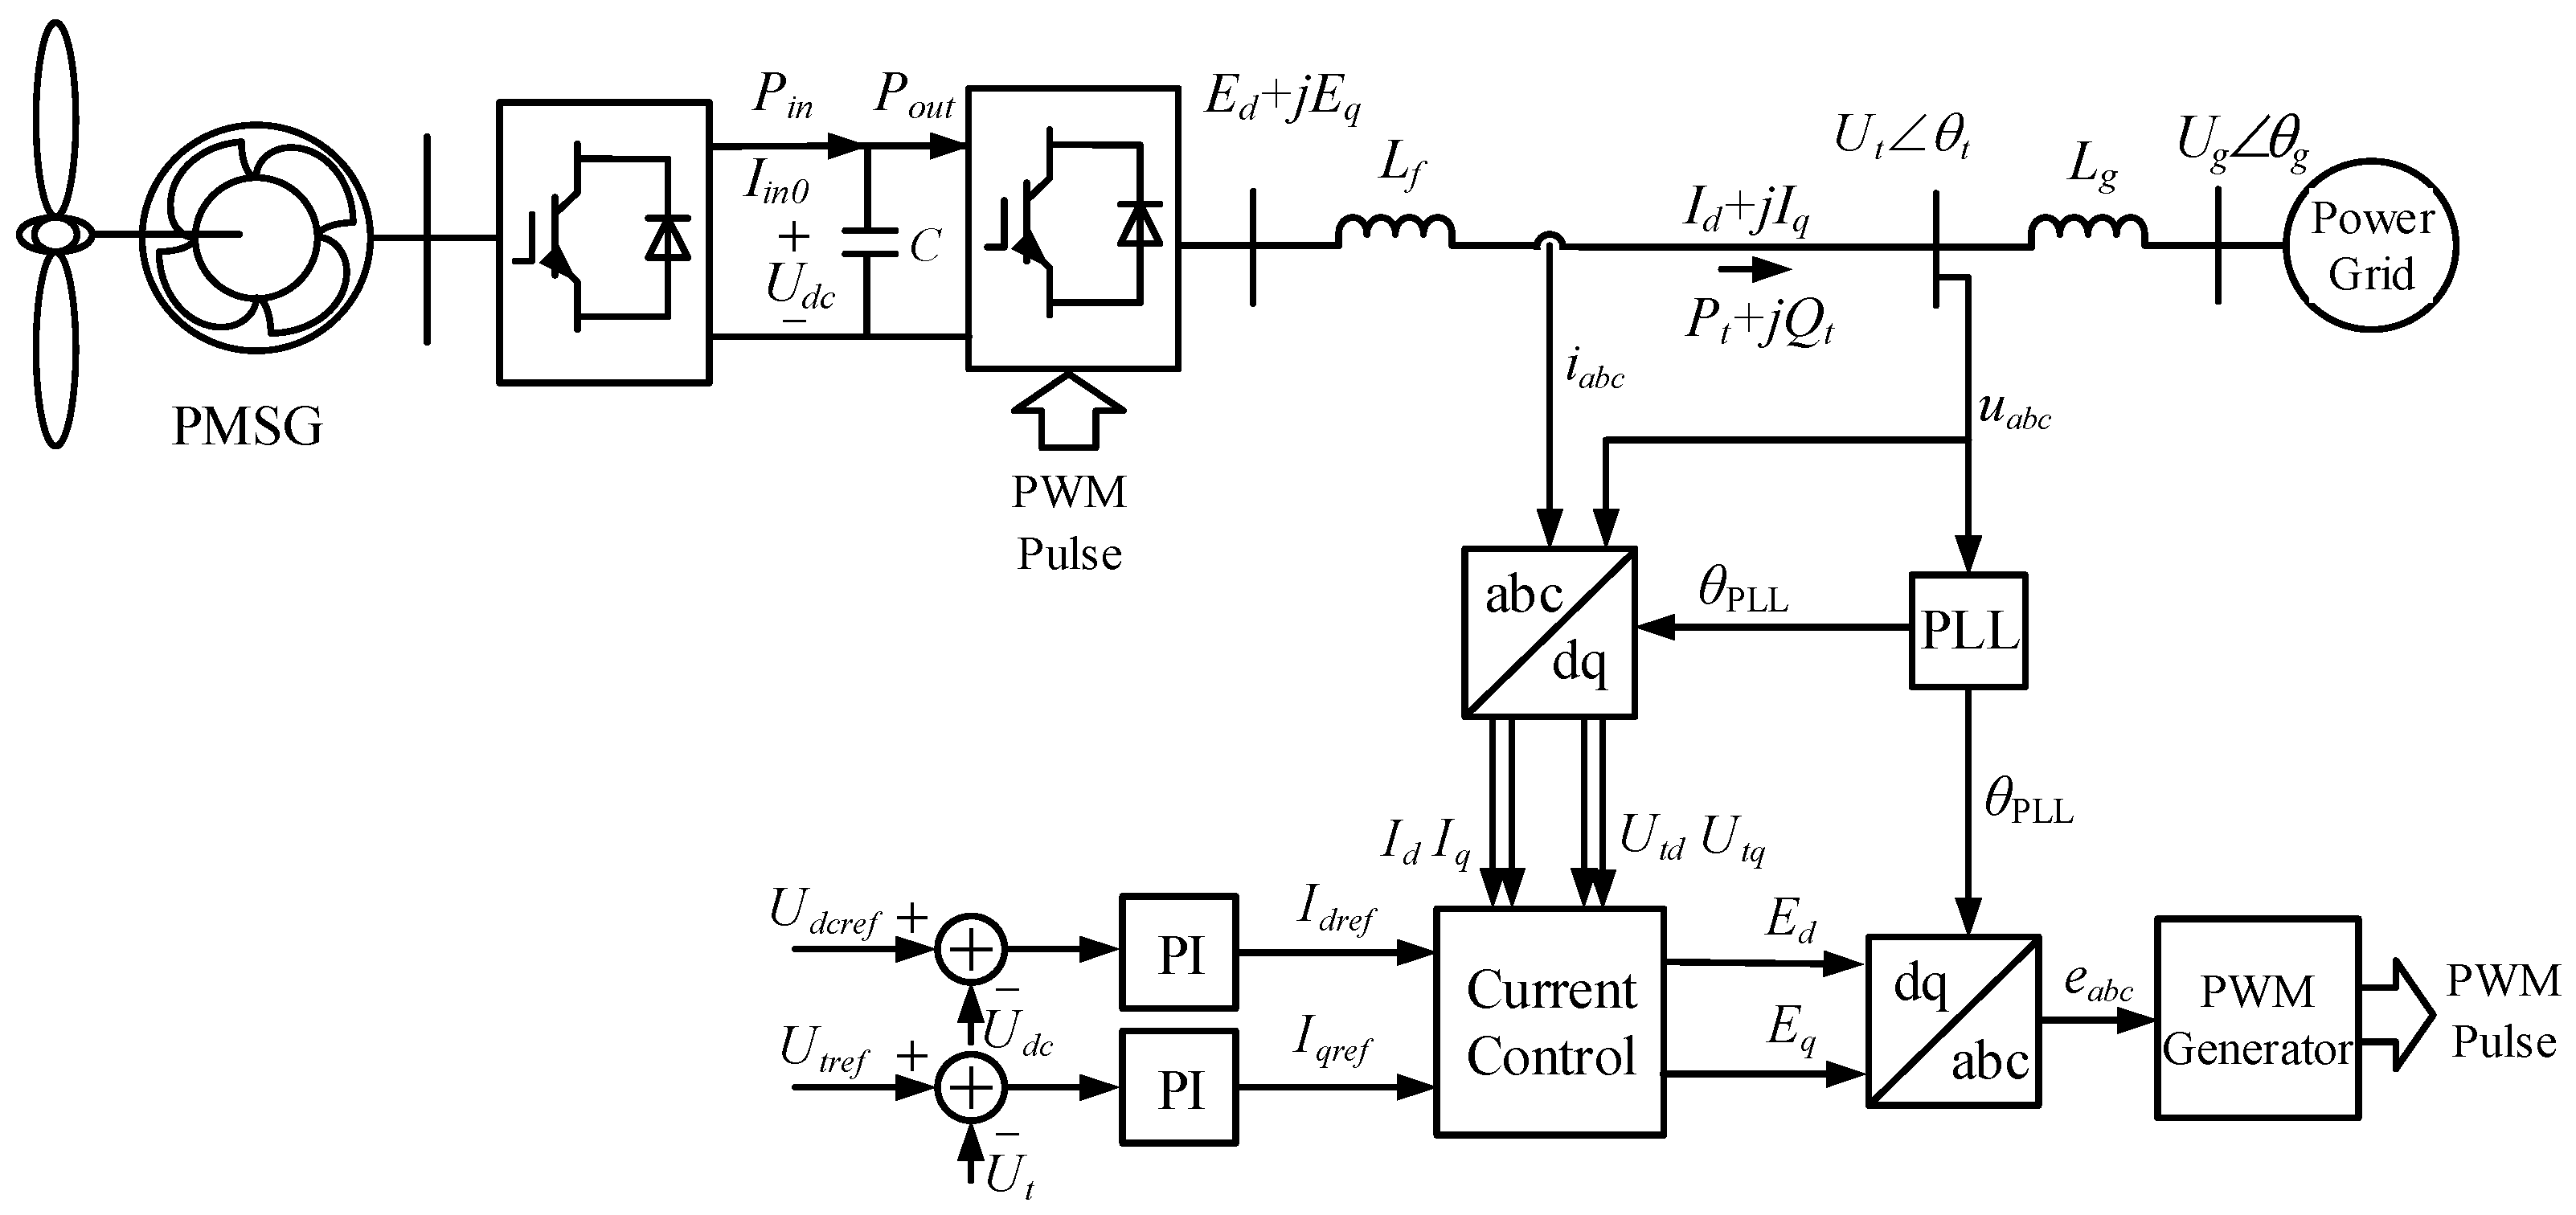
2.1. Model of the PMSG Subsystem

The main circuit of the GSC for the PMSG includes energy storage components, such as a dc-link capacitor and filtering inductor. The controller includes voltage outer loop and current inner loop controllers with dc-link capacitor and filtering inductor states as control objectives, as well as a phase-locked loop controller to achieve synchronization between GSC and the power grid. A small-signal model of the excitation–response relationship between the terminal voltage of the GSC of PMSG and the output power of the PMSG is established by the following steps:
Step 1: Consider the dynamics of the phase-locked loop and establish the transfer function relationship between U t q and θ t .
The phase-locked loop adopts the widely used three-phase synchronous reference frame phase-locked loop (SRF-PLL) and its phase-locked principle and small-signal model are detailed in the literature [23].
For the control coordinate system with the D-axis oriented in the direction of the terminal voltage vector U t   θ t , it can be obtained that
U t d = U t c o s θ e r r o t U t q = U t s i n θ e r r o t
where the phase-locked error θ e r r o t = θ t θ p l l . In the stable state, θ e r r o t = 0 , U t d = U t and U t q = 0 . When considering the dynamic characteristic of the phase locked loop,
U t q = U t 0 G p l l ( s ) θ t
Among them, the transfer function G p l l ( s ) = θ e r r o t θ t for the PLL is
G p l l ( s ) = s 2 s 2 + U t 0 K p l l p s + U t 0 K p l l i
where K p l l i and K p l l p are the integral and proportional coefficients of the PI control for the PLL and U t 0 is the steady-state value of the amplitude of the terminal voltage vector.
Step 2: Consider the dynamic of the dc-link capacitor and establish the transfer function relationship between U d c and P o u t ( P t ).
The dynamic characteristic of dc-link capacitor voltage is
C U d c 0 d U d c d t = P i n P o u t
where C is the dc-link capacitor, U d c 0 stands for the steady-state value of the dc-link capacitor voltage and P i n and P o u t are the power changes in the input and output sides of the dc-link capacitor, respectively. When ignoring the resistance loss of the GSC, P o u t   =   P t .
The function of the machine-side converter can be simplified into a controlled current source [24] to obtain a small-signal model of the dc-link capacitor as shown in Figure 3. I i n 0 represents the injection current of the machine-side inverter and reflects the operating condition of the PMSG.
From Figure 3, it can be concluded that
ϕ d c ( s ) = U d c P o u t = 1 C U d c 0 s I i n 0
Step 3: Consider the voltage outer loop and current inner loop control, and establish transfer function relationships between U d c and I d , and between U t   Q t and , r e s p e c t i v e l y .
A block diagram for current tracking control can be obtained by combining the control for the current inner loop with the dynamic characteristic of the filtering inductor current, as shown in Figure 4.
For the current inner loop control, there are
I d = K i d p s + K i d i L f s 2 + K i d p s + K i d i I d r e f = G i d ( s ) I d r e f I q = K i q p s + K i q i L f s 2 + K i q p s + K i q i I q r e f = G i q ( s ) I q r e f
where K i d p and K i d i , and K i q p and K i q i correspond to the proportions and integral coefficients for PI control of the D-axis and Q-axis of the current inner loop, respectively.
For the voltage outer loop control, there are
I d r e f = K d c p s + K d c i s U d c U d c r e f = G d c S U d c U d c r e f   I q r e f = K q p s + K q i s U t U t r e f = G q ( S ) ( U t U t r e f )
where K d c p and K d c i , and K q p and K q i are the proportion and integral coefficients for PI control of the D-axis plus Q-axis of the voltage outer loop, respectively.
Step 4: Establish the excitation–response relationship between the terminal voltage and output power for the PMSG subsystem.
The linear expression of the PMSG output active and reactive power is as follows:
P t = P l i n e = I d 0 U t d + I q 0 U t q + U t d 0 I d Q t = Q l i n e = I d 0 U t q I q 0 U t d + U t d 0 I q
The excitation–response relationship between the terminal voltage and output power for the PMSG subsystem can be obtained by combining (2), (5), (6), (7) and (8):
P t Q t = G d s U t θ t = G P U ( s ) G P θ ( s ) G Q U ( s ) G Q θ ( s ) U t θ t
The specific expressions of all elements in the transfer function matrix G d s for the PMSG subsystem are detailed in Appendix A. The GSC of the PMSG contains different energy storage components and controllers with energy storage components as the control target; therefore, each element in G d s is a high-order transfer function. Each element in G d s represents the dynamic characteristic of a single-input single-output system. For G P U ( s ) , G P U ( s ) represents the transfer function where the input and the output are the terminal voltage amplitude and active power of the PMSG, respectively. It reflects the response characteristics of the PMSG’s active power changes caused by changes in the voltage amplitude of the grid-connected bus, mainly related to dc-link capacitor voltage control and D-axis current control.

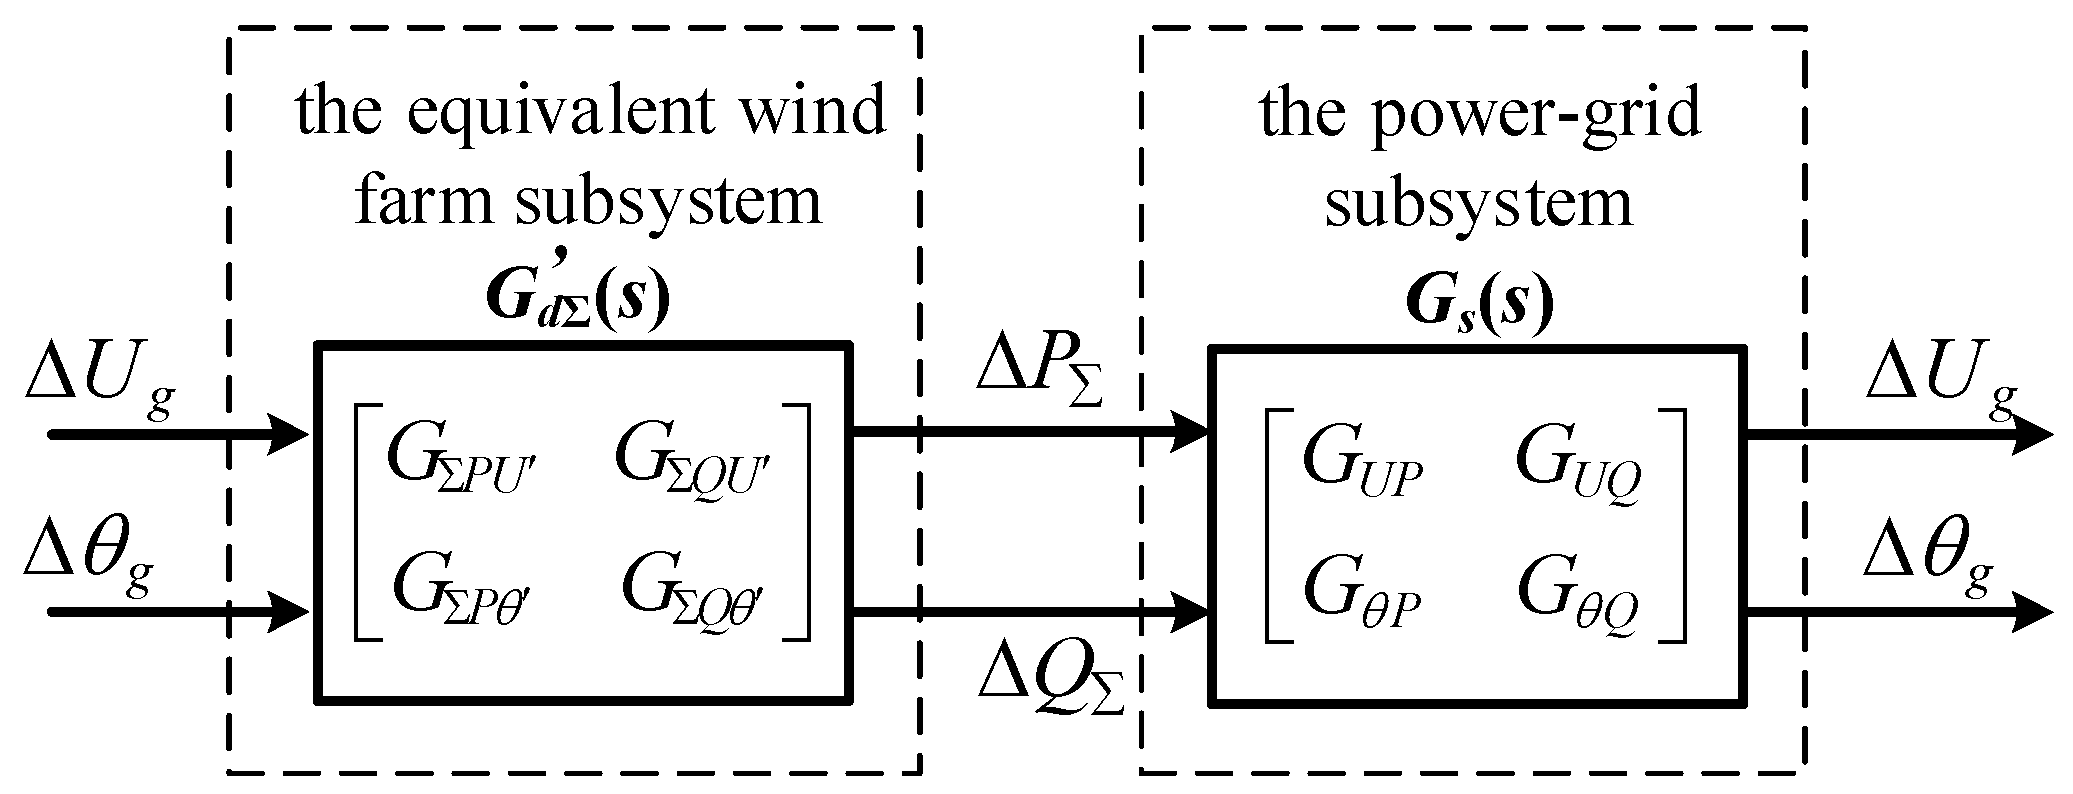
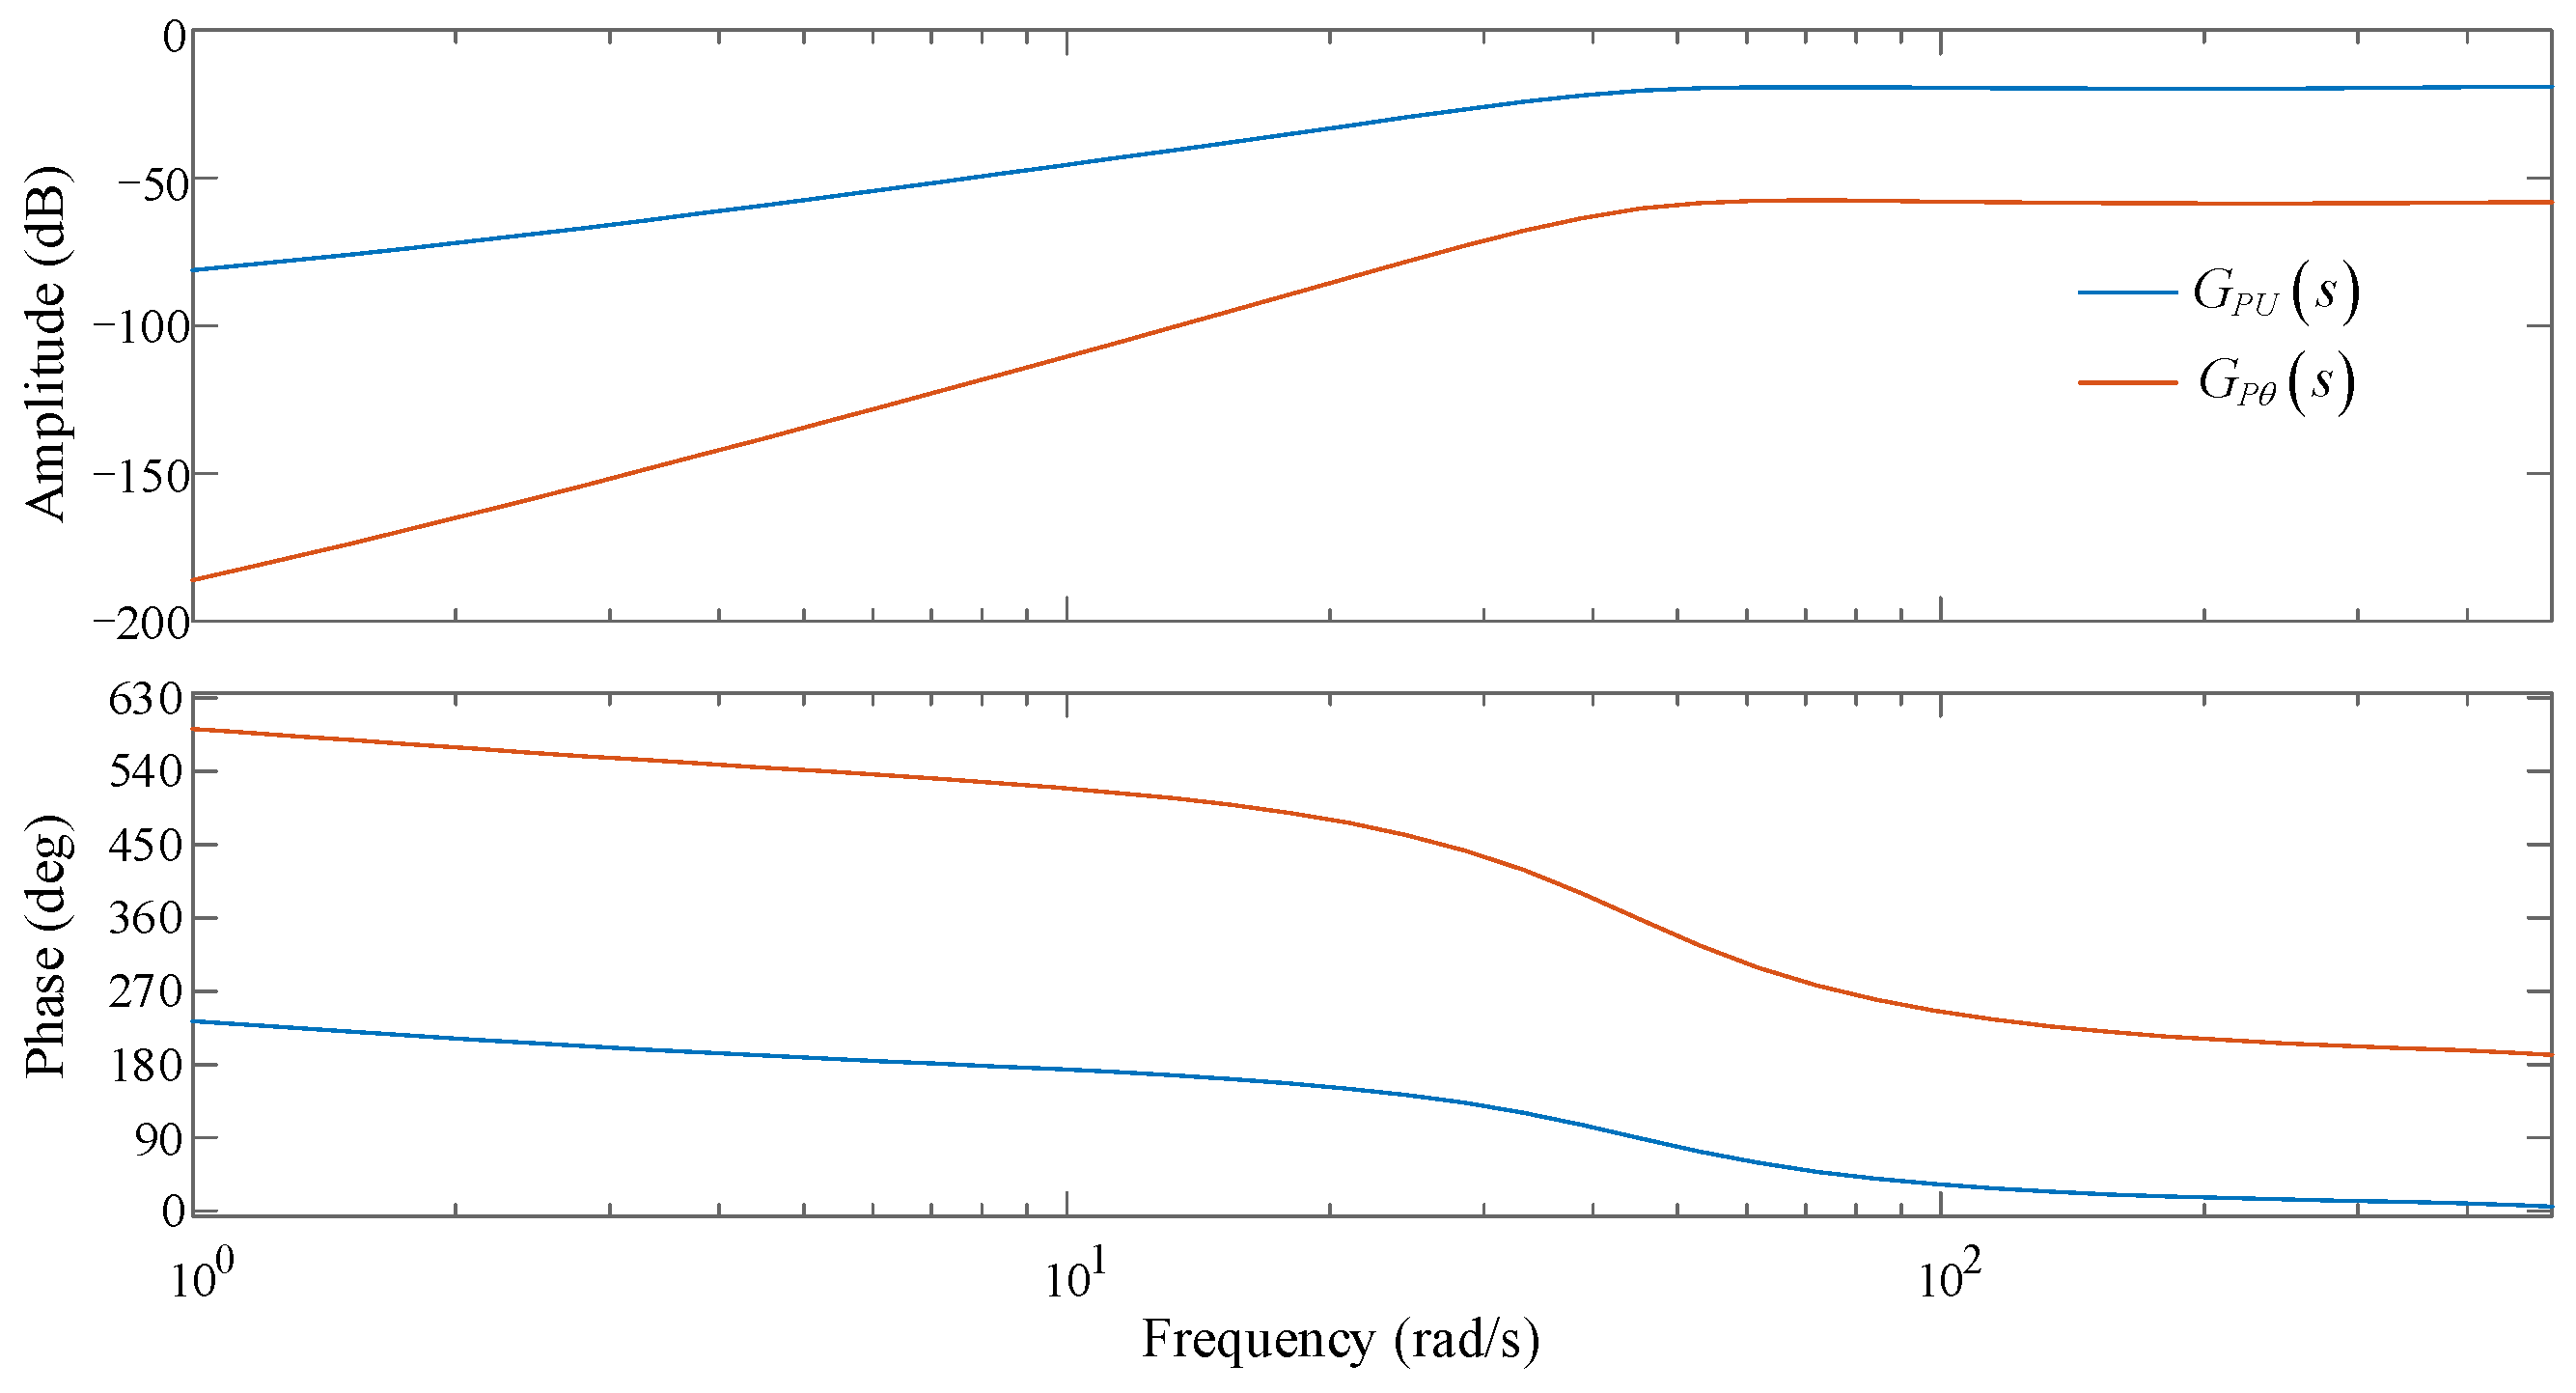
2.2. Model of the Power Grid Subsystem

The power grid subsystem includes the equivalent infinite power grid and equivalent transmission line impedance, ignoring the resistance on the equivalent transmission line. Lg is the equivalent inductance of the equivalent transmission line. The dynamic equation of the equivalent transmission line current in the DQ rotating coordinate system is
U t d U t q = s L ω 0 L g ω 0 L g s L I d I q
where ω 0   =   2 π f 0 is the synchronous rotation speed.
The coefficient matrix in (10) can be inverted to obtain the I d and I q expressions for U t d and U t q :
I d I q = 1 L g ( s 2 + ω 0 2 ) s ω 0 ω 0 s U t d U t q
Combining (11) and (8) leads to
U t θ t = G s s P t Q t = G U P ( s ) G U Q ( s ) G θ P ( s ) G θ Q ( s ) P t Q t
The detailed derivation process and the specific expressions of the elements in G s s are detailed in Appendix A. Each element in the matrix is expressed as a transfer function of the changes in amplitude or phase for the terminal voltage caused by changes in the active and reactive power of the transmission line.

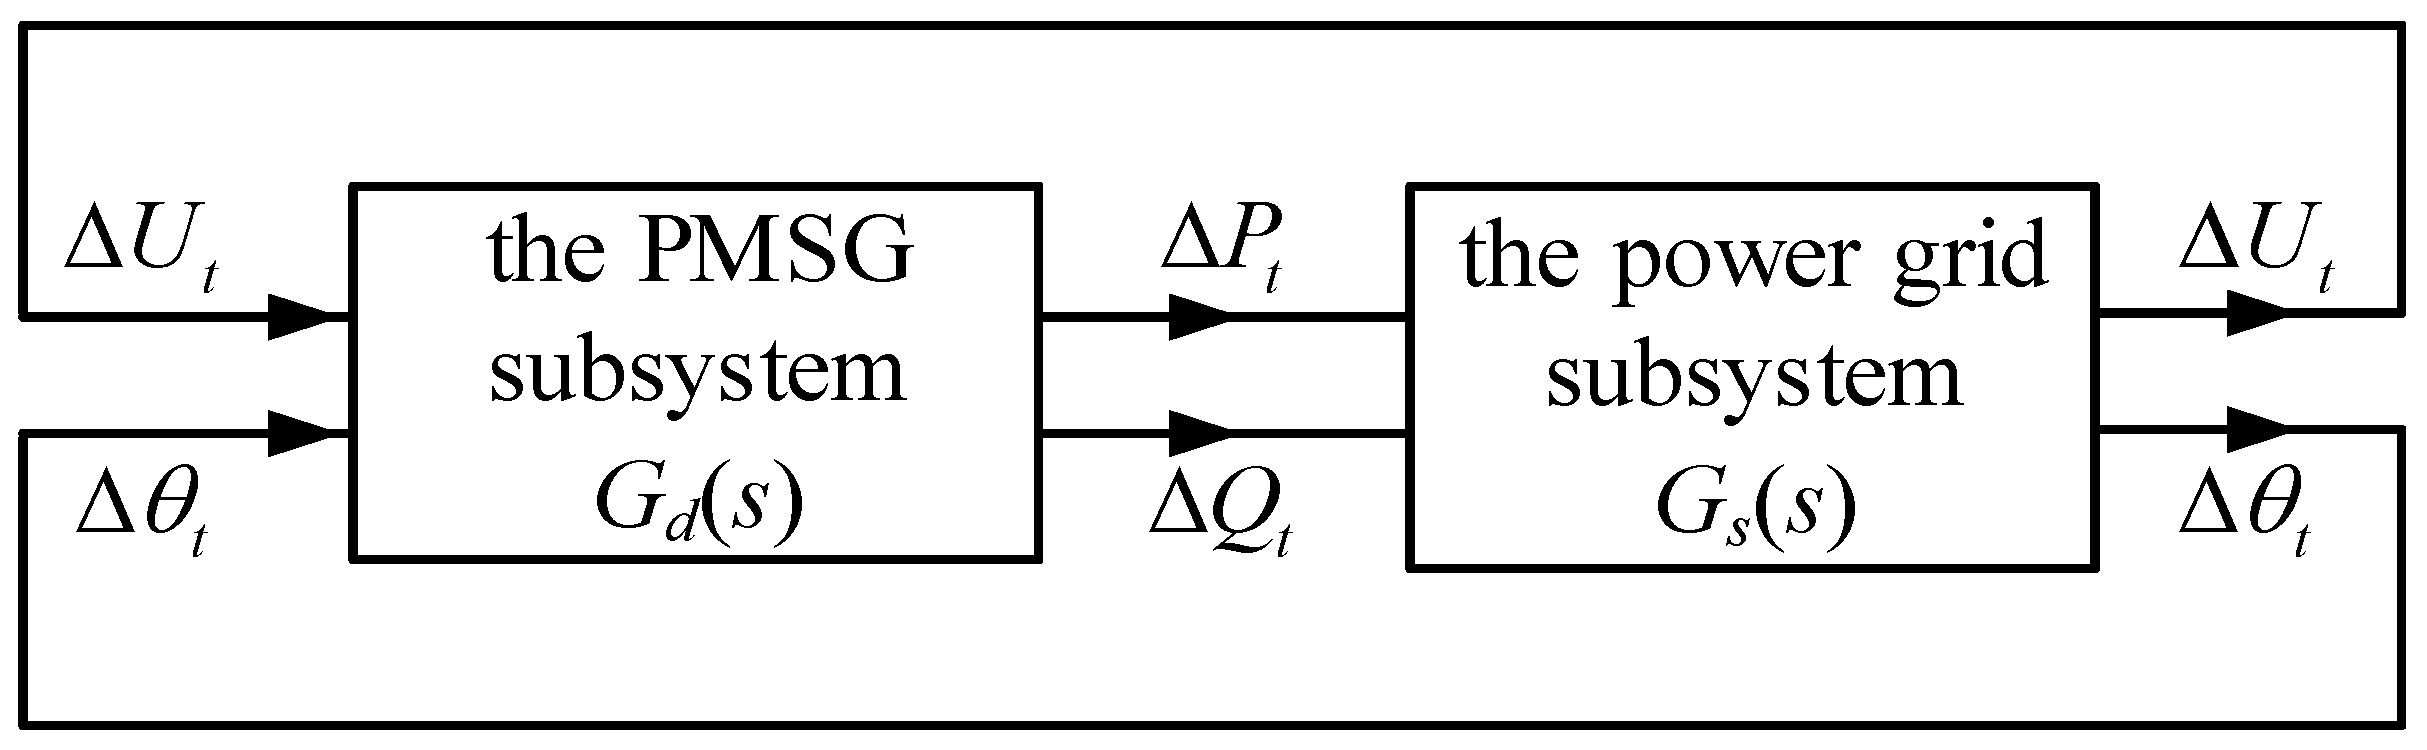
2.3. Model of the Grid-Connected PMSG System

The PMSG dynamic subsystem and the power grid dynamic subsystem can be feedback-connected to form a model of the excitation–response relationship for the grid-connected PMSG system, as shown in Figure 5.
The closed-loop system can be decomposed into two interconnected dynamic open-loop subsystems, the power grid and the PMSG, which makes it easier to analyze their interaction. The interface variables between the subsystems are P t , Q t , U t and θ t , which can better reflect the external characteristics of the PMSG.
Unlike the modeling method based on the perspective of the controllers of the PMSG for the amplitude–phase motion equation modeling method [25,26], this paper takes the power grid as the perspective, and based on the power source properties of the PMSG, directly describes the dynamic characteristics of the PMSG using an excitation–response relationship model [27].

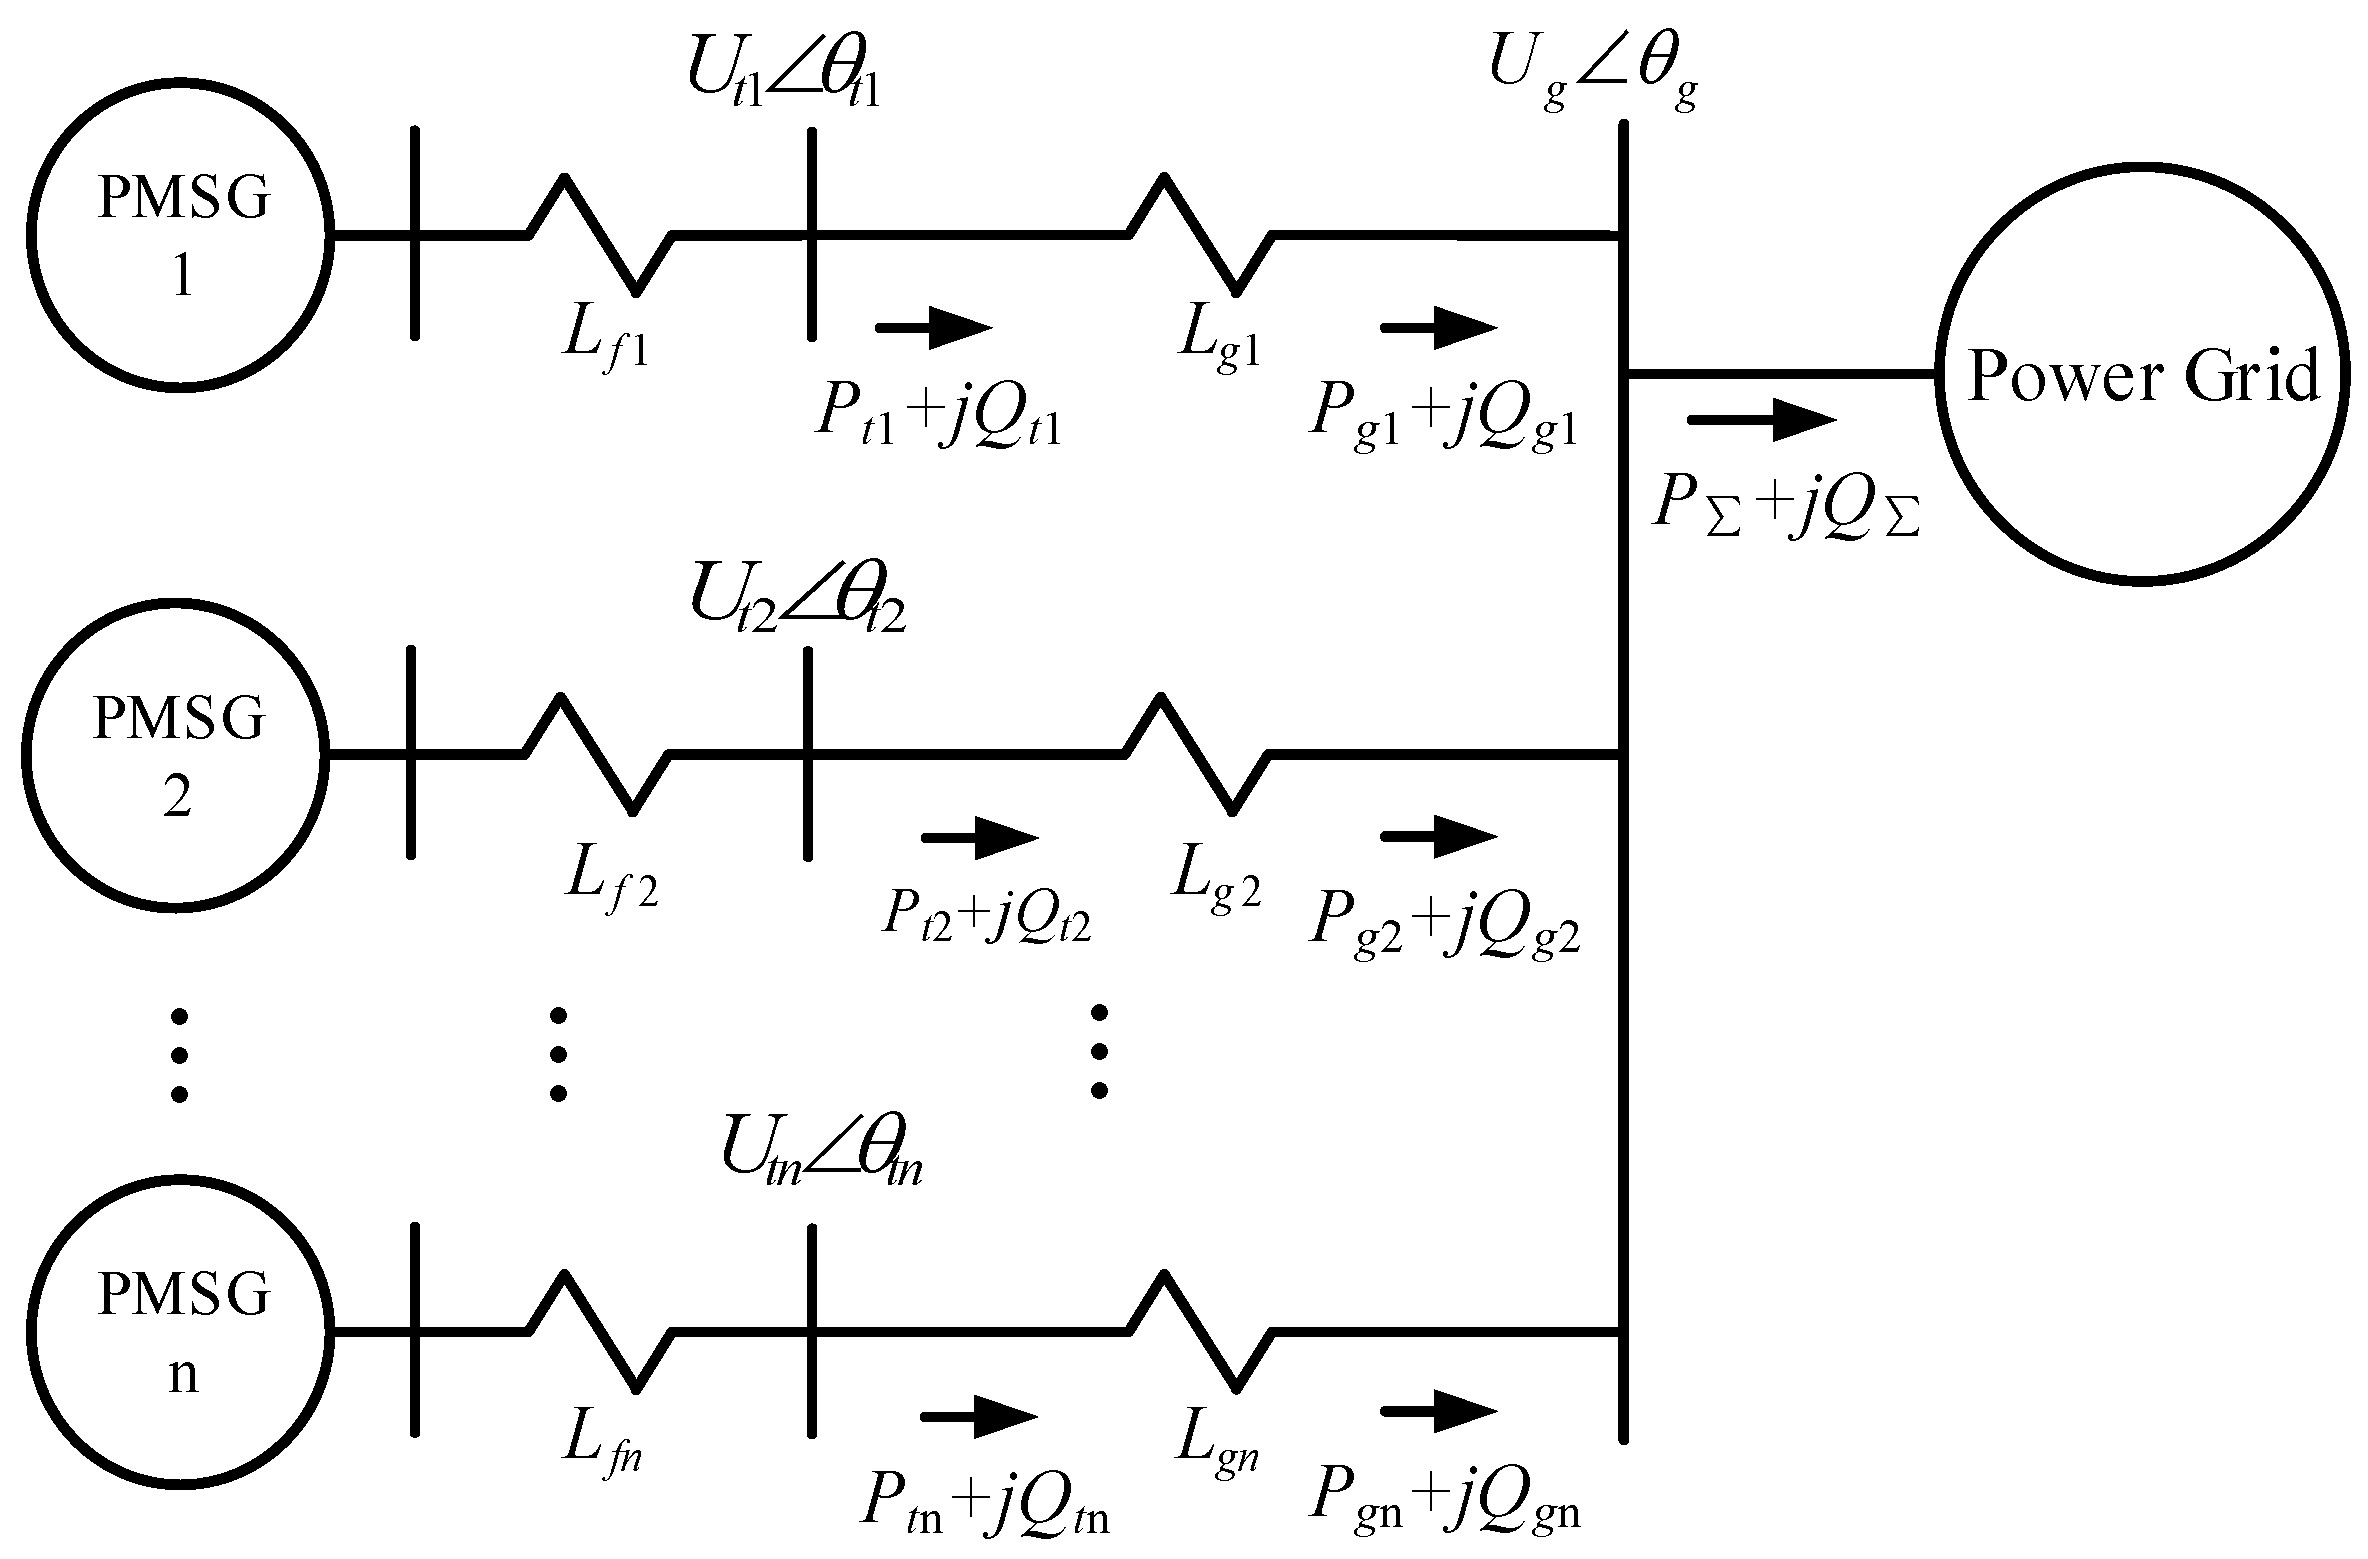
3. Excitation–Response Relationship between the Voltage U g / θ g and the Output Power P g / Q g at the Convergence Busbar for the PMSGs

PMSGs form wind farms by collecting power lines, which are the collection and transmission channels for PMSG-generated power. A small-signal model can be constructed for the excitation–response relationship between the voltage U g / θ g and output power P g / Q g at the convergence busbar for each PMSG based on the single-machine model of the excitation–response relationship.
The collecting power line has a small impedance compared to the reactances of the booster transformer for wind farms and wind power transmission lines. If the resistance loss of the collecting power line is ignored, then P t = P g and the expression for the active power transmitted by the collector line can be linearized to
P g = U t 0 U g X g sin ( θ t 0 θ g 0 ) + U g 0 U t X g 1 sin θ t 0 θ g 0 + U g 0 U t 0 X g cos θ t 0 θ g 0 θ t θ g
The reactance of the collecting power line is generally small. So, k c = cos θ t 0 θ g 0 = 1 , and k s = sin θ t 0 θ g 0 is small and can be ignored, resulting in the following expression for the phase of the terminal voltage for the PMSG:
θ t = θ g + X g U g 0 U t 0 P g
The second part of (14) reflects the influence of length for the collecting power line on the PMSG in terms of the phase of its terminal voltage.
The expression for the reactive power transmitted by the collecting power line can be linearized to
Q g = U t 0 cos ( θ t 0 θ g 0 ) X g U g + U g 0 cos θ t 0 θ g 0 X g 1 U t U g 0 U t 0 X g sin θ t 0 θ g 0 θ t θ g 2 U g 0 X g U g
Then, the amplitude of the terminal voltage for the PMSG is expressed as
U t = 2 U g 0 U t 0 U g 0 U g + X g U g 0 Q g
The second part of (16) reflects the effect of length for the collecting power line on the PMSG in terms of the amplitude of its terminal voltage.
The relationship between Q t and Q g for the PMSG can be expressed as
Q t Q g = 2 U t 0 U g 0 cos ( θ t 0 θ g 0 ) U g 0 cos ( θ t 0 θ g 0 )
(14), (16) and (17) can be substituted into (9):
P g Q g = G d s U g θ g = G P U ( s ) G P θ ( s ) G Q U ( s ) G Q θ ( s ) U g θ g
Considering the influence of the length of the collecting power line, (18) is a small-signal model of the excitation–response relationship between the output power P g / Q g and voltage U g / θ g at the convergence busbar for the PMSG and can be used as the theoretical basis for calculating the equivalence of a direct-driven wind farm. The specific expression of each element of the transfer function matrix G d s is described in Appendix A.

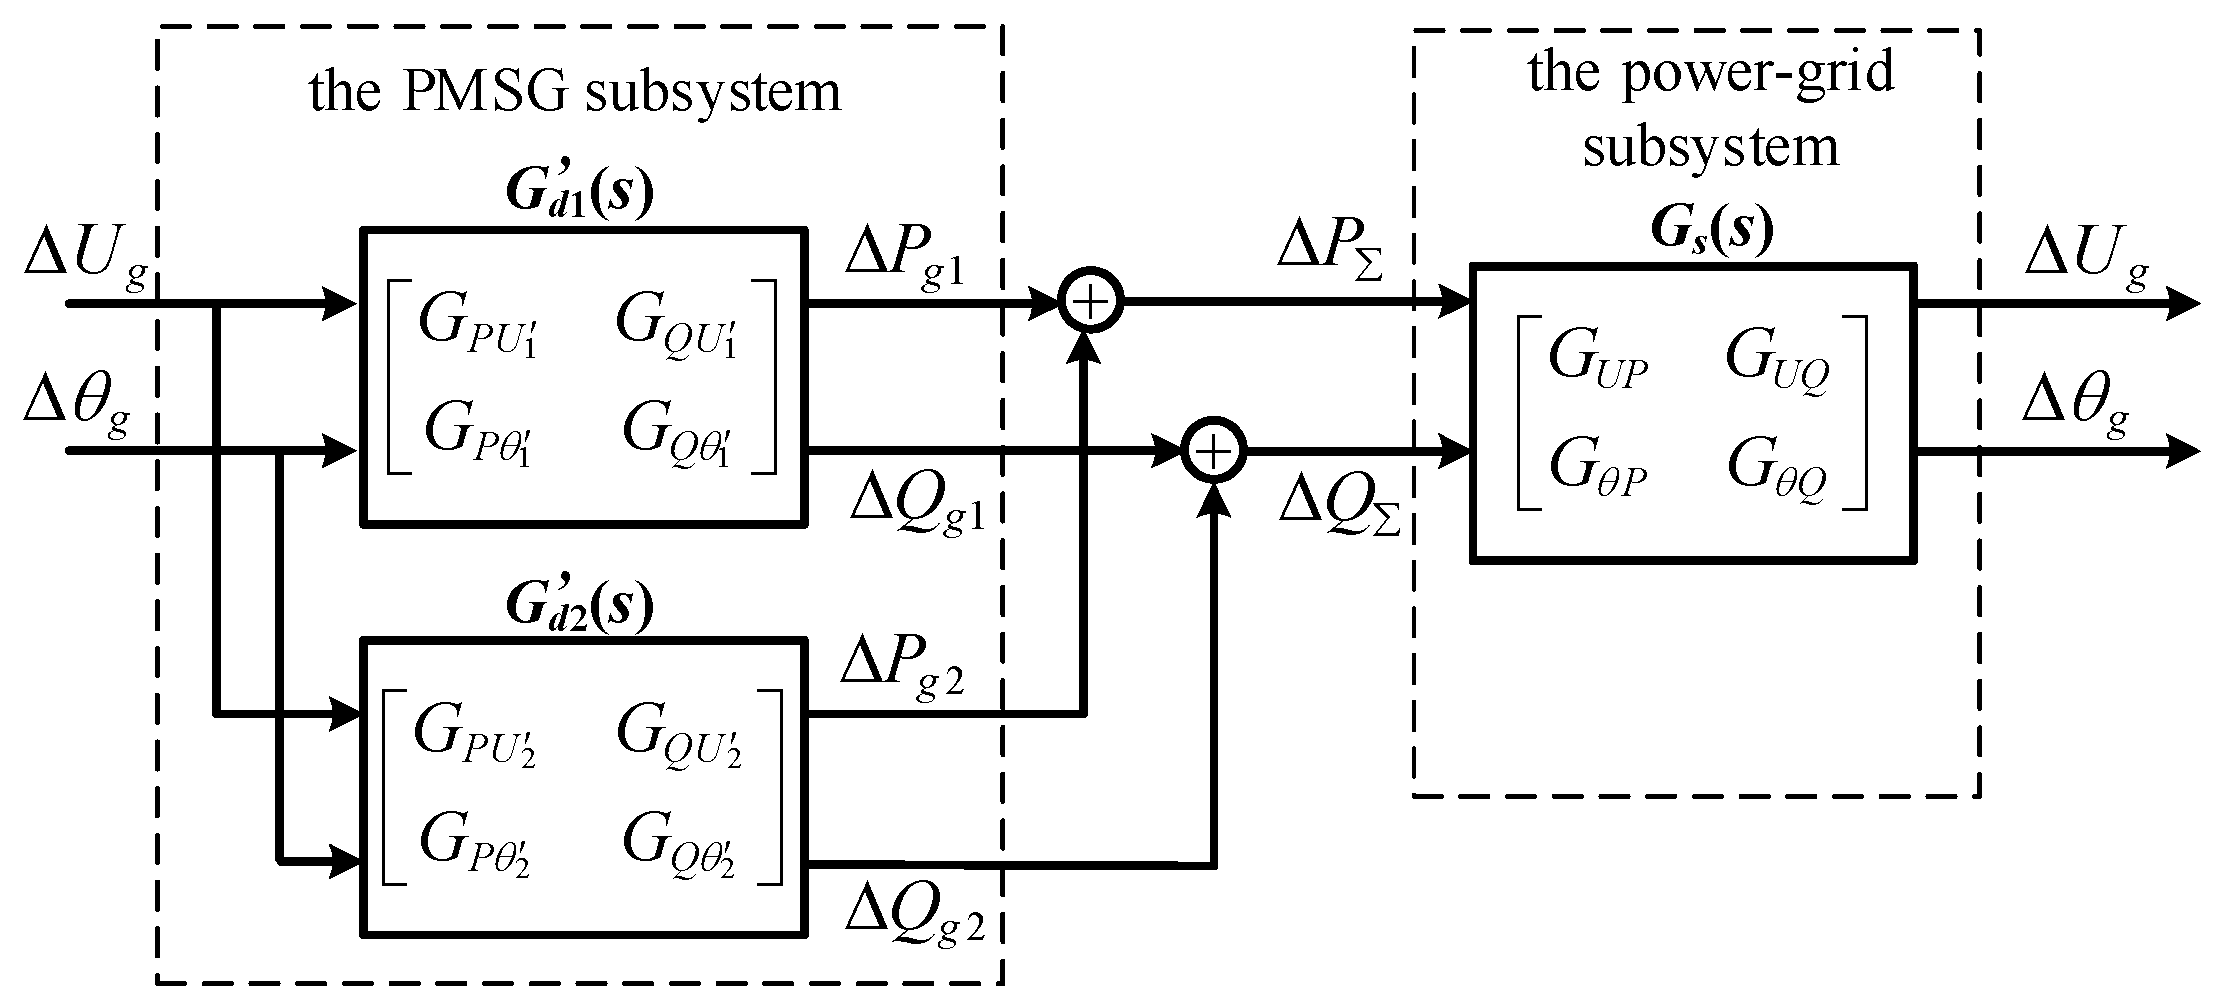
4. Aggregation Equivalence for Direct-Driven Wind Farms Based on the Excitation–Response Relationship

A direct-drive wind farm is composed of n direct-drive PMSGs (radial connection) (Figure 6). These n PMSGs are connected to the same busbar through the collecting power line (the voltage of the convergence busbar is U g     θ g ). Considering the parallel relationship of n PMSGs, the output power P Σ and Q Σ of the wind farm are the total output power of n PMSGs.
Taking two PMSGs ( n = 2 ) to form the direct-drive wind farm through the aggregation of collecting power lines as an example, a simplified explanation of the proposed aggregation method is provided.
According to (18), the excitation–response relationship between the voltage U g / θ g and the output power P g / Q g at the convergence busbar for two PMSGs is
P g 1 Q g 1 = G 1 P U ( s ) G 1 P θ ( s ) G 1 Q U ( s ) G 1 Q θ ( s ) U g θ g
P g 2 Q g 2 = G 2 P U ( s ) G 2 P θ ( s ) G 2 Q U ( s ) G 2 Q θ ( s ) U g θ g
The voltage/output power excitation–response relationship for two direct-drive PMSGs connected by collecting power lines is shown in Figure 7. When a small disturbance occurs in the power grid, the input variables of any PMSG are U g and θ g . Additionally, the total power changes P Σ and Q Σ of the wind farm are the sum of the power changes of two PMSGs.
Combining (19) and (20) leads to
P g Σ Q g Σ = P g 1 + P g 2 Q g 1 + Q g 2 = G 1 P U ( s ) G 1 P θ ( s ) G 1 Q U ( s ) G 1 Q θ ( s ) + G 2 P U ( s ) G 2 P θ ( s ) G 2 Q U ( s ) G 2 Q θ ( s ) U g θ g
and
P g Σ Q g Σ = G d Σ s U g θ g = G Σ P U ( s ) G Σ P θ ( s ) G Σ Q U ( s ) G Σ Q θ ( s ) U g θ g
where
G d Σ s = G 1 P U s + G 2 P U s G 1 P θ s + G 2 P θ s G 1 Q U s + G 2 Q U s G 1 Q θ s + G 2 Q θ s
The relationship in (22) represents the excitation–response relationship between the voltage and the output power of the direct-driven wind farm and G d Σ s is the equivalent transfer function matrix for the direct-driven wind farm. The voltage/output power excitation–response relationship after equivalence is shown in Figure 8.
Based on the excitation–response relationship, the aggregation equivalence method for direct-driven PMSGs takes into account the length of collecting power lines and the operating conditions of the PMSGs and realizes aggregation through the addition operation of the transfer function matrix of PMSGs. The method has clear physical significance and is easy to understand. This aggregation method is also applicable to wind farms with a chain connection, as shown in Figure 9.

5. Model Verification and Analysis

The MATLAB/SIMLINK simulation platform was used to construct the grid-connected PMSG model and the grid-connected wind farm model. These were used to undertake a simulation analysis to confirm the precision of the excitation–response relationship model for the PMSG and the effectiveness of the wind farm aggregation model. Table A1 lists the model parameters for the PMSG.

5.1. Verification and Analysis of the Grid-Connected PMSG Model Based on the Excitation–Response Relationship

The eigenvalues of the small-signal model based on the excitation–response relationship and the eigenvalues of the state-space equation model [17,28,29] are compared to validate the proposed model for accuracy. Table 1 shows the eigenvalue analysis results for the two analysis methods.
Table 1 shows that the eigenvalues of the small-signal model of the grid-connected PMSG based on the excitation–response relationship are highly consistent with those of the state-space equation model.
When t = 5 s, the dc-link voltage reference value U d c r e f fluctuates by 1% (from 1200 V to 1212 V). The comparison of the active power curves between the grid-connected PMSG model based on the excitation–response relationship and the time-domain simulation model is shown in Figure 10. The active power response curve for the grid-connected PMSG model based on the excitation–response relationship is highly consistent with the time-domain simulation model, which means that it is highly accurate.
A comparative analysis of the eigenvalues and the disturbance response curves was conducted to demonstrate the precision of the small-signal model of the grid-connected PMSG based on the excitation–response relationship.
As can be seen from Table 1, the grid-connected PMSG system model is of the ninth order and includes four pairs of complex-conjugated eigenvalues. The eigenvalues for λ1,2 and λ3,4 are mainly related to the GSC’s active and reactive power control. The eigenvalues for λ5,6 primarily have correlations with the dc-link voltage control and the eigenvalues for λ7,8 are mainly related to the PLL control. Compared with the eigenvalues λ5,6 and λ7,8, the oscillation frequency and attenuation speed of eigenvalues λ1,2 and λ3,4 are much faster. Therefore, λ5,6 and λ7,8 have a significant impact on the dynamic of the direct-driven wind power grid-connected system and are the dominant oscillation modes.
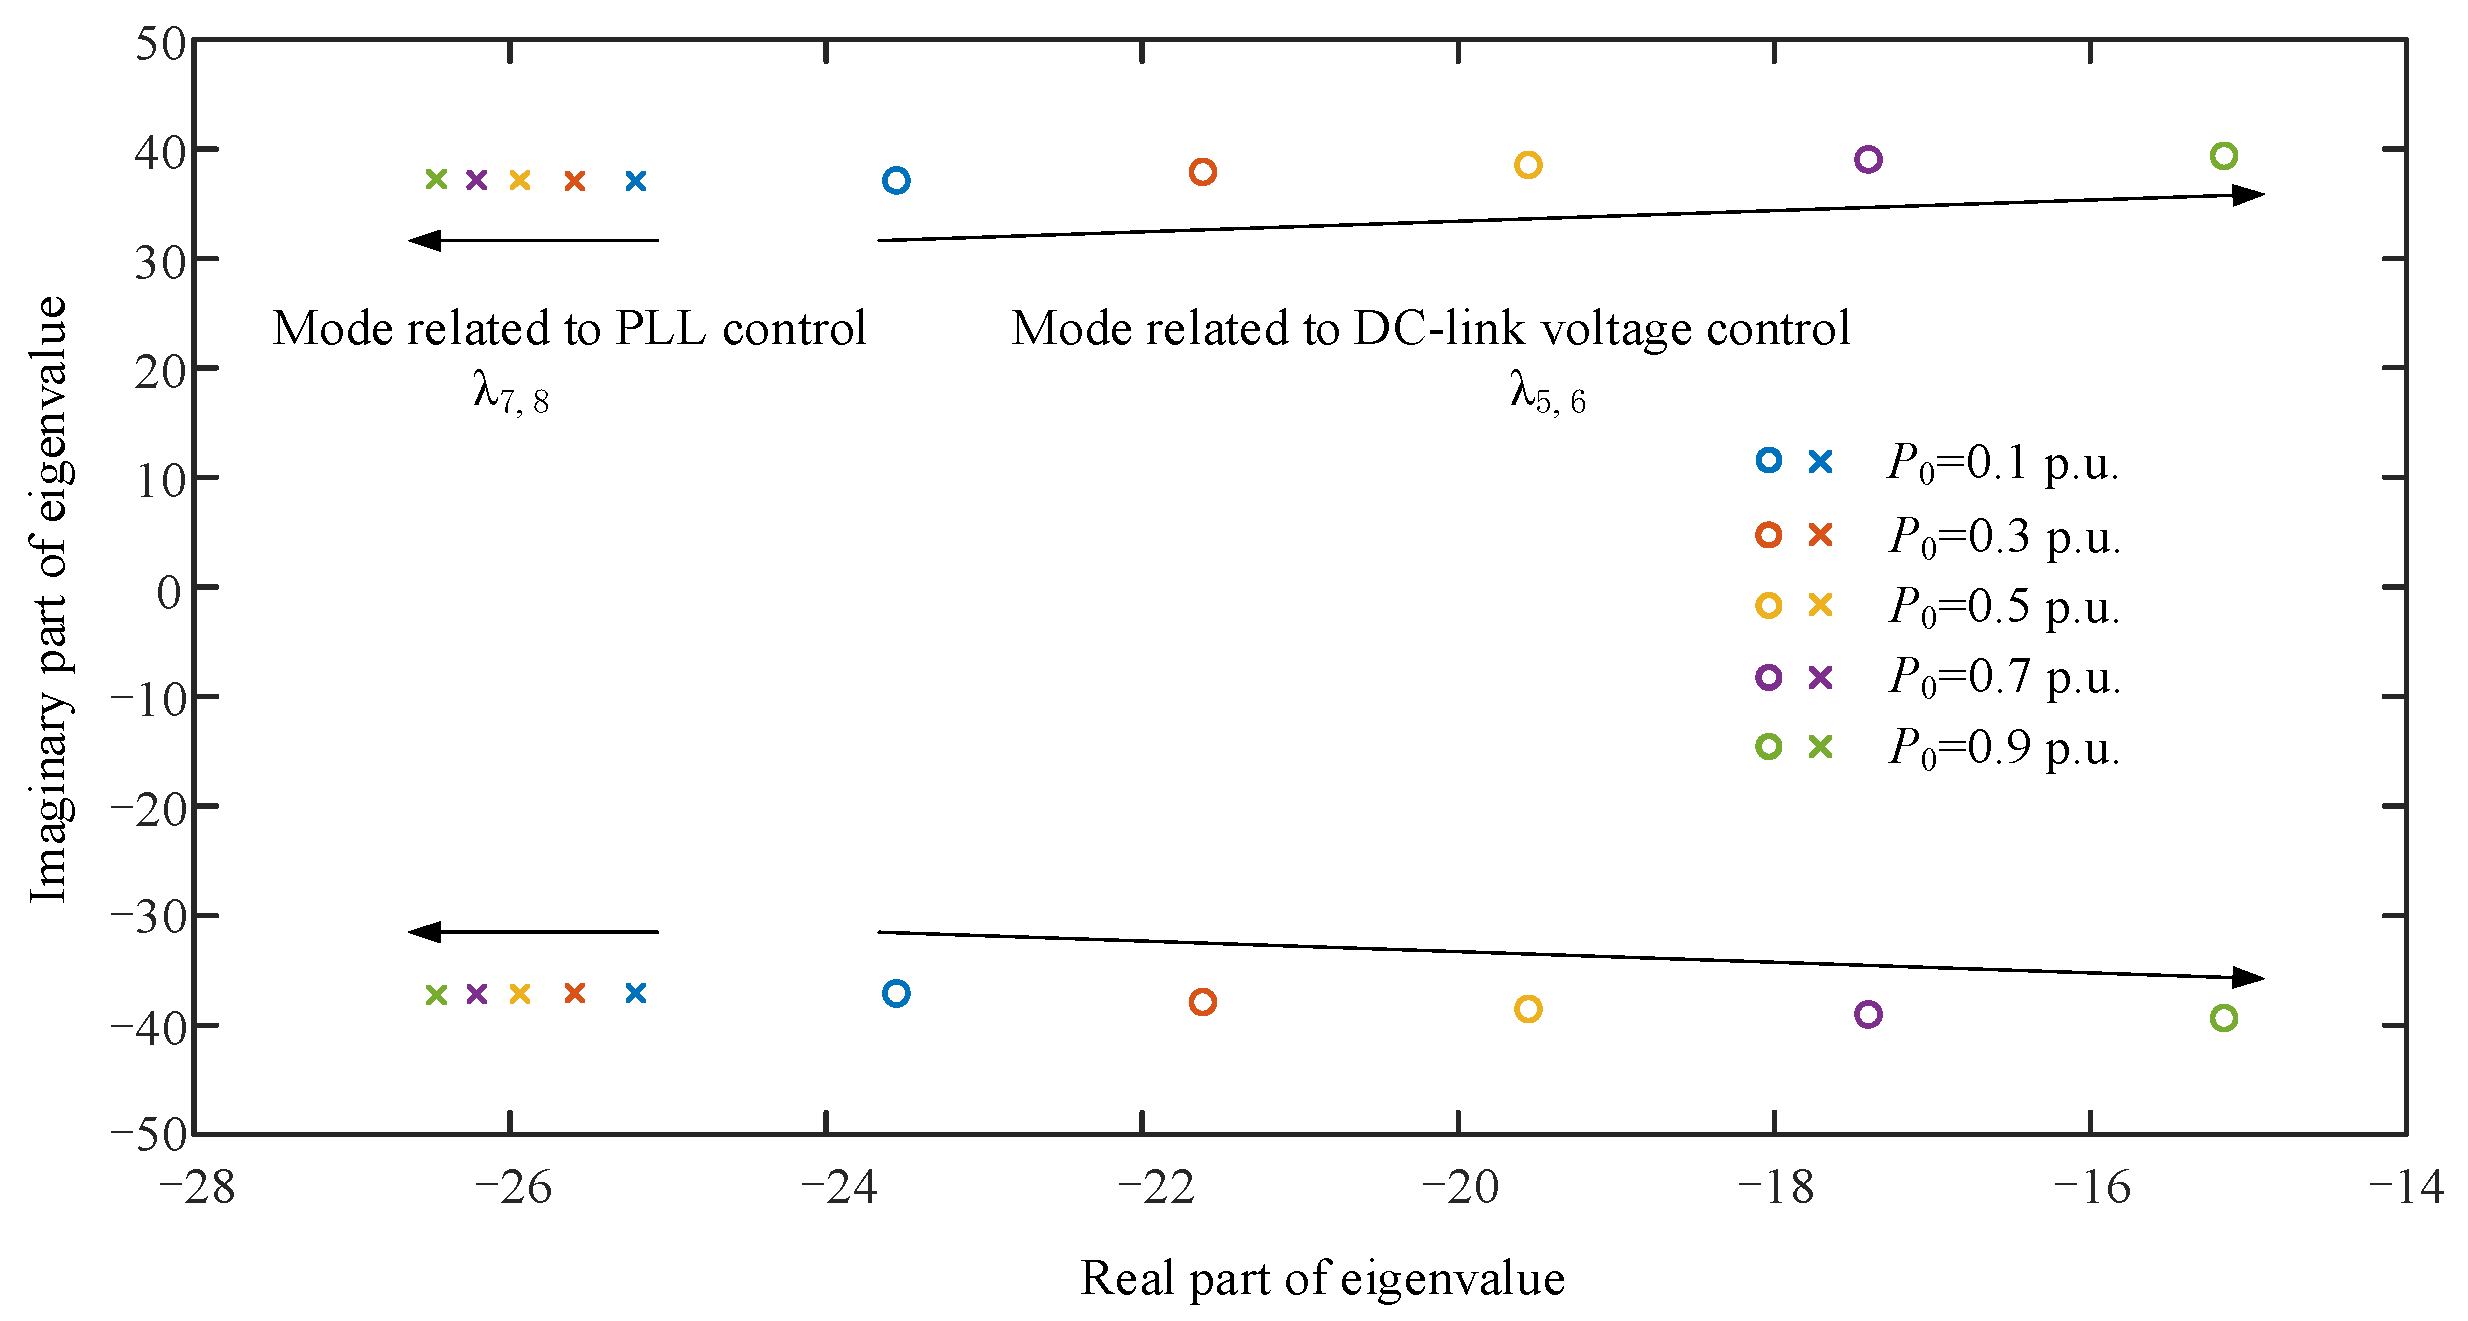
  • Effect of operating conditions on the dominant oscillation modes
The influence of operating conditions on the dominant oscillation modes for the grid-connected PMSG system was investigated. As shown in Figure 11, changing the operating conditions mainly affects mode λ5,6, which is related to the dc-link voltage control. When the operating conditions increase, the real part of λ5,6 moves along the real axis in a positive direction and the stability decreases. Changing the operating conditions has little influence on mode λ7,8, which is related to the PLL control. When the operating conditions increase, the real part of λ7,8 tends to move along the real axis in a negative direction and the stability increases.
2.
Influence of power grid strengths on the dominant oscillation modes
The influence of power grid strengths on the dominant oscillation modes for the grid-connected PMSG system was investigated. The short-circuit ratio (SCR) was calculated to determine the power grid strength, with SCR < 3 denoting a weak AC power system [30]. As shown in Figure 12, with the decrease in power grid strength, both mode λ5,6 related to dc-link voltage control and mode λ7,8 related to PLL control have a trend of moving the real part of their eigenvalues towards the positive direction of the real axis, and the stability decreased.

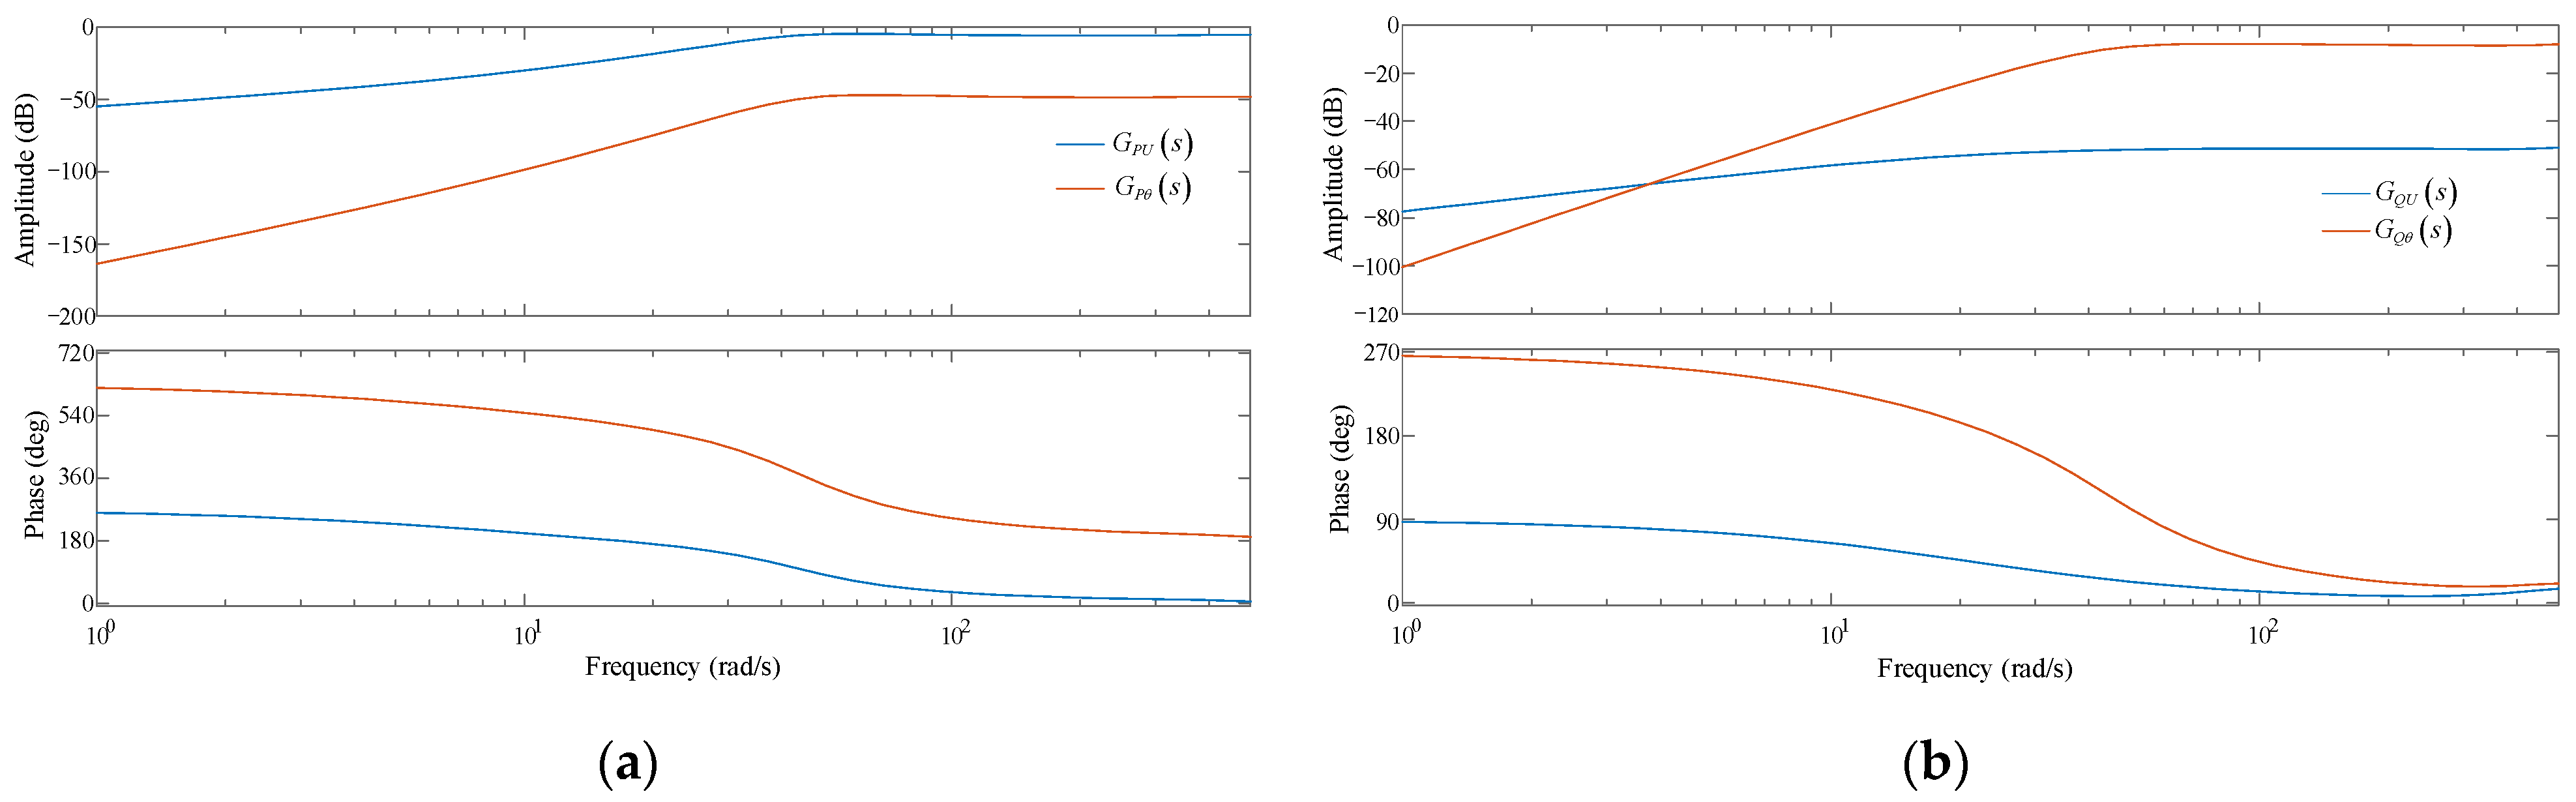
5.2. Active and Reactive Power Response Characteristics of Direct-Driven PMSG

Subsynchronous oscillation can occur when PMSGs are connected to a weak AC power grid [30]. During the subsynchronous oscillation process, the amplitude and phase of the voltage for the grid-connected busbar of the PMSG show sinusoidal oscillations with the same frequency [31]. For the PMSG, the occurrence of subsynchronous oscillation in the power grid is equivalent to applying a sine excitation signal to the PMSG. Through the action of the controller, the power response characteristics of the PMSG can reflect the effect of the PMSG on the power grid [32,33].
Using the small-signal model of the grid-connected PMSG based on the excitation–response relationship, the PMSG was set to operate under various operating conditions, and the responses of active power under sinusoidal excitation were observed. G P θ j ω and G P U j ω were calculated and compared. Figure 13 shows the Bode diagrams for G P U s and G P θ s when the PMSG was running under the low operating condition (P0 = 0.1 p.u.).
Figure 13 shows that in the subsynchronous/supersynchronous frequency range, G P U j ω and G P θ j ω have a difference of more than 40 dB and G P U j ω is larger than G P θ j ω . This indicates that the active response characteristic of the PMSG caused by the change in the amplitude of the grid-connected busbar voltage is much greater than that caused by the change in the phase of the grid-connected busbar voltage. This phenomenon is opposite to the operating characteristic of the power grid, where the distribution of active power is mainly affected by the phase angle of node voltage. The reason is that the grid-side converter of the PMSG implements the control strategy of active and reactive approximate decoupling [34,35]. The D-axis current and Q-axis current control the output of active and reactive power, I d 0 I q 0 . The variation in active power P t for PMSG mainly depends on the part related to the active current ( I d 0 U t d ). The PMSG adopts a D-axis-oriented control strategy [36,37] and the change in voltage amplitude for the grid-connected busbar plays a leading and decisive role in U t d . Therefore, the active response characteristic of PMSG is primarily influenced by the voltage amplitude of the grid-connected busbar.
As the PMSG was set to operate under various operating conditions, the responses of reactive power under sinusoidal excitation were observed and G Q θ j ω and G Q U j ω were calculated and compared. Figure 14 shows the Bode diagrams for G Q U s and G Q θ s when the PMSG was running under the low operating condition (P0 = 0.1 p.u.).
Figure 14 shows that in the subsynchronous frequency range, G Q θ j ω and G Q U j ω have a difference of more than 20 dB and G Q θ j ω is larger than G Q U j ω . This indicates that the reactive power response characteristic of the PMSG caused by the change in the phase of the grid-connected busbar voltage is much greater than that caused by the change in the amplitude of the grid-connected busbar voltage. This phenomenon is contrary to the operating characteristic of the power grid, where the amplitude of the node voltage has a major impact on the reactive power distribution. The reason for this is that the PMSG generates a much larger active current than reactive current, that is, I d 0 I q 0 . The variation in reactive power Q t for the PMSG mainly depends on the part related to the active current ( I d 0 U t q ). The PMSG adopts a D-axis-oriented control strategy and U t q is chiefly dependent on the change in the voltage phase in the grid-connected busbar. Therefore, the reactive response characteristic of the PMSG largely depends on the voltage phase of the grid-connected busbar.
The same conclusion can be reached for the high operating condition. See Appendix C for the Bode diagram. The analysis of the response characteristics of active and reactive power of the PMSG lays the foundation for simplifying the grid-connected PMSG model.

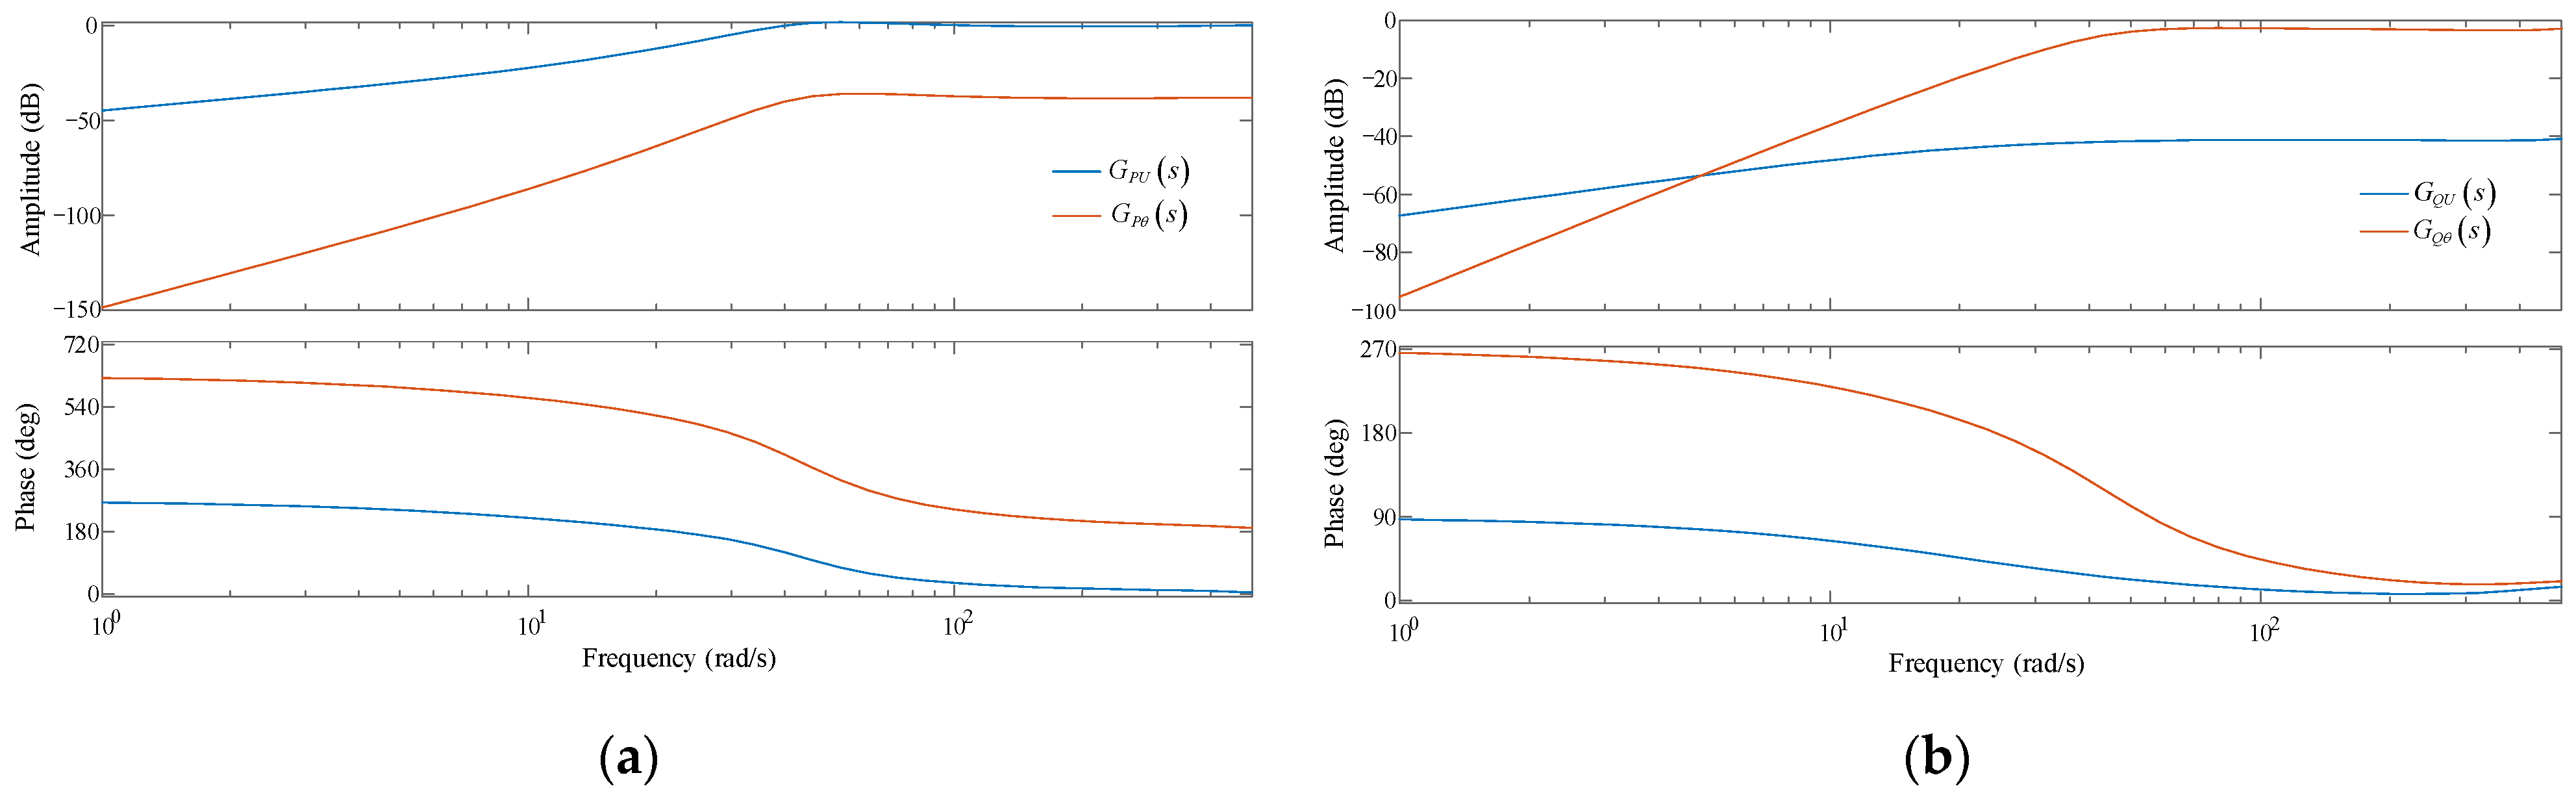
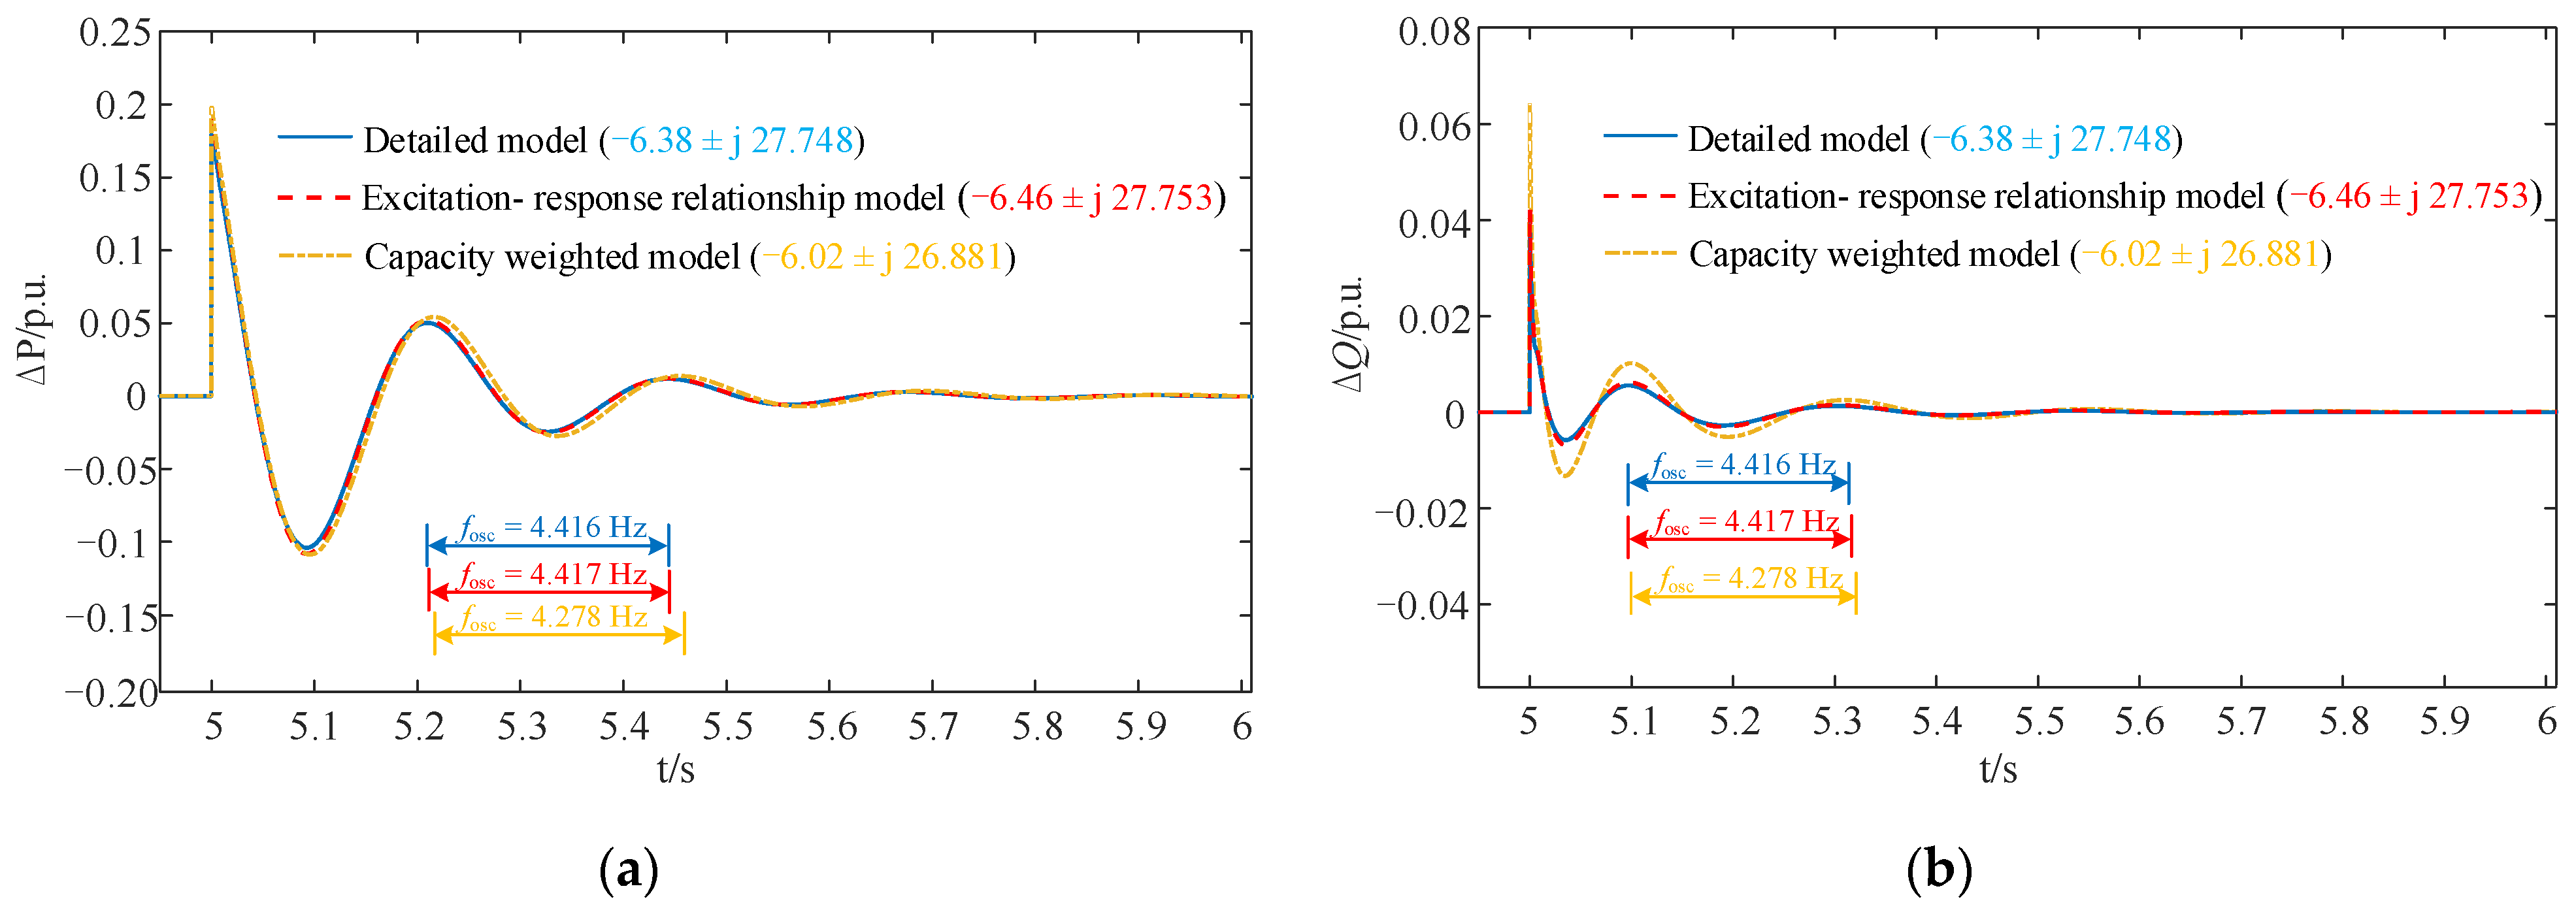
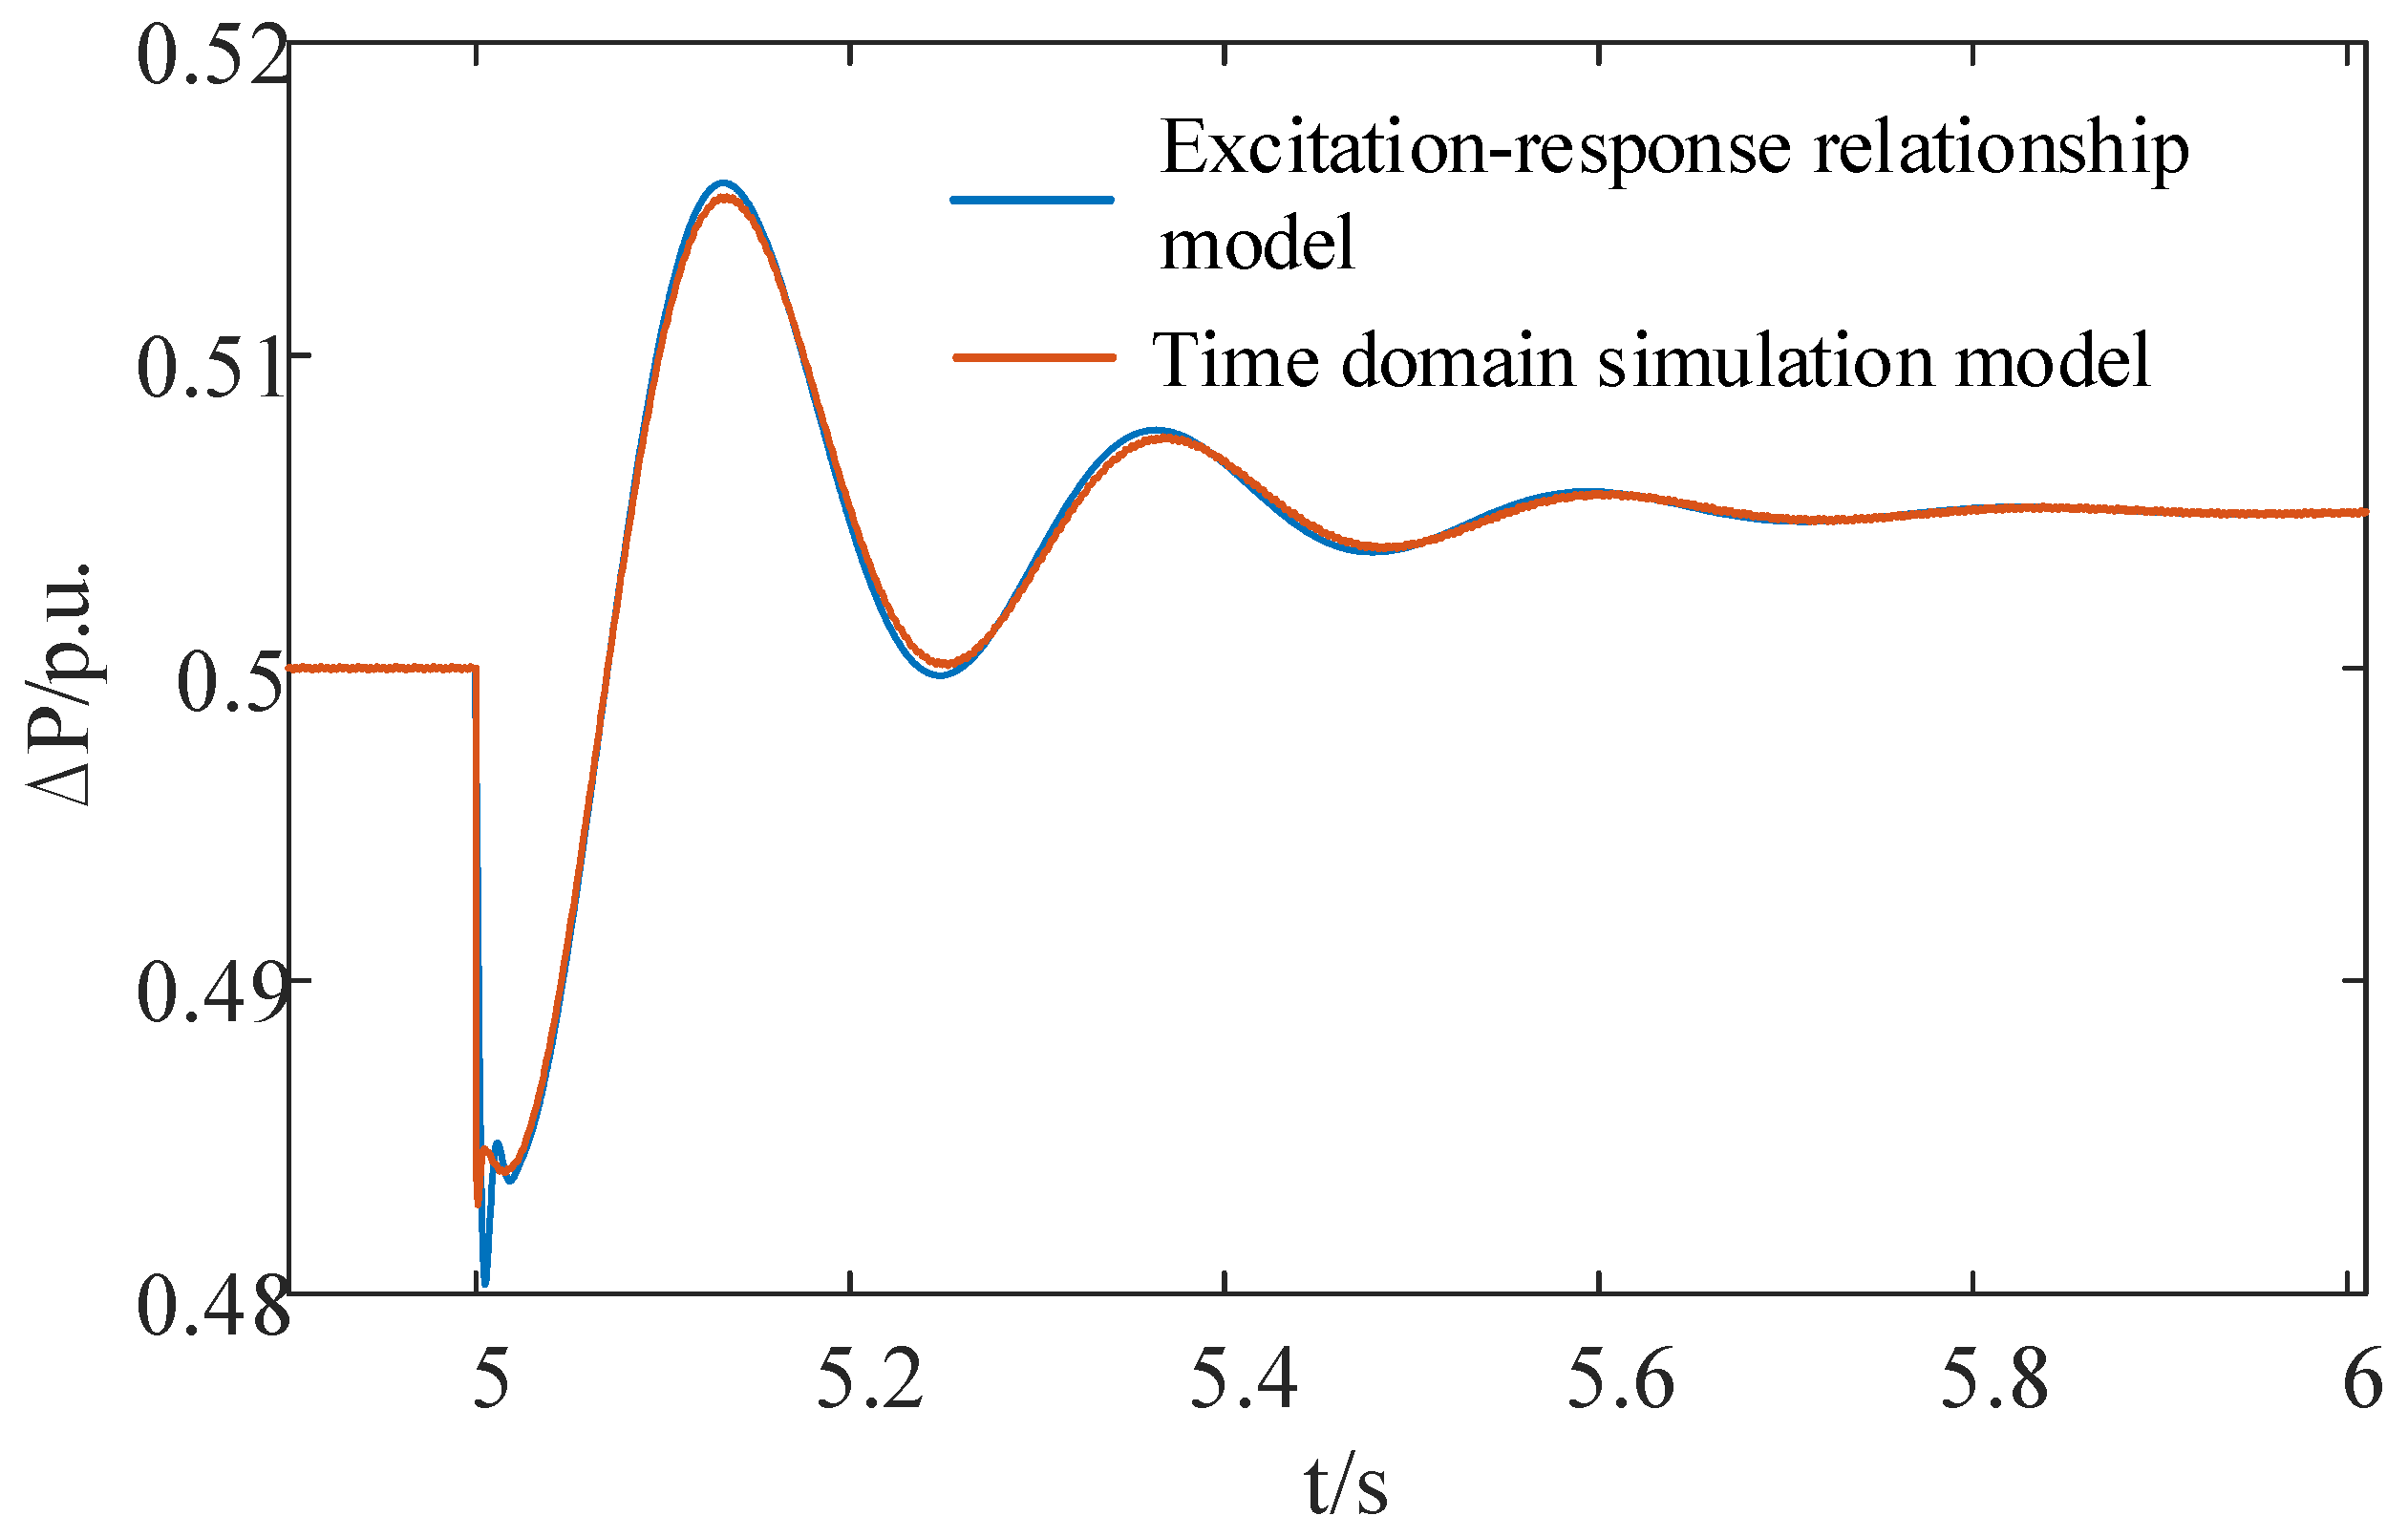
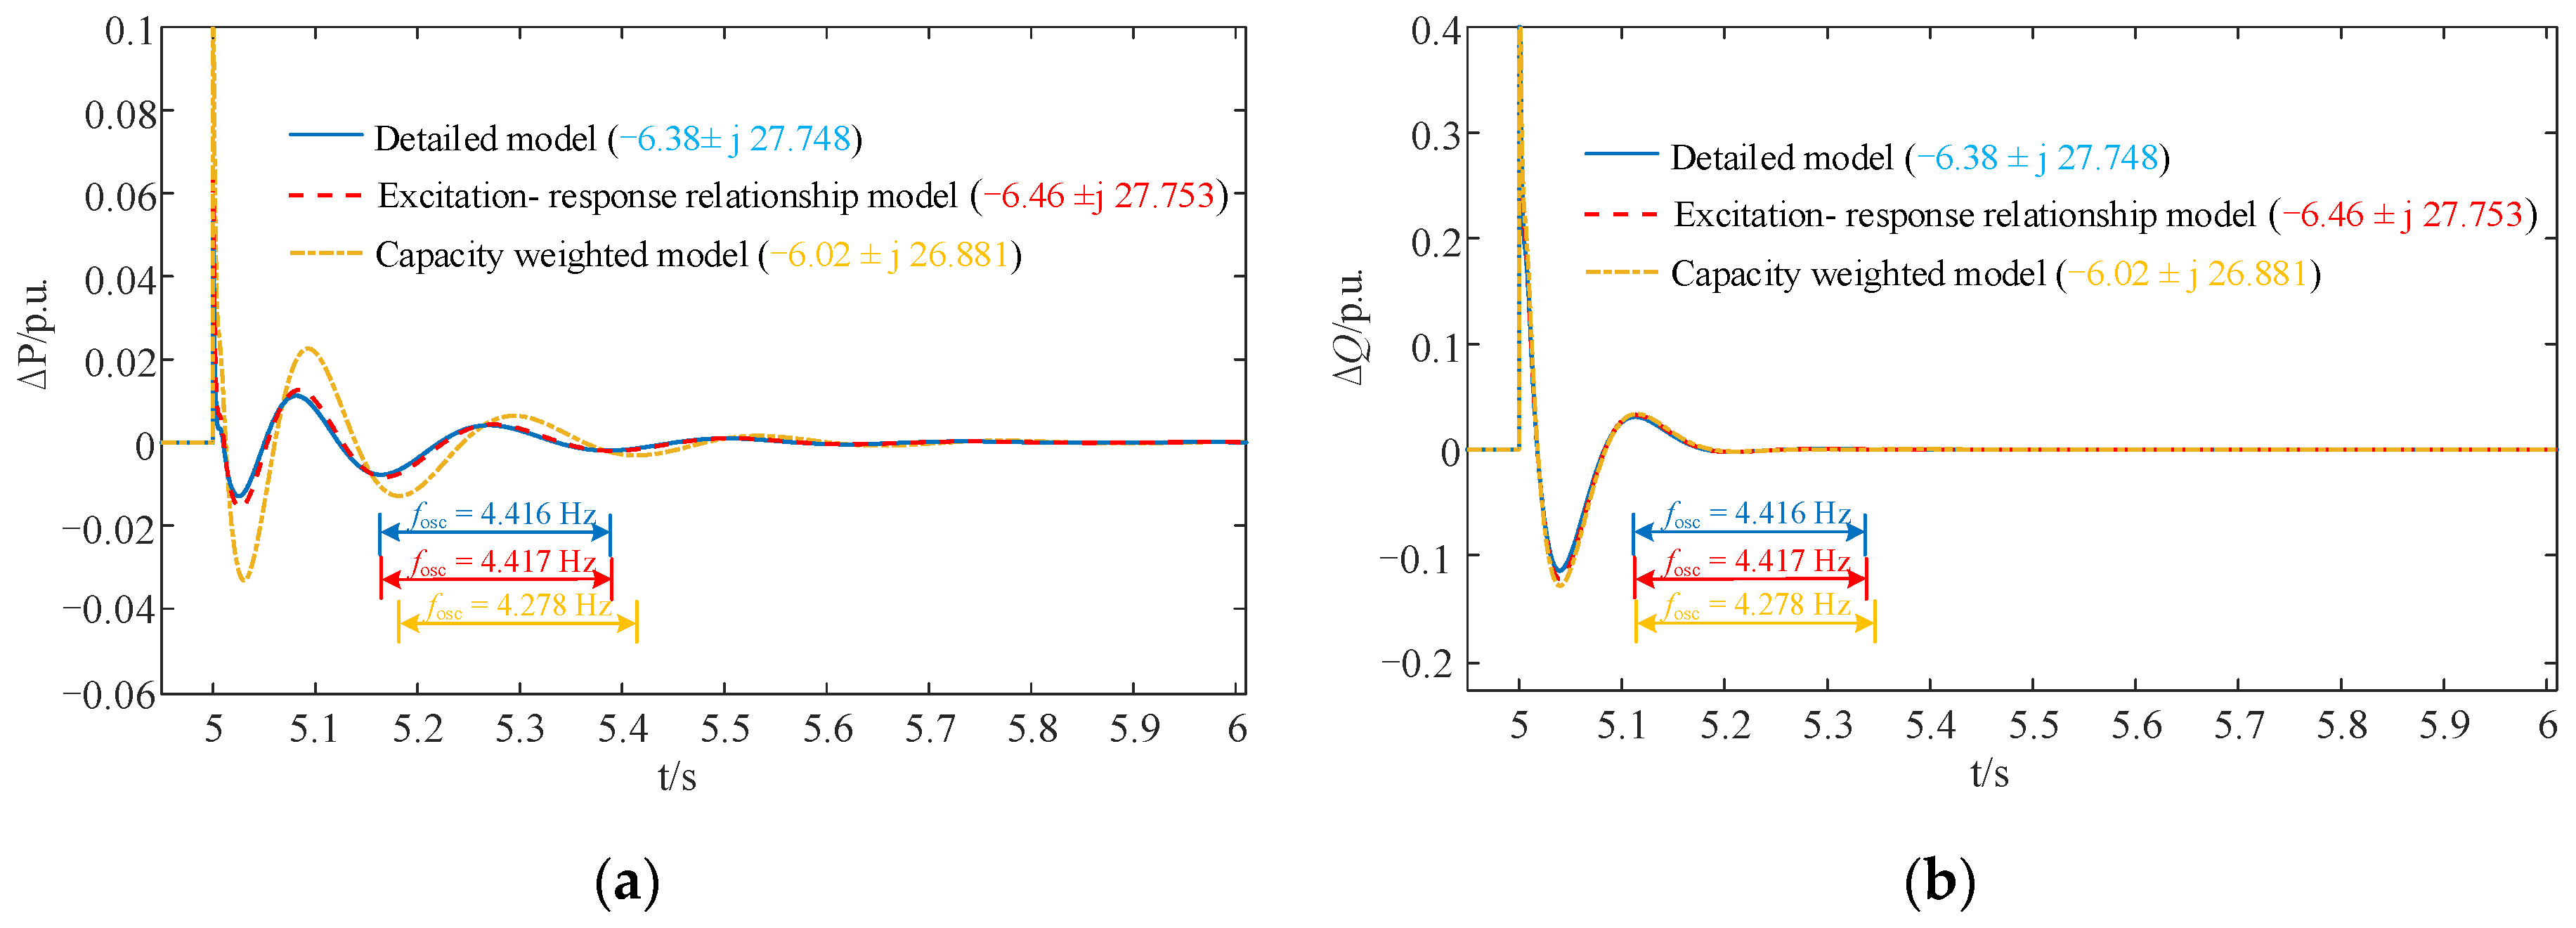
5.3. Aggregation Equivalence Verification of Direct-Driven Wind Farms Based on the Excitation–Response Relationship

This section takes a wind farm in the western part of Jilin Province, China, where a group of six PMSGs is connected to the power grid as an example for simulation analysis ( n = 6 in Figure 6). The PMSGs are connected to the booster station through 33 kV overhead power lines, and the length of the collecting power lines is detailed in Appendix B Table A2. In the simulation examples, voltage amplitude disturbance and phase disturbance are, respectively, applied to the convergence busbar to verify the correctness of the proposed aggregation equivalence method, and compared with the capacity-weighted method.
  • Set voltage amplitude disturbance
The direct-drive PMSGs were operated under different operating conditions and the detailed operation parameters are shown in Appendix B Table A2. Using the proposed method, the aggregated small-signal model of the wind farm grid-connected system based on the excitation–response relationship is obtained. At t = 5 s, we set the amplitude of the convergence busbar voltage to change from 1 p.u. to 1.1 p.u., and the changes in the active and reactive power of the wind farm were observed. Figure 15 shows the response curves of the aggregated small-signal model based on the excitation–response relationship, the small-signal model based on the capacity-weighted method and the original detailed small-signal model for wind farm grid-connected systems.
Figure 15 shows that when the convergence bus was subjected to voltage amplitude disturbance, the active and reactive power response curves of the aggregated small-signal model based on the excitation–response relationship were highly consistent with the response curves produced by the original detailed small-signal model.
A Prony analysis was performed on all curves in Figure 15 [38,39]. The dominant eigenvalues of two equivalent models and the detailed model for wind farm grid-connected systems are summarized in Table 2.
The dominant eigenvalue of the aggregated small-signal model based on excitation–response relationship is very close to the dominant eigenvalue of the original detailed small-signal model, the frequency error and damping ratio error caused by the wind farm equivalence are both less than 2% (Table 2). Therefore, the proposed aggregated small-signal model of wind farm grid-connected systems based on the excitation–response relationship is highly accurate.
Unlike the capacity-weighted method, the proposed aggregation method, based on the excitation–response relationship, takes into account the differences in the transfer function matrices for each PMSG. Therefore, it more accurately reflects the dominant oscillation mode. Compared to the detailed model, the proposed equivalent model of direct-drive wind farms is represented by a 2 × 2-dimensional equivalent transfer function matrix, which greatly reduces the complexity of the model. And compared to the traditional eigenvalue analysis method, in the process of small disturbance stability analysis of actual wind farms, the idea of “recurrence” can be used to quickly and efficiently aggregate the transfer function matrix of the direct-drive wind farm, without the need to write a complex high-order state-space coefficient matrix, which is convenient for modification and analysis.
2.
Voltage phase disturbance
The direct-driven PMSGs used the same operating conditions as those used in the preceding examples. At t = 5 s, we set the voltage phase of the convergence bus to fluctuate by 0.31416 rad, and the changes in the active and reactive power of the wind farm were observed. The response curves of the aggregated small-signal model based on the excitation–response relationship, the small-signal model based on the capacity-weighted method and the original detailed small-signal model for wind farm grid-connected system were then compared (Figure 16).
Figure 16 shows that when the convergence bus was subjected to voltage phase disturbance, the active and reactive power response curves of the aggregated small-signal model based on excitation–response relationship were highly consistent with the response curves produced by the original detailed small-signal model. A Prony analysis of all the curves in the figure produced the same results as those in Table 2. The proposed aggregation method, based on the excitation–response relationship more accurately reflected the dominant oscillation mode because it considered the differences among the transfer function matrices of each PMSG.

6. Conclusions

An aggregation equivalence method based on the excitation–response relationship is proposed to address the problem of small-signal modeling equivalence in direct-drive wind farms. Firstly, the model of the excitation–response relationship for the grid-connected PMSG system was established, and the influence of operating conditions and grid strength on the dominant eigenvalues of the grid-connected PMSG system was analyzed. Then, based on the unit model, a direct-drive wind farms aggregation equivalence method based on excitation–response relationship was proposed. Compared to the capacity-weighted method, the proposed aggregation method takes into account the differences in the transfer function matrix of each PMSG, resulting in higher accuracy in the dominant oscillation mode. Compared to the detailed model, the proposed equivalent model of direct-drive wind farms is represented by a 2 × 2 dimensional transfer function matrix, which reduces the complexity of the model exponentially without the need to write complex high-order state space coefficient matrices, making it very convenient for modification and analysis.
This paper provides a detailed modeling process for a small-signal model of PMSGs based on the excitation–response relationship, as well as an equivalent method for wind farms. The next stage of work needs to be carried out establishing the excitation–response relationship model of PMSGs considering other auxiliary controls, as well as the reduction in the wind farm model.

Author Contributions

Writing—original draft, G.Y. and Y.W.; writing—review and editing, Y.W. and Y.F.; supervision, C.Y. and L.Y. All authors have read and agreed to the published version of the manuscript.

Funding

This research was funded by the National Natural Science Foundation of China (NSFC) (No. 52337004) and The Scientific Research Program of XinJiang (no. 2022B01016).

Data Availability Statement

Data are contained within the article.

Conflicts of Interest

The authors declare no conflicts of interest.

Appendix A

(1) The specific expression for each element in the transfer function matrix G d s for the PMSG subsystem.
The excitation–response relationship model of the terminal voltage/output power for the PMSG subsystem is as follows:
P t Q t = G d s U t θ t = G P U ( s ) G P θ ( s ) G Q U ( s ) G Q θ ( s ) U t θ t
where
G P U s = I d 0 1 U t 0 ( s ) G i d ( s ) G d c ( s ) ϕ d c ( s ) G P θ s = I q 0 U t 0 G p l l ( s ) 1 U t 0 ( s ) G i d ( s ) G d c ( s ) ϕ d c ( s ) G Q U s = I q 0 1 + U t 0 ( s ) G i q ( s ) G q ( s ) K q G Q θ s = I d 0 U t 0 G p l l ( s ) 1 + U t 0 ( s ) G i q ( s ) G q ( s ) K q
and
K q = X g 2 U t 0 U g 0 cos ( θ t 0 θ g 0 )
(2) The specific expression for each element in the transfer function matrix G s s for the power system subsystem.
Combining (11) and (8) leads to
P t = I d 0 + s L g s 2 + ω 0 2 U t d 0 U t d + I q 0 + ω 0 L g s 2 + ω 0 2 U t d 0 U t q Q t = I d 0 s L g s 2 + ω 0 2 U t d 0 U t q I q 0 ω 0 L g s 2 + ω 0 2 U t d 0 U t q
If the terminal voltage U t θ t has U t d = U t and U t q = 0 in the dq rotating coordinate system, then
U t d = U t cos θ t U t U t q = U t 0 sin θ t U t 0 θ t
Combining (A1) and (A2) leads to
U t θ t = G s s P t Q t = G U P ( s ) G U Q ( s ) G θ P ( s ) G θ Q ( s ) P t Q t
where
G U P s = L g 2 ( s 2 + ω 0 2 ) I d 0 2 + I q 0 2 L g 2 s 2 + ω 0 2 U t d 0 2 I d 0 s L g ( s 2 + ω 0 2 ) U t d 0 G U Q s = L g 2 ( s 2 + ω 0 2 ) I d 0 2 + I q 0 2 L g 2 s 2 + ω 0 2 U t d 0 2 I q 0 ω 0 L g ( s 2 + ω 0 2 ) U t d 0 G θ P s = L g 2 ( s 2 + ω 0 2 ) I d 0 2 + I q 0 2 L g 2 s 2 + ω 0 2 U t d 0 2 I q 0 ω 0 L g ( s 2 + ω 0 2 ) U t d 0 G θ Q s = L g 2 ( s 2 + ω 0 2 ) I d 0 2 + I q 0 2 L g 2 s 2 + ω 0 2 U t d 0 2 I d 0 + s L g ( s 2 + ω 0 2 ) U t d 0
(3) The specific expression for each element in the transfer function matrix G d s for the voltage/power excitation–response relationship at the convergence busbar.
The voltage/power excitation–response relationship for the PMSG at the convergence busbar is as follows:
P g Q g = G d s U g θ g = G P U ( s ) G P θ ( s ) G Q U ( s ) G Q θ ( s ) U g θ g
where
G P U s = 2 U g 0 U t 0 U g 0 ( K 3 G P U + K 2 G Q U ) K 1 K 3 K 2 K 4 G P θ s = ( K 3 G P θ + K 2 G Q θ ) K 1 K 3 K 2 K 4 G Q U s = 2 U g 0 U t 0 U g 0 ( K 1 G P U + K 4 G Q U ) K 1 K 3 K 2 K 4 G Q θ s = ( K 1 G Q θ + K 4 G P θ ) K 1 K 3 K 2 K 4
and
K 1 = 1 G P θ X g 1 U g 0 U t 10 ,   K 2 = G P U X g 1 U g 0 ,   K 3 = K Q G Q U X g 1 U g 0 ,   K 4 = G Q θ X g 1 U g 0 U t 0

Appendix B

Table A1 shows the parameters of the grid-side converter for the PMSG.
Table A1. Simulation parameters of a 2 MW PMSG.
SymbolVariableNumerical Value
SbaseRated power2 MW
VbaseRated voltage0.69 kV
fbaseRated frequency50 Hz
Udcrefdc capacitance voltage reference value1.2 kV
CdcDirect current capacitance0.1 F
LfFilter inductance0.00015 H
(kpdc, kidc)Voltage outer loop proportional integral parameters(3.5, 140)
(kppll, kipll)PLL proportional integral parameter(50, 2000)
(kpi, kii)Current inner loop proportional integral parameter(0.3, 160)
The operating conditions of each PMSG in the direct-drive wind farm are shown in Table A2.
Table A2. Operating conditions of each PMSG in the direct-drive wind farm.
Operating ConditionPMSG1PMSG2PMSG3PMSG4PMSG5PMSG6
Operating condition (P0) 0.1 p.u.0.1 p.u.0.2 p.u.0.2 p.u.0.4 p.u.0.4 p.u.
Feeder reactance0.2 mH0.4 mH0.2 mH0.4 mH0.2 mH0.4 mH

Appendix C

(1) The direct-driven PMSG running under the medium operating condition.
Bode diagrams of G P U j ω and G P θ j ω when the direct-driven PMSG is running under medium operating condition (P0 = 0.5 p.u.) are shown in Figure A1a. Bode diagrams of G Q U j ω and G Q θ j ω when the direct-driven PMSG is running under the medium operating condition (P0 = 0.5 p.u.) are shown in Figure A1b.
Figure A1. Bode diagrams of transfer functions under medium operating condition: (a) G P U s and G P θ s ; (b) G Q U s and G Q θ s .
Electronics 13 02124 g0a1
(2) The direct-drive PMSG running under the high operating condition.
Bode diagrams of G P U j ω and G P θ j ω when the direct-driven PMSG is running under the high operating condition (P0 = 0.9 p.u.) are shown in Figure A2a.
Bode diagrams of G Q U j ω and G Q θ j ω when the direct-driven PMSG is running under the high operating condition (P0 = 0.9 p.u.) are shown in Figure A2b.
Figure A2. Bode diagrams of transfer functions under high operating condition: (a) G P U s and G P θ s ; (b) G Q U s and G Q θ s .
Electronics 13 02124 g0a2

References

  1. Zhou, X.X.; Chen, S.Y.; Lu, Z.X.; Huang, Y.H.; Ma, S.C. Technology features of the new generation power system in China. Proc. CSEE 2018, 38, 1893–1904+2205. [Google Scholar]
  2. Li, M.J.; Yu, Z.; Xu, T.; He, J.B.; Wang, C.; Xie, X.R.; Liu, C. Study of Complex Oscillation Caused by Renewable Energy Integration and Its Solution. Power Syst. Technol. 2017, 41, 1035–1042. [Google Scholar]
  3. Chen, G.P.; Li, M.J.; Xu, T.; Zhang, J.Y.; Wang, C. Practice and Challenge of Renewable Energy Development Based on Interconnected Power Grid. Power Syst. Technol. 2017, 41, 3095–3103. [Google Scholar]
  4. Xie, X.R.; He, J.B.; Mao, H.Y.; Li, Y.Z. New issues and classification of power system stability with high shares of renewables and power electronics. Proc. CSEE 2021, 41, 461–474. [Google Scholar]
  5. Du, W.J.; Wang, Y.J.; Wang, H.F.; Ren, B.X.; Xiao, X.Y. Small-disturbance stability limit of a grid-connected wind farm with PMSGs in the timescale of DC voltage dynamics. IEEE Trans. Power Syst. 2021, 36, 2366–2379. [Google Scholar] [CrossRef]
  6. Zhang, M.Y.; Xiao, S.W.; Tian, T.; Zhang, H.H.; Bi, T.S. Analysis of SSO Influencing Factors and Parameter Adjustment for Grid-Connected Full-Converter Wind Farm Based on Impedance Sensitivity. Power Syst. Technol. 2018, 42, 2768–2777. [Google Scholar]
  7. Sheng, Y.B.; Lin, T.; Chen, B.P.; Chen, R.S.; Guo, Z.Y.; Xu, X.L. Coordination and Optimization of Controller Parameters for Subsynchronous/Super-Synchronous Oscillation in New Energy Delivery Systems. Trans. China Electrotech. Soc. 2019, 34, 984–992. [Google Scholar]
  8. Ali, M.; IIie, I.S.; Milanović, J.V.; Chiccoet, G. Wind Farm Model Aggregation Using Probabilistic Clustering. IEEE Trans. Power Syst. 2013, 28, 309–316. [Google Scholar] [CrossRef]
  9. Zhang, J.; He, Y.G. Parameters Identification of Equivalent Model of Permanent Magnet Synchronous Generator Wind Farm Based on Analysis of Trajectory Sensitivity. Trans. China Electrotech. Soc. 2020, 35, 3303–3313. [Google Scholar]
  10. Li, H.; Yang, C.; Zhao, B.; Wang, H.S.; Chen, Z. Aggregated models and transient performances of a mixed wind farm with different wind turbine generator systems. Elecrt. Power Syst. Res. 2012, 92, 1–10. [Google Scholar] [CrossRef]
  11. Wang, Y.F.; Lu, C.; Zhu, L.P.; Zhang, G.L.; Li, X.; Chen, Y. Comprehensive modeling and parameter identification of wind farms based on wide-area measurement systems. J. Mod. Power Syst. Cle. 2016, 4, 383–393. [Google Scholar] [CrossRef]
  12. Jalili-Marandi, V.; Pak, L.F.; Dinavahi, V. Real-time simulation of grid-connected wind farms using physical aggregation. IEEE Trans. Ind. Electron. 2010, 57, 3010–3021. [Google Scholar] [CrossRef]
  13. Zhou, Y.H.; Zhao, L.; Lee, W.J. Robustness analysis of dynamic equivalent model of DFIG wind farm for stability study. IEEE Trans. Ind. Appl. 2018, 54, 5682–5690. [Google Scholar] [CrossRef]
  14. Zou, J.X.; Peng, C.; Xu, H.B. A fuzzy clustering algorithm-based dynamic equivalent modeling method for wind farm with DFIG. IEEE Trans. Energy Conver. 2015, 30, 1329–1337. [Google Scholar] [CrossRef]
  15. Cheng, X.Y.; Lee, W.J.; Sahni, M.; Cheng, X.Z.; Lee, L. Dynamic Equivalent Model Development to Improve the Operation Efficiency of Wind Farm. IEEE Trans. Ind. Appl. 2016, 52, 2759–2767. [Google Scholar] [CrossRef]
  16. Kong, M.Y.; Sun, D.; Nian, H. Modeling Method for Power Response Characteristics of DFIG-based Wind Turbine System. Autom. Electr. Power Syst. 2022, 46, 118–125. [Google Scholar]
  17. Chen, S.Y.; Wang, C.; Shen, H.; Gao, N.C.; Zhu, L.; Lan, H. Dynamic Equivalence for Wind Farms Based on Clustering Algorithm. Proc. CSEE 2012, 32, 11–19. [Google Scholar]
  18. Dong, W.K.; Wang, Y.; Wang, H.F. Single-machine Equivalent Model of a Group of Wind Turbine Generators for Small-signal Stability Analysis. Power Syst. Technol. 2021, 45, 1241–1250. [Google Scholar]
  19. Dong, W.K.; Du, W.J.; Wang, H.F. Dynamic equivalent model of a grid-connected wind farm for oscillation stability analysis. Proc. CSEE 2021, 41, 75–87+399. [Google Scholar]
  20. He, J.Y.; Zhou, Y.H.; Wang, K.; Li, L.; Li, Z.H.; Xin, H.H. Self-adaptive Equivalence Method for Wind Farm with Maintained Dominant Mode. Autom. Electr. Power Syst. 2021, 45, 28–36. [Google Scholar]
  21. Xie, X.R.; Liu, H.K.; He, J.B.; Liu, W. Small-signal Impedance Admittance Network Modeling for Grid-connected Renewable Energy Generation Systems. Autom. Electr. Power Syst. 2017, 41, 26–32. [Google Scholar]
  22. Wang, Y.P.; Yan, G.G.; Mu, G.; Yang, C. Research on Aggregation Modeling of Grid Connected VSC Under AC Current Control Scale. Proc. CSEE 2022, 42, 2900–2909. [Google Scholar]
  23. Wang, X.B.; Du, W.J.; Wang, H.F. Mechanism Analysis of Open-loop Modal Resonance on Subsynchronous Oscillations Caused by PLL in Power Systems With Integrated PMSGs. Proc. CSEE 2018, 38, 1935–1950. [Google Scholar]
  24. Xie, X.R.; Liu, H.K.; He, J.B.; Zhang, C.Y.; Qiao, Y. Mechanism and characteristics of subsynchronous oscillation caused by the interaction between full-converter wind turbines and AC systems. Proc. CSEE 2016, 36, 2366–2372. [Google Scholar]
  25. He, W.; Yuan, X.M.; Hu, J.B. Inertia provision and estimation of PLL-Based DFIG wind turbines. IEEE Trans. Power Syst. 2017, 32, 510–521. [Google Scholar] [CrossRef]
  26. Zhang, M.Q.; Yuan, X.M.; Hu, J.B. Inertia and primary frequency provisions of PLL-synchronized VSC HVDC when attached to islanded AC system. IEEE Trans. Power Syst. 2018, 33, 4179–4188. [Google Scholar] [CrossRef]
  27. Yuan, H.; Yuan, X.M.; Hu, J.B. Modeling of grid-connected VSCs for power system small-signal stability analysis in DC-link voltage control timescale. IEEE Trans. Power Syst. 2017, 32, 3981–3991. [Google Scholar] [CrossRef]
  28. Hu, Z.J.; Su, S.; Wang, R.P.; Liu, G.L.; Zhang, K.; Xie, X.P. Robust Distributed Load Frequency Control for Multi-area Wind Energy-Dominated Microgrids Considering Phasor Measurement Unit Failures. IEEE Internet Things 2024, in press. [Google Scholar] [CrossRef]
  29. Hu, Z.J.; Zhang, K.; Su, S.; Wang, R.P.; Li, Y.H. Robust Cooperative Load Frequency Control for Enhancing Wind Energy Integration in Multi-Area Power Systems. IEEE Trans. Autom. Sci. Eng. 2024, in press. [Google Scholar] [CrossRef]
  30. Zhao, Q.; Zhang, Y.J.; Xie, X.R.; Zhang, Y.Q.; Zhang, D.Z.; Chen, Z.W. Mitigation of Subsynchronous Oscillations Based on Renewable Energy Hydrogen Production System and Its Supplementary Damping Control. Proc. CSEE 2019, 39, 3728–3735. [Google Scholar]
  31. Shao, B.B.; Zhao, S.Q.; Yang, Y.H.; Gao, B.F.; Wang, L.Y.; Blaabjerg, F. Nonlinear Subsynchronous Oscillation Damping Controller for Direct-Drive Wind Farms With VSC-HVDC Systems. IEEE J. Emerg. Sel. Top. Power Electron. 2022, 10, 2842–2858. [Google Scholar] [CrossRef]
  32. Yao, J.; Wang, X.W.; Li, J.W.; Liu, R.K.; Zhang, H.L. Sub-Synchronous Resonance Damping Control for Series-Compensated DFIG-Based Wind Farm With Improved Particle Swarm Optimization Algorithm. IEEE Trans. Energy Convers. 2019, 34, 849–859. [Google Scholar] [CrossRef]
  33. Liu, B.; Li, Z.; Dong, X.L.; Yu, S.S.; Chen, X.; Oo, A.M.T.; Lian, X.Q.; Shan, Z.Y.; Liu, X.D. Impedance Modeling and Controllers Shaping Effect Analysis of PMSG Wind Turbines. IEEE J. Emerg. Sel. Top. Power Electron. 2021, 9, 1465–1478. [Google Scholar] [CrossRef]
  34. Shao, B.B.; Zhao, S.Q.; Gao, B.F.; Shen, J.L.; Zhao, Z.M. Inside-wind-farm/Wind-farm-grid Sub-synchronous Oscillation Characteristics Analysis in Multiple D-PMSGs Interfaced with VSC-HVDC System. Proc. CSEE 2020, 40, 3835–3847. [Google Scholar]
  35. Ma, W.D.; Wang, X.T.; Xie, D. Characteristics of Subsynchronous Oscillation Power Propagation in the Large-scale Wind Farm Integrated System. CSEE 2020, 40, 5217–5229. [Google Scholar]
  36. Chen, W.H.; Wang, D.H.; Guo, X.L.; Chen, X.; Tan, L.N.; Shen, Y. Identifying modeling boundary using local propagation mechanism of subsynchronous oscillations. Proc. CSEE 2017, 37, 4999–5009. [Google Scholar]
  37. Chao, W.J.; Deng, C.P.; Huang, J.W.; Dai, L.Y.; Min, Y.X.; Cheng, Y.F.; Wang, Y.H.; Liao, J.Q. A Sub-Synchronous Oscillation Suppression Strategy Based on Active Disturbance Rejection Control for Renewable Energy Integration System via MMC-HVDC. Electronics 2023, 12, 2885. [Google Scholar] [CrossRef]
  38. Sahraoui, M.; Cardoso, A.J.M.; Ghoggal, A. The Use of a Modified Prony Method to Track the Broken Rotor Bar Characteristic Frequencies and Amplitudes in Three-Phase Induction Motors. IEEE Trans. Ind. Appl. 2015, 51, 2136–2147. [Google Scholar] [CrossRef]
  39. Yutthagowith, P.; Pattanadech, N. Improved Least-Square Prony Analysis Technique for Parameter Evaluation of Lightning ImpulseVoltage and Current. IEEE Tran. Power Del. 2016, 31, 271–277. [Google Scholar] [CrossRef]
Figure 1. Schematic diagram of a grid-connected PMSG.
Electronics 13 02124 g001
Figure 2. Schematic diagram of the interactions between the PMSG subsystem and the power grid subsystem.
Electronics 13 02124 g002
Figure 3. Small-signal model of dc-link capacitor.
Electronics 13 02124 g003
Figure 4. The block diagram of current tracking control based on voltage balance.
Electronics 13 02124 g004
Figure 5. Model of the excitation–response relationship for the grid-connected PMSG system.
Electronics 13 02124 g005
Figure 6. Schematic diagram of a direct-drive wind farm.
Electronics 13 02124 g006
Figure 7. Schematic diagram of the voltage power excitation–response relationship at the convergence busbar.
Electronics 13 02124 g007
Figure 8. Schematic diagram of the equivalence wind farm excitation–response relationship.
Electronics 13 02124 g008
Figure 9. Schematic diagram of the chain-structured wind farm aggregation principle.
Electronics 13 02124 g009
Figure 13. Bode diagrams of G P U s and G P θ s .
Electronics 13 02124 g013
Figure 14. Bode diagrams of G Q U s and G Q θ s .
Electronics 13 02124 g014
Figure 15. Output power curves for the wind farm under voltage amplitude disturbance: (a) active power response curve; (b) reactive power response curve.
Electronics 13 02124 g015
Figure 10. Response curves for the excitation–response relationship model and the time-domain simulation model.
Electronics 13 02124 g010
Figure 11. Trajectories of eigenvalues for the dominant oscillation modes under different operating conditions.
Electronics 13 02124 g011
Figure 12. Trajectories of eigenvalues for the dominant oscillation modes under different power grid strengths.
Electronics 13 02124 g012
Figure 16. Output power curves for the wind farm under voltage phase disturbance (a) Active power response curve; (b) Reactive power response curve.
Electronics 13 02124 g016
Table 1. Eigenvalues of the excitation–response relationship model and the state-space equation model for PMSG.
Operating Conditions P0 (Iin0)0.1 p.u.0.5 p.u.0.9 p.u.
Eigenvalues of the state-space equation model
λ1,2−213.6 ± j 456.7−213.8 ± j 456.2−214.3 ± j 455.6
λ3,4−290.5 ± j 486.9−290.5 ± j 486.9−290.4 ± j 487.0
λ5,6−23.56 ± j 37.11−19.56 ± j 38.52−15.16 ± j 39.40
λ7,8−25.20 ± j 37.07−25.94 ± j 37.14−26.43 ± j 37.21
λ9−20.86−20.98−21.22
Eigenvalues of small-signal model based on excitation–response relationship
λ1,2−213.9 ± j 456.5−214.2 ± j 456.1−214.5 ± j 455.6
λ3,4−290.1 ± j 486.9−290.1 ± j 486.9−290.1 ± j 487.0
λ5,6−23.58 ± j 37.02−19.57 ± j 38.34−15.18 ± j 39.31
λ7,8−25.19 ± j 37.05−25.92 ± j 37.11−26.41 ± j 37.20
λ9−20.52−20.65−21.03
Table 2. Dominant eigenvalues of two equivalent models and detailed model for wind farms.
Detailed ModelExcitation-Response Relationship ModelCapacity Weighted Model
Dominant eigenvalue−6.38 ± j 27.748−6.46 ± j 27.753−6.02 ± j 26.881
Frequency error\(4.416 Hz)0.02% (4.417 Hz)−3.12% (4.278 Hz)
Damping ratio error\(0.224)1.28% (0.227)−2.41% (0.218)
Disclaimer/Publisher’s Note: The statements, opinions and data contained in all publications are solely those of the individual author(s) and contributor(s) and not of MDPI and/or the editor(s). MDPI and/or the editor(s) disclaim responsibility for any injury to people or property resulting from any ideas, methods, instructions or products referred to in the content.

