

Simultaneous Velocity and Texture Classification from a Neuromorphic Tactile Sensor Using Spiking Neural Networks


Abstract
:1. Introduction
- The development of an end-to-end tactile neuromorphic system capable of movement-invariant texture classification.
- The simultaneous classification of the movement profile of a tactile sensor across different surfaces.
- A multi-objective optimisation analysis of network size, activity and accuracy to fit edge platform constraints.
2. Related Works
3. Experimental Setup
3.1. neuroTac Sensor
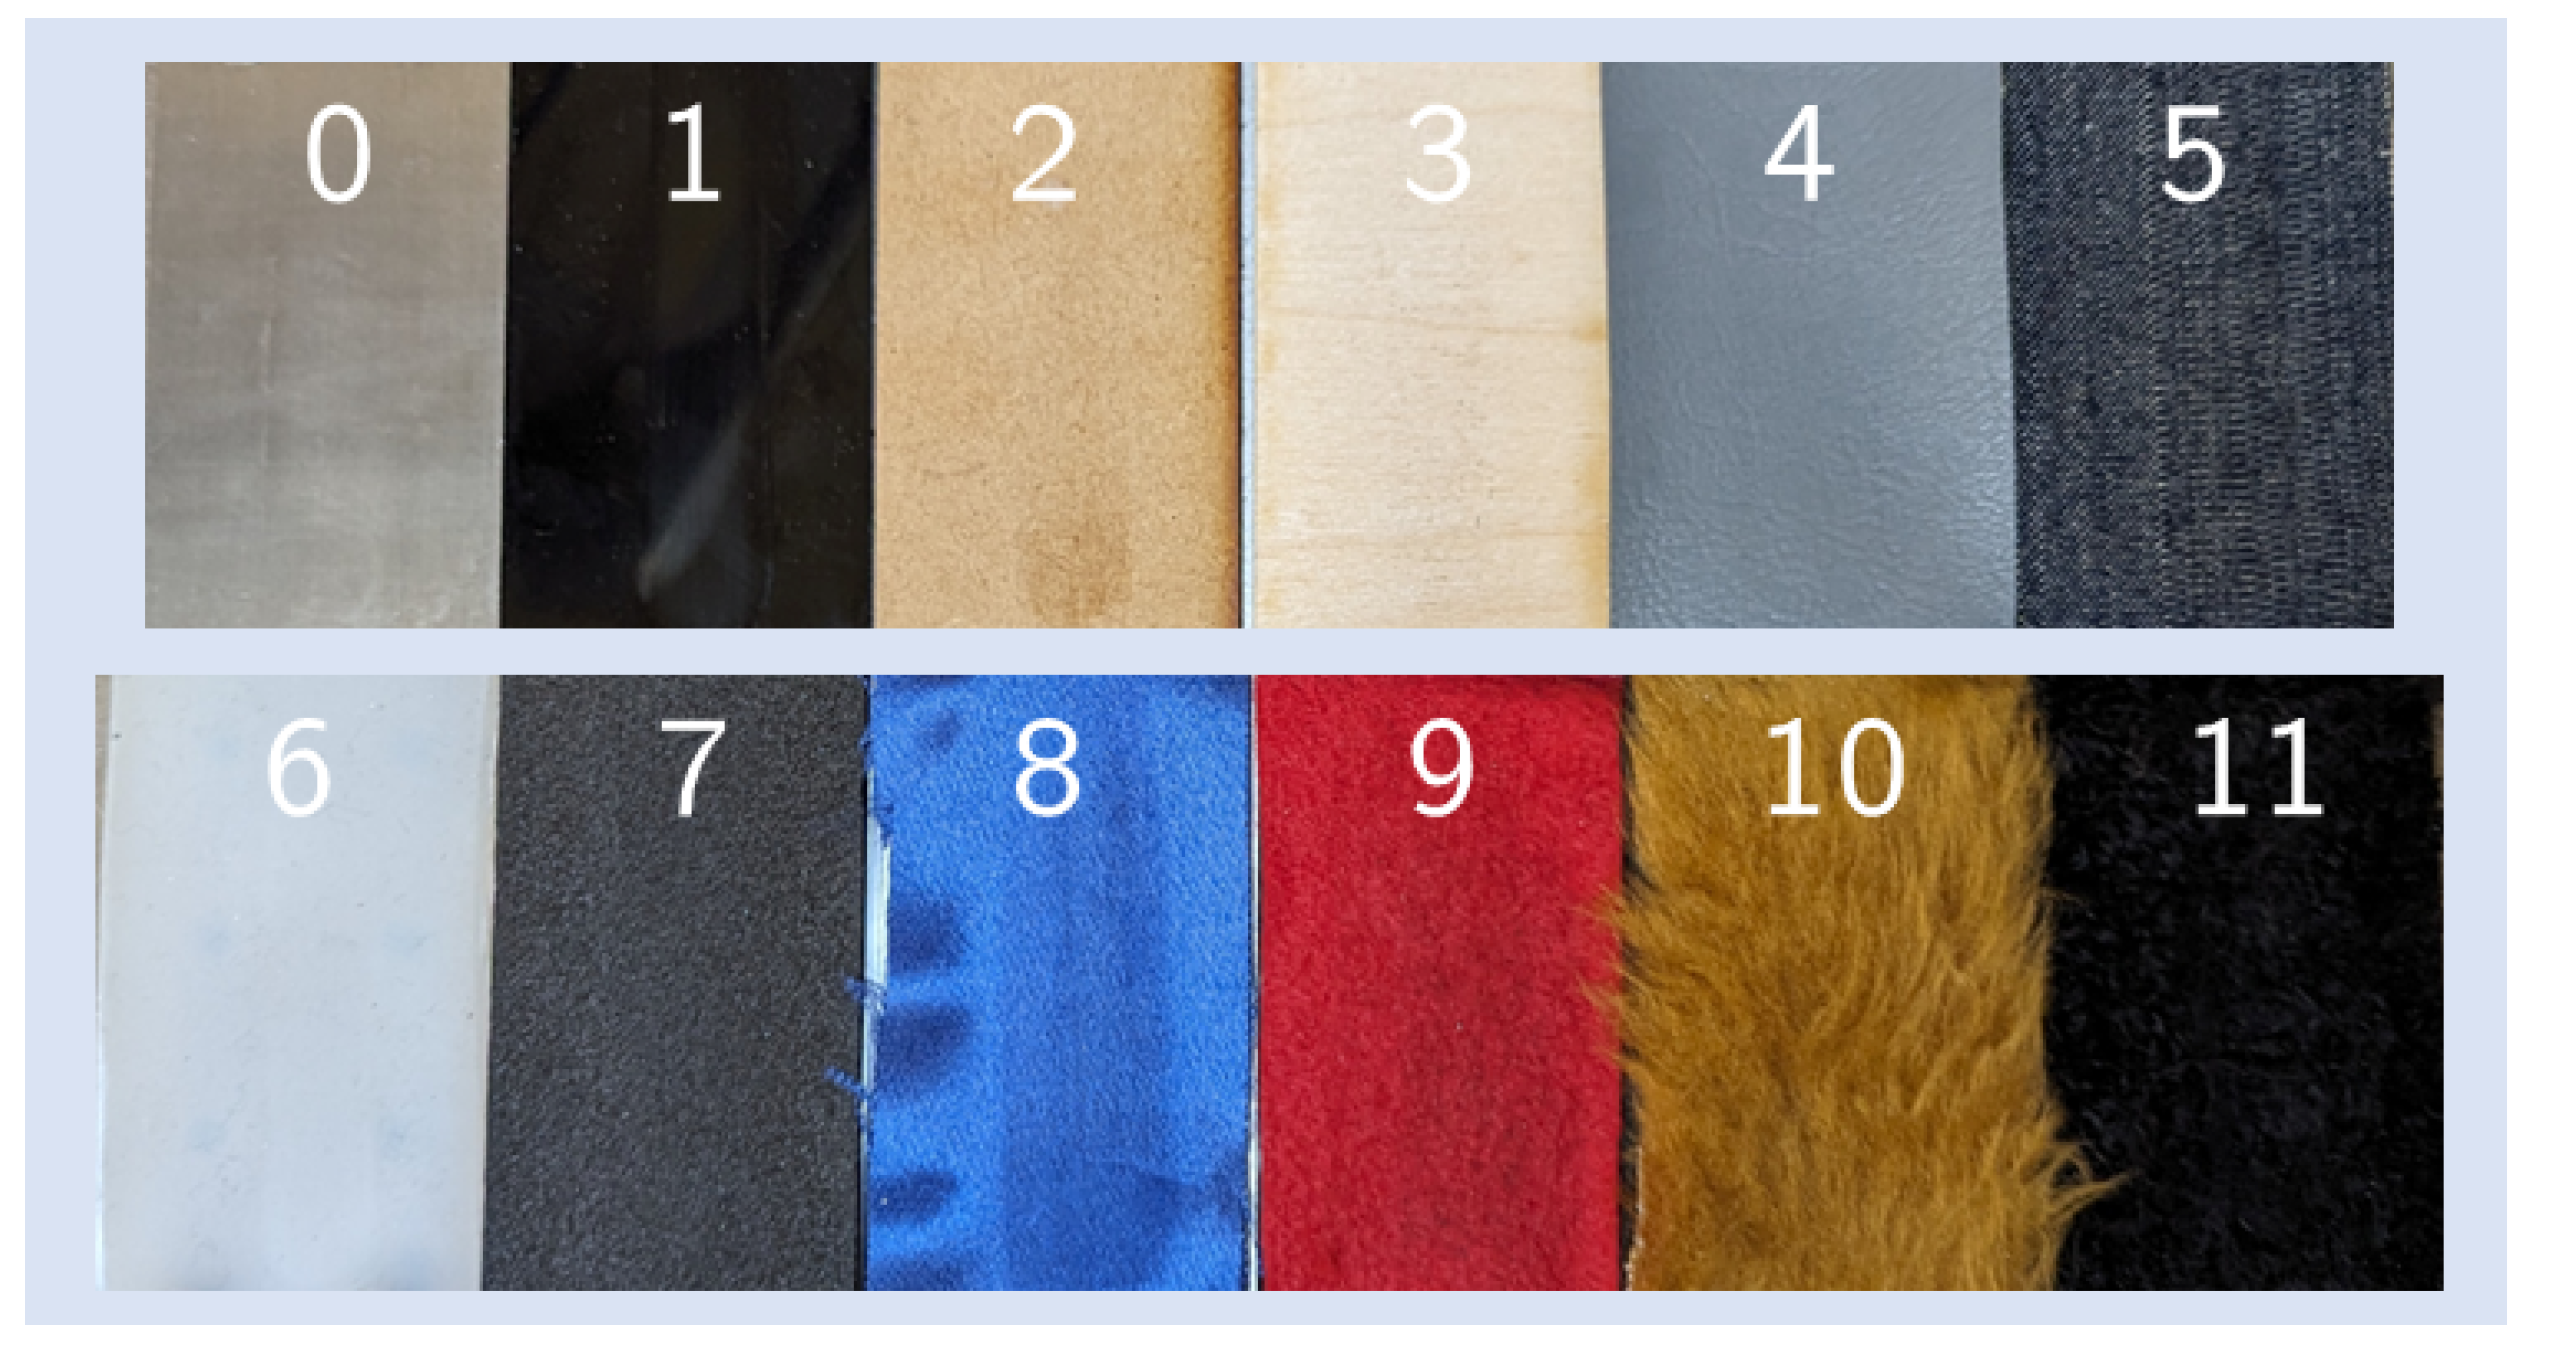
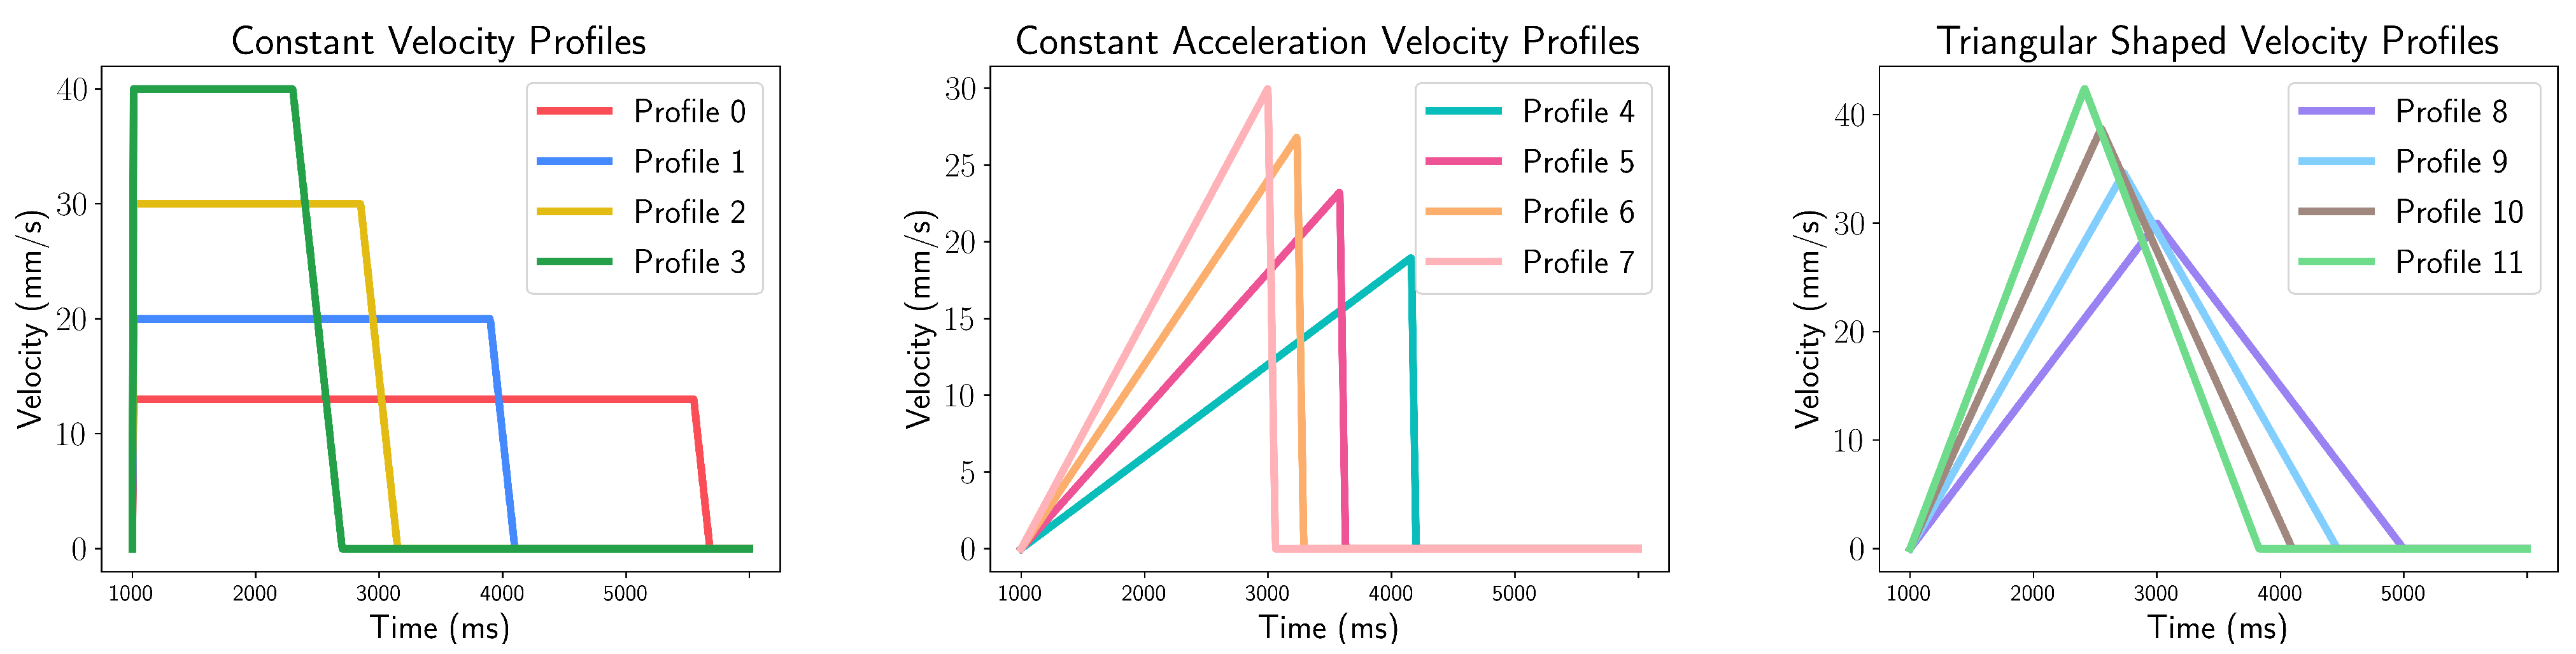
3.2. Dataset Collection
4. Proposed Method
4.1. Networks
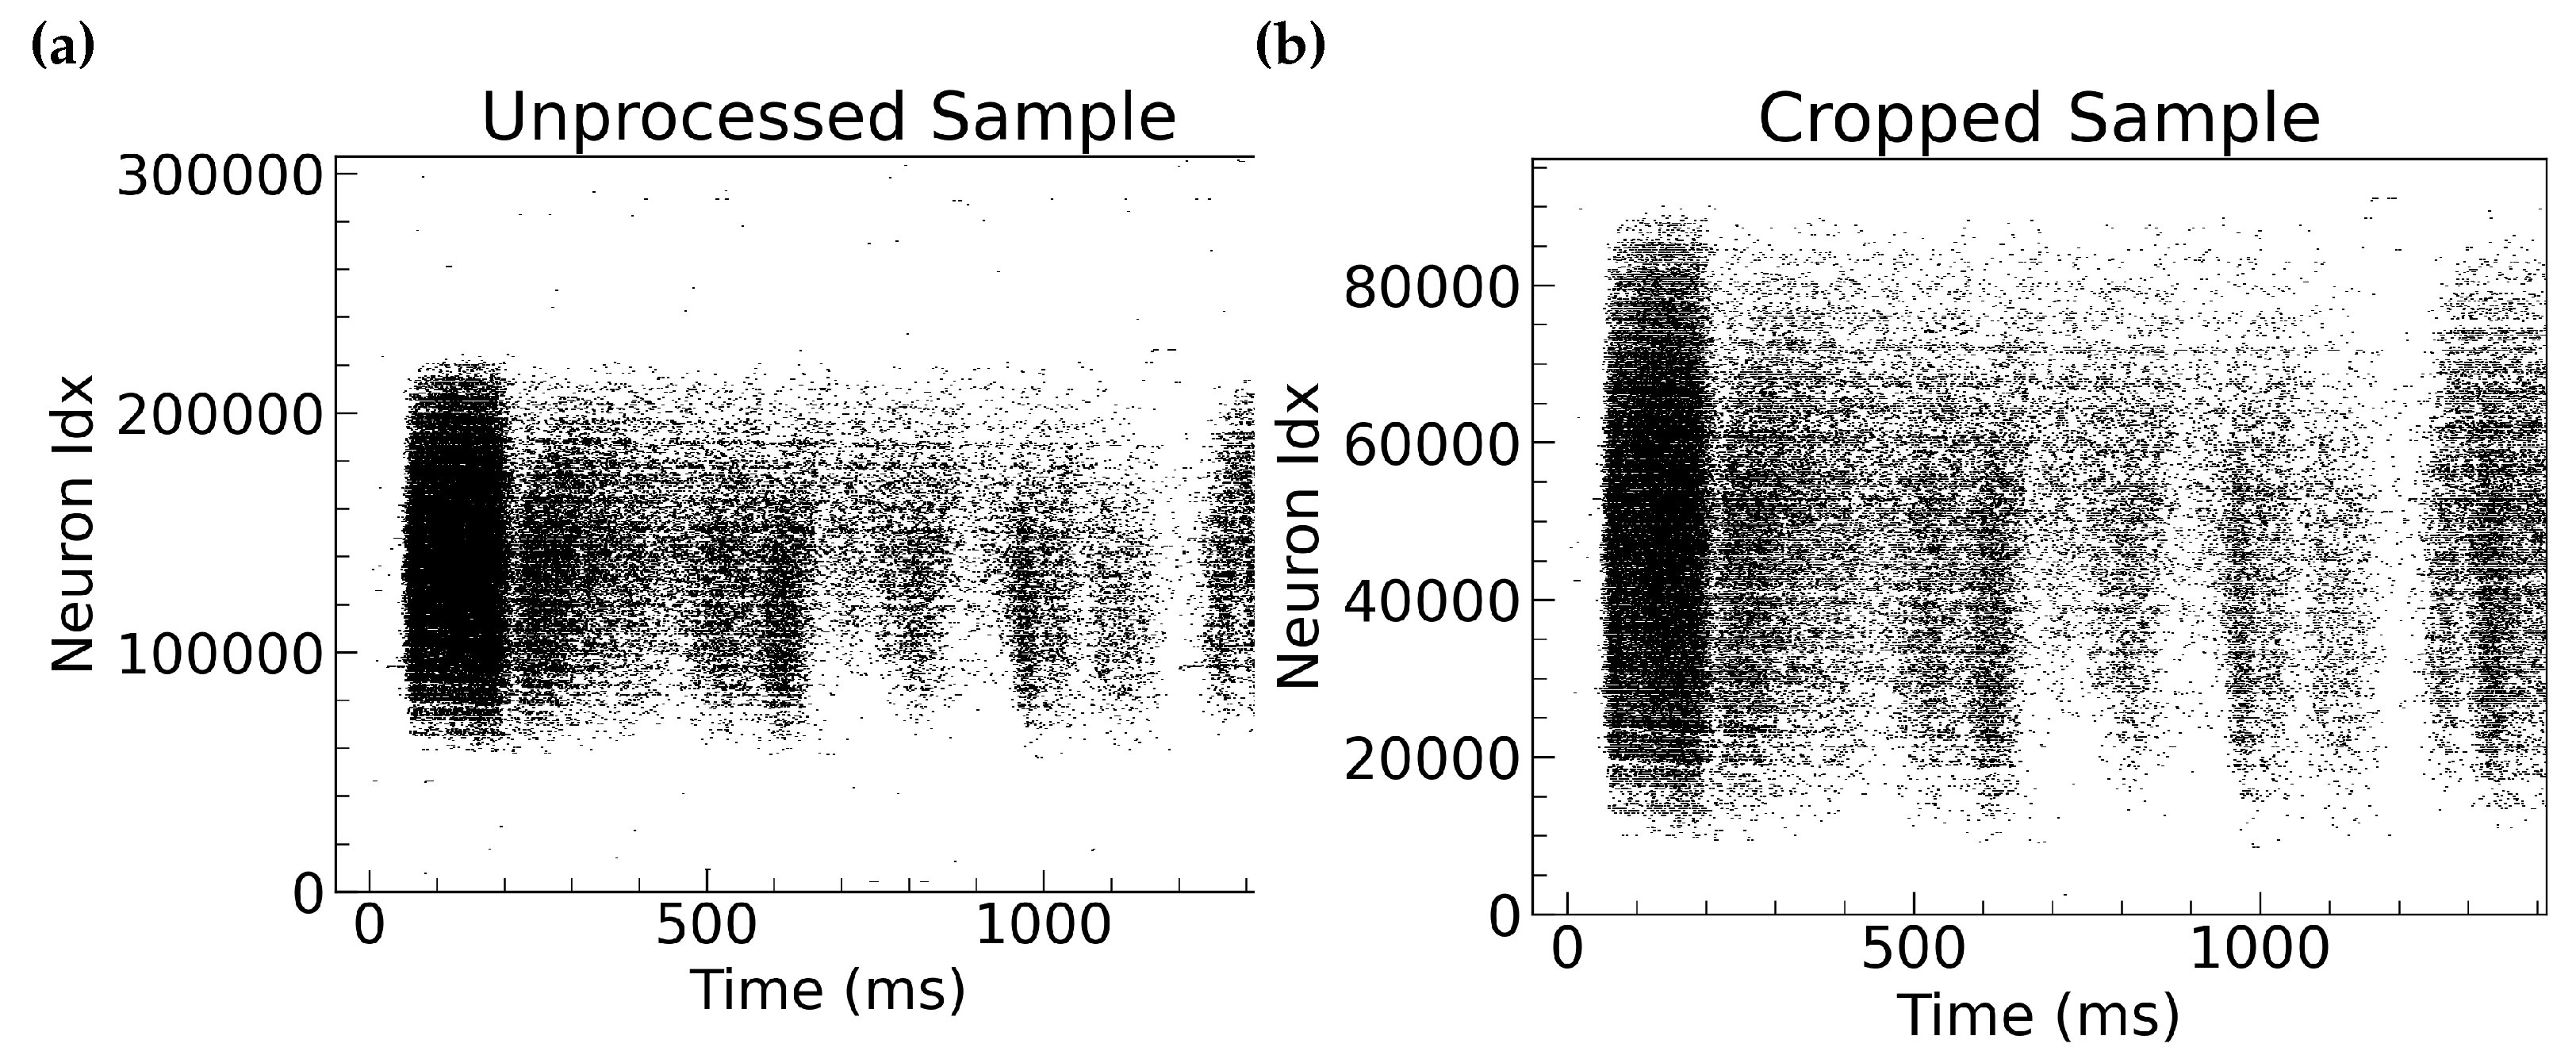
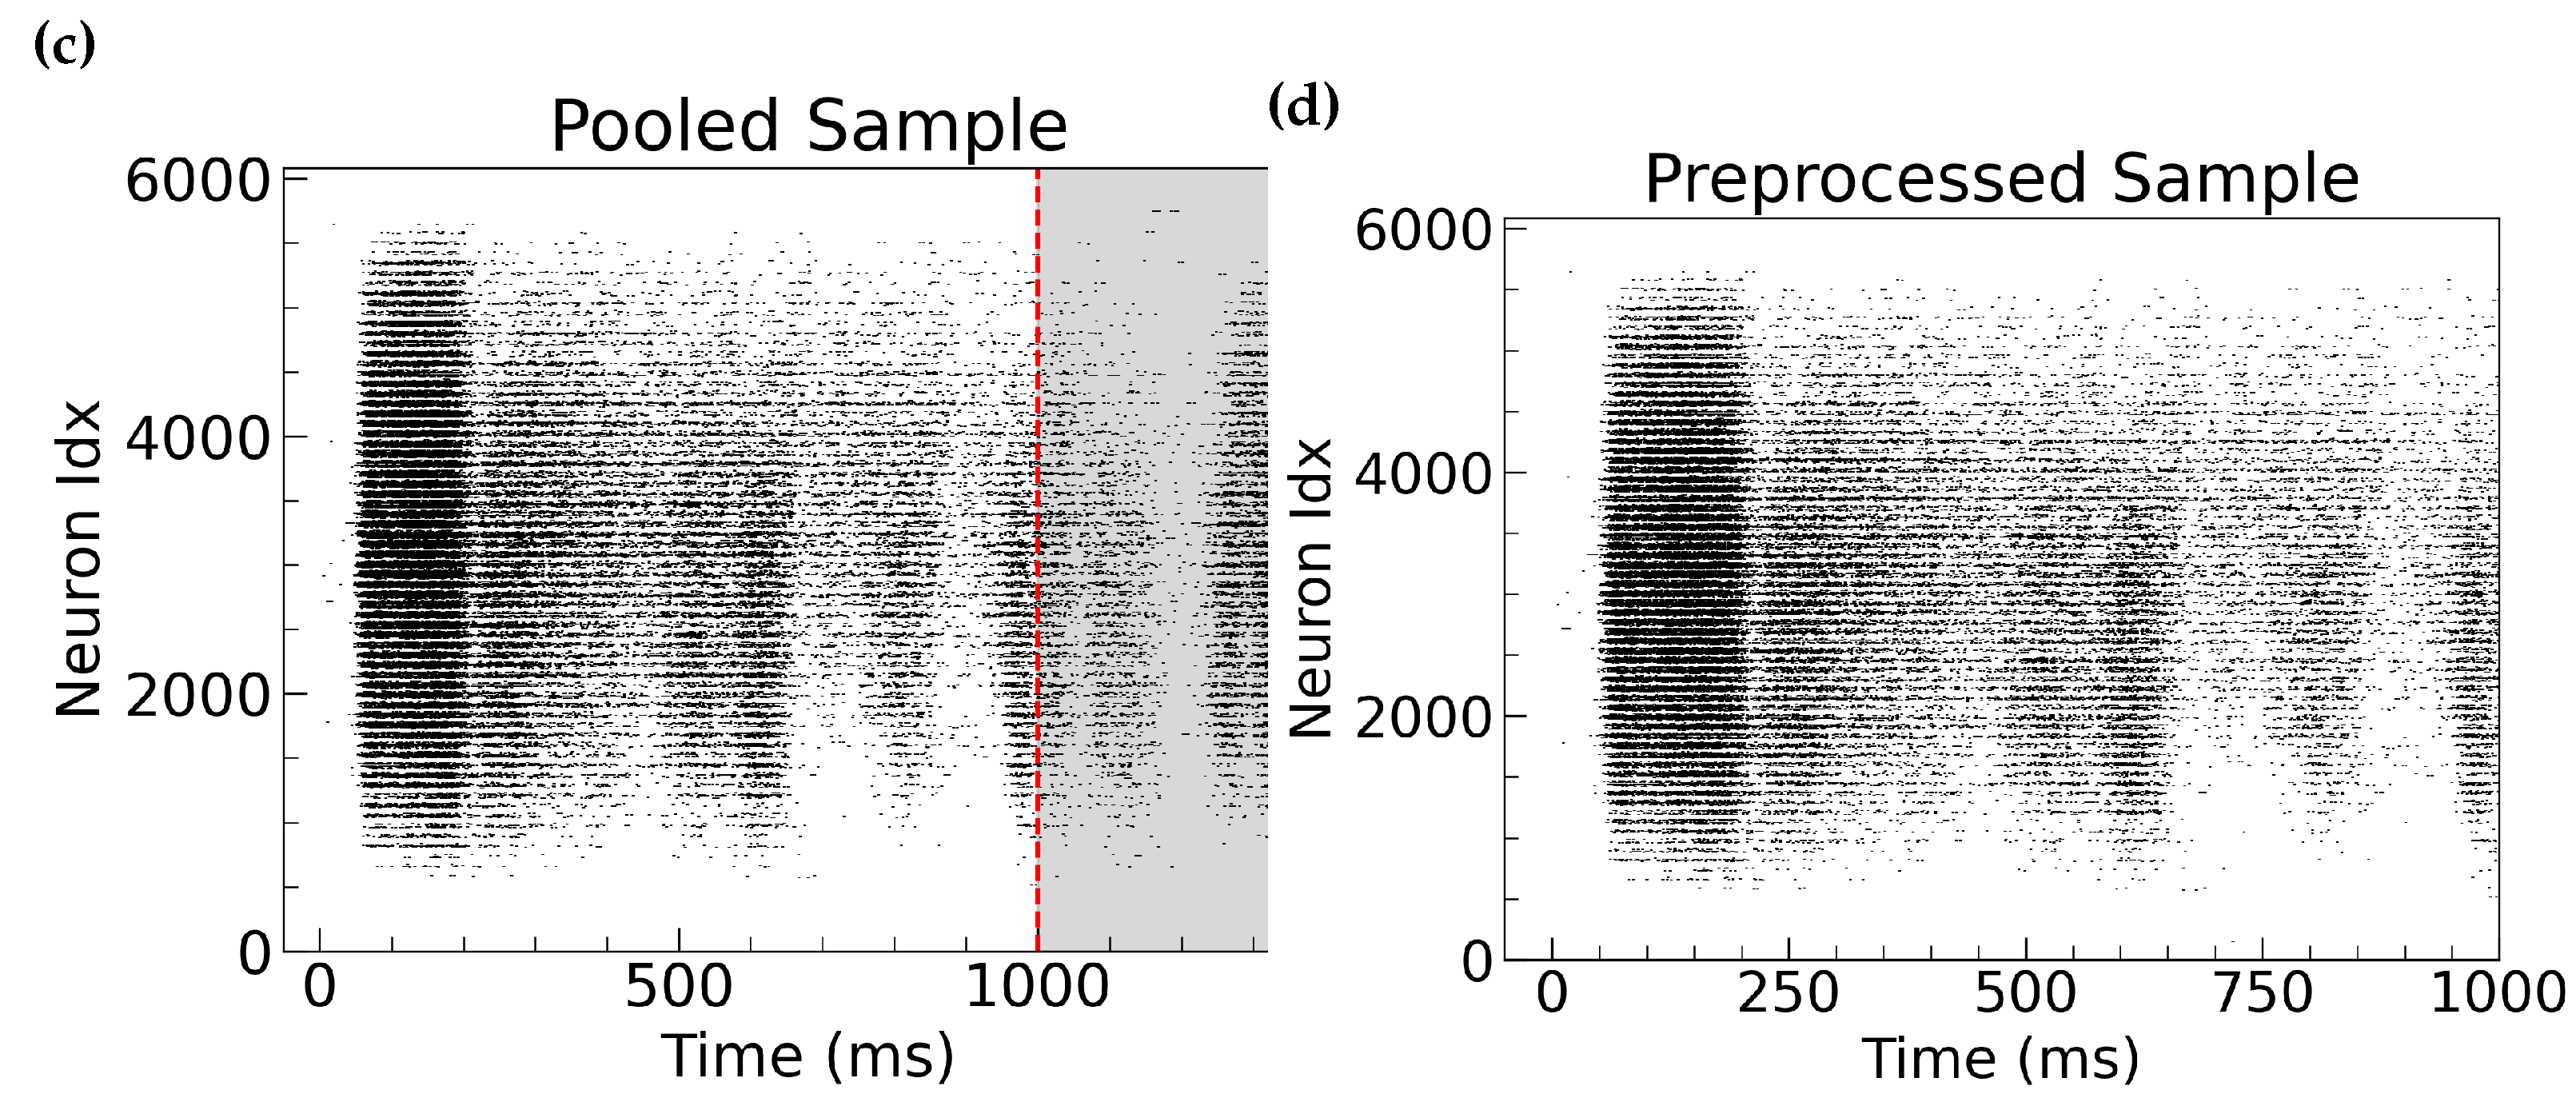
Preprocessing
4.2. Training
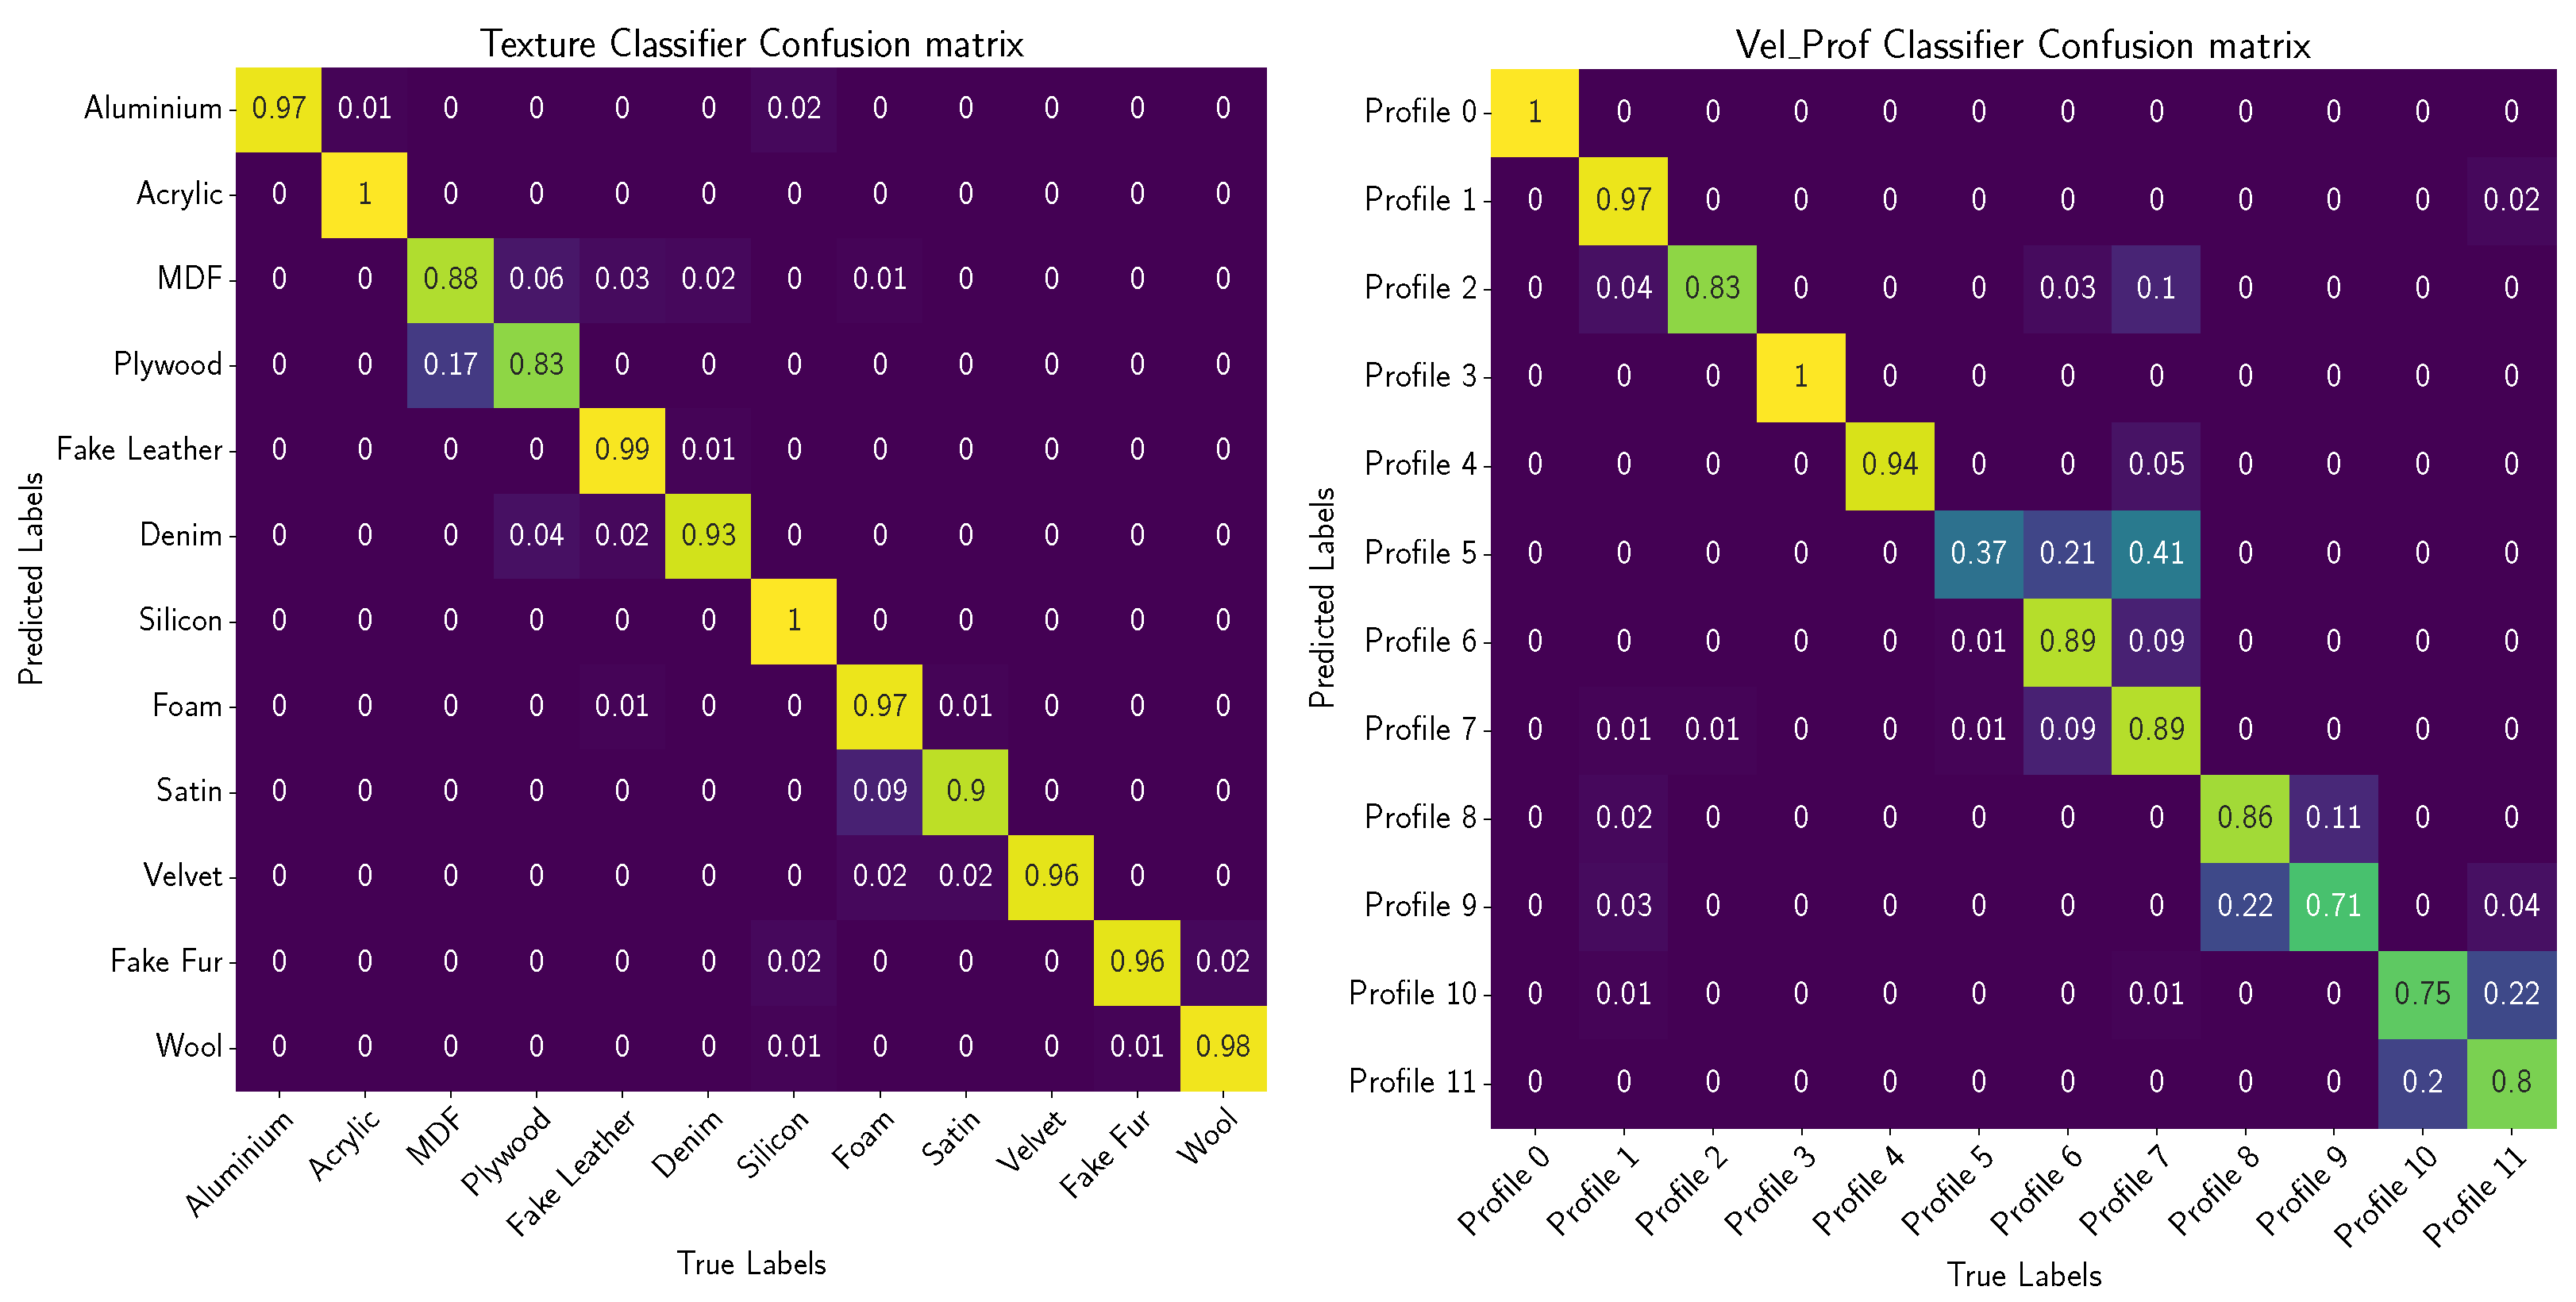
4.2.1. Texture Classifier
4.2.2. Velocity Profile Classifier
4.3. Metrics
4.3.1. Accuracy
4.3.2. Total Number of Weights
4.3.3. Spiking Activity
4.4. Optimisation Techniques
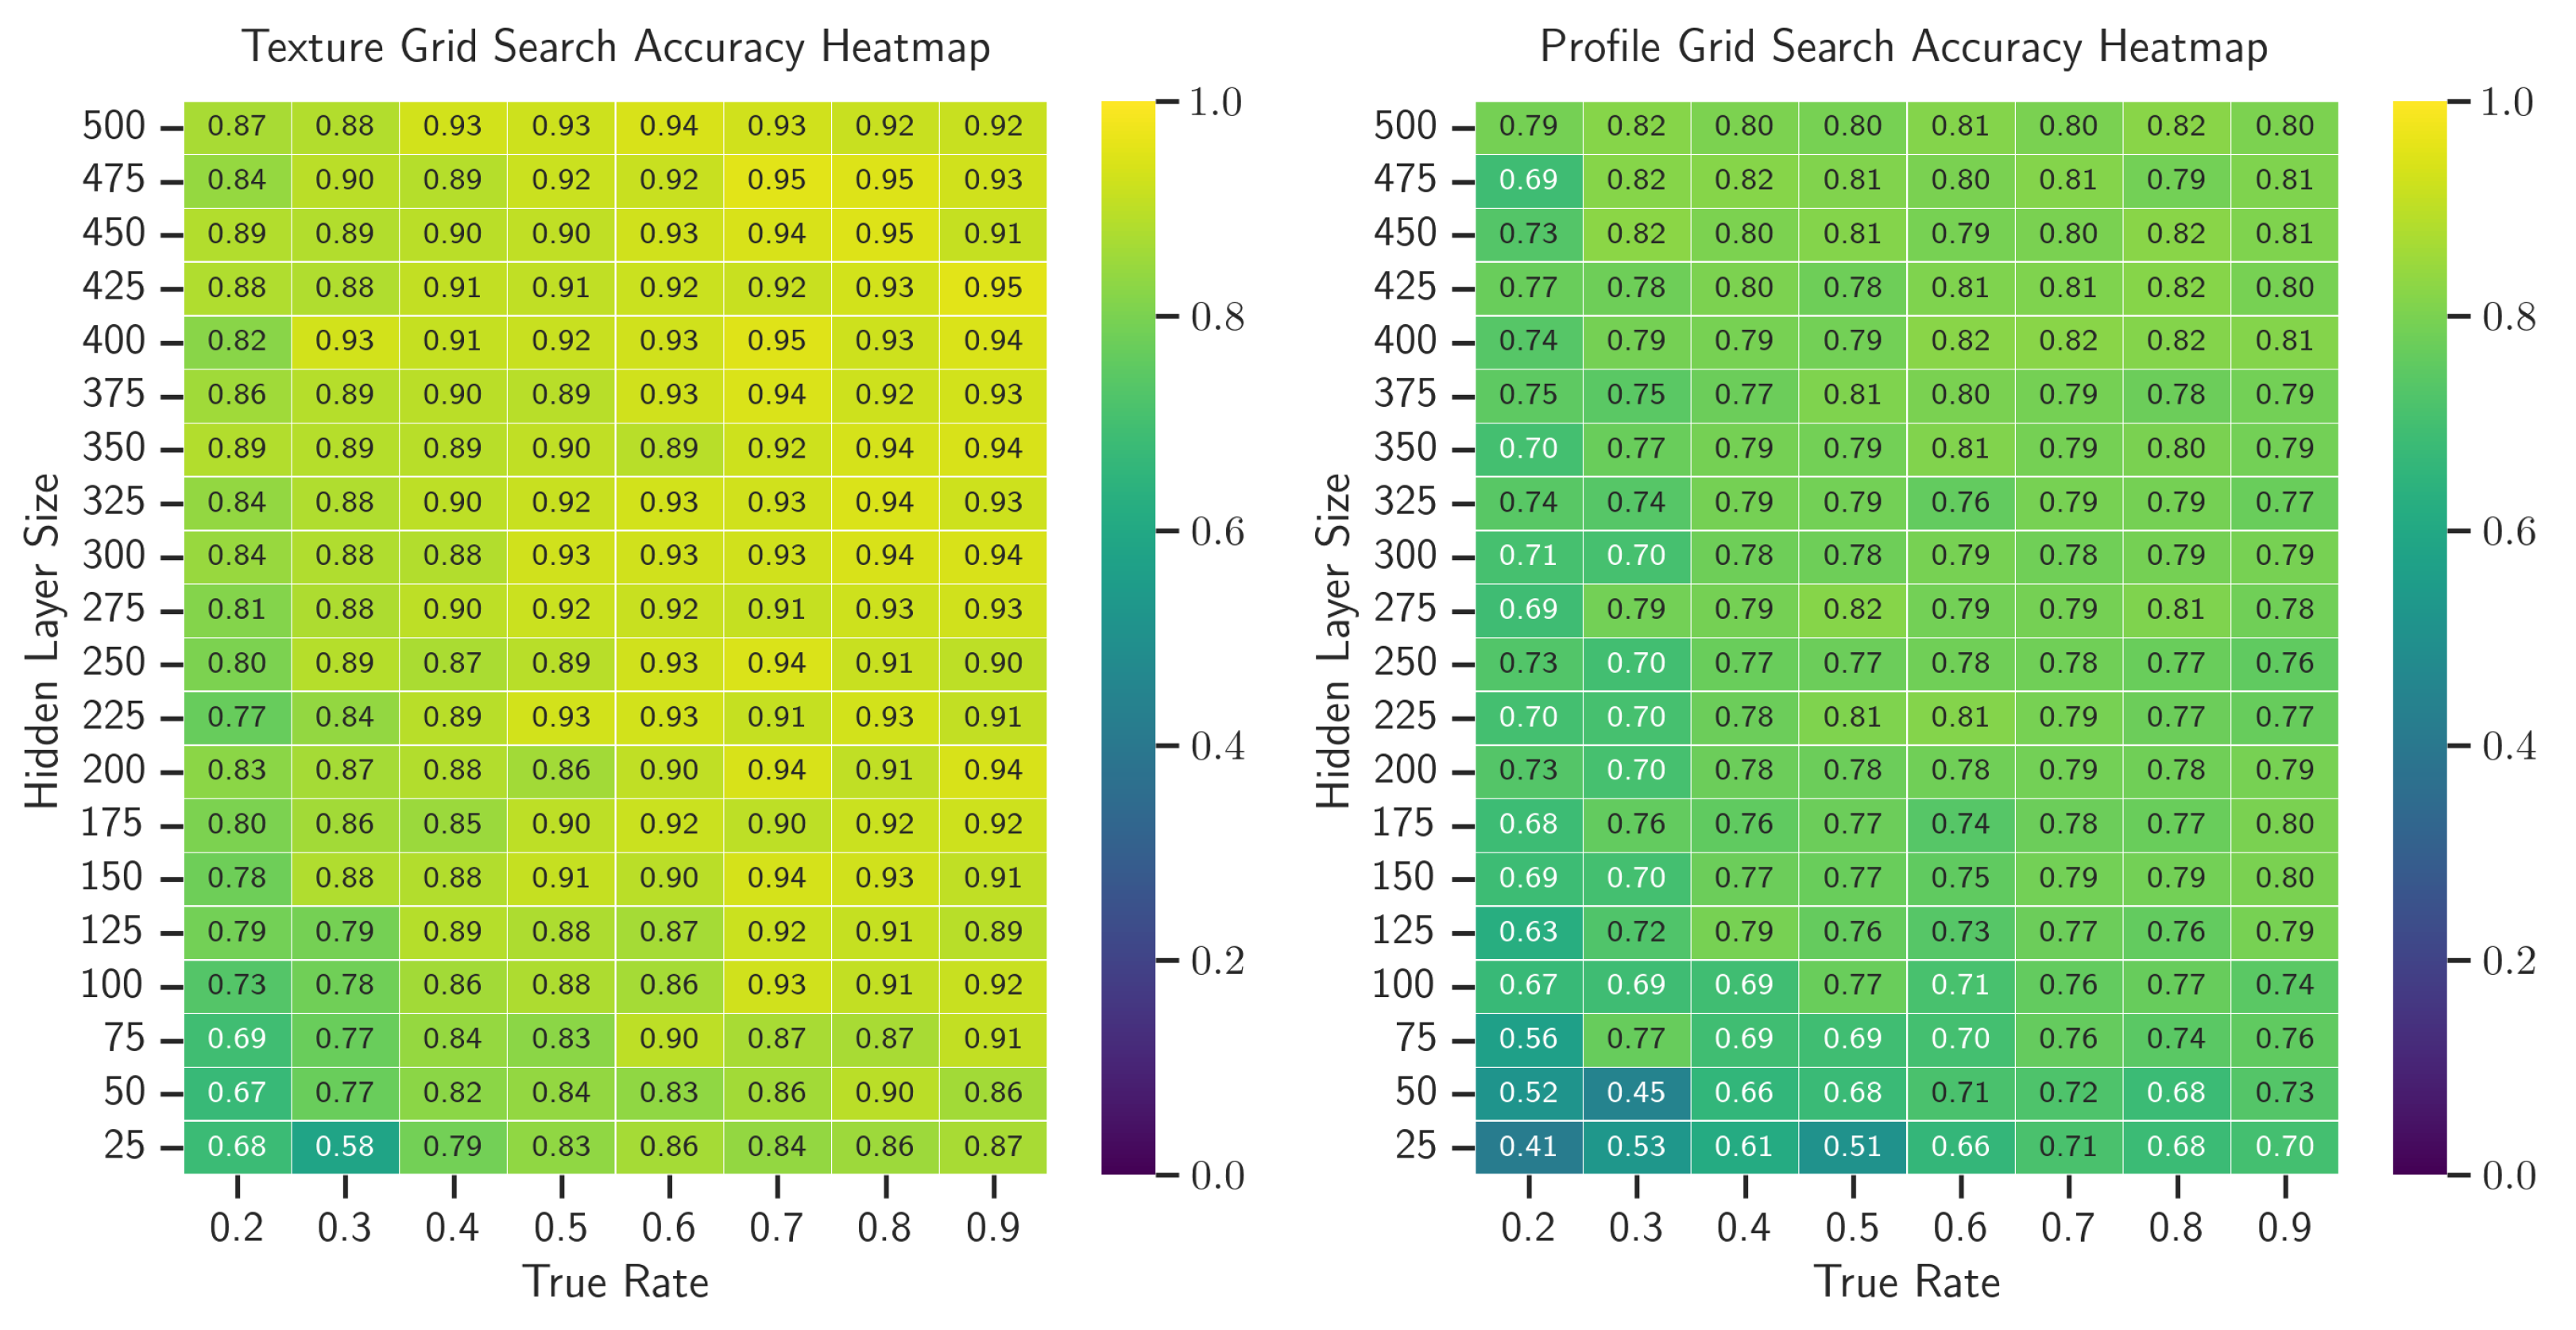
4.4.1. Grid Search
4.4.2. Pareto Frontier Analysis
5. Results
5.1. Data Inspection
5.2. Grid Search Results
5.3. Pareto Front Analysis
5.4. Comparative Analysis
6. Discussion
7. Conclusions
Author Contributions
Funding
Data Availability Statement
Conflicts of Interest
Abbreviations
| DOF | Degree of Freedom |
| MDF | Medium-Density Fiberboard |
| NN | Neural Network |
| SLAYER | Spike LAYer Error Reassignment algorithm |
| SNN | Spiking Neural Network |
| SOTA | State of The Art |
| SVM | Support Vector Machine |
References
- Liu, D.; Yu, H.; Chai, Y. Low-Power Computing with Neuromorphic Engineering. Adv. Intell. Syst. 2021, 3, 2000150. [Google Scholar] [CrossRef]
- Brayshaw, G.; Ward-Cherrier, B.; Pearson, M. A Neuromorphic System for the Real-time Classification of Natural Textures. In Proceedings of the 2024 IEEE International Conference on Robotics and Automation (ICRA), Yokohama, Japan, 13–17 May 2024. [Google Scholar]
- Zhu, J.; Zhang, T.; Yang, Y.; Huang, R. A comprehensive review on emerging artificial neuromorphic devices. Appl. Phys. Rev. 2020, 7, 011312. [Google Scholar] [CrossRef]
- Davies, M. Lessons from Loihi: Progress in Neuromorphic Computing. In Proceedings of the 2021 Symposium on VLSI Circuits, Kyoto, Japan, 13–19 June 2021; pp. 1–2, ISSN 2158-5636. [Google Scholar] [CrossRef]
- Singh, S.; Sarma, A.; Lu, S.; Sengupta, A.; Narayanan, V.; Das, C.R. Gesture-SNN: Co-optimizing accuracy, latency and energy of SNNs for neuromorphic vision sensors. In Proceedings of the 2021 IEEE/ACM International Symposium on Low Power Electronics and Design (ISLPED), Boston, MA, USA, 26–28 July 2021; pp. 1–6. [Google Scholar] [CrossRef]
- Davies, M.; Srinivasa, N.; Lin, T.H.; Chinya, G.; Cao, Y.; Choday, S.H.; Dimou, G.; Joshi, P.; Imam, N.; Jain, S.; et al. Loihi: A Neuromorphic Manycore Processor with On-Chip Learning. IEEE Micro 2018, 38, 82–99. [Google Scholar] [CrossRef]
- Orchard, G.; Frady, E.P.; Rubin, D.B.D.; Sanborn, S.; Shrestha, S.B.; Sommer, F.T.; Davies, M. Efficient Neuromorphic Signal Processing with Loihi 2. In Proceedings of the 2021 IEEE Workshop on Signal Processing Systems (SiPS), Coimbra, Portugal, 19–21 October 2021; pp. 254–259, ISSN 2374-7390. [Google Scholar] [CrossRef]
- DeBole, M.V.; Taba, B.; Amir, A.; Akopyan, F.; Andreopoulos, A.; Risk, W.P.; Kusnitz, J.; Ortega Otero, C.; Nayak, T.K.; Appuswamy, R.; et al. TrueNorth: Accelerating From Zero to 64 Million Neurons in 10 Years. Computer 2019, 52, 20–29. [Google Scholar] [CrossRef]
- Furber, S.B.; Galluppi, F.; Temple, S.; Plana, L.A. The SpiNNaker Project. Proc. IEEE 2014, 102, 652–665. [Google Scholar] [CrossRef]
- Björkman, M.; Bekiroglu, Y.; Högman, V.; Kragic, D. Enhancing visual perception of shape through tactile glances. In Proceedings of the 2013 IEEE/RSJ International Conference on Intelligent Robots and Systems, Tokyo, Japan, 3–7 November 2013; pp. 3180–3186, ISSN 2153-0866. [Google Scholar] [CrossRef]
- Bekiroglu, Y.; Song, D.; Wang, L.; Kragic, D. A probabilistic framework for task-oriented grasp stability assessment. In Proceedings of the 2013 IEEE International Conference on Robotics and Automation, Karlsruhe, Germany, 6–10 May 2013; pp. 3040–3047, ISSN 1050-4729. [Google Scholar] [CrossRef]
- Papakostas, T.; Lima, J.; Lowe, M. A large area force sensor for smart skin applications. In Proceedings of the 2002 IEEE SENSORS, Orlando, FL, USA, 12–14 June 2002; Volume 2, pp. 1620–1624. [Google Scholar] [CrossRef]
- Song, Z.; Yin, J.; Wang, Z.; Lu, C.; Yang, Z.; Zhao, Z.; Lin, Z.; Wang, J.; Wu, C.; Cheng, J.; et al. A flexible triboelectric tactile sensor for simultaneous material and texture recognition. Nano Energy 2022, 93, 106798. [Google Scholar] [CrossRef]
- Fishel, J.A.; Loeb, G.E. Sensing tactile microvibrations with the BioTac—Comparison with human sensitivity. In Proceedings of the 2012 4th IEEE RAS & EMBS International Conference on Biomedical Robotics and Biomechatronics (BioRob), Rome, Italy, 24–27 June 2012; pp. 1122–1127, ISSN 2155-1782. [Google Scholar] [CrossRef]
- Fishel, J.; Loeb, G. Bayesian Exploration for Intelligent Identification of Textures. Front. Neurorobotics 2012, 6, 4. [Google Scholar] [CrossRef]
- Ward-Cherrier, B.; Pestell, N.; Cramphorn, L.; Winstone, B.; Giannaccini, M.E.; Rossiter, J.; Lepora, N.F. The TacTip Family: Soft Optical Tactile Sensors with 3D-Printed Biomimetic Morphologies. Soft Robot. 2018, 5, 216–227. [Google Scholar] [CrossRef]
- Yuan, W.; Dong, S.; Adelson, E.H. GelSight: High-Resolution Robot Tactile Sensors for Estimating Geometry and Force. Sensors 2017, 17, 2762. [Google Scholar] [CrossRef]
- Brandli, C.; Berner, R.; Yang, M.; Liu, S.C.; Delbruck, T. A 240 × 180 130 dB 3 µs Latency Global Shutter Spatiotemporal Vision Sensor. IEEE J. Solid State Circuits 2014, 49, 2333–2341. [Google Scholar] [CrossRef]
- Ward-Cherrier, B.; Pestell, N.; Lepora, N.F. NeuroTac: A Neuromorphic Optical Tactile Sensor applied to Texture Recognition. In Proceedings of the 2020 IEEE International Conference on Robotics and Automation (ICRA), Paris, France, 31 May–31 August 2020; pp. 2654–2660, ISSN 2577-087X. [Google Scholar] [CrossRef]
- Brayshaw, G.; Ward-Cherrier, B.; Pearson, M. Temporal and Spatio-temporal domains for Neuromorphic Tactile Texture Classification. In Proceedings of the 2022 Annual Neuro-Inspired Computational Elements Conference (NICE ’22), Online, 28 March–1 April 2022; pp. 50–57. [Google Scholar] [CrossRef]
- Cao, G.; Jiang, J.; Bollegala, D.; Li, M.; Luo, S. Multimodal zero-shot learning for tactile texture recognition. Robot. Auton. Syst. 2024, 176, 104688. [Google Scholar] [CrossRef]
- Yang, J.H.; Kim, S.Y.; Lim, S.C. Effects of Sensing Tactile Arrays, Shear Force, and Proprioception of Robot on Texture Recognition. Sensors 2023, 23, 3201. [Google Scholar] [CrossRef] [PubMed]
- Lieber, J.D.; Bensmaia, S.J. The neural basis of tactile texture perception. Curr. Opin. Neurobiol. 2022, 76, 102621. [Google Scholar] [CrossRef] [PubMed]
- Boundy-Singer, Z.M.; Saal, H.P.; Bensmaia, S.J. Speed invariance of tactile texture perception. J. Neurophysiol. 2017, 118, 2371–2377. [Google Scholar] [CrossRef] [PubMed]
- Taunyazov, T.; Koh, H.F.; Wu, Y.; Cai, C.; Soh, H. Towards Effective Tactile Identification of Textures using a Hybrid Touch Approach. In Proceedings of the 2019 International Conference on Robotics and Automation (ICRA), Montreal, QC, Canada, 20–24 May 2019; pp. 4269–4275, ISSN 2577-087X. [Google Scholar] [CrossRef]
- Lima, B.M.R.; da Fonseca, V.P.; de Oliveira, T.E.A.d.; Zhu, Q.; Petriu, E.M. Dynamic Tactile Exploration for Texture Classification using a Miniaturized Multi-modal Tactile Sensor and Machine Learning. In Proceedings of the 2020 IEEE International Systems Conference (SysCon), Montreal, QC, Canada, 24 August–20 September 2020; pp. 1–7, ISSN 2472-9647. [Google Scholar] [CrossRef]
- Gupta, A.K.; Ghosh, R.; Swaminathan, A.N.; Deverakonda, B.; Ponraj, G.; Soares, A.B.; Thakor, N.V. A Neuromorphic Approach to Tactile Texture Recognition. In Proceedings of the 2018 IEEE International Conference on Robotics and Biomimetics (ROBIO), Kuala Lumpur, Malaysia, 12–15 December 2018; pp. 1322–1328. [Google Scholar] [CrossRef]
- Rostamian, B.; Koolani, M.; Abdollahzade, P.; Lankarany, M.; Falotico, E.; Amiri, M.; V. Thakor, N. Texture recognition based on multi-sensory integration of proprioceptive and tactile signals. Sci. Rep. 2022, 12, 21690. [Google Scholar] [CrossRef] [PubMed]
- Sachs, N.A.; Loeb, G.E. Development of a BIONic Muscle Spindle for Prosthetic Proprioception. IEEE Trans. Biomed. Eng. 2007, 54, 1031–1041. [Google Scholar] [CrossRef] [PubMed]
- Chen, W.; Khamis, H.; Birznieks, I.; Lepora, N.F.; Redmond, S.J. Tactile Sensors for Friction Estimation and Incipient Slip Detection—Toward Dexterous Robotic Manipulation: A Review. IEEE Sensors J. 2018, 18, 9049–9064. [Google Scholar] [CrossRef]
- James, J.W.; Pestell, N.; Lepora, N.F. Slip Detection With a Biomimetic Tactile Sensor. IEEE Robot. Autom. Lett. 2018, 3, 3340–3346. [Google Scholar] [CrossRef]
- Bulens, D.C.; Lepora, N.F.; Redmond, S.J.; Ward-Cherrier, B. Incipient Slip Detection with a Biomimetic Skin Morphology. In Proceedings of the 2023 IEEE/RSJ International Conference on Intelligent Robots and Systems (IROS), Detroit, MI, USA, 1–5 October 2023; pp. 8972–8978, ISSN 2153-0866. [Google Scholar] [CrossRef]
- Huynh, P.K.; Varshika, M.L.; Paul, A.; Isik, M.; Balaji, A.; Das, A. Implementing Spiking Neural Networks on Neuromorphic Architectures: A Review. arXiv 2022, arXiv:2202.08897. [Google Scholar] [CrossRef]
- Young, A.R.; Dean, M.E.; Plank, J.S.; S. Rose, G. A Review of Spiking Neuromorphic Hardware Communication Systems. IEEE Access 2019, 7, 135606–135620. [Google Scholar] [CrossRef]
- Ielmini, D.; Ambrogio, S. Emerging neuromorphic devices. Nanotechnology 2019, 31, 092001. [Google Scholar] [CrossRef] [PubMed]
- Guo, W.; Fouda, M.E.; Eltawil, A.M.; Salama, K.N. Neural Coding in Spiking Neural Networks: A Comparative Study for Robust Neuromorphic Systems. Front. Neurosci. 2021, 15, 638474. [Google Scholar] [CrossRef] [PubMed]
- Yamazaki, K.; Vo-Ho, V.K.; Bulsara, D.; Le, N. Spiking Neural Networks and Their Applications: A Review. Brain Sci. 2022, 12, 863. [Google Scholar] [CrossRef] [PubMed]
- Gallego, G.; Delbruck, T.; Orchard, G.; Bartolozzi, C.; Taba, B.; Censi, A.; Leutenegger, S.; Davison, A.J.; Conradt, J.; Daniilidis, K.; et al. Event-Based Vision: A Survey. IEEE Trans. Pattern Anal. Mach. Intell. 2022, 44, 154–180. [Google Scholar] [CrossRef]
- Falanga, D.; Kleber, K.; Scaramuzza, D. Dynamic obstacle avoidance for quadrotors with event cameras. Sci. Robot. 2020, 5, eaaz9712. [Google Scholar] [CrossRef] [PubMed]
- Ali, H.A.H.; Abbass, Y.; Gianoglio, C.; Ibrahim, A.; Oh, C.; Valle, M. Neuromorphic Tactile Sensing System for Textural Features Classification. IEEE Sensors J. 2024, 24, 17193–17207. [Google Scholar] [CrossRef]
- Macdonald, F.L.A.; Lepora, N.F.; Conradt, J.; Ward-Cherrier, B. Neuromorphic Tactile Edge Orientation Classification in an Unsupervised Spiking Neural Network. Sensors 2022, 22, 6998. [Google Scholar] [CrossRef] [PubMed]
- Hollins, M.; Bensmaïa, S.; Karlof, K.; Young, F. Individual differences in perceptual space for tactile textures: Evidence from multidimensional scaling. Percept. Psychophys. 2000, 62, 1534–1544. [Google Scholar] [CrossRef] [PubMed]
- Smith, A.M.; Basile, G.; Theriault-Groom, J.; Fortier-Poisson, P.; Campion, G.; Hayward, V. Roughness of simulated surfaces examined with a haptic tool: Effects of spatial period, friction, and resistance amplitude. Exp. Brain Res. 2010, 202, 33–43. [Google Scholar] [CrossRef]
- Callier, T.; Saal, H.P.; Davis-Berg, E.C.; Bensmaia, S.J. Kinematics of unconstrained tactile texture exploration. J. Neurophysiol. 2015, 113, 3013–3020. [Google Scholar] [CrossRef]
- Rizzo, C.P.; Schuman, C.D.; Plank, J.S. Neuromorphic Downsampling of Event-Based Camera Output. In Proceedings of the 2023 Annual Neuro-Inspired Computational Elements Conference (NICE ’23), San Antonio, TX, USA, 11–14 April 2023; pp. 26–34. [Google Scholar] [CrossRef]
- Shrestha, S.B.; Orchard, G. Slayer: Spike layer error reassignment in time. Adv. Neural Inf. Process. Syst. 2018, 3. [Google Scholar] [CrossRef]
- Cavallari, S.; Panzeri, S.; Mazzoni, A. Comparison of the dynamics of neural interactions between current-based and conductance-based integrate-and-fire recurrent networks. Front. Neural Circuits 2014, 8, 12. [Google Scholar] [CrossRef] [PubMed]
- Martinelli, F.; Dellaferrera, G.; Mainar, P.; Cernak, M. Spiking Neural Networks Trained with Backpropagation for Low Power Neuromorphic Implementation of Voice Activity Detection. In Proceedings of the ICASSP 2020–2020 IEEE International Conference on Acoustics, Speech and Signal Processing (ICASSP), Barcelona, Spain, 4–8 May 2020; pp. 8544–8548, ISSN 2379-190X. [Google Scholar] [CrossRef]
- Fontanini, R.; Esseni, D.; Loghi, M. Reducing the Spike Rate in Deep Spiking Neural Networks. In Proceedings of the Proceedings of the International Conference on Neuromorphic Systems (ICONS ’22), Knoxville, TN, USA, 27–29 July 2022; pp. 1–8. [Google Scholar] [CrossRef]
- Tušar, T.; Filipič, B. Visualization of Pareto Front Approximations in Evolutionary Multiobjective Optimization: A Critical Review and the Prosection Method. IEEE Trans. Evol. Comput. 2015, 19, 225–245. [Google Scholar] [CrossRef]
- Tiakas, E.; Papadopoulos, A.N.; Manolopoulos, Y. Skyline queries: An introduction. In Proceedings of the 2015 6th International Conference on Information, Intelligence, Systems and Applications (IISA), Corfu, Greece, 6–8 July 2015; pp. 1–6. [Google Scholar] [CrossRef]
- Esposito, D.; Savino, S.; Cosenza, C.; Gargiulo, G.D.; Fratini, A.; Cesarelli, G.; Bifulco, P. Study on the Activation Speed and the Energy Consumption of “Federica” Prosthetic Hand. In Proceedings of the XV Mediterranean Conference on Medical and Biological Engineering and Computing—MEDICON 2019, Coimbra, Portugal, 26–28 September 2019; Henriques, J., Neves, N., de Carvalho, P., Eds.; Springer: Cham, Switzerland, 2020; pp. 594–603. [Google Scholar] [CrossRef]
- Smail, L.C.; Neal, C.; Wilkins, C.; Packham, T.L. Comfort and function remain key factors in upper limb prosthetic abandonment: Findings of a scoping review. Disabil. Rehabil. Assist. Technol. 2021, 16, 821–830. [Google Scholar] [CrossRef] [PubMed]
- Iglesias, J.; Eriksson, J.; Grize, F.; Tomassini, M.; Villa, A.E.P. Dynamics of pruning in simulated large-scale spiking neural networks. Biosystems 2005, 79, 11–20. [Google Scholar] [CrossRef]
- Seoane, L.F. Evolutionary aspects of reservoir computing. Philos. Trans. R. Soc. B Biol. Sci. 2019, 374, 20180377. [Google Scholar] [CrossRef]
- Gaurav, R.; Stewart, T.C.; Yi, Y.C. Spiking Reservoir Computing for Temporal Edge Intelligence on Loihi. In Proceedings of the 2022 IEEE/ACM 7th Symposium on Edge Computing (SEC), Seattle, WA, USA, 5–8 December 2022; pp. 526–530. [Google Scholar] [CrossRef]


| Dataset | Number of Samples | Number of Textures | Number of Movements | Spatial Resolution (Pixels) | Sample Length (ms) |
|---|---|---|---|---|---|
| Raw Data | 14,400 | 12 | 12 | 640 × 480 | 1400–4800 |
| Processed Data | - | - | - | 78 × 78 | 1000 |
| Parameter | Search Space | Classifier | Peak Value |
|---|---|---|---|
| Hidden Layer Size | Texture | 425 | |
| 450 | |||
| True Rate | Texture | 0.9 | |
| 0.3 |
| Classifier | Method | Accuracy | S () | () |
|---|---|---|---|---|
| Texture | Peak | 0.95 | 9.07 | 2.59 |
| Pareto Accuracy | 0.95 | 9.07 | 2.59 | |
| Pareto Spiking Activity | 0.68 | 0.13 | 0.15 | |
| Pareto Network Size | 0.87 | 0.75 | 0.15 | |
| Peak | 0.83 | 1.70 | 2.74 | |
| Pareto Accuracy | 0.83 | 1.70 | 2.74 | |
| Pareto Spiking Activity | 0.42 | 0.08 | 0.15 | |
| Pareto Network Size | 0.71 | 0.54 | 0.15 |
Disclaimer/Publisher’s Note: The statements, opinions and data contained in all publications are solely those of the individual author(s) and contributor(s) and not of MDPI and/or the editor(s). MDPI and/or the editor(s) disclaim responsibility for any injury to people or property resulting from any ideas, methods, instructions or products referred to in the content. |
© 2024 by the authors. Licensee MDPI, Basel, Switzerland. This article is an open access article distributed under the terms and conditions of the Creative Commons Attribution (CC BY) license (https://creativecommons.org/licenses/by/4.0/).
Share and Cite
Brayshaw, G.; Ward-Cherrier, B.; Pearson, M.J. Simultaneous Velocity and Texture Classification from a Neuromorphic Tactile Sensor Using Spiking Neural Networks. Electronics 2024, 13, 2159. https://doi.org/10.3390/electronics13112159
Brayshaw G, Ward-Cherrier B, Pearson MJ. Simultaneous Velocity and Texture Classification from a Neuromorphic Tactile Sensor Using Spiking Neural Networks. Electronics. 2024; 13(11):2159. https://doi.org/10.3390/electronics13112159
Chicago/Turabian StyleBrayshaw, George, Benjamin Ward-Cherrier, and Martin J. Pearson. 2024. "Simultaneous Velocity and Texture Classification from a Neuromorphic Tactile Sensor Using Spiking Neural Networks" Electronics 13, no. 11: 2159. https://doi.org/10.3390/electronics13112159
APA StyleBrayshaw, G., Ward-Cherrier, B., & Pearson, M. J. (2024). Simultaneous Velocity and Texture Classification from a Neuromorphic Tactile Sensor Using Spiking Neural Networks. Electronics, 13(11), 2159. https://doi.org/10.3390/electronics13112159