Article

A Comprehensive Survey on Enabling Techniques in Secure and Resilient Smart Grids

1
School of Computer Science and Informatics, Cardiff University, Cardiff CF24 4AG, UK
2
School of Mathematics and Computer Science, University of Wolverhampton, Wolverhampton WV1 1LY, UK
*
Author to whom correspondence should be addressed.
Electronics 2024, 13(11), 2177; https://doi.org/10.3390/electronics13112177
Submission received: 27 April 2024 / Revised: 27 May 2024 / Accepted: 30 May 2024 / Published: 3 June 2024
(This article belongs to the Special Issue New Challenges in Cyber Security)

Abstract

:
Smart grids are a cornerstone of the transition to a decentralised, low-carbon energy system, which offer significant benefits, including increased reliability, improved energy efficiency, and seamless integration of renewable energy sources. However, ensuring the security and resilience of smart grids is paramount. Cyber attacks, physical disruptions, and other unforeseen threats pose a significant risk to the stability and functionality of the grid. This paper identifies the research gaps and technical hurdles that hinder the development of a robust and secure smart grid infrastructure. This paper addresses the critical gaps in smart grid security research, outlining the technical challenges and promising avenues for exploration by both the industry and academia. A novel framework designed to enhance the reliability and security of smart grids was proposed against cyber attacks, considering the interconnectedness of the physical and cyber components. The paper further explores future research trends and identifies the key open issues in the ongoing effort to strengthen the security and resilience of smart grids.

1. Introduction

The demand for smart grid technology has significantly increased over the past decade due to a convergence of the global market and government trends. In 2023, the global smart grid market reached USD 63 billion, with a projected Compound Annual Growth Rate (CAGR) of 16.2% expected until 2032 [1]. Microgrids serve as an illustrative example of the benefits and challenges within the broader context of smart grid development. Microgrids can significantly benefit the global demands for clean energy generation and diversity of power sources, relying on key enabling techniques, such as a robust physical infrastructure, cyber security measures, resilient control systems, and robust power networks.
A microgrid is a localised energy system that can operate independently of the larger power grid. It consists of distributed energy resources, such as solar panels, wind turbines, and energy storage systems, which are interconnected and managed through a central control system. Microgrids can also be connected to the larger power grid and operate in parallel with it. Microgrids show great potential to combat climate change in several ways: (1) reducing greenhouse gas emissions: microgrids can incorporate renewable energy sources, such as solar and wind, to generate electricity with little to no greenhouse gas emissions. This reduces the reliance on fossil fuels and helps to combat climate change. (2) Improving energy efficiency: microgrids can also improve energy efficiency by using energy storage systems to store excess energy and dispatch it when needed. This reduces the need for energy generation during periods of peak demand and can reduce the overall energy consumption. (3) Providing resilience: microgrids can also provide resilience during extreme weather events or other emergencies that disrupt the larger power grid. By operating independently of the grid, microgrids can continue to provide electricity to critical infrastructure, such as hospitals and emergency services, when the grid goes down. (4) Empowering local communities: microgrids can be owned and operated by local communities or organisations, providing them greater control over their energy supply and reducing the reliance on centralised power systems. This can also provide economic benefits by creating local jobs and reducing energy costs.
However, to implement microgrids, the following challenges need to be addressed: (1) cost: the upfront cost of designing, building, and operating a microgrid can be high, particularly for larger systems. This cost may be prohibitive for some communities or facilities. (2) Regulation: microgrids operate differently from traditional power grids and may not fit into the existing regulatory frameworks. This can create uncertainty and additional costs for microgrid developers. (3) Integration: microgrids must be integrated with the existing infrastructure, including the larger power grid and local distribution networks. This can be a complex process and may require significant planning and coordination. (4) Maintenance: microgrids require regular maintenance to ensure that they operate reliably and efficiently. This can be a challenge, particularly for remote or isolated microgrids. (5) Scalability: some microgrids may be too small to generate enough electricity to meet the needs of a larger community or facility. This can limit their scalability and may require the construction of multiple microgrids to meet the demand. (6) Cyber security: microgrids are vulnerable to cyber attacks, which could disrupt or disable the system. Ensuring the cyber security of a microgrid can be challenging and may require significant resources.
This work focuses on the cyber–physical security and resilience of smart grids by addressing the above challenges, specifically, focusing on the cyber attack detection/mitigation and resilient control systems in microgrids. Microgrids are a smart monolithic system including power generation, power transmission, and power distribution [2]. When traditional power grid infrastructures gradually adapt themselves to smart grid and microgrid concepts, they start to grow their dependencies on emerging technologies, such as smart technology, cyber–physical systems (CPSs), artificial intelligence, cyber security, edge computing, big data analytics, etc. [3]. The cyber security issues that existed in IT systems will remain in microgrids; what is more, some new cyber attacks appear during the microgrid operations.
This work will introduce the application and enabling techniques in microgrids, including distributed energy resources (DERs), a distributed management system (DMS), a power control system, advance metering infrastructure (AMI), energy scheduling, and dynamic pricing [4].
Because cyber–physical attacks can happen at any point through the information chain, this survey takes Secure Smart Grid Standard NISTIR 7628 [5] as a high-level security analysis framework and the National Infrastructure Advisory Council’s report: A Framework for Establishing Critical Infrastructure Resilience Goals (used as NIAC in this survey) [6], as a high-level resilience analysis framework, which details the operation actors from the ICT architecture and will be explained in the next section [3]. The main contribution of this work can be summarised as follows:
(1) We introduced the common cyber–physical attacks, communication protocols, and research testbed from the smart grid research and demonstrated various secure countermeasures and resilient technologies through four stages: securing communication channels, state estimation, detecting malicious attacks, and contingency responses for mitigation.
(2) This work proposed secure and resilient frameworks by considering cyber security measurements, redundancy and resilience, real-time monitoring, and situational awareness.
(3) This work investigated the specific challenges related to resilience in smart grids and microgrids, including grid disruptions, distributed energy resources (DERs) integration, security concerns, communication, and control systems.
The paper outlines a comprehensive framework for enhancing the security and resilience of smart grids, structured around critical analyses and proposed solutions spanning multiple dimensions. Section 2 lays the foundation with an exploration of secure and resilient frameworks. In Section 3, various cyber–physical attacks and real-world attack scenarios are introduced based on the frameworks. Section 4 delves into an array of defence and mitigation mechanisms, including the development of secure communication channels, advanced state estimation, robust attack detection strategies, comprehensive contingency responses, and the integration of testbeds within the contexts established in Section 2. Lastly, Section 5 confronts the challenges inherent in implementing these frameworks, proposing potential solutions that span the spectrum of security and resilience in smart grids.

2. Secure and Resilient Smart Grid Frameworks

The development of secure and resilient smart grid frameworks is essential for a comprehensive understanding of the power system structures, functions, and techniques. Such frameworks enable a systematic analysis of the vulnerabilities and existing cyber threats, facilitating the application of targeted protection, detection, and mitigation methods. This strategic approach is vital for safeguarding the specific functions, services, and infrastructures within the power system. It underscores the importance of these frameworks in ensuring the operational integrity, reliability, and security of our energy infrastructures against a backdrop of evolving cyber challenges.

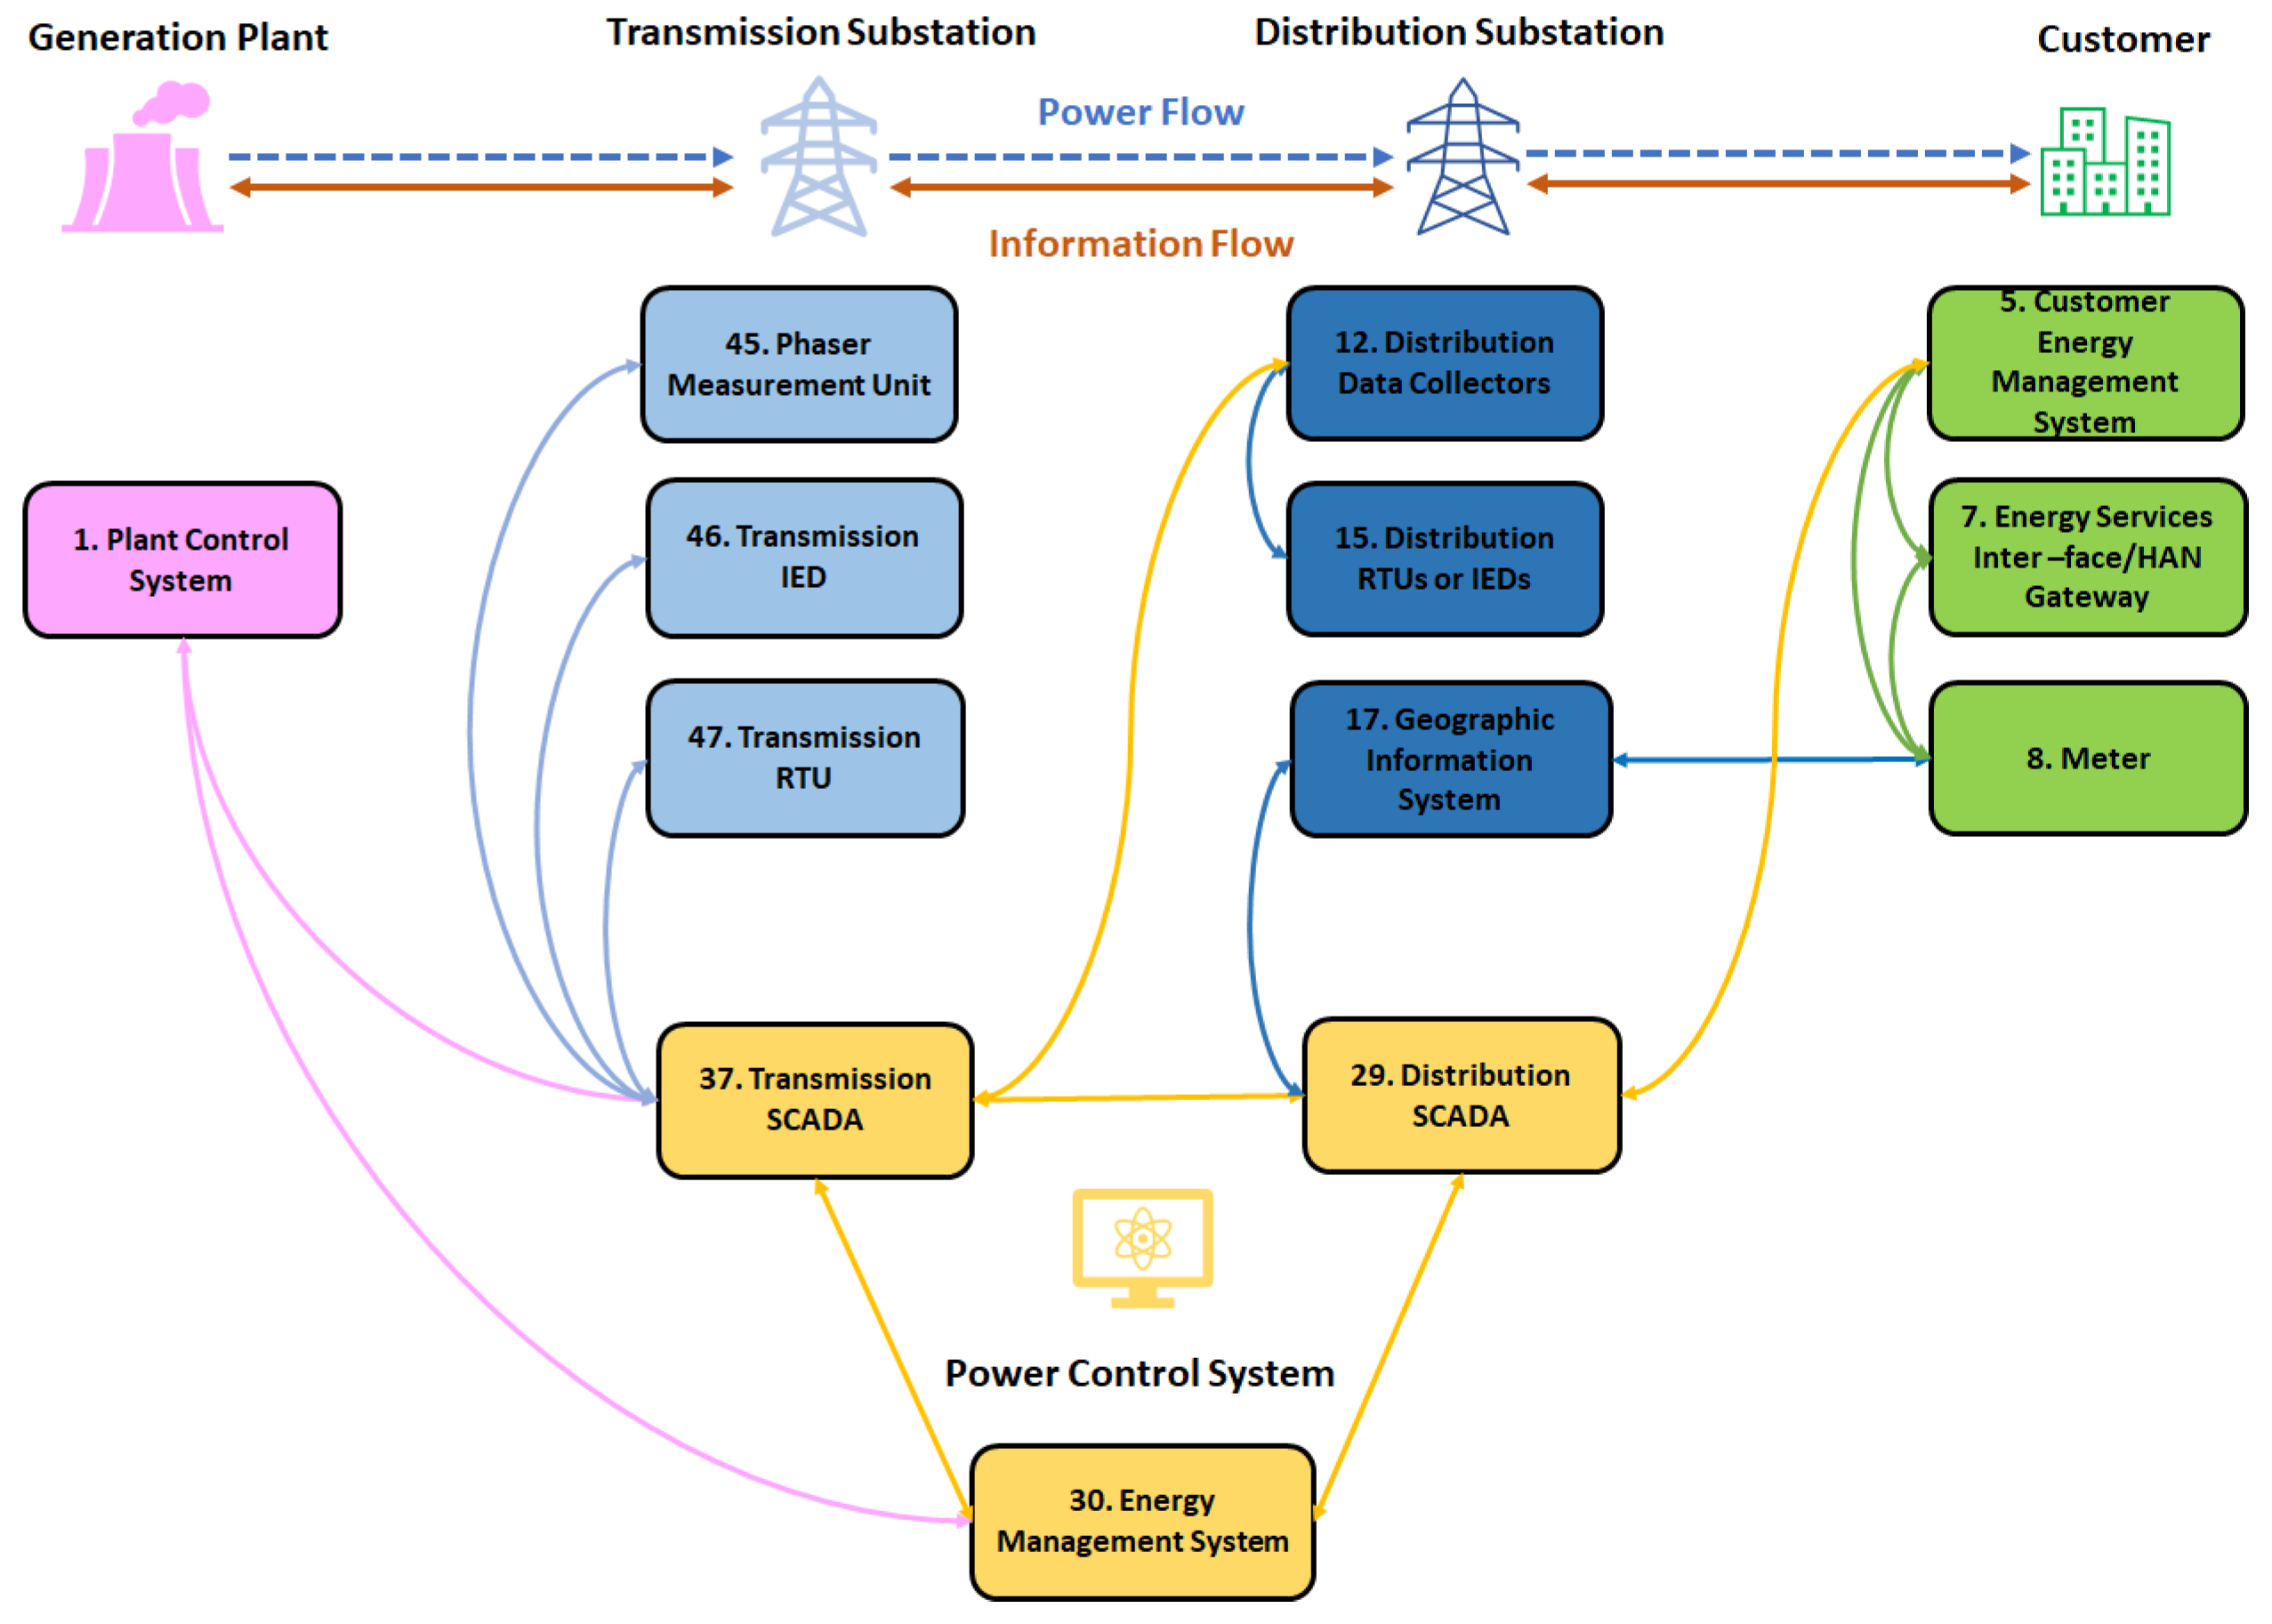
2.1. Secure Framework: NISTIR 7628 R1

According to NISTIR 7628 [5], the smart grid’s operation actors are divided into seven domains: marketing, operations, service provider, bulk generation, transmission, distribution, and customer. All these domains connect and interact with each other via over one-hundred-thirty different logical interfaces, which can be summarised into twenty-two interface categories based on two communication ends and the CIA requirements.
This work focuses on five main domains: bulk generation, operations, transmission, distribution, and customer. The related logical interface categories can be listed as follows: logical interface categories 1–4 describe the interface between control systems and equipment (e.g., category 37 represents the transmissions between SCADA and transmission substation equipment); logical interface categories 6–7 describe the interface between the control system and the same/different organisations (e.g., the information flow between 29/37 SCADAs and 30 EMS); logical interface category 10 refers to the interface between control systems and non-control/corporate systems (e.g., the information flow between the control system and 46, 47, 17, 5, and 7 non-control/corporate systems); and logical interface categories 11–12 denote the interfaces between the sensors and sensor networks/control system (e.g., the information collected by 12 and the information 12 communicated with control system 37). Figure 1 simplifies the process and the architecture of the smart grid.
The NISTIR 7628 framework provides readers with a better understanding of the smart grid structure, issues, and related security techniques; also, the logic reference model will benefit defence-in-depth security deployment because it defines each interface’s security (CIA) requirements.

2.2. Resilient Framework: NIAC

The National Infrastructure Advisory Council (NIAC) classified the four stages in the resilience framework with more detailed high-level concepts when the system encounters incidents: robustness, resourcefulness, rapid recovery, and adaptability [6,7], which are illustrated in Figure 2.
Robustness denotes the continuity ability of the smart grid when facing incidents, which refers to the infrastructure hardening and substitute/redundant system designed to support the grid to keep operating during an incident. Resourcefulness denotes the response prioritisation ability when incidents are happening, which relies more on skillful and experienced people to mitigate damage. Rapid recovery denotes the recovery ability of the smart grid after incidents, which requires detailed continuity plans and emergency operations to set the grid back to its normal state. Adaptability denotes the knowledge and experience gained from previous incidents, which involves revising the system operations, patching vulnerabilities, and applying new techniques to improve the system’s robustness, resourcefulness, and rapid recovery capabilities.

3. Smart Grid Cyber–Physical Attacks

The traditional power grid is a geographically distributed system, which mainly suffers from infrastructure exposure to the external environment throughout all weather conditions [8]. However, with the development of ICTs, the smart grid vulnerabilities have been expanded into the cyber–physical aspect.
Smart grid control systems have inherited the shortcomings from both the traditional IT infrastructure and the deployment of a Distributed Phaser Measurement Unit (PMU), which means traditional IT attacks like DoS attacks, false data injection, and Malware Injection are affecting smart grids. On the other hand, smart grid control systems are suffering from cyber–physical attacks, which are aimed at critical physical devices that operate in the control system. Once the critical devices in power systems like generators are cyber–physically attacked, it may cause irreversible damage to the devices.

3.1. Cyber–Physical Attacks

Depending on the system architecture, the CPSs’ controller can be normally classified into a centralised controller and distributed controller [9]. The centralised controller collects all the global measurements from the basic units or the secondary controllers, which will have a potential attacking surface in between the controller (PMU) and physical units [9]. In this case, cyber attacks mainly happen in logical interface category 10 (the interface between control systems and corporate systems), logical interface category 11 (the interface between sensors and sensor network), and logical interface category 12 (the interface between the sensor network and control system) [5,9]. The distributed controller, however, only collects the information from local units and neighbour controllers, which is widely used in distributed systems like microgrids [9]. The attacking surface is not only between controllers and local devices but also between controllers and neighbour units like logical interface 5, logical interface category 6, and logical interface category 20 [9].
According to the NISTIR 7628, cyber–physical attacks can commonly be classified into three types [5]:
  • Physical attacks informed from cyber, which utilise confidential information gathered from cyberspace. For example, with this information, attackers will be able to identify which substations and lines are on high load. Physical attacks against these critical infrastructures will cause more damage than random physical attacks.
  • Cyber attacks enhance physical attacks, which introduce cyber attacks into physical attacks to enlarge the damage or increase the attack/recovery duration. A typical example is attackers conducting DoS attacks after physical attacks to disrupt the recovery operations and enhance the attack consequences.
  • Cyber attacks cause physical damage, which compromises the cyber control systems and applies harmful operation instructions to cause physical damage. The Aurora attack introduced in Section 3.3 is an example.

3.2. Power System Attack Scenarios

Under the pressure of various cyber–physical attacks, the power systems are facing challenges from infrastructure vulnerabilities, operational vulnerabilities, energy efficiency, generation costs, extreme climate, etc. Table 1 examines some representative real-world power system attack scenarios and their devastating consequences in the real world.
Real-world power system attack scenarios are valuable resources for understanding the vulnerabilities and risks facing the power grid. As a critical national infrastructure, the power grid’s security and resilient architectures need to be studied and tested urgently to avoid any damage to the power system.

3.3. Denial of Service (DoS)

Data absence attacks in smart grid control systems are mainly referring to Denial of Service (DoS) attacks that comprise the data availability. A DoS attack refers to a type of network overflow attack, which will jam the traffic and prevent legitimate users or services from using the channel to communicate. In [13], the author summarised the DoS attack differences between smart grids and traditional networks: first, DoS attacks in smart grids are not targeting only timely and reliable access assets but also the control system, computing process, communication channels, or the power itself. Second, DoS attacks could affect state estimation. Combined with other attacks, DoS attacks can cause cyber–physical damage.
The DoS attack targets in the smart grid can be mainly classified into three categories: 1. smart grid communication protocols, 2. smart gird physical devices, and 3. smart grid applications [13]. There are several pieces of research regarding DoS attacks against smart grid communication protocols, such as IEC 61850 (substation automation) [14], ANSI C12.22/IEEE 1703 (AMI) [15], IEEE C37.118 (PMU) [16], and IEC 60870 (SCADA) [17]. Also, DoS attacks will prevent users from changing the routing protocol to mitigate the risks [18].
DoS attacks’ main focus is on smart grid devices, like smart meters, generators, PMUs, IEDs, RTUs, and PLCs; DoS and Distributed Denial of Service (DDoS) attacks can start from one specific or several distributed sources by transmitting malformed packages to exhaust the target’s network bandwidth and processing capacity [19]. One of the famous DoS attack cases happened in 2015 against a Ukrainian substation, resulting in a power outage [20].
The data sources that smart grid applications use, like Advanced Metering Infrastructure (AMI), Distribution Management System (DMS), and Wide Area Monitoring, Protection, and Control Systems (WAMPAC), are some of the DoS attack targets as well [13].
To sum up, the DoS attack’s main purpose in smart grids is to prevent the smart grid control system from receiving the control signals, or PMUs from receiving the data from sensors, which will lead to cascading blackouts and loss of availability to many infrastructures in the smart grid sectors [13].

3.4. False Data Injection (FDI)

False data injection attacks have been considered one of the most challenging issues in smart grids [19]. To successfully conduct an FDI attack, the attackers must have somewhat of an understanding of the configuration of the target power system, especially the system topology [21]. At the same time, the attackers will try to temper some of the values from smart meters either physically or manipulate the measurement data to keep the residuals the same, which will not be alarmed by bad data detection [22].
Farzam et al. analysed FDI attacks in detail, which can be classified by FDI attacks’ targets [19]. They proposed four different targets that FDI attacks usually aim at in a smart grid system: FDI attacks on state estimation, FDI attacks on voltage control, FDI attacks on frequency control, and FDI attacks on the protection system. In state estimation, more DC state estimation cases have been studied than AC state estimation due to simplicity. An FDI attack will pose a major threat to state estimation if the critical measurement data have been manipulated. The smart grid voltage value is usually controlled by power electronics-interfaced distributed generations and rotational-based generators. Modifying the measurement of voltage and control signals among the layers will impact the voltage regulation in the smart grid. Smart grid frequency control is sensitive to active powers, frequency measurements, and reference signals, which means any FDI attacks aiming at rotor speed or angle measurements will change the frequency stability. Protecting the system design is one of the main challenges of smart grids. FDI attacks against protection systems could affect the system performance and also lead to disaster events.
A network topology attack is one of the FDI attacks, which mainly aims to disorder the state estimation results by attacking the topology estimations. The stealthy topology attack could not only bypass bad data detection but also convince the control center of the new network topology. In [23], the author proved that stealthy topology attacks will be able to affect the state estimation and also the real-time locational marginal price (LMP).
Replay attacks in smart grids require attackers to gain access to PMUs first, then intercept and record the packages, including the measurements, for a period of time. At last, the attackers launch the replay attack by forwarding the captured packages to trick the smart grid and collect real measurement data for other malicious use. To sum up, a replay attack is one kind of FDI attack, which repeats stealthy data in a period to deceive the smart grid controlling system and aims at stealing electricity and causing physical damage without being detected. According to [18], reply attacks are difficult to detect by the control systems because of the limited capability of examining the cryptographic keys.
Another type of sophisticated false data injection attack is called a zero-dynamic attack (ZDA), which requires some knowledge from the target system [24,25]. The key element of zero-dynamic attacks is designing a residue attack signal that equals zero by adjusting the attack vectors against non-minimum phase systems [24,25]. ZDAs can cause serious damage to a smart grid because, even if the input data are geometrically changing, there will be little change in the output stage. Sometimes, it is also called a stealthy FDI attack.
Another well-known attack is the load redistribution attack, which only requires limited smart meters [2]. The load redistribution attack is one of the FDI attacks focusing on tempering the load buses’ power injection and line power flow measurements.

3.5. Advanced Cyber–Physical Attacks

Random attacks are a kind of attack that especially aims at the sensor readings rather than bypassing the detection system [26]. The random attack vector can be generated at any time by the attacker. According to the attacking period, an attack can be presented as either a short-term or long-term random attack.
Srivastava et al. [27] mentioned a unique cyber–physical attack called an Aurora-like attack, which refers to attacks specifically aiming at the breaker near a power generator. The attack leads to extreme torque by opening and closing the breaker rapidly, which may cause physical damage to the critical assets in smart grid power generators according to the Idaho National Lab [28]. The purpose of an Aurora-like attack is to disconnect as many generators as possible from the smart grid and then reconnect them to the grid out of synchronism. In [29], the author simulated the Aurora-like attack under the IEEE 9-buses 3-generators testbed.
Adversarial Machine Learning (AML) attacks have also been introduced in many works to exploit the vulnerabilities in the pre-trained data-driven IDS model. AML attacks can manipulate the measurement data like FDI attacks but aim at bypassing ML/DL-based IDSs [30]. In [30], Eirini demonstrated the adversarial samples designed for the Random Forest and J48 Decision Tree model. In [31], the author proposed an AML attack method against the RNN model that works under the black box scenario in the power system.

4. Security and Resilient Architecture

The security architecture in CPSs is commonly divided into three stages: protection, detection, and mitigation [28]. On the other hand, reliability and resilience ought to be considered throughout the entire smart grid framework. In this survey, these incidents are considered among all the aspects of cyber–physical attacks included in the previous section.
In a similar context, developing a secure and resilient smart grid architecture can be classified into secure communication channels (protection, prior to an incident), state estimation (detection, during an incident), detecting malicious attacks (detection, during an incident), and contingency response (mitigation, after an incident).

4.1. Secure and Resilient Communication Channels

Developing secure and resilient communication channels in smart grids can defend against the majority of malicious cyber attacks, which reflects security concern logical interface category 22 (the interface between security management consoles, networks, and systems) in NISTIR [5,28]. The confidentiality, integrity, and availability impact levels are all marked as high in category 22 [5]. In [32], the author listed four main communication technical challenges in the smart grid: (1) short latency and high reliability, (2) high-density random access, (3) reliable coverage, and (4) coexistence of H2H (human to human) and M2M (machine to machine) traffic.
To guarantee the security and resilience of the communication channel, there are three basic requirements: information security, communication reliability and scalability, and transmission latency [33].

4.1.1. Data Security and Vulnerabilities

Data security is defined as the first line in the defence-in-depth model. It ensures the security of information exchanges between every actor in the smart grid. Information security in a smart grid is usually guaranteed by secured communication protocol and advanced encryption algorithms, thus avoiding data jamming and data tampering.
The vulnerabilities and drawbacks of communication protocols used in smart grid are listed in [34]. The comparison between lightweight cryptography algorithms for IoT devices has been presented in [34]. They summarised that, compared to Advanced Encryption Standard (AES) [35], Blowfish, and Data Encryption Standard (DES) [36], the asymmetric algorithm Elliptic Curve Cryptography (ECC) is one of the most studied and secure algorithms because it requires fewer computing resources (capability, energy, and memory) than other algorithms when providing the equivalent security level.
The Sandia National Lab introduced a network segmentation concept called enclaves to ensure information security [37]. Enclaves separate smart grid networks via system functions, share physical locations, and similar security requirements rather than traditional IT network segmentation. In [38], Dong Jin presented a Software-Defined Networking (SDN) communication architecture, which first separates the network control function from the forwarding data function in the network devices in the communication network layer and then gathers all the collected data in the SDN control layer; finally, it provides the SDN application in the application layer. They utilised SDN to verify there are no loops, black holes, consistent updates, and incremental consistent updates existing in the communication channel to ensure information security.

4.1.2. Communication Reliability and Scalability

After ensuring information security, communication reliability and also scalability become the next stage of consideration. On the one hand, communication reliability refers to the situation when communication failures, re-transmitting packages, or discarding packages occurred [24]. On the other hand, smart communication scalability is also important because many renewable energy resources, smart IoT devices, smart meters, and smart vehicles are joining the smart grid and also the communication network [12].
Jin et al. provided SDN-based self-healing network management applications, which not only solve transmission failure and hardware resource limits but also deal with cyber attacks such as isolating compromised PMUs and establishing the best path for disconnecting non-compromised PMUs [38]. The SDN self-healing application is built into the ONOS platform and works in between the network control center and energy storage assets. The restoration connection is run by Dijkstra’s shortest path algorithm based on the dynamic topology in ONOS, which also supports multi-path forwarding [38].
Kulkarni et al. discussed the communication technologies in smart grids, listing the existing technologies for AMI communications by comparing their coverage and cost [39]: (1) special-purpose wired network connection, (2) cellular connection, (3) fixed broadband, (4) TV white space, (5) power line communications, (6) 802.15.4 mesh radio, and (7) Wi-Fi mesh radio. The auto-configure and reconfigure solutions also need to be studied at the same time. In the meantime, communication protocols resilience [40,41,42] and communication algorithms resilience need to be studied as well [43].

4.1.3. Transmission Delay

Many smart grid control system actions (like real-time state estimation and communication between the power supplier and consumer) require time-sensitive data. Many operations and services have max latency of the data; for example, the protective relay is in 4 ms, and the situational awareness monitor system based on PMU is in sub-seconds [19]. In this case, data transmission delay is also considered critical to data availability and smart grid operations. A Quality of Service (QoS) routing protocol can effectively reduce the transmission delay [44].
The transmission latency and reliability analysis in the distribution automation area was studied in [32,45]. In [38], an SDN model was developed collecting real-time network flow to create static network topologies and calculate QoS to guarantee the transmission delay. In [46], the authors used a method that combined code division multiple access (CDMA) and compressed sensing to solve the transmission delay problem in the meter reading process under sparse data arrival scenarios. Aparna et al. studied fog computing’s performance in response time, transmission delay, and energy management cost in 5G smart grid distributed network communication [47].

4.2. Power System State Estimation (PSSE)

PSSE is one of the fundamental applications in smart grids, which estimates accurate system state by collecting and analysing the meter measurements and power system models to prevent cyber–physical attacks [9,21]. Many important applications like contingency response and optimal flow calculation highly rely on state estimation. After receiving the measurement data, PSSE is usually finished in three stages: observability analysis, state estimation (SE), and bad data detection (BDD).
Observability analysis is to determine whether the state variables of a power system can be estimated using measurements from available sensors in the network. The state vector that SE usually refers to voltage magnitudes and phase angles on the power grid buses, which is used to evaluate system performances and reliability. State vector can also be formed as a three-phase model in polar coordination [48]. The BDD process usually comes after the state estimation, to check especially the false data attacks (FDI, replay attack, and zero-dynamic attack). The BDD process usually comes up with a residual signal based on the measurements and then compares the value with the predefined threshold. If the residual value exceeds the threshold value, it can be considered an attack. The state estimation on the AC power system is considered computationally complex and expensive due to the nonlinear model and calculating both real and reactive power [21]. As a result, many power systems use stable DC power systems to represent the AC model.
The observability analysis, measurement data, state estimation algorithms, and bad data detection algorithms for different state estimation systems (static state estimation, dynamic state estimation, and distribution system state estimation) are studied in detail.

4.2.1. Observability Analysis

Observability analysis is an important pre-process before the measurement data enter the state estimation stage. The observability analysis helps to identify the minimum number of sensors that are required to accurately estimate the state variables in the power system.
For SSE, the observability analysis is usually based on topological or numerical analysis models, such as checking the rank of the measurement Jacobin matrix, to determine whether the system is observable or not, which is a binary outcome [49,50].
For DSE, different from SSE observability’s binary outcome, it usually can be classified into strong or weak observable systems. The linear DSE observability is determined by the observability matrix’s full rank state; and, for non-linear DSE observability, the system can analyse the local observability and perform a linearisation analysis [51]. There are two feasible approaches for observability analysis: (1) use small signal approximation, which uses the first order linear approximations to analyse the system observability, and (2) use Lie derivation to build an observability matrix [49].
For DSSE, because of lacking real-time measurements, the observability analysis highly relies on pseudo measurements. The real-time measurements’ improvement, optimal placement, and resiliency against cyber–physical attacks are the study focus recently [52].

4.2.2. Measurement Data

Lacking measurement data will affect the observability analysis; as a result, classifying the different types of measurement data is necessary. The measurement data most works use can be classified into three categories: real-time measurement, pseudo measurement, and virtual measurement [53].
Real-time measurement refers to direct measurement data like bus voltage, current, and frequency via sensors or other monitoring equipment gathered by the SCADA system. Because of the high dependency on the bandwidth and reliability of the communication infrastructures, especially in large-scale or distributed power systems, it is hard to guarantee to obtain real-time measurements.
Pseudo measurement refers to the data generated by mathematical models (billing data and probability density) or algorithms (ML/DL) from historical system data when direct measurement is not possible or feasible [54]. Virtual measurements are typically characterised by low or zero-variance data, which can be effectively processed using the Lagrange multipliers algorithm [53].

4.2.3. Static State Estimation (SSE)

Most current power monitoring systems and energy management systems (EMSs) are based on the quasi-steady state system model and static state estimation model, which rely on slow scan rates and no timestamps measurements from SCADA systems [51,55]. State estimation is a knowledge-based approach to detecting malicious attacks. In a common steady DC power system model, the system state can be formulated using a linear regression model [21]
z = h ( x ) + ϵ
where z is the measurement vector usually includes bus voltage magnitude, power injections, and power line flow, x is the state vector including voltage angle and voltage magnitude, ϵ is the Gaussian measurement white noise with zero mean and covariance matrix, and h function is the Jacobian matrix related to power system topology [9,56,57]. The measurement residual is usually constructed with the help of weighted least-square observers and then compared with a predetermined threshold [18].
The measurement noise in PSSE usually uses the Gaussian distribution model; however, according to Pacific Northwest National Laboratory’s study, the measurement noise follows a “thick tail” non-Gaussian distribution model [58,59].
Weighted least square (WLS) is one of the commonly used traditional static state estimation approaches, which is based on the non-linear mathematical relations between the actual measurements and the state estimations. In WLS, the residuals are usually defined as a column vector, according to the regression model.
r = z h ( x ) = [ z 1 h ( x 1 ) , z 2 h ( x 2 ) , , z n h ( x n ) ] 1
The weighing matrix W can be represented as the inverse of the covariance matrix R in the WLS solution, which reflects the precision or reliability of the observations. Because the measurement error is the zero-mean, this means all measurement noise is independent and unrelated to each other. The variance ( σ 2 ) of the measurement errors can be used as an estimate of the uncertainty associated with each measurement.
W = R 1 = d i a g ( 1 σ 2 )
The WLS objective function is used to minimise the sum of the squares of the weighted residuals, which can be formulated below
J ( x ) = i = 1 m W r 2 = i = 1 m r T W r = [ z h ( x ) ] T W [ z h ( x ) ]
To minimise the objective function, the derivation J ( x ) needs to be calculated equal to 0, and X is the point, where H ( X ) is the Jacobian matrix, which refers to the partial derivatives of the model function h ( X ) with respect to the parameters X.
g ( X ) = ( r T W r ) X = H T ( X ) W r = 0
Non-linear WLS estimation is usually solved by the Gauss–Newton iterative algorithm, where is the k-th iteration of x, which has the Gain matrix calculated as
G ( x k ) = g ( x k ) x = H T ( x k ) W H ( x k )
The weights allow the WLS model to assign more weight to observations that are more reliable or have less error variance and less weight to observations that are less reliable or have more error variance, which provides more accurate and stable estimates of the regression coefficients for WLS. The WLS solution’s disadvantages are very obvious: it is not very robust and vulnerable to non-Gaussian processes, complex and highly non-linear systems, and cannot capture history records, even though it can process very fast [58,60]. Some SSE studies are listed in Table 2:

4.2.4. Dynamic State Estimation (DSE)

With the development of the distributed energy resources (DERs) infrastructure, especially when renewable energy, electric vehicles, and time-history-related Internet of Things devices are added into the system, the state of the power system is becoming more uncertain and unpredictable [57]. Compared with the SSE, DSE methods will be able to track the dynamic changes of device states and loads throughout time [57]. DSE models usually use current or previous state estimation values combined with the system’s physical model to predict future states (t + 1) [51]. However, some research is still based on that the power system is a quasi-static system and has Gaussian distributed noise because of the complexity. Other works focus on reducing the DSE complexity. In [65], the author mentioned that most works use partial measurements and hierarchical and decoupled methods to reduce the DSE model complexity. Some DSE studies are listed in Table 3:

4.2.5. Distribution System State Estimation (DSSE)

Compared to centralised PSSE, DSSE is more robust, and decentralised estimators are able to provide decentralised information from different system hierarchies divided according to geographical, topological, and measurement points [53,72]. Especially when the new generations of digital devices start to join the power grid, the study of DSSE is necessary.
In [73], Izudin points out that DSSE nowadays shares some similar features: 1. radial or weakly meshed topology, 2. high R/X ratios, 3. few real-time measurements, and 4. asymmetric construction and unbalanced loads. Lack of network observability (unless using pseudo measurements) makes the DSSE processes even harder to implement.
Dzafic and Pau proposed two main types of WLS state estimation methods: node-voltage estimator (NV-DSSE) and branch-current estimator (BC-DSSE) [74,75]. The differences mainly exist in the state variables, the simplifications of estimation, and the incorporation of heterogeneous measurements [53]. In NV-DSSE, voltage magnitudes and phase angles are usually used as the state vector. In BC-DSSE, pseudo measurements of power injections, power flows, and sometimes the slack bus voltage magnitudes are included in the state vector. However, because of the voltage measurements, the derivations of branch current are non-zero Jacobian terms, which makes the BC-DSSE method compute slower than NV-DSSE [53]. Some DSSE studies are listed in Table 4:

4.3. Attack Detection in Smart Grid

Detection of malicious attacks is another main security concern in smart grids [24]. Different from the traditional IDS in networks, detecting malicious attacks in cyber–physical Systems (CPS) like the smart grid is far more complex. Cyber attacks in the smart grid normally are reflected in the form of changing voltage, current, or phase in the system [78]. As a result, the detection strategy mainly depends on deleting or correcting the polluted data under cyber attacks [79].
The bad data detection methods are usually conducted after the state estimation process, which utilises the χ 2 detector and largest normalised residual (LNR) the most. The BDD process is used to validate the topology and the measurement data. However, a clever attacker can bypass the LNR by customising the attack vectors [56,58].

4.3.1. Largest Normalised Residual (LNR)

The LNR method uses the normalised residual of each measurement to identify the measurements with the largest deviation from the expected threshold. The measurement with the largest normalised residual is assumed to be bad and will be removed or corrected from the estimation process. The state estimation is then repeated using the remaining measurements, and the process is repeated until no bad measurements are left [80,81]. The normalised residual r i N is the deviation measurement of the residual that can be calculated using the following equation:
r i N = | r i | Ω i i = | r i | S i i R i i
in which Ω i i is the (i, i)-th element of the error covariance matrix, which combines the measurement noise and modeling errors. It represents the uncertainty of the i-th measurement, which takes into account both the measurement noise ϵ and the errors in the model used to estimate the measurement
Ω = E [ ϵ ϵ T ] = S R
in which S i i is the diagonal element of the inverse of the covariance matrix of the residual vector ϵ , which represents the variance of the residual between the measured and estimated values; R i i is the variance of the measurement noise in the i-th measurement. After identifying the measurement, there are two main solutions to process the data: (1) remove the bad data from the measurement dataset; however, the removal of bad data may result in the loss of observability in SE [80]; and (2) correct the bad data using the relation between measurement errors and residuals calculated following the equation below
z i c o r r = z i b a d R i i Ω i i r i
The LNR algorithm’s limitations are obvious; the LNR algorithm has to process the bad data sequentially and restart a WLS algorithm for SE. The computational complexity makes it difficult to handle multiple bad data simultaneously, which is not suitable for large-scale power systems [80].

4.3.2. Chi-Squared Detector

Then, the estimated value along with the original value are all fed into the χ 2 detector to make judgments. χ 2 detector is a proven effective and widely used detecting method in smart grids. Combined with the Kalman filter, the χ 2 detector can easily detect both the DoS attack and random attacks by comparing the estimate value to the original value [26,82]. It can be calculated as [26]
g k = r k T r k R i i
where r k is the Gaussian-distributed residuals, g k is χ 2 distributed. In this circumstance, the χ 2 detector is effective under the Kalman filter framework, which has high noise tolerance [26,83]. The goal is to compare g k value to the threshold, which is provided by the standard χ 2 table, to detect potential intrusion [9,26]. However, some FDI attacks like zero-dynamics attacks will adjust their attack vectors according to the target to bypass the χ 2 detector [24].

4.3.3. Data-Driven Detecting Method

Although the traditional attack detection methods can identify and mitigate some attacks, physical attacks and cyber–physical attacks are not usually considered in smart grid scenarios. In comparison, the anomaly-based method focuses on detecting abnormal behaviour patterns from normal behaviour data and also has several proposed approaches: the data mining method, the information theoretic-based method, and the artificial intelligence (AI)-based method [84]. In this case, anomaly-based IDS has the potential to encounter not only zero-day vulnerabilities but also cyber–physical attacks. Some data-driven attack detection methods are listed in Table 5.

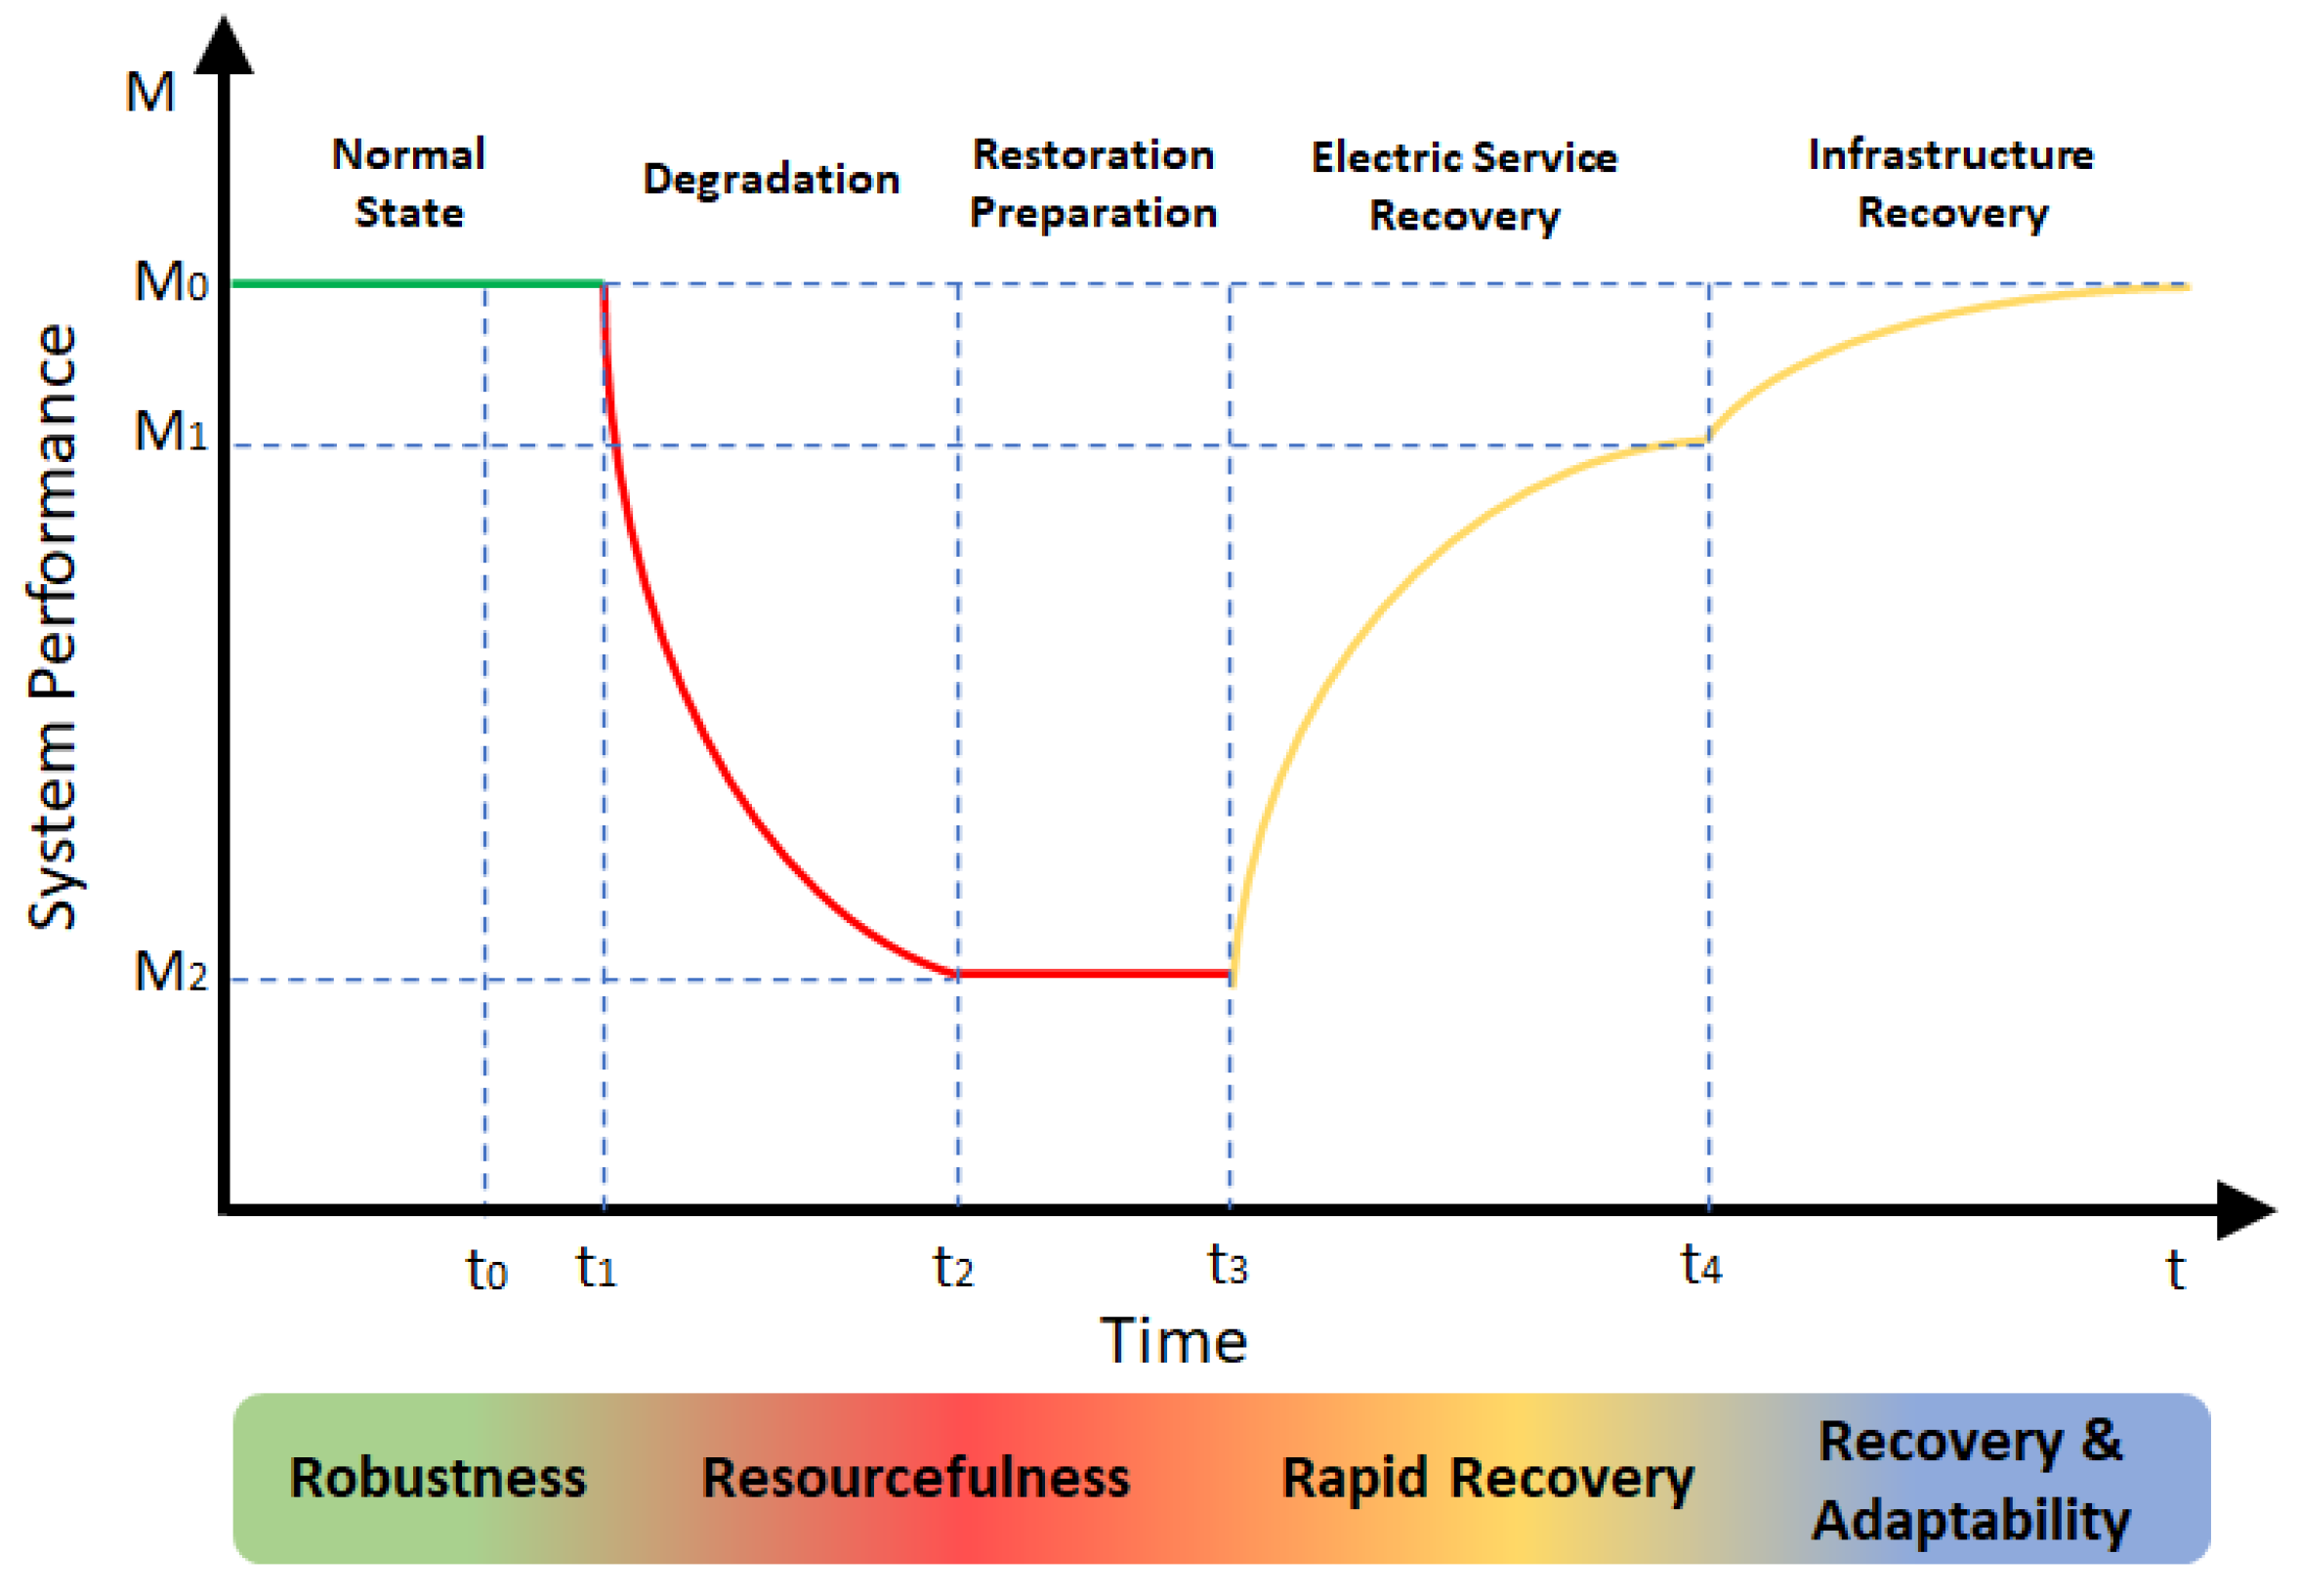
4.4. Contingency Response

According to NIAC, contingency response shows the resilient ability of the smart grid, which can be divided into three aspects: robustness, resourcefulness, and rapid recovery according to the periods of encountering an incident and adaptability after the incident.
The quantitative metrics method is commonly introduced in this period, which quantifies the system resilience capability during the different time periods of an incident. A general smart grid resilience framework during an incident is illustrated in Figure 3 [7,89].
The smart grid resiliency performance starts to degrade from time t 1 , which is the direct result of the incident. However, incidents like cyber–physical attacks happened before time t 1 , referring to the t 0 point. After the degradation, the smart grid system starts to analyse the incident and prepare for the restoration during t 2 t 3 . In t 3 t 4 , the smart grid initially recovers the critical electric services, and the grid will perform in an acceptable state M 1 . Then, after t 4 , the infrastructures gradually start to be recovered and adapt to new patched rules.

4.4.1. Robustness

The system resiliency performance between t 0 (incident start) and t 1 (degradation start) can be considered as the robustness capability of the smart grid. In [89], the author introduced the normalised degradation index (DI) to evaluate the system degradation extent according to the time t during the incident
D I = t 1 t 2 ( M 0 M ( t ) ) d t M 0 ( t 2 t 1 )
Ceeman Vellaithurai mentioned in [79] that North American Electric Reliability Corporation (NERC) regulates that the Electric Power Grid (EPG) should be able to operate normally in the “N-1” case; however, this regulation does not take cyber aspects’ impact into account. As a result, one of the security topics that has been discussed frequently is establishing a cyber–physical vulnerability model in the smart grid.
In another cyber–physical vulnerability-related report [27], A. Srivastava, focused on studying cyber–physical attacks like the Aurora-like attack against the smart grid. Commonly, the smart grid is able to handle “N-1” cases without any interruption; however, an Aurora-like cyber attack will lead to an “N-X” contingency, which means the grid could potentially lose multiple critical power assets (generators) simultaneously.
To improve the robustness of the smart grid, the common strategies include (1) hardening the power transmitting infrastructures; (2) managing the trees and flora near the transmitting lines; and (3) introducing substitute/redundant system design [90].

4.4.2. Resourcefulness

The resourcefulness capability of a smart grid during cyber–physical events is a critical element to mitigate the damage, which refers to the time period from t 2 (restoration preparation start) to t 3 (recovery process start). Gathering and analysing useful grid information to judge which part of the infrastructure is the attack/failure surface and which part is suffering the most, prioritizing every instruction, and applying suitable mitigation methods are the main steps in this period. The state estimation process plays a very important role in supporting the resourcefulness capability.
In [79], the author proposed a security assessment model CPINDEX, which relies on information flows in between assets, to develop a cyber-originated vulnerability ranking model for physical power system assets. First, they made use of information flows among system assets (files and processes) collected from IDS logs as the learning phase’s input. Next, they generated the Dependency Graph (DG) to demonstrate interactions and dependency relationships (a source object, a sink object, and their security contexts) between files and processes. Then, they used Bayesian network formalism to store probabilistic dependencies in DG. At last, all variables will be added to the Conditional Probability Table (CPT) and associated with vertexes, which provide CPINDEX with the calculated probability values of the critical computing assets.
In [27], the author proposed a two-step vulnerability ranking model. First, they developed a cybersecurity vulnerability ranking model to identify asset (power generators) vulnerabilities, and this model has 6 evaluating attributes: Discovery, Feasibility, Access, Detection, Threat, and Connection Speed. Secondly, for the physical vulnerability, they contributed a topology model, which uses the concept of vertex centrality, which is closeness centrality (shortest path matrix), to calculate coefficients to vertices changes in topology, which indicates the severity of state changes after the outrage happened. The closeness centrality algorithm is also capable of the “N-X” case.

4.4.3. Rapid Recovery

Rapid recovery refers to restoring the grid back to its normal operating state as soon as possible. Quickly adapt the system topology accordingly, and use the spare extra-high voltage transformers or transmission towers to reestablish the connections and services. In quantitative resilience metrics, the value restoration efficiency index (REI) is used to measure how efficient restoration progress is [89].
R E I = t 3 t 4 ( M ( t ) M 2 ) d t ( M 0 M 2 ) ( t 4 t 3 )
In [7,91], the authors proposed several solutions to have better restoration performance and strengthen smart grid resiliency 1. utilizing renewable energy resources and distributed voltage regulators, capacitor banks, and DERs to recover the electric service, 2. analysing customer demand and recovering the grid accordingly, 3. using electric vehicles to support the recovery process, 4. using self-generated electricity from local microgrids and enclaves, and 5. developing comprehensive operation-oriented measures and planning-oriented measures.

4.5. Smart Grid Testbed

4.5.1. Power System Simulators/Tools

Real Time Digital Simulator (RTDS) allows physical hardware-integrated and real-time power grid simulation. It can accurately simulate the physical response of the devices facing various attack scenarios [92].
DIgSILENT PowerFactory, on the contrary, is a software platform that only provides non-real-time simulation. It integrates different algorithms for state estimation and contingency response [93].
Power System Analysis Toolbox (PSAT) and YALMIP toolbox in Matlab can be used to analyse networks in small- and medium-scale power systems [55,94].

4.5.2. Real-World Testbed

Most of the real-world smart grid testbeds involve several research areas. As a result, for one specific testbed, it is hard to classify which type of testbed it belongs to; however, according to different smart grid configurations, the testbeds can be roughly divided based on their research bias. Nowadays, existing testbeds can be classified into the following categories: wide-area situational awareness; load balancing; decentralised power system structure; power storage; power transportation; cyber–physical threats; network communication; and AMI. In the cyber–physical study range, the related smart grid research areas are 1. large hardware-based testbeds, 2. cyber security analysing testbeds, 3. network communication testbeds, and 4. agent-based control testbeds [95].
Large hardware-based testbed uses real data acquisition and actuator devices like RTU, PMU, PLC, etc., which are really close to the real-world scenario. It is usually sponsored by nations due to its complexity and high expense. Some famous large hardware-based testbeds are the Idaho National Laboratory [96], the Jeju Island Smart Grid [97], and National Renewable Energy Laboratory [98].
Cyber security analysing testbeds mainly study potential security vulnerabilities and attack detection methods in all different aspects of the smart grid. For example, different devices like PLC, HMI, IED, etc., and different communication protocols like Modbus, DPN3, C37.118, etc. Some famous cyber security analysing testbeds are University College Dublin the intrusion and defense testbed [99], Queen’s University Belfast testbed [100], and SCADASim [101].
Network communication testbeds study various communication protocols, load balancing, and contingency responses, which focus on the resiliency of the smart grid. The testbeds are usually built on the simulation platforms (RTDS or PowerFactory) using actual devices like PMU and IED. Some famous network communication testbeds are Kansas State University testbed [102] and the University of North Carolina testbed [103].

5. Challenges in Smart Grids

5.1. Challenges in Communication Channels

As this paper discussed in Section 4.1, the communication security in the power grid needs to be reconsidered in many old/isolated infrastructures. The smart grid will be secure enough to face the new cyber–physical environments, from secure protocol cryptography [104,105,106] to physical layer security [107,108].
Smart grid communication reliability and scalability, as well as transmission delay (high QoS), are prioritised features in guaranteeing smart grid communication resilience. Especially, decentralised power infrastructures like electrical vehicles, renewable energy, and microgrids are proliferating nowadays; in many scenarios, the communication channels’ resiliency is difficult to guarantee in limited power, bandwidth, or adverse transmission environments [109,110,111,112,113,114]. For this challenge, mixing wired and wireless hybrid communication methods may provide more resiliency [115].

5.2. Challenges in State Estimation

As one of the most critical components in energy management systems, state estimation has been challenged through more dispersed generation, demand-responsive loads, data-rate devices, and advanced cyber attacks [116]. On the one hand, extending the conventional SE approaches to distribution system state estimation (DSSE) is challenging because the radial or weakly meshed topology will cause observability problems, high R/X ratios for cable, few real-time measurements lead to low estimation accuracy, and unbalanced loads result in high computational complexity [73,117]. On the other hand, cyber attacks like replay attacks, stealthy FDI attacks, and other advanced attacks continuously challenge state estimation.
Future research in the field of distribution system state estimation (DSSE) should focus on the integration of Demand Response (DR) programs and the price sensitivity of active distribution networks, addressing the challenges of uncertainty and variability [116]. Exploring data-driven methods for system monitoring and learning before, during, and after high-impact, low-frequency (HILF) events is essential. These efforts aim to improve the distribution system observability and develop effective system restoration strategies that leverage the real-time knowledge of system states, thereby ensuring resilience and efficiency in future distribution systems with high penetration of renewable resources and DR capabilities [118].

5.3. Challenges in Attack Detection

Implementing accurate and robust detection methods across different scales of power systems presents a daunting task, compounded by the need for cost and resource efficiency. Moreover, these systems must be straightforward to integrate, maintain, and upgrade with the existing infrastructure, ensuring minimal disruption and maximum compatibility.
Additionally, the increasing sophistication of cyber attacks, fueled by the advancements in AI and machine learning, necessitates the continuous adaptation and improvement of detection technologies. This calls for a collaborative effort between researchers, industry experts, and policymakers to develop standards and practices that enhance the security and resilience of smart grids against the evolving threats. In [119], the author points out that game theory and reinforcement learning approaches may be the future research directions because they use minimum data to analyse complex power system models.

5.4. Challenges Regarding Contingency Responses

The challenges regarding the contingency responses within smart grids are multifaceted, primarily due to the absence of a real-time, convincing qualitative resilience index or a reliable metric that can accurately reflect the grid’s resilience or reliability in the face of disruptions. The traditional approaches to measuring grid resilience have relied heavily on historical high-impact, low-frequency (HILF) events, utilizing metrics such as the SAIFI (System Average Interruption Frequency Index), SAIDI (System Average Interruption Duration Index), and LOLP (Loss of Load Probability) [120].
Furthermore, the integration of renewable energy sources, the proliferation of electric vehicles, and the advent of microgrids have significantly increased the complexity and volatility of power systems [121]. These developments require a shift towards more adaptive, real-time resilience assessment tools that can accommodate the rapidly changing energy landscape and ensure robust contingency response mechanisms. Future research could benefit from incorporating Explainable Artificial Intelligence (XAI) into performance-based resilience and reliability assessments. This integration aims to enhance user comprehension by offering clear insights into the system states before, during, and after events and ensuring that the users are well-informed in terms of system management and contingency responses.

6. Conclusions and Discussion

In conclusion, this survey paper has provided a comprehensive overview of the vulnerabilities in smart grids, along with secure and resilient techniques by leveraging the secure architecture NISTIR 7680 and the resilient framework NIAC. This survey analysed the latest cyber–physical attacks and representative real-world attack scenarios. Additionally, this survey has introduced research results on secure and resilient communication channels, state estimations, attack detection methods, and contingency responses, while also providing information on simulation and real-world testbeds.
Despite the existing solutions, challenges remain in the quest for a more secure and resilient smart grid. Nonetheless, we hope that this survey has provided valuable insights and knowledge that can help researchers to better navigate the complex landscape of smart grids.

Author Contributions

Conceptualisation, X.W. and S.L.; Methodology, X.W. and S.L.; Validation, X.W. and S.L.; Writing—original draft preparation, X.W.; Writing—review and editing, S.L., X.W. and M.A.R.; Visualisation, X.W.; Supervision, S.L. All authors have read and agreed to the published version of the manuscript.

Funding

This research received no external funding.

Data Availability Statement

Data are contained within the article.

Conflicts of Interest

The authors declare no conflicts of interest.

References

  1. Ankit Gupta, Smart Grid Market Report by Component (Software, Hardware, Services), End-User (Residential, Commercial, Industrial), and Region 2024–2032; Market Research Report. 2023. Available online: https://www.marketresearchfuture.com/reports/smart-grid-market-1110 (accessed on 31 May 2024).
  2. Zhang, H.; Liu, B.; Wu, H. Smart Grid Cyber-Physical Attack and Defense: A Review. IEEE Access 2021, 9, 29641–29659. [Google Scholar] [CrossRef]
  3. Panteli, M.; Kirschen, D.S. Assessing the effect of failures in the information and communication infrastructure on power system reliability. In Proceedings of the 2011 IEEE/PES Power Systems Conference and Exposition, Phoenix, AZ, USA, 20–23 March 2011; pp. 1–7. [Google Scholar] [CrossRef]
  4. Ma, S.; Zhang, H.; Xing, X. Scalability for Smart Infrastructure System in Smart Grid: A Survey. Wirel. Pers. Commun. 2018, 99, 161–184. [Google Scholar] [CrossRef]
  5. Committee, S.G.C. NISTIR 7628 Revision 1 Guidelines for Smart Grid Cybersecurity; NIST: Gaithersburg, MD, USA, 2014; Volume 3. [Google Scholar] [CrossRef]
  6. Berkeley, A.R.; Wallace, M.; Coo, C. A framework for establishing critical infrastructure resilience goals. In Final Report and Recommendations by the Council; National Infrastructure Advisory Council: Washington, DC, USA, 2010; pp. 18–21. [Google Scholar]
  7. Haggi, H.; Song, M.; Sun, W. A Review of Smart Grid Restoration to Enhance Cyber-Physical System Resilience. In Proceedings of the 2019 IEEE Innovative Smart Grid Technologies—Asia (ISGT Asia), Chengdu, China, 21–24 May 2019; pp. 4008–4013. [Google Scholar] [CrossRef]
  8. Das, L.; Munikoti, S.; Natarajan, B.; Srinivasan, B. Measuring smart grid resilience: Methods, challenges and opportunities. Renew. Sustain. Energy Rev. 2020, 130, 109918. [Google Scholar] [CrossRef]
  9. Tan, S.; Guerrero, J.M.; Xie, P.; Han, R.; Vasquez, J.C. Brief Survey on Attack Detection Methods for Cyber-Physical Systems. IEEE Syst. J. 2020, 14, 5329–5339. [Google Scholar] [CrossRef]
  10. Li, Y.; Yan, J. Cybersecurity of Smart Inverters in the Smart Grid: A Survey. IEEE Trans. Power Electron. 2023, 38, 2364–2383. [Google Scholar] [CrossRef]
  11. Ding, J.; Qammar, A.; Zhang, Z.; Karim, A.; Ning, H. Cyber Threats to Smart Grids: Review, Taxonomy, Potential Solutions, and Future Directions. Energies 2022, 15, 6799. [Google Scholar] [CrossRef]
  12. Gungor, V.C.; Sahin, D.; Kocak, T.; Ergut, S.; Buccella, C.; Cecati, C.; Hancke, G.P. Smart Grid Technologies: Communication Technologies and Standards. IEEE Trans. Ind. Inform. 2011, 7, 529–539. [Google Scholar] [CrossRef]
  13. Huseinović, A.; Mrdović, S.; Bicakci, K.; Uludag, S. A Survey of Denial-of-Service Attacks and Solutions in the Smart Grid. IEEE Access 2020, 8, 177447–177470. [Google Scholar] [CrossRef]
  14. Hong, J.; Liu, C.C.; Govindarasu, M. Detection of cyber intrusions using network-based multicast messages for substation automation. In Proceedings of the ISGT 2014, Washington, DC, USA, 19–22 February 2014; pp. 1–5. [Google Scholar] [CrossRef]
  15. Jin, D.; Zheng, Y.; Zhu, H.; Nicol, D.M.; Winterrowd, L. Virtual Time Integration of Emulation and Parallel Simulation. In Proceedings of the 2012 ACM/IEEE/SCS 26th Workshop on Principles of Advanced and Distributed Simulation (PADS’12), Zhangjiajie, China, 15–19 July 2012; pp. 201–210. [Google Scholar] [CrossRef]
  16. Morris, T.H.; Pan, S.; Adhikari, U. Cyber security recommendations for wide area monitoring, protection, and control systems. In Proceedings of the 2012 IEEE Power and Energy Society General Meeting, San Diego, CA, USA, 22–26 July 2012; pp. 1–6. [Google Scholar] [CrossRef]
  17. Choi, K.; Chen, X.; Li, S.; Kim, M.; Chae, K.; Na, J. Intrusion Detection of NSM Based DoS Attacks Using Data Mining in Smart Grid. Energies 2012, 5, 4091–4109. [Google Scholar] [CrossRef]
  18. Ding, D.; Han, Q.L.; Xiang, Y.; Ge, X.; Zhang, X.M. A survey on security control and attack detection for industrial cyber-physical systems. Neurocomputing 2018, 275, 1674–1683. [Google Scholar] [CrossRef]
  19. Nejabatkhah, F.; Li, Y.W.; Liang, H.; Reza Ahrabi, R. Cyber-Security of Smart Microgrids: A Survey. Energies 2021, 14, 27. [Google Scholar] [CrossRef]
  20. Radoglou-Grammatikis, P.I.; Sarigiannidis, P.G. Securing the Smart Grid: A Comprehensive Compilation of Intrusion Detection and Prevention Systems. IEEE Access 2019, 7, 46595–46620. [Google Scholar] [CrossRef]
  21. Liu, Y.; Ning, P.; Reiter, M.K. False Data Injection Attacks against State Estimation in Electric Power Grids. ACM Trans. Inf. Syst. Secure. 2011, 14, 13. [Google Scholar] [CrossRef]
  22. Li, Y.; Wei, X.; Li, Y.; Dong, Z.; Shahidehpour, M. Detection of False Data Injection Attacks in Smart Grid: A Secure Federated Deep Learning Approach. IEEE Trans. Smart Grid 2022, 13, 4862–4872. [Google Scholar] [CrossRef]
  23. Kim, J.; Tong, L. On Topology Attack of a Smart Grid: Undetectable Attacks and Countermeasures. IEEE J. Sel. Areas Commun. 2013, 31, 1294–1305. [Google Scholar] [CrossRef]
  24. Peng, C.; Sun, H.; Yang, M.; Wang, Y.L. A Survey on Security Communication and Control for Smart Grids Under Malicious Cyber Attacks. IEEE Trans. Syst. Man Cybern. Syst. 2019, 49, 1554–1569. [Google Scholar] [CrossRef]
  25. Pasha, S.A.; Ayub, A. Zero-dynamics attacks on networked control systems. J. Process Control 2021, 105, 99–107. [Google Scholar] [CrossRef]
  26. Manandhar, K.; Cao, X.; Hu, F.; Liu, Y. Detection of Faults and Attacks Including False Data Injection Attack in Smart Grid Using Kalman Filter. IEEE Trans. Control Netw. Syst. 2014, 1, 370–379. [Google Scholar] [CrossRef]
  27. Srivastava, A.; Morris, T.; Ernster, T.; Vellaithurai, C.; Pan, S.; Adhikari, U. Modeling Cyber-Physical Vulnerability of the Smart Grid With Incomplete Information. Smart Grid IEEE Trans. 2013, 4, 235–244. [Google Scholar] [CrossRef]
  28. He, H.; Yan, J. Cyber-physical attacks and defences in the smart grid: A survey. IET Cyber-Phys. Syst. Theory Appl. 2016, 1, 13–27. [Google Scholar] [CrossRef]
  29. Pan, S.; Morris, T.; Adhikari, U. Classification of Disturbances and Cyber-Attacks in Power Systems Using Heterogeneous Time-Synchronized Data. IEEE Trans. Ind. Inform. 2015, 11, 650–662. [Google Scholar] [CrossRef]
  30. Anthi, E.; Williams, L.; Rhode, M.; Burnap, P.; Wedgbury, A. Adversarial attacks on machine learning cybersecurity defences in Industrial Control Systems. J. Inf. Secur. Appl. 2021, 58, 102717. [Google Scholar] [CrossRef]
  31. Chen, Y.; Tan, Y.; Deka, D. Is Machine Learning in Power Systems Vulnerable? In Proceedings of the 2018 IEEE International Conference on Communications, Control, and Computing Technologies for Smart Grids (SmartGridComm), Aalborg, Denmark, 29–31 October 2018; pp. 1–6. [Google Scholar] [CrossRef]
  32. Cheng, P.; Wang, L.; Zhen, B.; Wang, S. Feasibility study of applying LTE to Smart Grid. In Proceedings of the 2011 IEEE First International Workshop on Smart Grid Modeling and Simulation (SGMS), Brussels, Belgium, 17 October 2011; pp. 108–113. [Google Scholar] [CrossRef]
  33. Xu, Y.; Zhang, J.; Wang, W.; Juneja, A.; Bhattacharya, S. Energy router: Architectures and functionalities toward Energy Internet. In Proceedings of the 2011 IEEE International Conference on Smart Grid Communications (SmartGridComm), Brussels, Belgium, 17–20 October 2011; pp. 31–36. [Google Scholar] [CrossRef]
  34. Raja, D.S.; Sriranjani, R.; Parvathy, A.; Hemavathi, N. A Review on Distributed Denial of Service Attack in Smart Grid. In Proceedings of the 2022 7th International Conference on Communication and Electronics Systems (ICCES), Coimbatore, India, 22–24 June 2022; pp. 812–819. [Google Scholar] [CrossRef]
  35. Dworkin, M.; Barker, E.; Nechvatal, J.; Foti, J.; Bassham, L.; Roback, E.; Dray, J. Advanced Encryption Standard (AES). Federal Information Processing Standards (NIST FIPS). National Institute of Standards and Technology, Gaithersburg, MD, USA. Available online: https://doi.org/10.6028/NIST.FIPS.197 (accessed on 23 May 2024).
  36. FIPS Pub. Data Encryption Standard (DES); FIPS PUB: Gaithersburg, MD, USA, 1999; p. 46-3. Available online: https://nvlpubs.nist.gov/nistpubs/Legacy/FIPS/fipspub46-2.pdf (accessed on 23 May 2024).
  37. Stamp, J.E.; Veitch, C.K.; Henry, J.M.; Hart, D.H.; Richardson, B. Microgrid Cyber Security Reference Architecture (V2); Sandia National Lab: Albuquerque, NM, USA, 2015. [Google Scholar] [CrossRef]
  38. Jin, D.; Li, Z.; Hannon, C.; Chen, C.; Wang, J.; Shahidehpour, M.; Lee, C.W. Toward a Cyber Resilient and Secure Microgrid Using Software-Defined Networking. IEEE Trans. Smart Grid 2017, 8, 2494–2504. [Google Scholar] [CrossRef]
  39. Kulkarni, P.; Gormus, S.; Fan, Z.; Motz, B. A mesh-radio-based solution for smart metering networks. IEEE Commun. Mag. 2012, 50, 86–95. [Google Scholar] [CrossRef]
  40. Kathuria, V.; Mohanasundaram, G.; Das, S.R. A simulation study of routing protocols for smart meter networks. In Proceedings of the 2013 IEEE International Conference on Smart Grid Communications (SmartGridComm), Vancouver, BC, Canada, 21–24 October 2013; pp. 384–389. [Google Scholar] [CrossRef]
  41. Fateri, S.; Ni, Q.; Taylor, G.A.; Panchadcharam, S.; Pisica, I. Design and Analysis of Multicast-Based Publisher/Subscriber Models over Wireless Platforms for Smart Grid Communications. In Proceedings of the 2012 IEEE 11th International Conference on Trust, Security and Privacy in Computing and Communications, Liverpool, UK, 25–27 June 2012; pp. 1617–1623. [Google Scholar] [CrossRef]
  42. Rajalingham, G.; Ho, Q.D.; Le-Ngoc, T. Attainable throughput, delay and scalability for geographic routing on Smart Grid neighbor area networks. In Proceedings of the 2013 IEEE Wireless Communications and Networking Conference (WCNC), Shanghai, China, 7–10 April 2013; pp. 1121–1126. [Google Scholar] [CrossRef]
  43. Wang, Z.; Scaglione, A.; Thomas, R.J. Generating Statistically Correct Random Topologies for Testing Smart Grid Communication and Control Networks. IEEE Trans. Smart Grid 2010, 1, 28–39. [Google Scholar] [CrossRef]
  44. Faheem, M.; Shah, S.B.H.; Butt, R.A.; Raza, B.; Anwar, M.; Ashraf, M.W.; Ngadi, M.A.; Gungor, V.C. Smart grid communication and information technologies in the perspective of Industry 4.0: Opportunities and challenges. Comput. Sci. Rev. 2018, 30, 1–30. [Google Scholar] [CrossRef]
  45. Dileep, G. A survey on smart grid technologies and applications. Renew. Energy 2020, 146, 2589–2625. [Google Scholar] [CrossRef]
  46. Li, H.; Mao, R.; Lai, L.; Qiu, R.C. Compressed Meter Reading for Delay-Sensitive and Secure Load Report in Smart Grid. In Proceedings of the 2010 First IEEE International Conference on Smart Grid Communications, Gaithersburg, MD, USA, 4–6 October 2010; pp. 114–119. [Google Scholar] [CrossRef]
  47. Kumari, A.; Tanwar, S.; Tyagi, S.; Kumar, N.; Obaidat, M.S.; Rodrigues, J.J.P.C. Fog Computing for Smart Grid Systems in the 5G Environment: Challenges and Solutions. IEEE Wirel. Commun. 2019, 26, 47–53. [Google Scholar] [CrossRef]
  48. Radhoush, S.; Bahramipanah, M.; Nehrir, H.; Shahooei, Z. A Review on State Estimation Techniques in Active Distribution Networks: Existing Practices and Their Challenges. Sustainability 2022, 14, 2520. [Google Scholar] [CrossRef]
  49. Rouhani, A.; Abur, A. Observability Analysis for Dynamic State Estimation of Synchronous Machines. IEEE Trans. Power Syst. 2017, 32, 3168–3175. [Google Scholar] [CrossRef]
  50. Zhao, J.; Netto, M.; Huang, Z.; Yu, S.S.; Gómez-Expósito, A.; Wang, S.; Kamwa, I.; Akhlaghi, S.; Mili, L.; Terzija, V.; et al. Roles of Dynamic State Estimation in Power System Modeling, Monitoring and Operation. IEEE Trans. Power Syst. 2021, 36, 2462–2472. [Google Scholar] [CrossRef]
  51. Zhao, J.; Gómez-Expósito, A.; Netto, M.; Mili, L.; Abur, A.; Terzija, V.; Kamwa, I.; Pal, B.; Singh, A.K.; Qi, J.; et al. Power System Dynamic State Estimation: Motivations, Definitions, Methodologies, and Future Work. IEEE Trans. Power Syst. 2019, 34, 3188–3198. [Google Scholar] [CrossRef]
  52. Zhuang, P.; Deng, R.; Liang, H. False Data Injection Attacks Against State Estimation in Multiphase and Unbalanced Smart Distribution Systems. IEEE Trans. Smart Grid 2019, 10, 6000–6013. [Google Scholar] [CrossRef]
  53. Primadianto, A.; Lu, C.N. A Review on Distribution System State Estimation. IEEE Trans. Power Syst. 2017, 32, 3875–3883. [Google Scholar] [CrossRef]
  54. Fantin, C.; Castillo, M.; Carvalho, B.; London, J. Using pseudo and virtual measurements in distribution system state estimation. In Proceedings of the 2014 IEEE PES Transmission & Distribution Conference and Exposition—Latin America (PES T&D-LA), Medellin, Colombia, 10–13 September 2014; pp. 1–6. [Google Scholar] [CrossRef]
  55. Khanam, N.; Rihan, M. State Estimation of Smart Power Grid: A Literature Survey. In Proceedings of the 2022 IEEE 2nd International Conference on Sustainable Energy and Future Electric Transportation (SeFeT), Hyderabad, India, 4–6 August 2022; pp. 1–6. [Google Scholar] [CrossRef]
  56. Li, B.; Ding, T.; Huang, C.; Zhao, J.; Yang, Y.; Chen, Y. Detecting False Data Injection Attacks Against Power System State Estimation With Fast Go-Decomposition Approach. IEEE Trans. Ind. Inform. 2019, 15, 2892–2904. [Google Scholar] [CrossRef]
  57. Hernández, C.; Maya-Ortiz, P. Comparison between WLS and Kalman Filter method for power system static state estimation. In Proceedings of the 2015 International Symposium on Smart Electric Distribution Systems and Technologies (EDST), Vienna, Austria, 8–11 September 2015; pp. 47–52. [Google Scholar] [CrossRef]
  58. Chen, T.; Cao, Y.; Chen, X.; Sun, L.; Zhang, J.; Amaratunga, G.A.J. A Distributed Maximum-Likelihood-Based State Estimation Approach for Power Systems. IEEE Trans. Instrum. Meas. 2021, 70, 1002110. [Google Scholar] [CrossRef]
  59. Wang, S.; Zhao, J.; Huang, Z.; Diao, R. Assessing Gaussian Assumption of PMU Measurement Error Using Field Data. IEEE Trans. Power Deliv. 2018, 33, 3233–3236. [Google Scholar] [CrossRef]
  60. Zhao, J.; Mili, L. A Robust Generalized-Maximum Likelihood Unscented Kalman Filter for Power System Dynamic State Estimation. IEEE J. Sel. Top. Signal Process. 2018, 12, 578–592. [Google Scholar] [CrossRef]
  61. Meriem, M.; Bouchra, C.; Abdelaziz, B.; Jamal, S.O.B.; Faissal, E.M.; Nazha, C. Study of state estimation using weighted-least-squares method (WLS). In Proceedings of the 2016 International Conference on Electrical Sciences and Technologies in Maghreb (CISTEM), Marrakech, Morocco, 26–28 October 2016; pp. 1–5. [Google Scholar] [CrossRef]
  62. Zivanovic, R.; Cairns, C. PMU technology in state estimation: An overview. In Proceedings of the IEEE. AFRICON’96, Stellenbosch, South Africa, 24–27 September 1996; Volume 2, pp. 1006–1011. [Google Scholar] [CrossRef]
  63. Gomez-Quiles, C.; de la Villa Jaen, A.; Gomez-Exposito, A. A Factorized Approach to WLS State Estimation. IEEE Trans. Power Syst. 2011, 26, 1724–1732. [Google Scholar] [CrossRef]
  64. Chakrabarti, S.; Kyriakides, E. PMU Measurement Uncertainty Considerations in WLS State Estimation. IEEE Trans. Power Syst. 2009, 24, 1062–1071. [Google Scholar] [CrossRef]
  65. Karimipour, H.; Dinavahi, V. Extended Kalman Filter-Based Parallel Dynamic State Estimation. IEEE Trans. Smart Grid 2015, 6, 1539–1549. [Google Scholar] [CrossRef]
  66. Kandepu, R.; Foss, B.; Imsland, L. Applying the unscented Kalman filter for nonlinear state estimation. J. Process Control 2008, 18, 753–768. [Google Scholar] [CrossRef]
  67. Huang, Z.; Schneider, K.; Nieplocha, J. Feasibility studies of applying Kalman Filter techniques to power system dynamic state estimation. In Proceedings of the 2007 International Power Engineering Conference (IPEC 2007), Singapore, 3–6 December 2007; pp. 376–382. [Google Scholar]
  68. Zhang, J.; Welch, G.; Bishop, G.; Huang, Z. A Two-Stage Kalman Filter Approach for Robust and Real-Time Power System State Estimation. IEEE Trans. Sustain. Energy 2014, 5, 629–636. [Google Scholar] [CrossRef]
  69. Zhao, J.; Netto, M.; Mili, L. A Robust Iterated Extended Kalman Filter for Power System Dynamic State Estimation. IEEE Trans. Power Syst. 2017, 32, 3205–3216. [Google Scholar] [CrossRef]
  70. Fan, L.; Miao, Z.; Wehbe, Y. Application of Dynamic State and Parameter Estimation Techniques on Real-World Data. IEEE Trans. Smart Grid 2013, 4, 1133–1141. [Google Scholar] [CrossRef]
  71. Blood, E.A.; Krogh, B.H.; Ilic, M.D. Electric power system static state estimation through Kalman filtering and load forecasting. In Proceedings of the 2008 IEEE Power and Energy Society General Meeting—Conversion and Delivery of Electrical Energy in the 21st Century, Pittsburgh, PA, USA, 20–24 July 2008; pp. 1–6. [Google Scholar] [CrossRef]
  72. Kekatos, V.; Giannakis, G.B. Distributed Robust Power System State Estimation. IEEE Trans. Power Syst. 2013, 28, 1617–1626. [Google Scholar] [CrossRef]
  73. Dzafic, I.; Henselmeyer, S.; Neisius, H.T. High performance State Estimation for smart grid distribution network operation. In Proceedings of the ISGT 2011, Anaheim, CA, USA, 17–19 January 2011; pp. 1–6. [Google Scholar] [CrossRef]
  74. Pau, M.; Attilio Pegoraro, P.; Sulis, S. Performance of three-phase WLS Distribution System State Estimation approaches. In Proceedings of the 2015 IEEE International Workshop on Applied Measurements for Power Systems (AMPS), Aachen, Germany, 23–25 September 2015; pp. 138–143. [Google Scholar] [CrossRef]
  75. Baran, M.; Kelley, A. A branch-current-based state estimation method for distribution systems. IEEE Trans. Power Syst. 1995, 10, 483–491. [Google Scholar] [CrossRef]
  76. Xie, L.; Choi, D.H.; Kar, S.; Poor, H.V. Fully Distributed State Estimation for Wide-Area Monitoring Systems. IEEE Trans. Smart Grid 2012, 3, 1154–1169. [Google Scholar] [CrossRef]
  77. Gomez-Quiles, C.; Gomez-Exposito, A.; de la Villa Jaen, A. State Estimation for Smart Distribution Substations. IEEE Trans. Smart Grid 2012, 3, 986–995. [Google Scholar] [CrossRef]
  78. Qi, H.; Wang, X.; Tolbert, L.M.; Li, F.; Peng, F.Z.; Ning, P.; Amin, M. A Resilient Real-Time System Design for a Secure and Reconfigurable Power Grid. IEEE Trans. Smart Grid 2011, 2, 770–781. [Google Scholar] [CrossRef]
  79. Vellaithurai, C.; Srivastava, A.; Zonouz, S.; Berthier, R. CPIndex: Cyber-Physical Vulnerability Assessment for Power-Grid Infrastructures. IEEE Trans. Smart Grid 2015, 6, 566–575. [Google Scholar] [CrossRef]
  80. Ayiad, M.M.; Leite, H.; Martins, H. State Estimation for Hybrid VSC Based HVDC/AC: Unified Bad Data Detection Integrated With Gaussian Mixture Model. IEEE Access 2021, 9, 91730–91740. [Google Scholar] [CrossRef]
  81. Lin, Y.; Abur, A. A Highly Efficient Bad Data Identification Approach for Very Large Scale Power Systems. IEEE Trans. Power Syst. 2018, 33, 5979–5989. [Google Scholar] [CrossRef]
  82. Brumback, B.; Srinath, M. A Chi-square test for fault-detection in Kalman filters. IEEE Trans. Autom. Control 1987, 32, 552–554. [Google Scholar] [CrossRef]
  83. Mo, Y.; Garone, E.; Casavola, A.; Sinopoli, B. False data injection attacks against state estimation in wireless sensor networks. In Proceedings of the 49th IEEE Conference on Decision and Control (CDC), Atlanta, GA, USA, 15–17 December 2010; pp. 5967–5972. [Google Scholar] [CrossRef]
  84. Zhang, D.; Wang, Q.G.; Feng, G.; Shi, Y.; Vasilakos, A.V. A survey on attack detection, estimation and control of industrial cyber–physical systems. ISA Trans. 2021, 116, 1–16. [Google Scholar] [CrossRef]
  85. Panthi, M. Anomaly Detection in Smart Grids using Machine Learning Techniques. In Proceedings of the 2020 First International Conference on Power, Control and Computing Technologies (ICPC2T), Raipur, India, 3–5 January 2020; pp. 220–222. [Google Scholar] [CrossRef]
  86. Marino, D.L.; Wickramasinghe, C.S.; Amarasinghe, K.; Challa, H.; Richardson, P.; Jillepalli, A.A.; Johnson, B.K.; Rieger, C.; Manic, M. Cyber and Physical Anomaly Detection in Smart-Grids. In Proceedings of the 2019 Resilience Week (RWS), San Antonio, TX, USA, 4–7 November 2019; Volume 1, pp. 187–193. [Google Scholar] [CrossRef]
  87. Menon, D.M.; Radhika, N. Anomaly detection in smart grid traffic data for home area network. In Proceedings of the 2016 International Conference on Circuit, Power and Computing Technologies (ICCPCT), Nagercoil, India, 18–19 March 2016; pp. 1–4. [Google Scholar] [CrossRef]
  88. Barua, A.; Muthirayan, D.; Khargonekar, P.P.; Al Faruque, M.A. Hierarchical Temporal Memory Based Machine Learning for Real-Time, Unsupervised Anomaly Detection in Smart Grid: WiP Abstract. In Proceedings of the 2020 ACM/IEEE 11th International Conference on Cyber-Physical Systems (ICCPS), Sydney, NSW, Australia, 21–25 April 2020; pp. 188–189. [Google Scholar] [CrossRef]
  89. Amirioun, M.; Aminifar, F.; Lesani, H.; Shahidehpour, M. Metrics and quantitative framework for assessing microgrid resilience against windstorms. Int. J. Electr. Power Energy Syst. 2019, 104, 716–723. [Google Scholar] [CrossRef]
  90. Huang, G.; Wang, J.; Chen, C.; Guo, C.; Zhu, B. System resilience enhancement: Smart grid and beyond. Front. Eng. Manag. 2017, 4, 271. [Google Scholar] [CrossRef]
  91. Gholami, A.; Shekari, T.; Amirioun, M.H.; Aminifar, F.; Amini, M.H.; Sargolzaei, A. Toward a Consensus on the Definition and Taxonomy of Power System Resilience. IEEE Access 2018, 6, 32035–32053. [Google Scholar] [CrossRef]
  92. Kuffel, R.; Giesbrecht, J.; Maguire, T.; Wierckx, R.; McLaren, P. RTDS-a fully digital power system simulator operating in real time. In Proceedings of the 1995 International Conference on Energy Management and Power Delivery Singapore, 21–23 November 1995; Volume 2, pp. 498–503. [Google Scholar]
  93. DIgSILENT PowerFactory. 2024. Available online: https://www.digsilent.de/en/powerfactory.html (accessed on 23 May 2024).
  94. Rana, M.M.; Xiang, W.; Wang, E. Smart grid state estimation and stabilisation. Int. J. Electr. Power Energy Syst. 2018, 102, 152–159. [Google Scholar] [CrossRef]
  95. Cintuglu, M.H.; Mohammed, O.A.; Akkaya, K.; Uluagac, A.S. A Survey on Smart Grid Cyber-Physical System Testbeds. IEEE Commun. Surv. Tutor. 2017, 19, 446–464. [Google Scholar] [CrossRef]
  96. INL Test Range Protecting Nation’s Infrastructure. 2016. Available online: https://eps.inl.gov/SiteAssets/idaho%20test%20range.pdf (accessed on 23 May 2024).
  97. South Korea: Jeju Island Smart Grid Test-Bed Developing Next Generation Utility Networks. 2016. Available online: http://www.gsma.com/connectedliving/wpcontent/uploads/2012/09/cl_jeju_09_121.pdf (accessed on 23 May 2024).
  98. NREL Distributed Energy Resources Test Facility. 2015. Available online: https://www.nrel.gov/grid/distribution-integration.html (accessed on 23 May 2024).
  99. Hong, J.; Wu, S.S.; Stefanov, A.; Fshosha, A.; Liu, C.C.; Gladyshev, P.; Govindarasu, M. An intrusion and defense testbed in a cyber-power system environment. In Proceedings of the 2011 IEEE Power and Energy Society General Meeting, Detroit, MI, USA, 24–28 July 2011; pp. 1–5. [Google Scholar]
  100. Yang, Y.; Jiang, H.T.; McLaughlin, K.; Gao, L.; Yuan, Y.; Huang, W.; Sezer, S. Cybersecurity test-bed for IEC 61850 based smart substations. In Proceedings of the 2015 IEEE Power and Energy Society General Meeting, Denver, CO, USA, 26–30 July 2015; pp. 1–5. [Google Scholar] [CrossRef]
  101. Queiroz, C.; Mahmood, A.; Tari, Z. SCADASim—A framework for building SCADA simulations. IEEE Trans. Smart Grid 2011, 2, 589–597. [Google Scholar] [CrossRef]
  102. A Smart Laboratory, Manhattan, KS, USA. 2015. Available online: https://www.k-state.edu/seek/winter-2015/smartlab.html (accessed on 23 May 2024).
  103. Tran, V.P.; Kamalasadan, S.; Enslin, J. Real-time modeling and model validation of synchronous generator using synchrophasor measurements. In Proceedings of the 2013 North American Power Symposium, Manhattan, KS, USA, 22–24 September 2013; pp. 1–5. [Google Scholar]
  104. Iyer, S. Cyber security for smart grid, cryptography, and privacy. Int. J. Digit. Multimed. Broadcast. 2011, 2011, 372020. [Google Scholar] [CrossRef]
  105. He, D.; Wang, H.; Khan, M.K.; Wang, L. Lightweight anonymous key distribution scheme for smart grid using elliptic curve cryptography. IET Commun. 2016, 10, 1795–1802. [Google Scholar] [CrossRef]
  106. Nicanfar, H.; Leung, V.C. Password-authenticated cluster-based group key agreement for smart grid communication. Secur. Commun. Netw. 2014, 7, 221–233. [Google Scholar] [CrossRef]
  107. Lee, E.K.; Gerla, M.; Oh, S.Y. Physical layer security in wireless smart grid. IEEE Commun. Mag. 2012, 50, 46–52. [Google Scholar] [CrossRef]
  108. Islam, S.N.; Baig, Z.; Zeadally, S. Physical layer security for the smart grid: Vulnerabilities, threats, and countermeasures. IEEE Trans. Ind. Inform. 2019, 15, 6522–6530. [Google Scholar] [CrossRef]
  109. Abrahamsen, F.E.; Ai, Y.; Cheffena, M. Communication technologies for smart grid: A comprehensive survey. Sensors 2021, 21, 8087. [Google Scholar] [CrossRef]
  110. Ai, Y.; Cheffena, M. A Comparative Study of Wireless Channel Propagation Characteristics in Industrial and Office Environments. In Proceedings of the International Symposium on Antennas and Propagation (ISAP), Hobart, Australia, 9–12 November 2015; Available online: https://hdl.handle.net/11250/2676436 (accessed on 23 May 2024).
  111. Güzelgöz, S.; Arslan, H.; Islam, A.; Domijan, A. A review of wireless and PLC propagation channel characteristics for smart grid environments. J. Electr. Comput. Eng. 2011, 2011, 15. [Google Scholar] [CrossRef]
  112. Ai, Y.; Andersen, J.B.; Cheffena, M. Path-loss prediction for an industrial indoor environment based on room electromagnetics. IEEE Trans. Antennas Propag. 2017, 65, 3664–3674. [Google Scholar] [CrossRef]
  113. Al-Samman, A.M.; Mohamed, M.; Ai, Y.; Cheffena, M.; Azmi, M.H.; Rahman, T.A. Rain attenuation measurements and analysis at 73 GHz E-band link in tropical region. IEEE Commun. Lett. 2020, 24, 1368–1372. [Google Scholar] [CrossRef]
  114. Ai, Y.; Cheffena, M. On multi-hop decode-and-forward cooperative relaying for industrial wireless sensor networks. Sensors 2017, 17, 695. [Google Scholar] [CrossRef]
  115. Zhang, J.; Hasandka, A.; Wei, J.; Alam, S.S.; Elgindy, T.; Florita, A.R.; Hodge, B.M. Hybrid communication architectures for distributed smart grid applications. Energies 2018, 11, 871. [Google Scholar] [CrossRef]
  116. Ahmad, F.; Rasool, A.; Ozsoy, E.; Sekar, R.; Sabanovic, A.; Elitaş, M. Distribution system state estimation-A step towards smart grid. Renew. Sustain. Energy Rev. 2018, 81, 2659–2671. [Google Scholar] [CrossRef]
  117. Dehghanpour, K.; Wang, Z.; Wang, J.; Yuan, Y.; Bu, F. A survey on state estimation techniques and challenges in smart distribution systems. IEEE Trans. Smart Grid 2018, 10, 2312–2322. [Google Scholar] [CrossRef]
  118. Wang, X.; Li, S.; Iqbal, M. Live Power Generation Predictions via AI-Driven Resilient Systems in Smart Microgrids. IEEE Trans. Consum. Electron. 2024, 70, 3875–3884. [Google Scholar] [CrossRef]
  119. Mohammadi, F. Emerging challenges in smart grid cybersecurity enhancement: A review. Energies 2021, 14, 1380. [Google Scholar] [CrossRef]
  120. Hossain-McKenzie, S.; Lai, C.; Chavez, A.; Vugrin, E. Performance-based cyber resilience metrics: An applied demonstration toward moving target defense. In Proceedings of the IECON 2018-44th Annual Conference of the IEEE Industrial Electronics Society, Washington, DC, USA, 21–23 October 2018; pp. 766–773. [Google Scholar] [CrossRef]
  121. Moslehi, K.; Kumar, R. A reliability perspective of the smart grid. IEEE Trans. Smart Grid 2010, 1, 57–64. [Google Scholar] [CrossRef]
Figure 1. NISTIR 7628 smart grid processes.
Electronics 13 02177 g001
Figure 2. NIAC resilience framework.
Electronics 13 02177 g002
Figure 3. System’s resilient performance during an incident.
Electronics 13 02177 g003
Table 1. Power system attack scenarios study.
YearPlaceAttack MethodsImpact
2003 [10]OhioThe Slammer worm attacked and disabled the supervisory systemOhio Davis–Besse nuclear plant supervisory system disabled for 5 h.
2010 [10,11]IranReplay attack. The Stuxnet worm tempered the power frequency of nuclear centrifuges rapidly in between high and low speeds and sent the normal measurements to SCADA.Disrupt the operations of 1/5 of centrifuges in the nuclear plant and the Stuxnet worm infected over 200 thousand computers in the control system.
2015 [10,11]UkraineBlackEnergy3 was designed to conduct spear-phishing attacks to collect internal staff’s VPN credentials and deploy a telephonic DoS attack to outage report.Three Ukrainian power distribution companies had a large-scale power outage that lasted for 3 h, affecting 225,000 users.
2016 [11]IsraelRansomware attack through phishing email against Israel Electric Authority.Suspend the operations of affected computers and company facing 12,610 megawatts electricity demand.
2021 [12]TexasExtreme weather winter stormShort of 1.6 million megawatt-hours electricity and electricity generation cost increased by USD 52.6 bn.
Table 2. Static state estimation studies regarding WLS algorithm.
CiteContributionsInputAlgorithmEvaluation
 [61]Performance of WLS according to different combinations of measurement features.Voltage magnitudes, active and reactive power flows and injections.WLSEstimate voltage magnitude and voltage angle in 3-bus testbed and IEEE 14-bus testbed.
 [62]Use Linear WLS to estimate PMU measurements; use Non-linear WLS to estimate unregulated mixed measurements.Voltage magnitudes, voltage angle shift, active and reactive power flows, and injections.Non-linear WLS + Linear WLSEstimation for linear WLS in 1,2,5 buses of IEEE 14-bus testbed.
 [63]Factorise non-linear WLS model into two stages: linear filter stage and non-linear estimate stage.Squared voltage magnitudes, power flow, power injection.Linear WLS + Non-linear WLSEstimate in IEEE 118-, 298-bus testbed, it has a lower computational cost and provides higher accuracy, but the intermediate vectors between two stages can be verified.
 [64]Assign weights to PMU measurements in WLS to reduce measurement uncertainty.Voltage magnitudes, phase angle.Propagation of Uncertainty + WLSEstimate upper and lower limits of voltage magnitude and voltage angle to reduce uncertainty in WLS in IEEE 14/30/57/188-bus testbed.
Table 3. Dynamic state estimation studies with Kalman filters.
CiteContributionInputAlgorithmEvaluation
 [26]Introduce Euclidean detector combined with Kalman filter to detect FDI attacksDoS attack, Random attack, False data injection attack signals.Kalman filter + Euclidean detectorCompare χ 2 and Euclidean detector under Kalman filter in various attacks.
 [66]Comparing UKF and EKF in non-linear state estimation.-UKF, EKFUKF is more robust and convergence quicker than EKF with similar computational load.
 [67]Extended Kalman filter (EKF) model performance in DSE.Bus voltage, bus angle, line flowsEKFEKF performance relatively good under 0.03 s measurement sampling speed, and 30% noise level.
 [68]Two-stage KF model in DSE: 1. use AKF with InNoVa for static estimation; 2. EKF for DSEVoltage magnitudes and phase angles, process and measurement noiseAKF with InNoVa + EKFCompare KF, RKF, and AKF with InNoVa estimate performance in stage one under various noise environments
 [69]Iterated EKF combined with Generalised maximum likelihood (GM-IEKF) in DSE.Voltage magnitudes, phase angles, active and reactive power, process and measurement noiseGM estimator + IEKFCompare GM-IEKF, EKF, UKF under various noise situations (non-Gaussian noise distribution included) in IEEE 39-bus testbed.
 [65]EKF based massively parallel DSE.-EKFIn 4992-bus testbed, using parallel iterative and direct linear models, the speed is 15 times faster.
 [70]Use voltage magnitude deviations to identify the radial path from PMUs Phase angle deviations in off-nominal frequency scenarios.Dynamic generator internal voltages and phase angles measurementsFinite difference + Chebyshev FilterUse Finite difference and Chebyshev Filter to smooth the noise in equivalent generator signal waveforms.
 [71]DSE model combining the power flow equations with load forecasting.Voltage magnitudes, phase angles.EKFIn IEEE 14-bus testbed, including load forecast has better accuracy and fewer computational requirements than augmented SSE.
Table 4. Distribution system state estimation algorithms.
CiteContributionInputAlgorithmEvaluation
 [73]The proposed three-phase DPSSE model reduces the dimension of state estimation processes.Analog real-time current magnitude, active and reactive power measurements; Historical loads/AMI/AMR information as pseudo measurements.WLSTest in modified IEEE 34-bus testbed. But cannot perform well in systems that lack telemetered power and magnitude measurements, and bad data in load.
 [76]Do not need local observability of all control areas. In DC SE, the linear power flow model converges to a centralised WLS model. In AC SE, use distributed WAU (wait-and-update) rule-based algorithms.14-bus: 6 power injection, 16 power flow measurements; 118-bus: 49 power injection, 129 power flow measurementsWLS + WAU (rule-based)The algorithms based on WLS can perform estimation on both AC/DC system in IEEE 14-bus and 118-bus testbeds.
 [77]Divided the DPSSE processes into two stages: (1) Decouple the manner of multiple WLS subproblems; (2) Coordinate each substation using linear WLS.Voltage magnitudes, transformers power flowsWLSTest on a substation with two parallel transformers, which includes 69-bus and 85-bus systems.
Table 5. Data-driven attack detecting methods.
CiteAlgorithmAgainst AttacksEvaluation
 [22]Transformer + Federated Learning + Pallier CryptosystemStealthy FDI attackTest on IEEE 14-bus, 118-bus testbed, has more than 90% accuracy on both weak and strong attacks.
 [85]Jripper, Random Forest (RF), one-R, Naive BayesShort circuit faults, Line maintenance, Remote tripping command injection, Relay setting change, FDI attackClassification test on Mississippi State University three-class dataset: no event, attack, natural. RF has 92.1% accuracy on detecting attack events.
 [86]OCSVM (unsupervised) + Decision Tree; RF (supervised evaluation)Scanning, replay, and DoS attacks; load breakers and generators with abnormal behaviours (rule-based).Test on Idaho CPS SCADA (ISAAC) testbed to identify normal, abnormal cyber, and abnormal physical scenarios using PCA anomaly detection method OCSVM has over 98% accuracy.
 [87]K-means algorithm and DBSCAN clusteringFlooding DoS attacksUsing traffic features: ip source, ip destination, ethernet source, ethernet destination, protocol name, frame numbers, and data bytes to conduct three-class clustering. K-means has 91% accuracy.
 [51]Proposed Autoencoder + Generative Adversarial Network (GAN)DoS, FDI, replay attacksAnomaly detection and anomaly classification evaluation with various algorithms on Modbus network flows (generated by Smod), DNP3 network flows (IDS data from Rodofile), and operational data in different scenarios.
 [88]Hierarchical Temporal Memory (HTM)-Test on open PMU source data from Lawrence Berkeley National Laboratory’s (LBNL) 7.2 kV distribution grid. Compared with random cut forest, Bayesian change, relative entropy. HTM has over 96% accuracy.
Disclaimer/Publisher’s Note: The statements, opinions and data contained in all publications are solely those of the individual author(s) and contributor(s) and not of MDPI and/or the editor(s). MDPI and/or the editor(s) disclaim responsibility for any injury to people or property resulting from any ideas, methods, instructions or products referred to in the content.

