Article

The Impact of Grid Distortion on the Power Conversion Harmonics of AC/DC Converters in the Supraharmonic Range

1
Research Group EELab/Lemcko, Department of Electromechanical, Systems and Metal Engineering, Faculty of Engineering and Architecture, Ghent University, 8500 Kortrijk, Belgium
2
Department of Electrical Engineering, Faculty of Engineering, Menoufia University, Menoufia 32511, Egypt
*
Author to whom correspondence should be addressed.
Electronics 2024, 13(12), 2244; https://doi.org/10.3390/electronics13122244
Submission received: 7 May 2024 / Revised: 5 June 2024 / Accepted: 6 June 2024 / Published: 7 June 2024

Abstract

:
AC/DC converters, controlled by pulse width modulation (PWM) and used as power factor correction (PFC), is considered one of the main contributors to emissions in the range 2 kHz–150 kHz, recently known as the supraharmonic (SH) range. This study looks at the impact of SH grid distortion on the LF (<2 kHz) and HF (>2 kHz) emission of an AC/DC converter. The PFC boost converter is used as a particular case for validation of the results. It is observed that the AC/DC converters emit additional LF interharmonics and subharmonics when the grid voltage contains interharmonic components in the SH range. A mathematical analysis is provided to study and assess the interference between the SH in the background distortion and the AC/DC converters. Experimental studies are then performed for a PFC boost setup based on dSPACE MicroLabBox for the purposes of validating the mathematical analysis.

1. Introduction

With the development of the modern electrical grid, the integration of the power electronics (PE) based apparatus becomes indispensable. These devices, including inverters, converters, and variable frequency drives, are driven by high switching frequencies to control and convert electrical energy efficiently [1,2]. However, the switching rates often occur within the frequency range of 2–150 kHz, leading to power conversion harmonics occurring in the grid, recently known as supraharmonic (SH). Consequently, this leads to generating electromagnetic interference (EMI) problems in the SH range [3,4,5]. Reported examples are interference in communication systems, performance and lifespan degradation of electrical equipment, audible noise, and unintentional switching [6,7]. This, in turn, emphasizes the importance of carefully designing and analyzing these systems to mitigate adverse effects and ensure the stable operation of the power network increasingly dependent on PE technologies. Consequently, numerous studies focus on unraveling the complexities surrounding the propagation, emissions, and effects of SHs. One of the obstacles involved with these high-frequency emissions is the lack of standards in the SHs range [8].
In [9,10,11], it has been observed that high distortions of up to 3 volts appear when grid-connected inverters (GCIs) and electric vehicles (EV) battery chargers are subjected to SH emissions. A study conducted in [12] on several household devices introduces the criteria and the indications of SHs emissions classification and clarifies the emissions characteristics in time and frequency domains. The system under investigation in [12] consists of a PV inverter and LED lamps installation connected in parallel. It is found that supraharmonic propagation is highly dependent on the characteristics of the devices and grid impedance. The interference between SHs and electronic devices is investigated in [6,13,14], where the operation failure of these devices is reported.
In [15], numerous AC/DC LED drivers are subjected to a SH voltage profile following the measurement method in IEC 61000-4-19 [16]. The study in [15] aims to analyze the interference in the LED lamp’s driver circuits. The results show that the SH voltage profile could cause deviations in the average light intensity.
In the harmonic range below 2 kHz, an interharmonic is defined as “a frequency component of a periodic quantity that is not an integer multiple of the frequency at which the power system is operated” [17]. The definition of the interharmonic is still limited to the harmonic range, i.e., below 2 kHz. However, in [18], their counterparts in the SH range are defined as nonsynchronous disturbances above 2 kHz. Interharmonic studies within the field of power quality encompass understanding their origins, detecting their presence, modeling them, and developing mitigation techniques [19,20].
Interharmonic components are deliberately superimposed on the grid voltage for ripple control (RC) purposes. The frequencies of the added interharmonics components lie between 110 Hz and 3 kHz with amplitudes up to 7 V [21]. Consequently, different intermodulation components from the applied frequencies are created, and non-synchronized operation may occur [22,23].
The interaction between SHs, interharmonics, and electronic devices is a complex area that requires more clarification and careful consideration in the design and operation of the connected devices. Therefore, many studies analyze the propagation of such components and study the mitigation of their effects [24,25,26].
Studies conducted in [27,28] show that any apparatus being subjected to interharmonic components will act by itself as a source of interharmonics. Few attempts have been made to investigate the interaction between SHs, harmonics, and interharmonics. According to the study conducted in [29], interharmonic components arise at the terminals of the devices when they are exposed to a source of “SHs” under the circumstances of grid frequency deviations from the nominal grid frequency, i.e., 50/60 Hz. The study conducted in [30] came to the conclusion that grid-connected converters emit additional emissions known as self-induced and mutual-induced emissions if they are subjected to SH distortions with frequencies that are non-integer multiples of grid one.
AC/DC converters are widely used in low voltage (LV) installations to match various loads of power demand with the one provided by the grid [1]. The vast majority of these converters are controlled to adjust the output voltage or current to meet what is required by loads. In addition, due to the limitations set by IEC 61000-4-7 standard [31] on harmonic current emissions of AC/DC converters below 2 kHz, an active power factor correction (PFC) stage is added as a controlled DC-DC converter between the diode bridge rectifier (DBR) and the DC load. As these AC/DC converters are driven by switching frequencies lying in the SH range, they are identified as one of the sources of SH emissions.
In this paper, the interaction between the SHs with non-integer multiple in the background distortion and the SH emissions of the PFC boost converter, as the most common topology used in AC/DC converters for the purposes of PFC, is investigated. Non-integer multiple components of SHs means that the frequencies of these components are non-integer multiple of the nominal grid frequency. The study aims to determine the effect of that interaction on the final emissions of the PFC boost converter. The motivation of this study is driven by the fact that the SHs with non-integer multiple in the background distortion exist due to many factors, e.g., the emissions of variable frequency drives (VFDs) [30] and the deviations in the switching frequencies due to the impurities in the components and the unavoidable flaws in the design process [32]. This, in turn, raises the importance of studying the interference between the SH with non-integer multiple and the AC/DC converters. The main contributions of this work can be listed as:
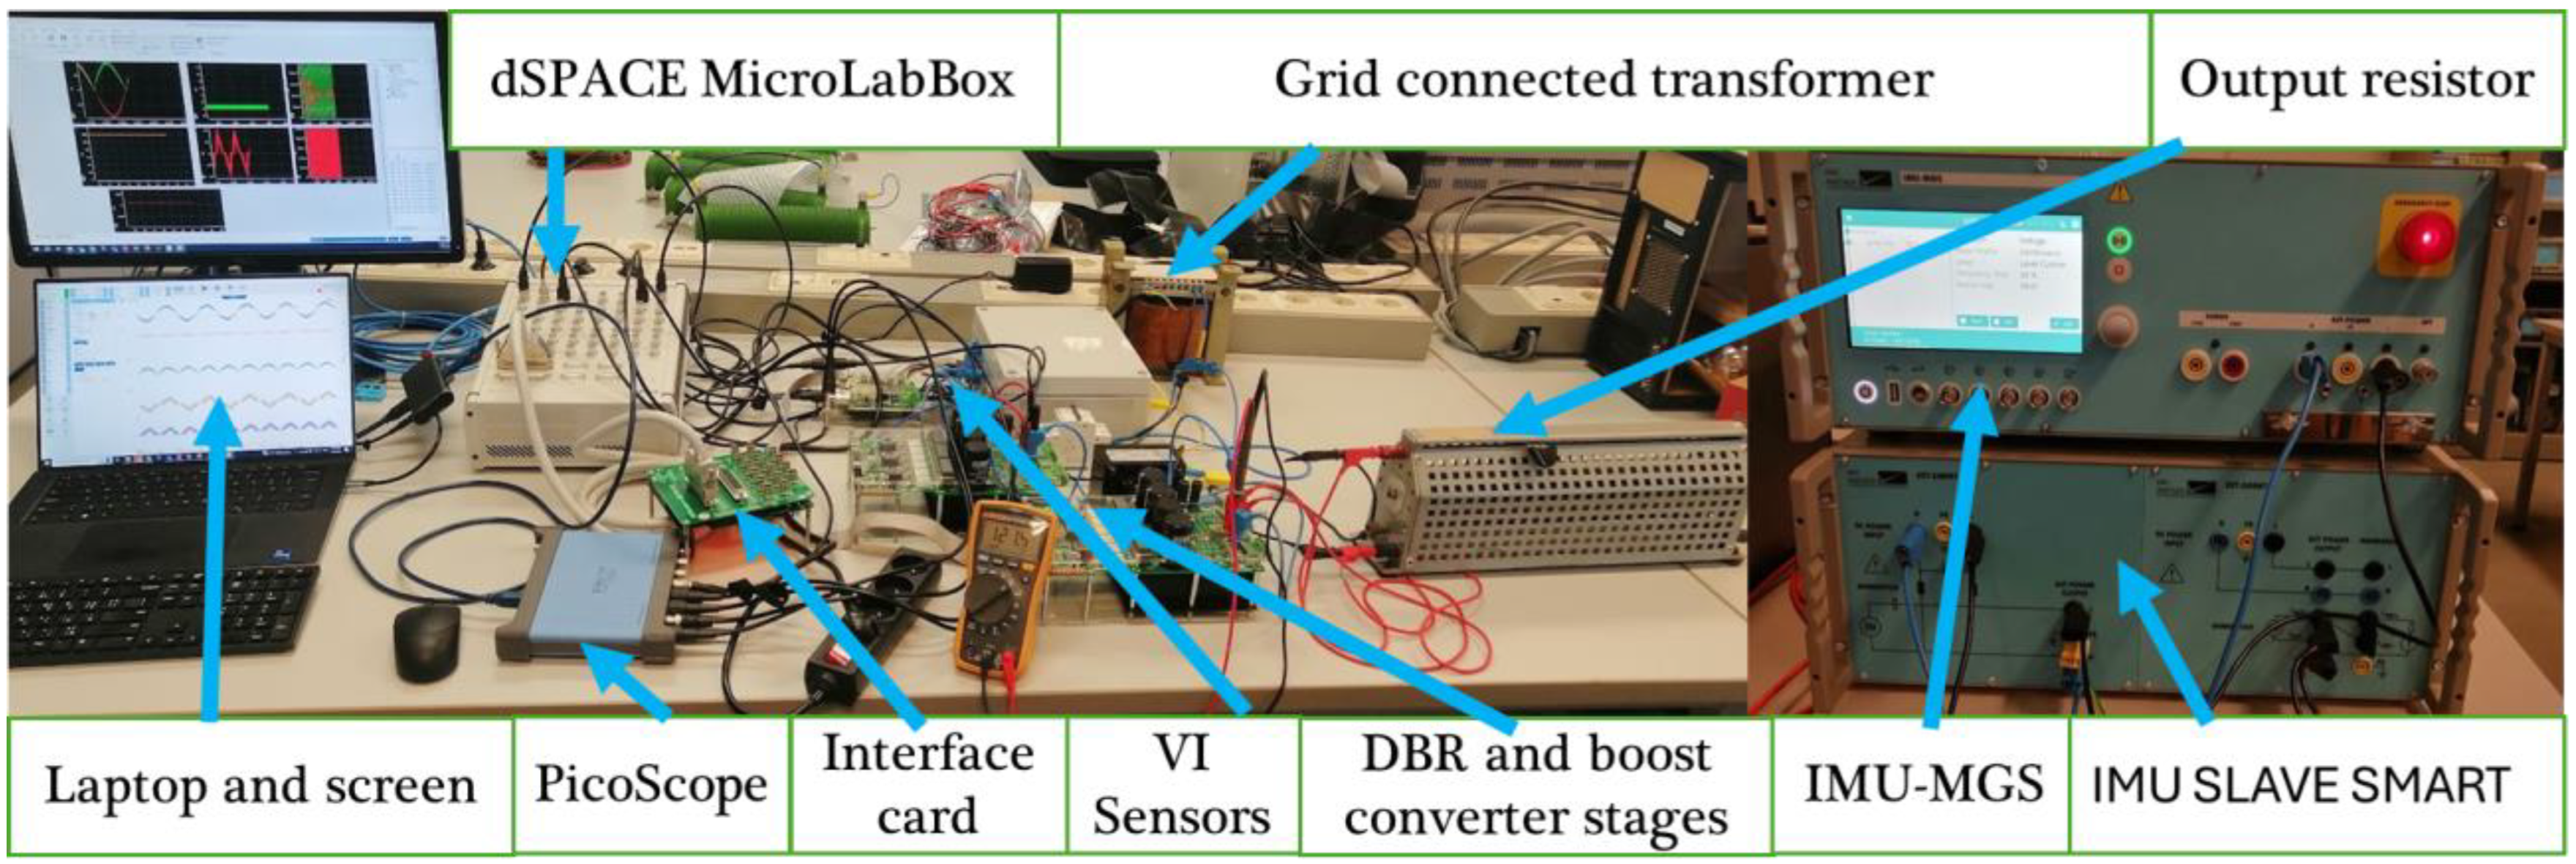
  • An experimental setup based on a dSPACE MicroLabBox will be built to study the SH emissions of PFC boost converters as a common example for AC/DC converters.
  • Exposing the AC/DC converter to SH with non-integer multiple and documenting the observations.
  • Investigating the effect of the DBR of the low voltage AC/DC converters on the harmonics and SHs transfer between the two sides of the DBR.
  • Determining the origin of the added emissions in the frequency spectra of the PFC boost current under SH with non-integer multiple in the background distortion.
The rest of the paper is organized as follows: The DBR and its effect on the harmonic transfer, as well as the interference analysis, are provided in Section 2. In Section 3, experimental verifications and observations are discussed. The conclusions of this study are provided in Section 4.

2. Interference between the SH Components in the Grid and the AC/DC Converters

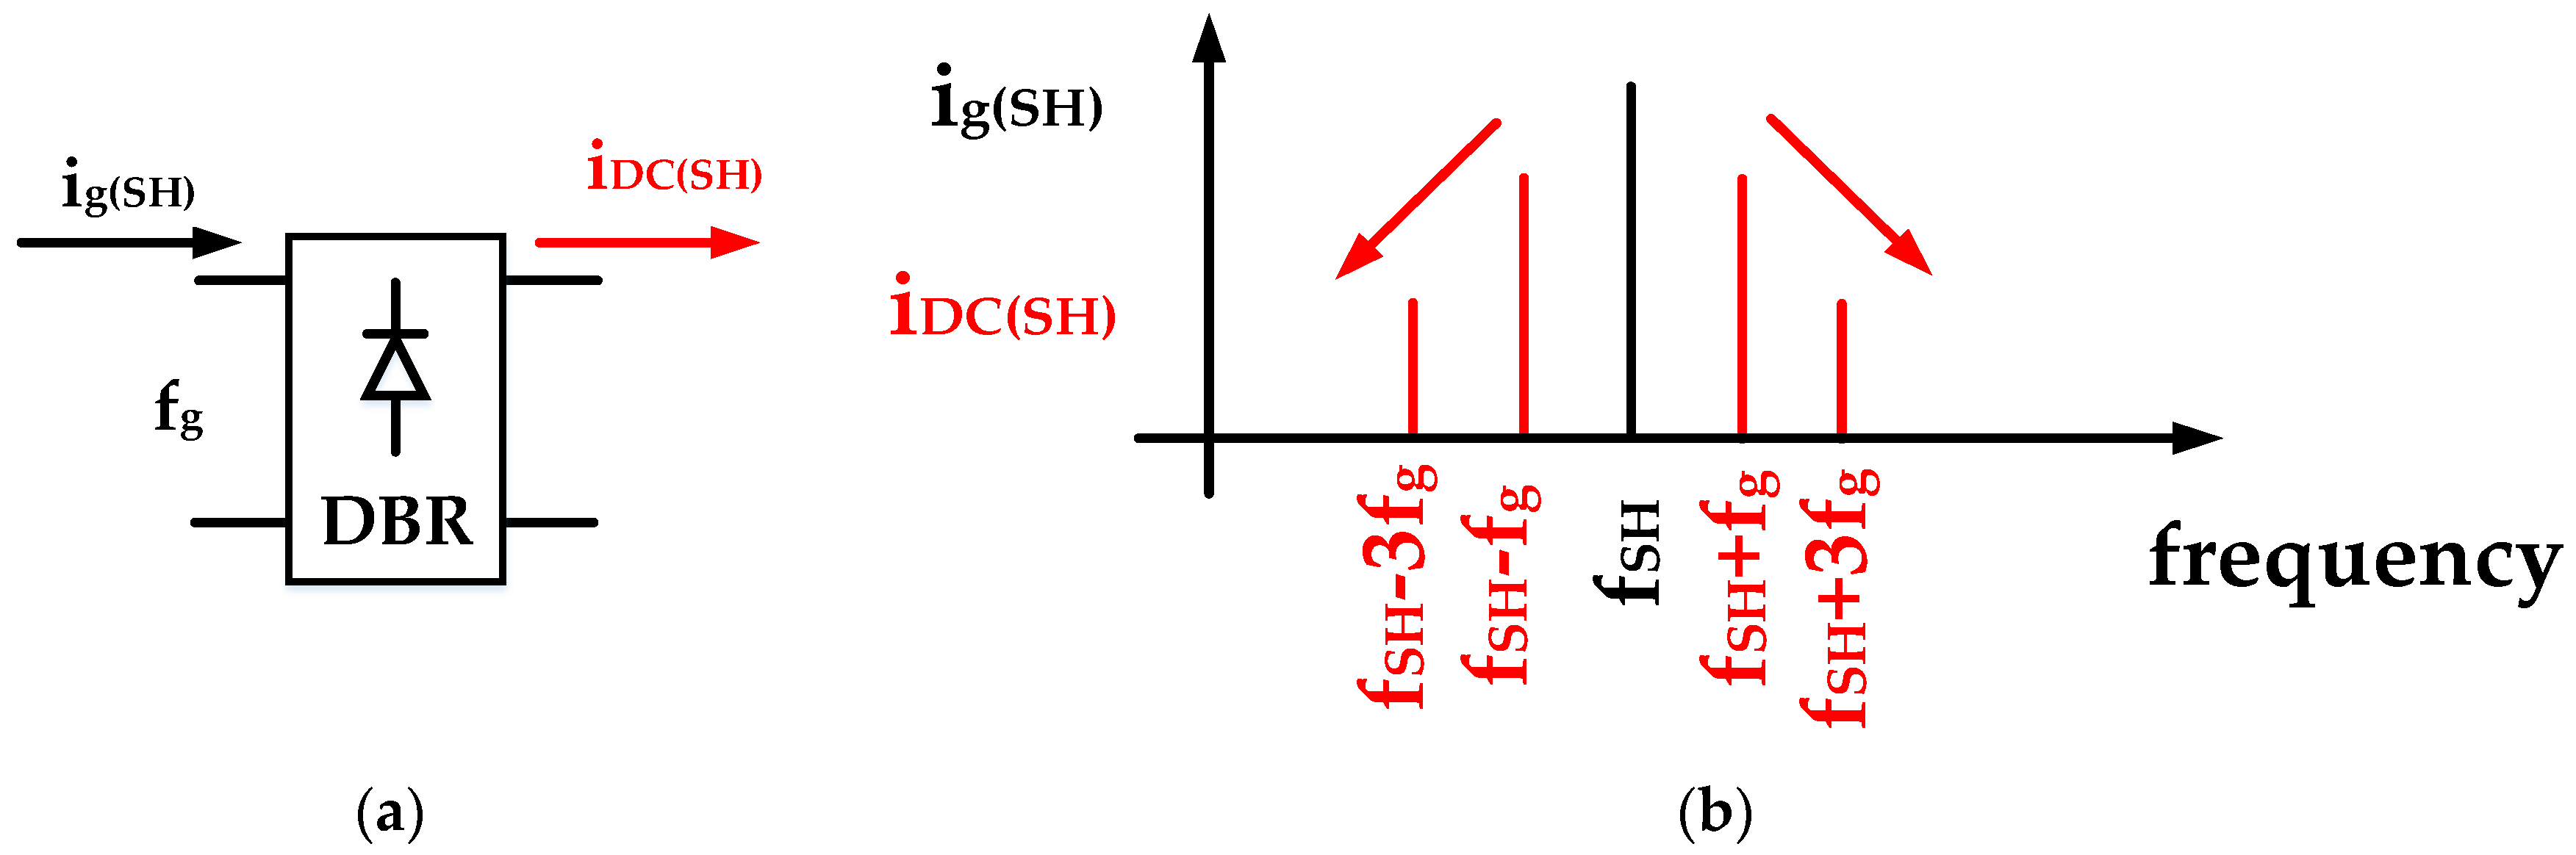
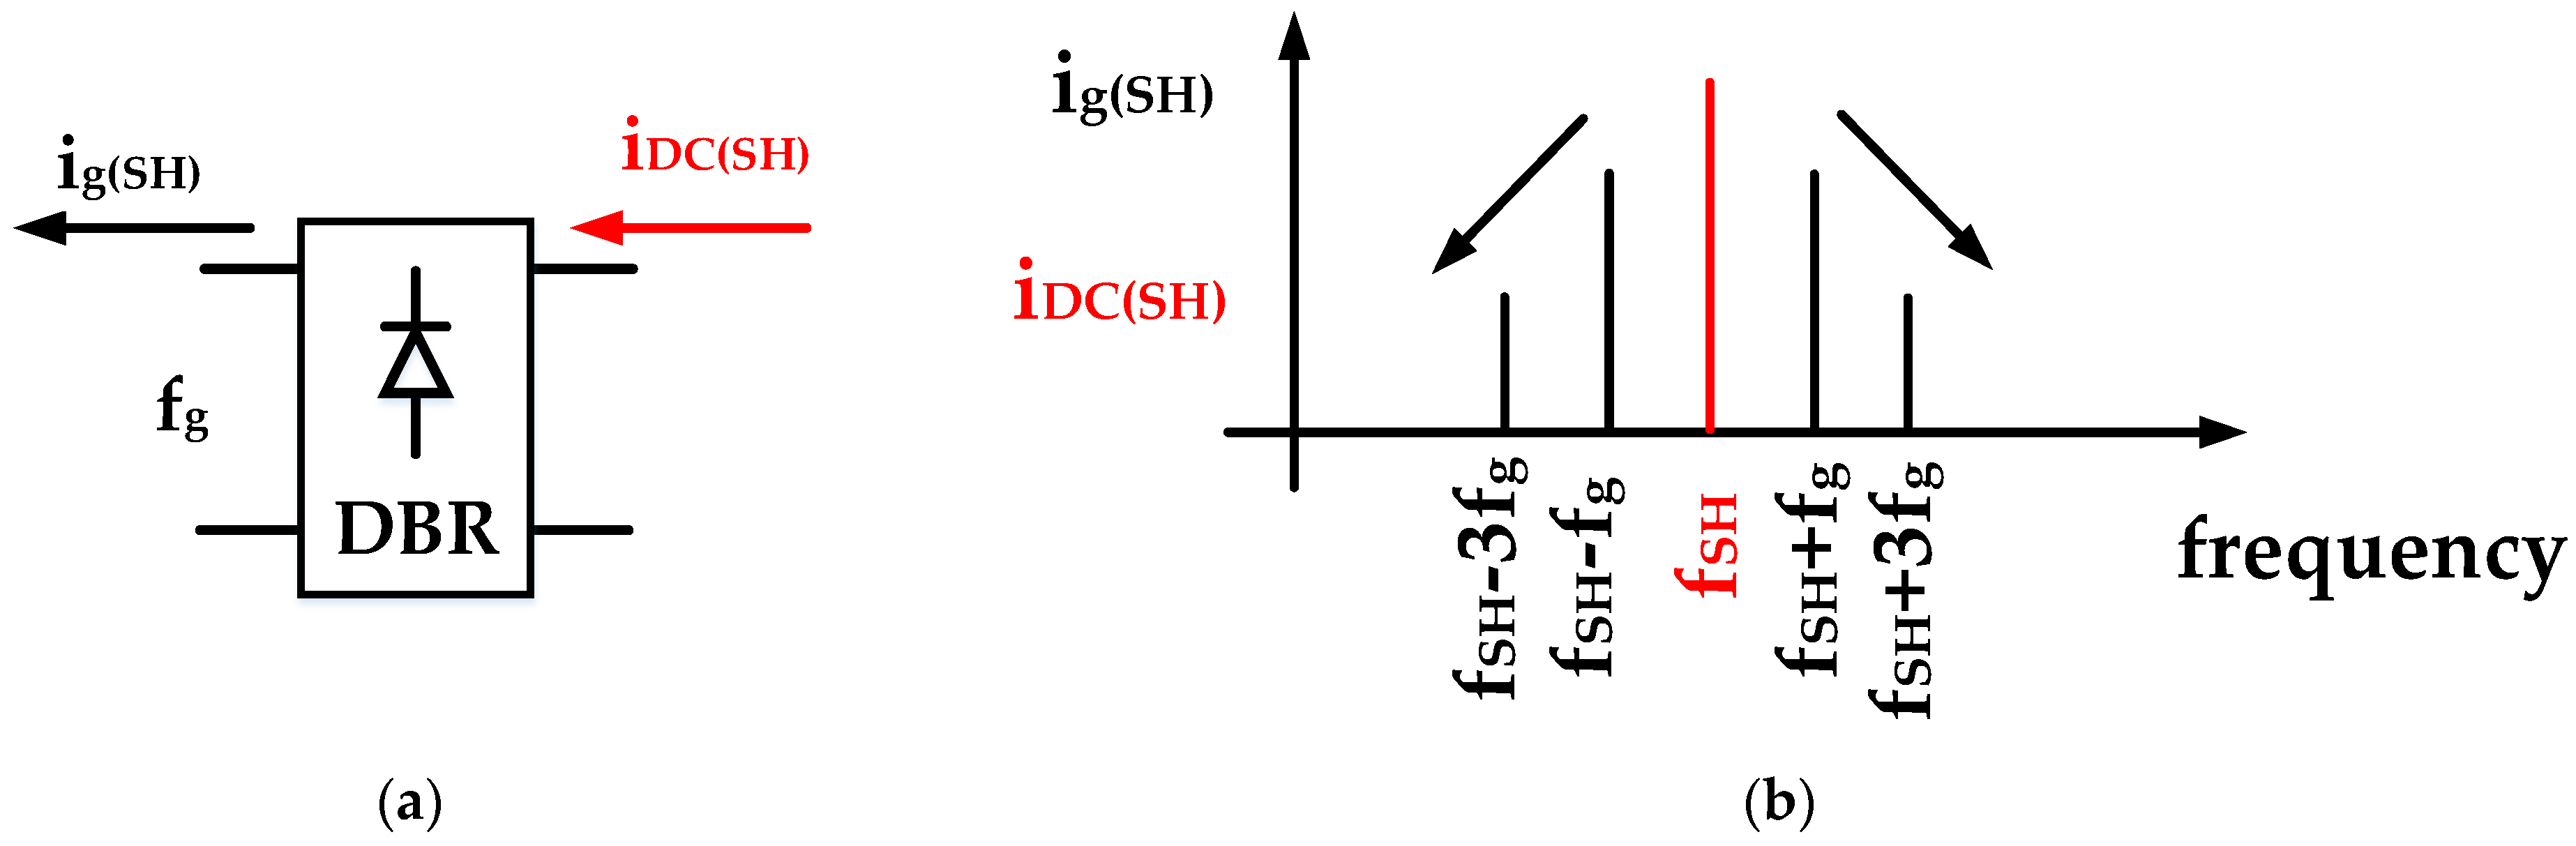
2.1. DBR Effect on the Harmonics Reflections on Both Sides

The DBR is considered the main connection between the AC and DC sides of the vast majority of the grid-connected AC/DC converters. It is used to convert the AC power from the grid into a DC one on the load side as a first conversion stage. However, it affects the flow of harmonics and SH between both sides. This is considered a key to studying the interference behavior of AC/DC converters due to SH distortion. In this subsection, the reflections of harmonics between the two sides of the DBR are discussed. Figure 1a shows a DBR with a supraharmonic (SH) current component generated from the background distortion. The SH current at the AC side is colored in black in Figure 1 and labeled as i g S H , while its reflection on the DC side is colored in red and labeled as i D C S H .
In order to estimate the i D C S H which represents the reflection of the i g S H , let i g S H be described by the following equation,
i g S H = I g S H cos   ( ω S H t )
Here, I g S H is the amplitude of the i g S H , ω S H is the SH component angular frequency where ω S H = 2 π f S H and f S H is the SH frequency, and t is the time vector. The current flows through the DBR. Consequently, i g S H is affected by the DBR. To determine the effect of the DBR, the following DBR function can be applied [33];
u D B R t = h = 1 h = o d d 2 h π sin   h π 2 c o s   ( h ω g t )
Here, u D B R is the DBR function and ω g is the grid angular frequency where ω g = 2 π f g and f g is the grid fundamental frequency. Then i D C S H can be obtained by multiplying Equations (1) and (2) as,
i D C S H = I g S H c o s   ( ω S H t ) × h = 1 h = o d d 2 h π sin   h π 2 c o s   ( h ω g t )
Equation (3) can be rearranged and modified to be as;
i D C S H = h = 1 h = o d d I g S H h π sin h π 2 cos ω S H h ω g t + cos ω S H + h ω g t
As deduced in Equation (4), one SH current component in the AC side is reflected into a sideband of harmonics in the DC side due to the DBR function. The amplitudes of the DC side reflected current are I g S H h π sin h π 2 with frequencies equal to f S H ± h f g . A graphical representation in the frequency domain of that phenomenon is shown in Figure 1b.
Likewise, if the SH current component is generated on the DC side, it is reflected in a band of SH components on the AC side. Equation (4) can be used to calculate the reflected SH components on the AC side. Figure 2 demonstrates these phenomena with the same colors and labels used in Figure 1.

2.2. Interference Problem

In this subsection, the interference between the primary emissions of AC/DC converters and the distortion in the grid is discussed and explained. Consider i ( f s w ) is a component of the primary emission of the AC/DC converter at the DC side of the DBR due to the switching behavior of such converters. If the AC/DC converter is subjected to a SH current component i g ( f S H ) generated from the background distortion, which represents a secondary emission of the AC/DC converter under study. Then, the DBR current at the AC side in the frequency domain is as depicted in Figure 3, in which the secondary emission added at f S H is in red color, and the primary emission of the AC/DC is indicated in black color. The following steps clarify the mechanism of the interference between the primary and secondary emissions of the AC/DC converter:
  • The secondary emission current at f S H   flows from the AC side of the DC side of the DBR. Consequently, this current is dissolved into an infinite number of components at the DC side as a result of the DBR effect, which appears as a sideband of SH around f S H . The components of that current can be calculated by Equation (4).
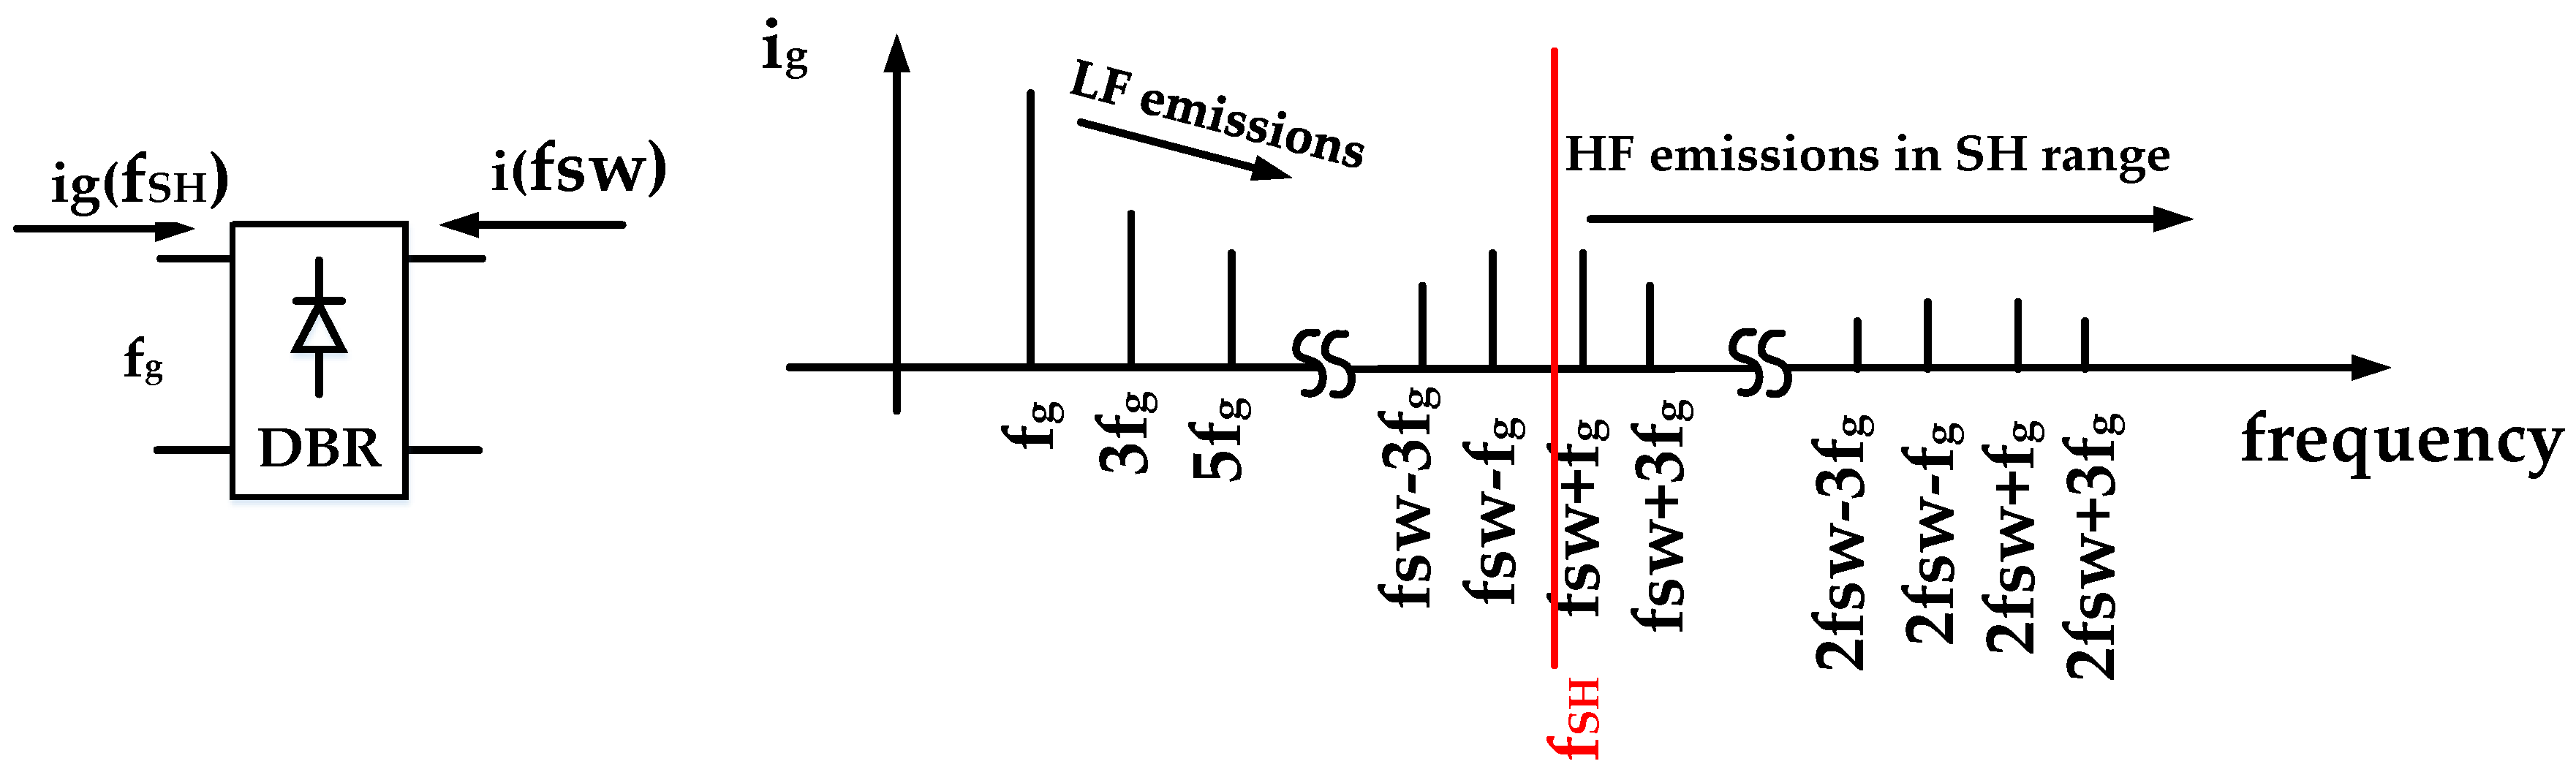
  • The primary emissions of the AC/DC converter, depicted in black in Figure 4, appear in three parts as [33]:
    LF distortion.
    Baseband harmonics at the switching frequency and its integer multiples.
    Sideband harmonics around the baseband frequencies.
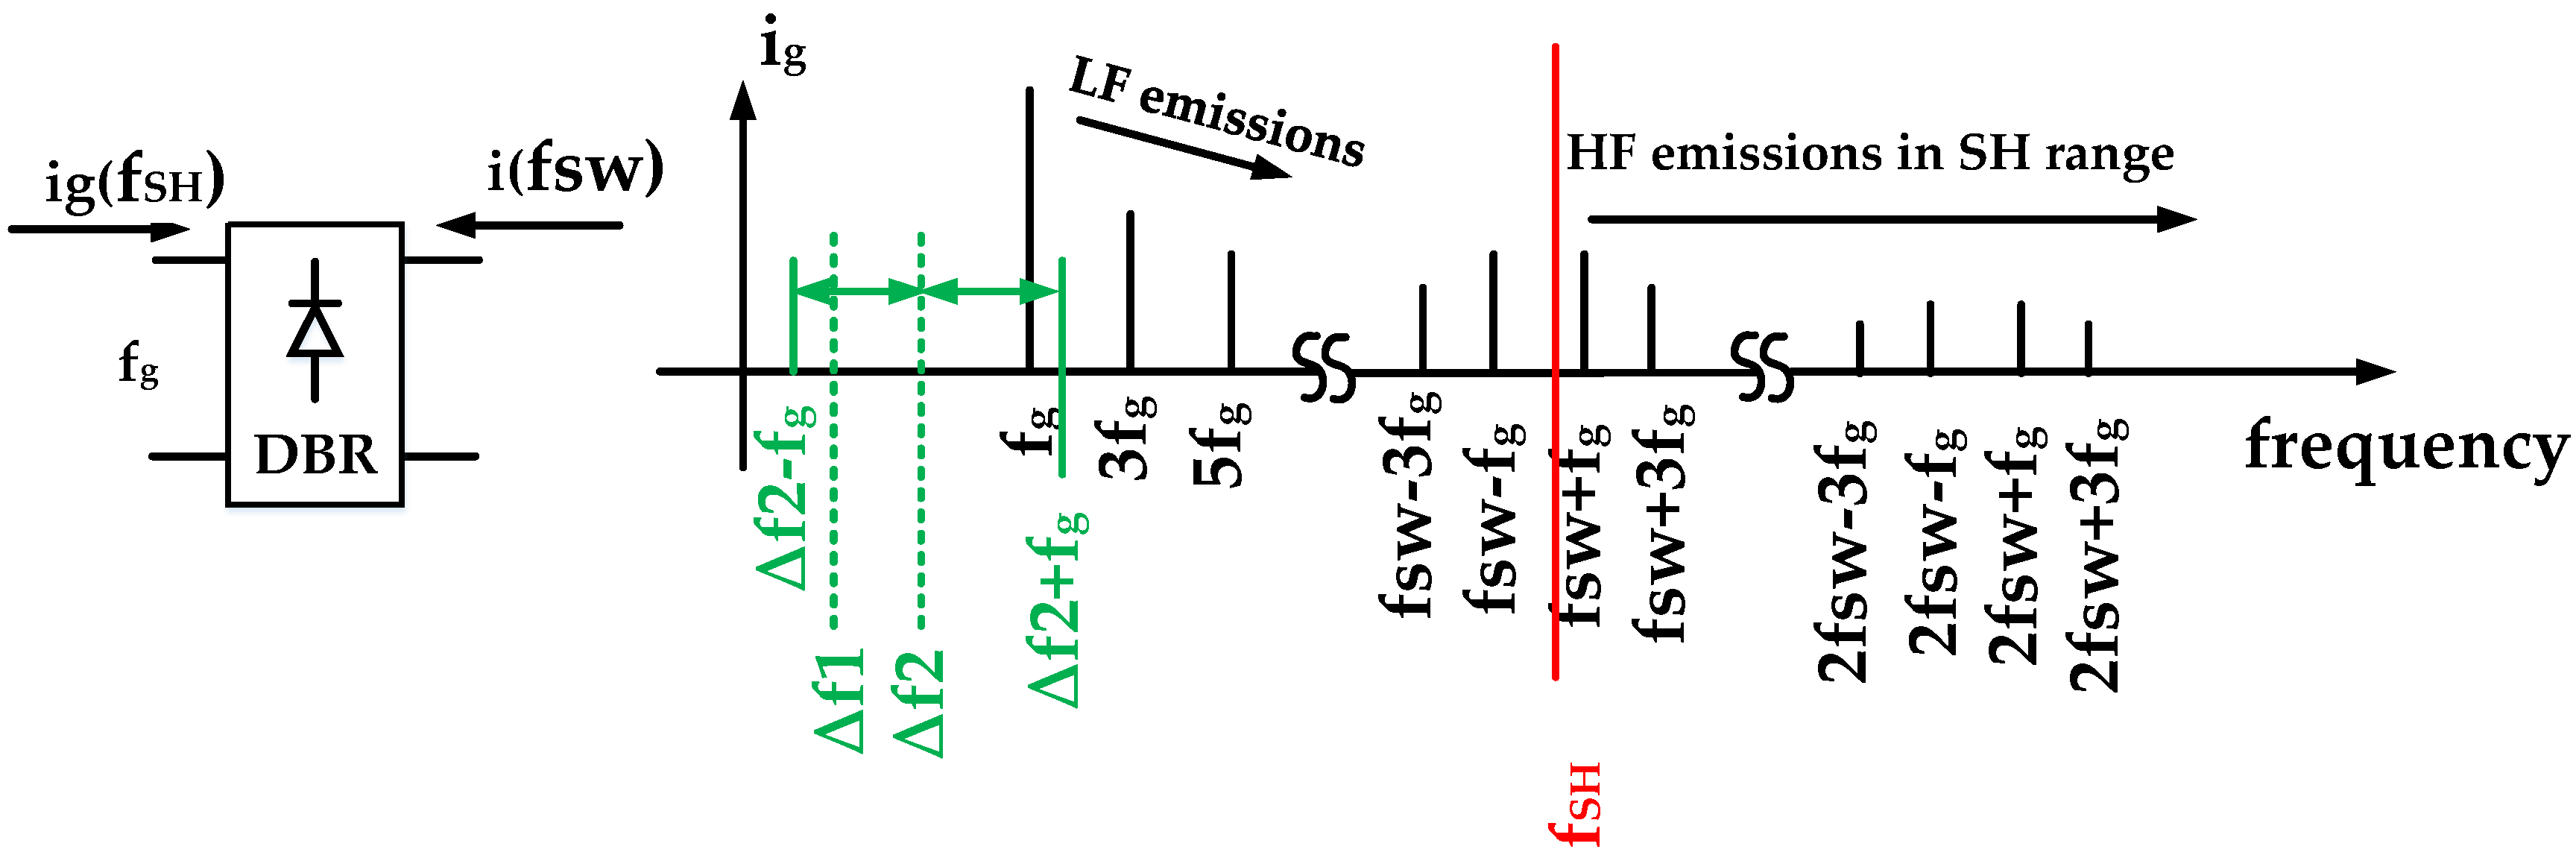
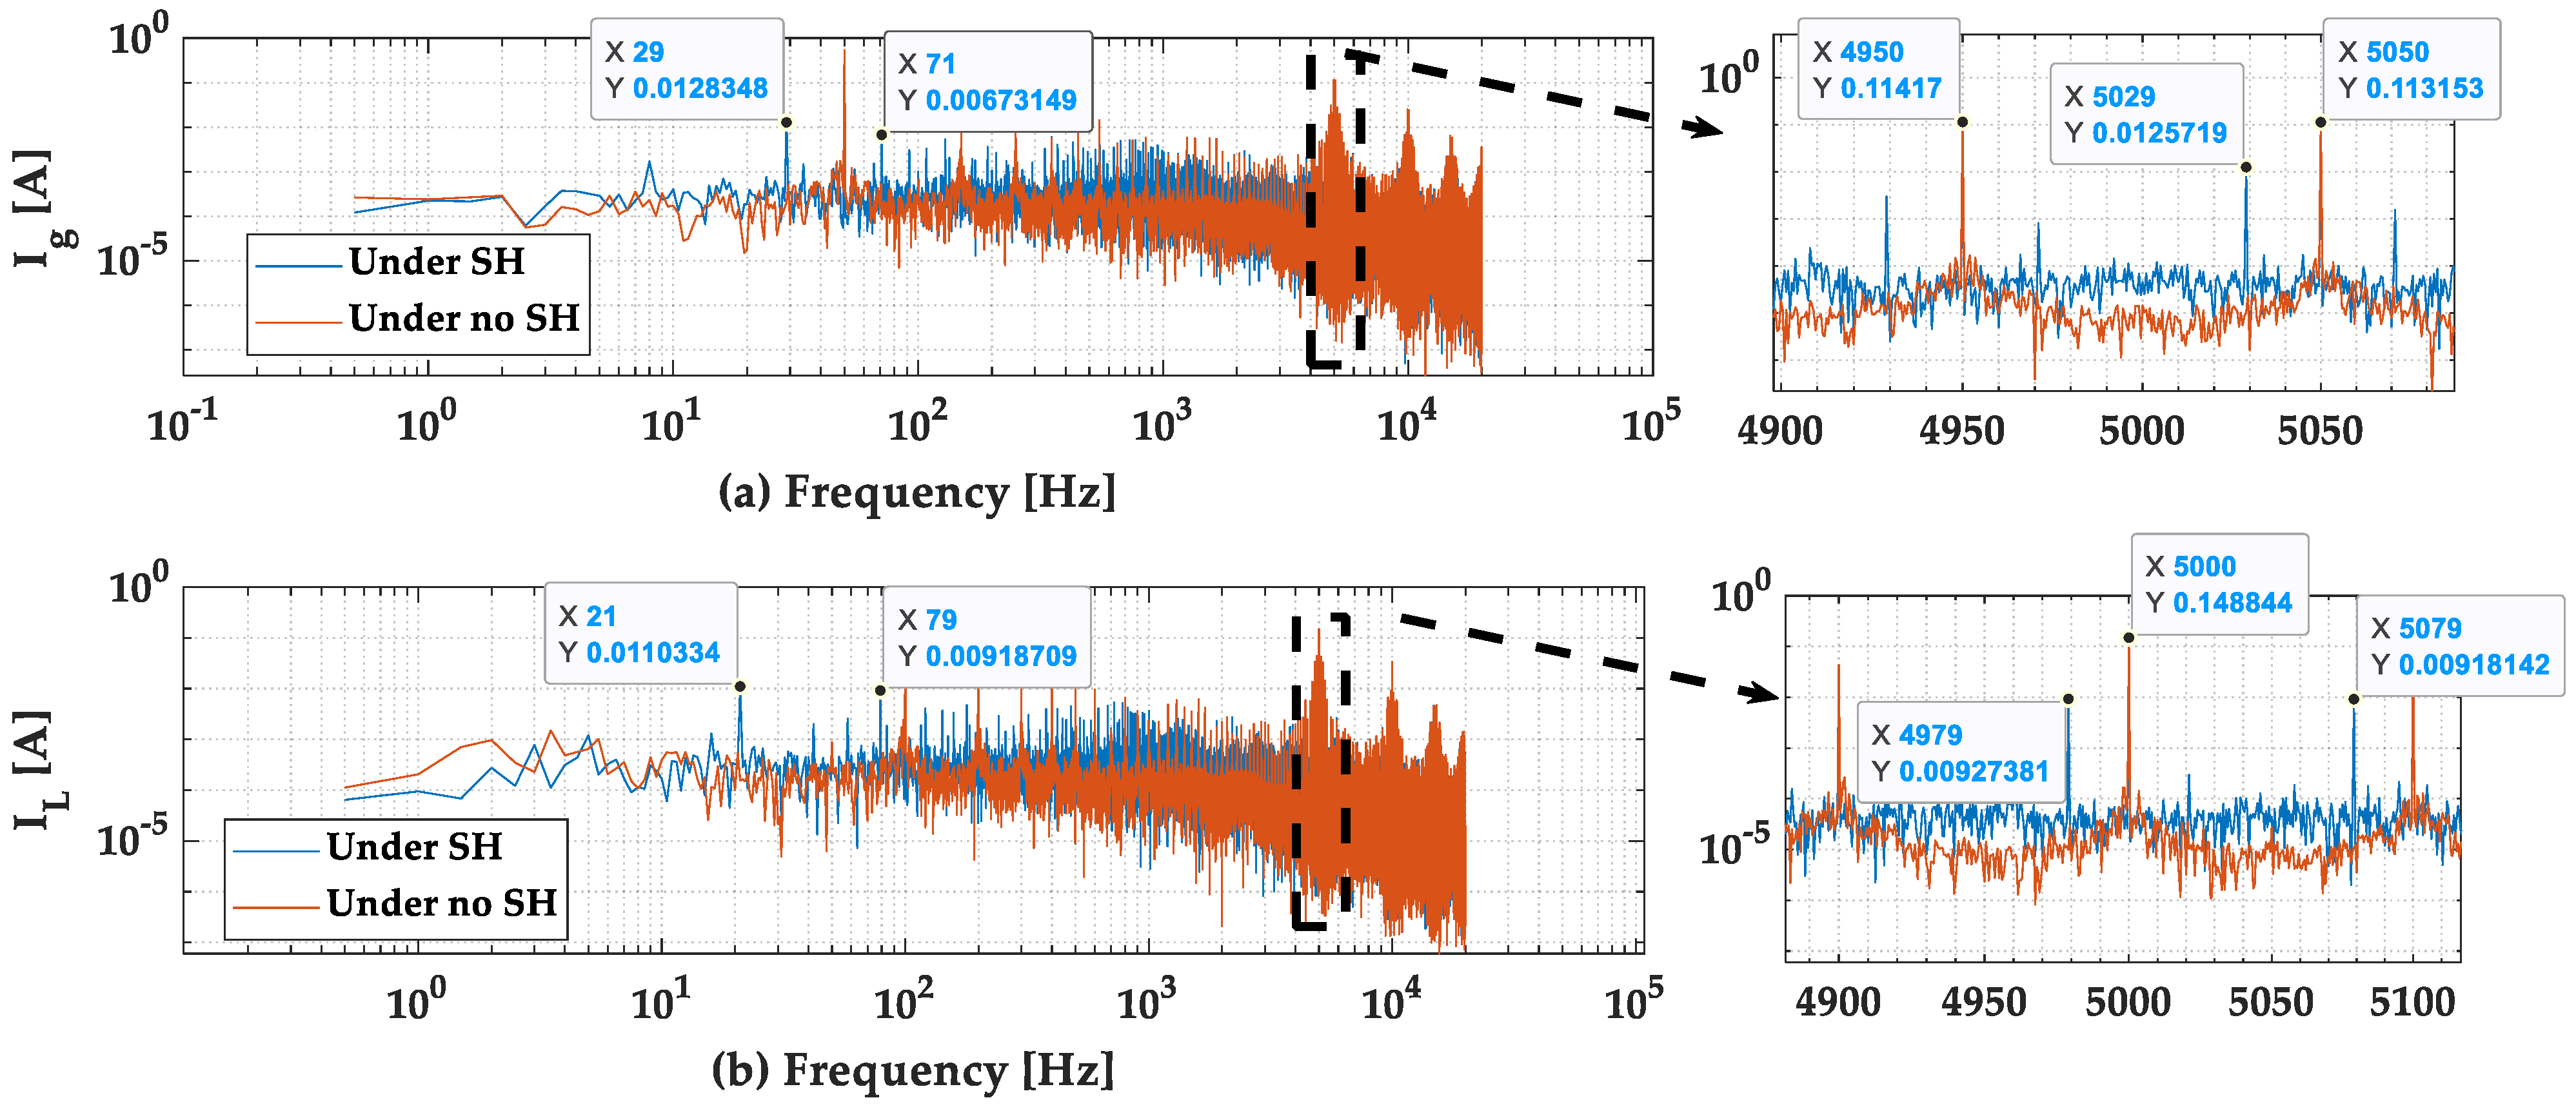
  • The frequency differences between the chosen SHs at f S H   f g and the nearest baseband are Δ f 1   and Δ f 2 , respectively. These differences are shown in green in Figure 4.
  • In the LF range, additional emissions appear at Δ f 1   and Δ f 2 due to the interference between the baseband primary SH and the secondary emission. The additional emissions are drawn in green in Figure 4. Then, these additional emissions flow towards the DBR.
  • The additional emissions at Δ f 1   and Δ f 2 are affected by the DBR function while they cross the DBR to the AC side. They appear as bands of harmonics based on Equation (4). The reflections of added emissions in the AC side of the DBR are as shown in Figure 5.

3. Simulation and Experimental Verification

3.1. System Implementation for Simulation and Experimental Studies

The system under study is the PFC boost converter (Figure 6) as a common example of AC/DC converters. The control algorithm consists of an outer and an inner control loop. The former one is used to control the output voltage, while the latter is used to control the inductor current for PFC purposes.
For the simulation and the experimental studies, a PFC boost setup is implemented in MATLAB/Simulink for the simulation study and in the lab for the experimental one, as shown in Figure 7. It consists of a step-down transformer that is used to reduce the grid voltage from 230 V down to 66 V in the experimental setup. The transformer is used because the output resistor has a 100 W rating with a resistance value of 600 Ω. This means the maximum voltage that can be applied at the output is around 240 V, which highlights the importance of using the step-down transformer. As there are no limitations in the simulation study, no transformer is used for the simulation model. However, the grid voltage used for the simulation study is 66 V, as in the experimental one. It was found that the simulation and experimental results were identical. This, in turn, assures that the transformer used in the experimental study has no significant effect on the results. According to the PFC boost theory, no capacitor is used on the DC side of the DBR for the purpose of PFC [33]. The parameters used for the PFC boost setup are listed in Table 1 for both simulation and experimental studies. The parameters are chosen based on what exists in the lab. Indeed, there should be harmony between the power and control circuit parameters designs to obtain the optimum PFC operation. However, the parameter values used for the simulation and experimental ones give accepted PFC performance for this study. For the experimental study, the control algorithm is built, and the driving pulse is obtained from dSPACE MicroLabBox rti1102 with a step time of 20   μ S e c . This limits the switching frequency to 5 kHz. The voltage and currents are measured by means of a Taraz USM-3IV voltage current measurement kit. The bandwidths of the Taraz USM-3IV are 100 kHz and 200 kHz, respectively. The SH voltage components added to the grid voltage are generated by the IMU SLAVE SMART EXT-SMART V1, which is driven by the IMU-MGS 5KV EFT/burst and surge compact generator.
Two case studies were performed in both simulation and experimental studies to study the effect of the PFC boost converter exposed to a SH background distortion. In each case study, two scenarios are compared. The first scenario is conducted with no distortion in the grid. The second scenario is polluting the grid with a SH distortion. The two case studies are similar. However, the diversity between the SH distortion frequencies in each case study confirms the analysis. The SH distortion is added to the grid by means of EXT-SMART V1 for the experimental study. In the simulation study, the two case studies are repeated with an output resistance of 100   Ω , which means the output power increases by six times.

3.2. Simulation Study

Before going to the case studies, the system results in the time domain are presented at no SH distortion to confirm the system performance. The output voltage waveforms with the reference values are shown in Figure 8 and Figure 9 for the low and high output power, respectively. It is clear that the voltage loop controller succeeds in regulating the output voltage according to the reference one.
The simulated results of the reference current that is calculated from the rectified voltage and the actual inductor currents are as demonstrated in Figure 10 and Figure 11 for the low and high output power, respectively. It is clear from the simulated results that, the inner loop for the current controller managed to make the inductor current follow the reference one.
The resultant simulated input currents at the AC side of the DBR and the grid voltage are as shown in Figure 12 and Figure 13 for the low and high output power, respectively. It is clear that the PFC function is achieved in both cases.

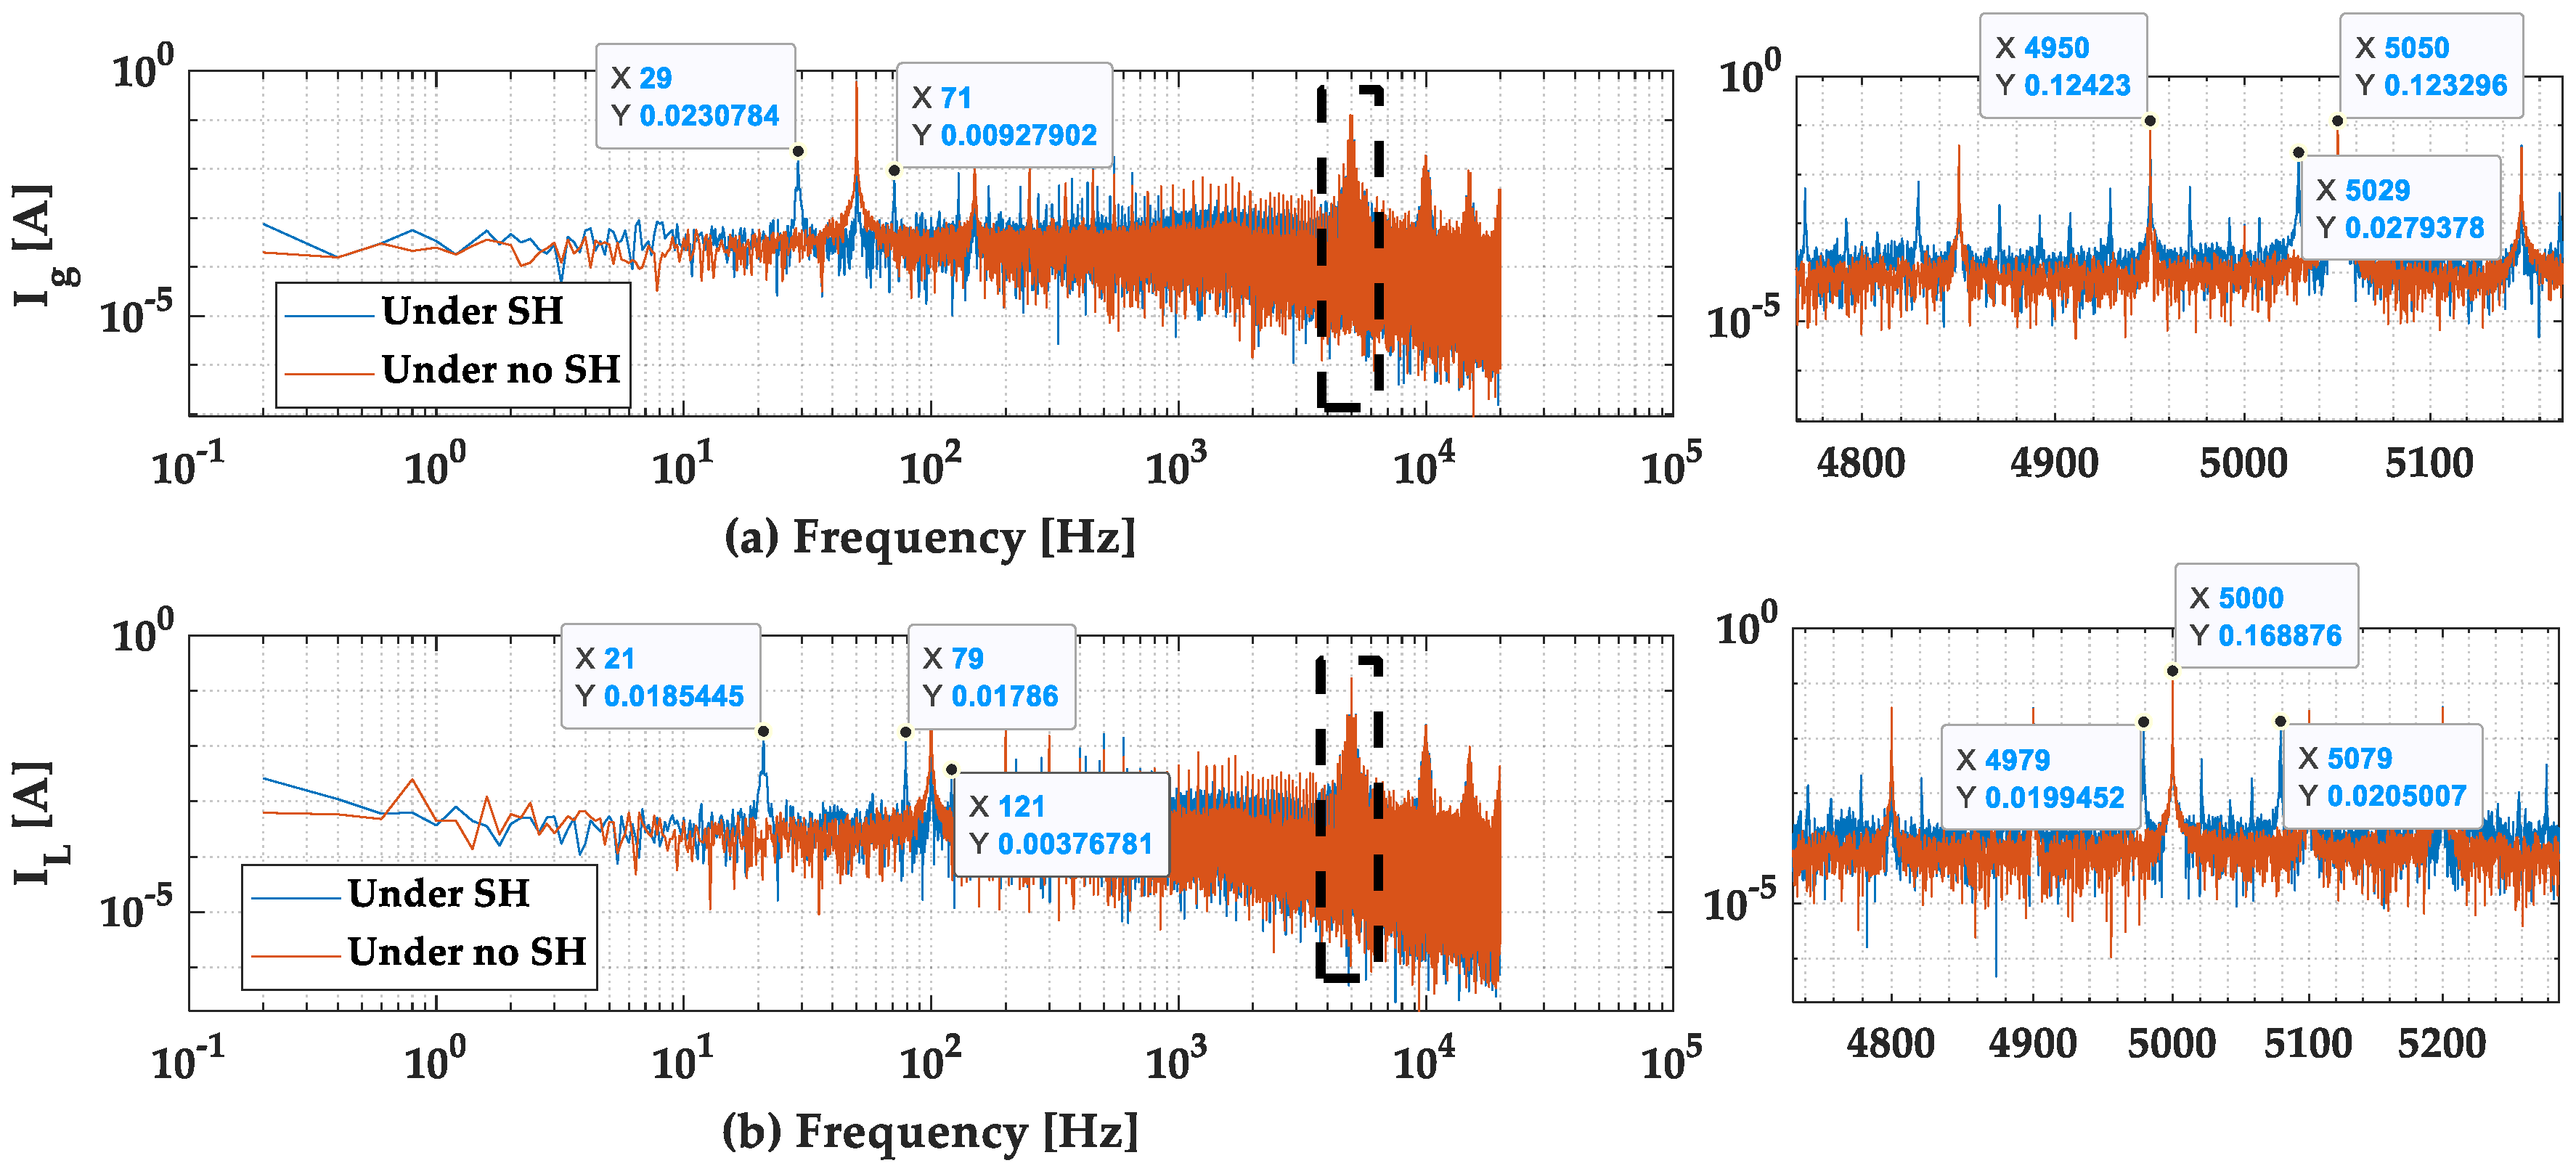
3.2.1. Case Study 1: Grid Voltage Distorted with a SH Component at 5029 Hz

In the 1st case study, two scenarios are compared; the first scenario is conducted by adding no SH distortion to the grid. The second scenario is carried out by adding a SH distortion at 5029 Hz, with an amplitude of 3% of the grid one. The results of the grid current and the boost inductor current in the frequency domain for both scenarios of Study 1 are shown in Figure 14. From the results, the SH current generated from the background distortion at 5029   H z is transferred to the DC side of the DBR as a sideband SH around 5029   H z . The components at 4979   H z and 5079   H z represent two examples of the DC-side components of the SH distortion at 5029   H z from the grid. Due to the switching behavior of the PFC boost, many SH components at the DC side of the DBR are transferred to the grid side based on the DBR function. For example, the SH at 5000   H z represents one of the primary emissions of the PFC boost on the DC side. This primary component interferes with the grid distortion at the DC side of the DBR. The frequency differences between the primary SH component and the chosen examples at 4979   H z and 5079   H z , which can be defined as Δ f 1 and Δ f 2 , are 21   H z and 79   H z , respectively. As a result of the interference, LF components appear in the DC side current at 21   H z and 79   H z . Then, the generated LF components transfer to the AC side as a sideband emission based on the DBR function. For example, the LF at 29   H z and 71   H z resulted from the DBR DC-side emissions at 79   H z and 21   H z , respectively. The relationship among the additional emissions, the grid distortion, and the primary emissions of the PFC boost are summarized in Table 2 and Table 3.
To check the interference and the added emissions in higher power PFC boost, the output resistance is changed from 600   Ω to 100   Ω , which means the output power increases by six times. Then, scenarios 1 and 2 of study 1 are performed for both loading conditions. The results of study 1 with higher power are then compared with the one with lower power, as shown in Figure 15 and Figure 16. It can be concluded from the results that The SH primary emissions are almost the same for both loading conditions. Moreover, the added emissions due to the interference are detected at the same frequencies but with different amplitudes. As the amplitudes of the added emissions depend on the grid impedance, which is still unmodelled in the SH range, calculating the amplitudes is considered as a future work.

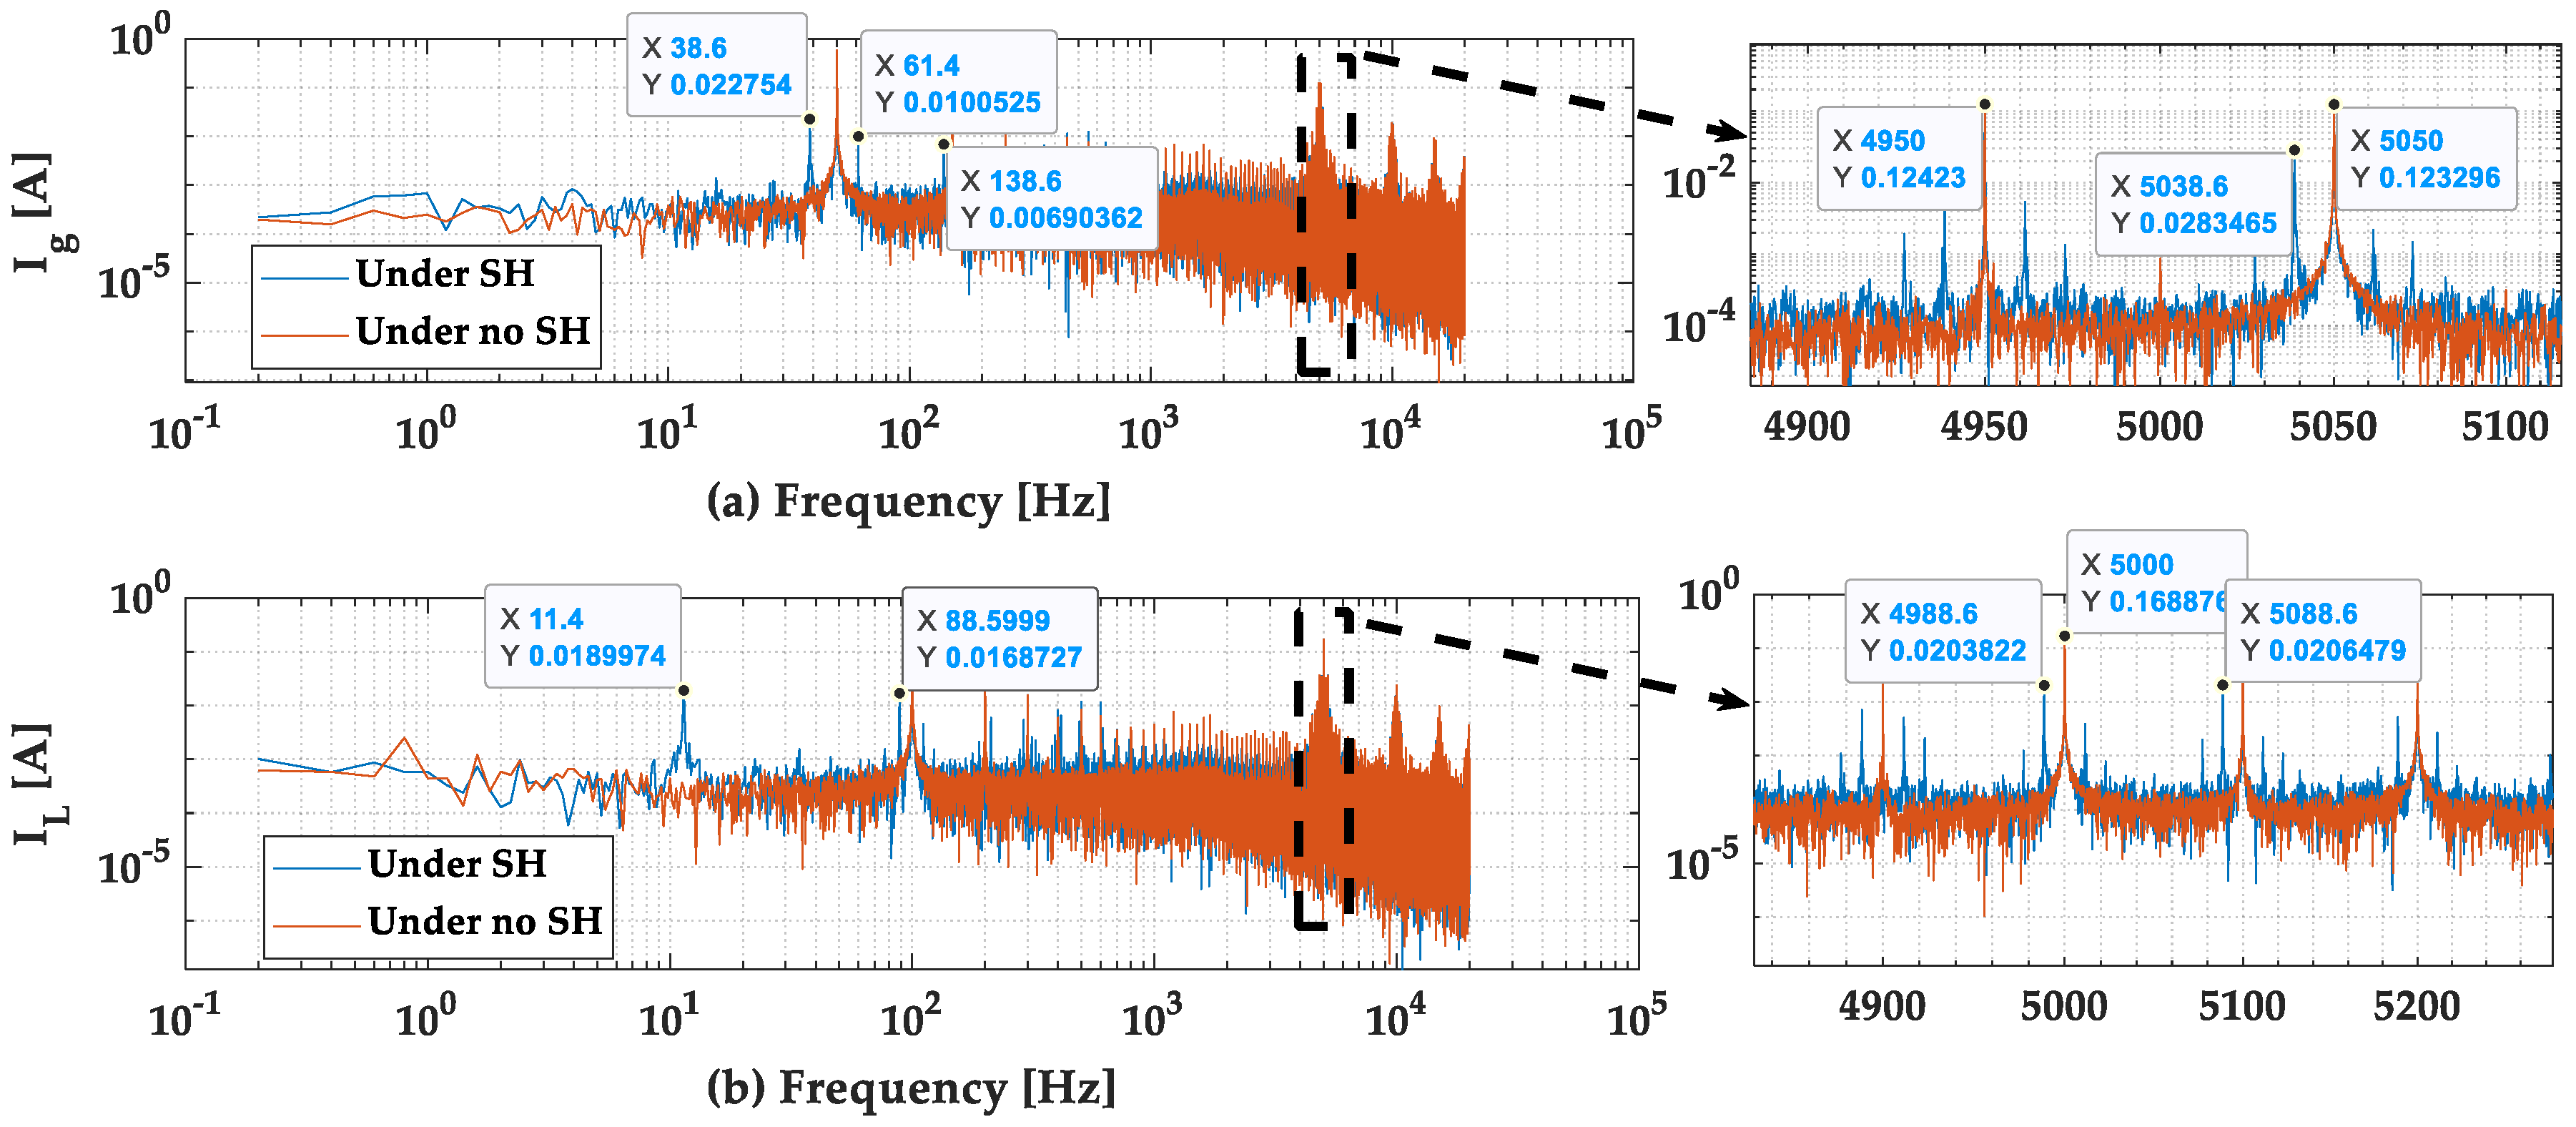
3.2.2. Case Study 2: Grid Voltage Distorted with a SH Component at 5038.6 Hz

In the 2nd case study, two scenarios are performed and compared. In the first scenario, no SH is added to the grid. While a SH grid distortion at 5038.6   H z is added to the grid voltage. The frequency domain results of the AC-side and the DC-side currents of the DBR for both scenarios of Study 2 are shown in Figure 17. The SH current at 5038.6   H z is transferred as a sideband SH in the DC-side of the DBR, for example, at 4988.6   H z and 5088.6   H z . The aforementioned SH distortion components interfere with the primary emission component of the PFC boost at 5000   H z . The resultant is additional LF emissions appear in the DC-side current at 11.4   H z and 88.6   H z . The resultant LF emissions on the DC side of the DBR are then transferred to the AC side of the DBR based on the DBR effect. For example, the LF emission at 38.6   H z is the grid current is a component of the AC-side reflection of the DC-side component at 88.6   H z . While the LF emission at 61.4   H z in the grid current is resulted from the DC-side component at 11.4   H z .   Table 2 and Table 3 sum up the relationship between grid distortion, primary emission, and added emissions.
The output resistance is changed from 600   Ω to 100   Ω in order to compare the interference and the added emissions between PFC boost with different loading conditions. Then, scenario 2 of study 2 is performed for both loading conditions, while scenario 1 of study 2 is with the same results shown in Figure 15. The results of the comparison are shown in Figure 18. It is clear from the results that The SH primary emissions are almost the same for both loading conditions. In addition to that, the added emissions are detected at the same frequencies but with different amplitudes.

3.3. Experimental Study

The two case studies in the simulation were conducted experimentally in order to verify the analysis and the simulation results. The following subsections provide the experimental verification of case studies 1 and 2. Before going to the two case studies, the measured time data is first discussed to show the performance of the system. Figure 19 gives the experimental data of the output voltage at the steady state, which confirms the good performance of the output voltage loop controller.
The experimental data of the inductor current is as shown in Figure 20. It is clear from the results that, the inductor current has a rectified shape. This, in turn, confirms the inner loop controller operation. As a result, the input current in the AC-side of the DBR follows the sinusoidal shape of the input voltage as shown in Figure 21.

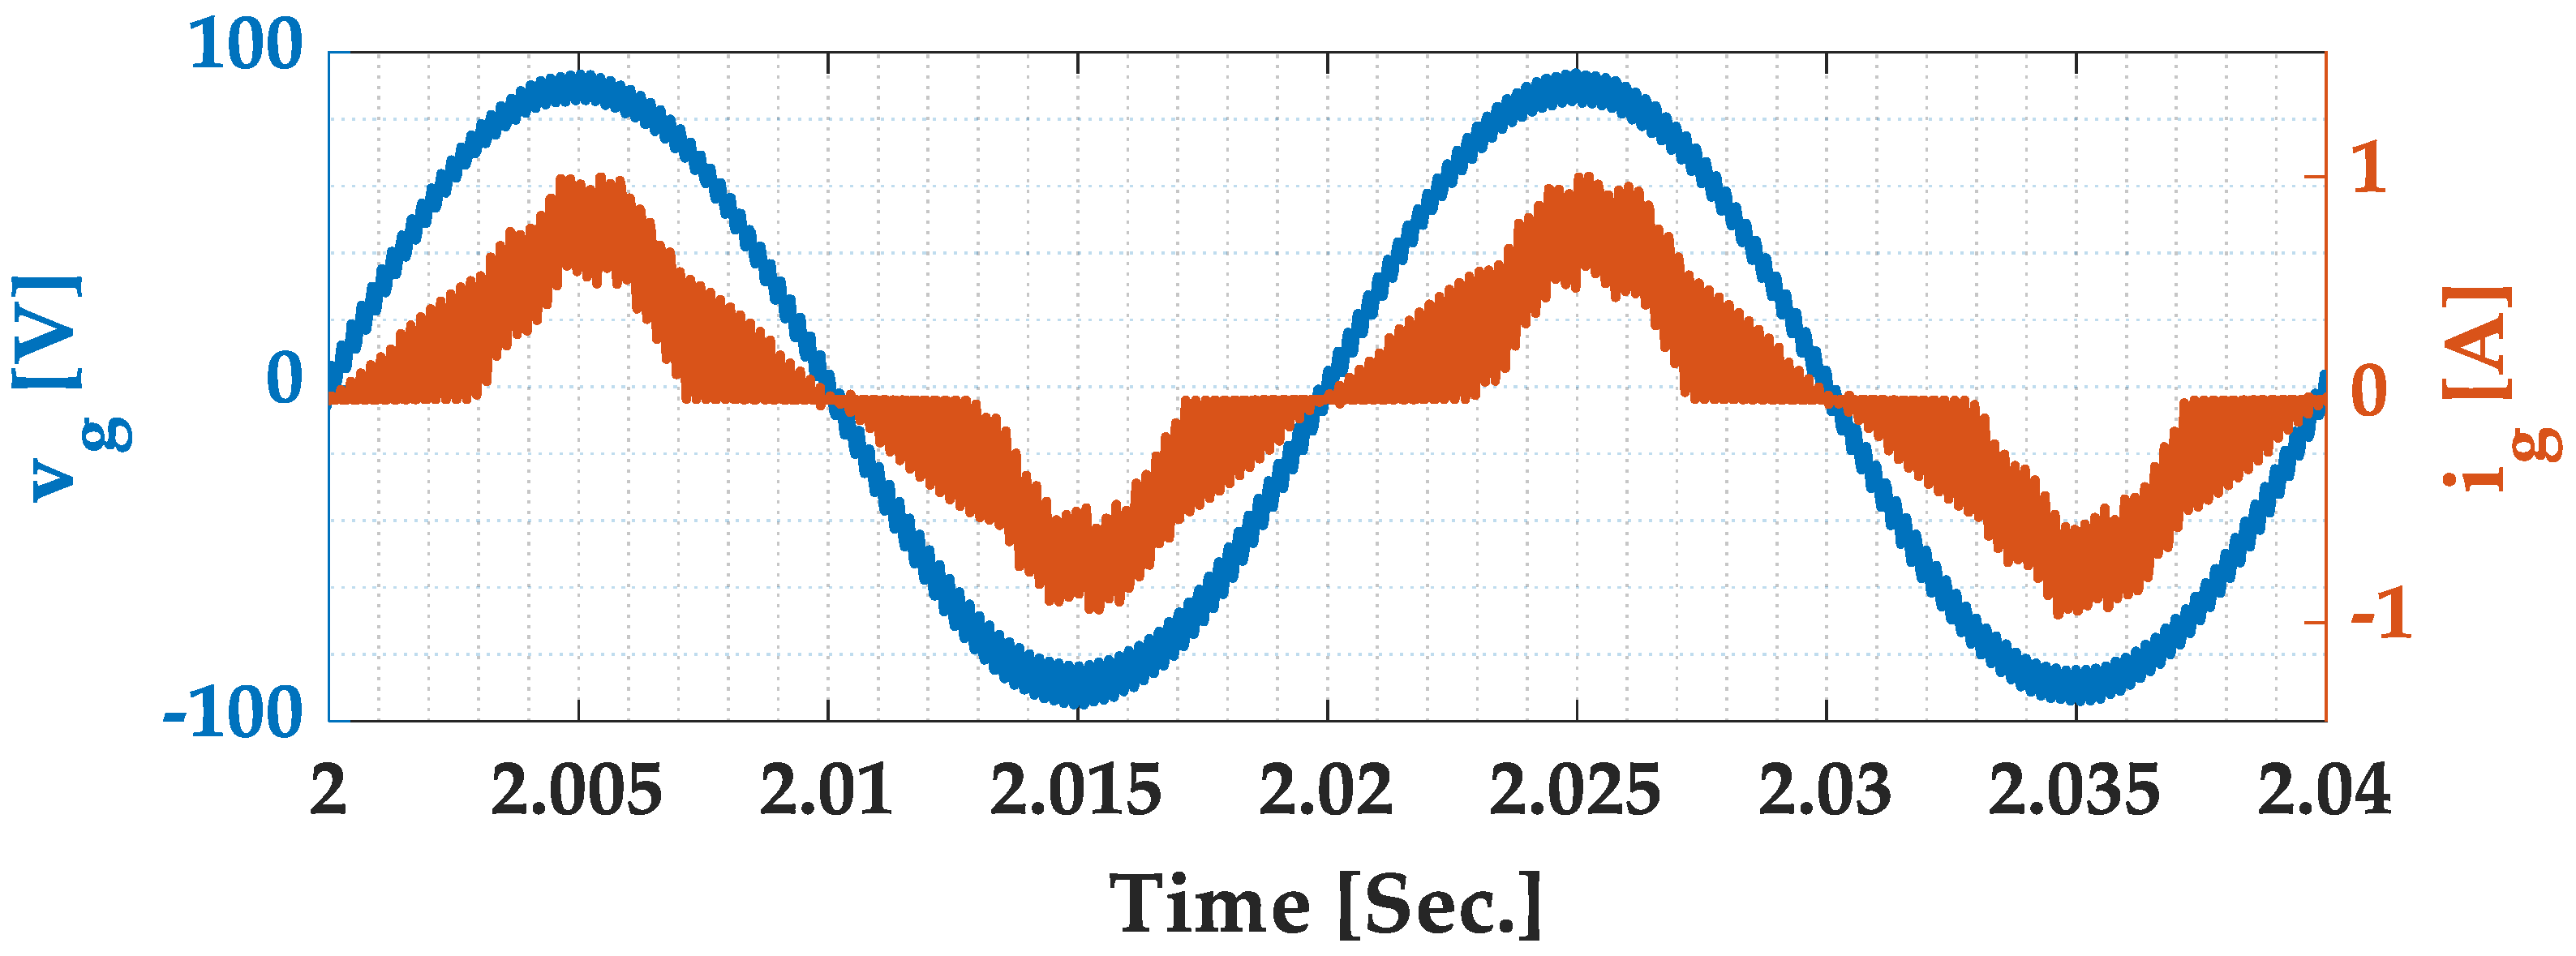
3.3.1. Case Study 1: Grid Voltage Distorted with a SH Component at 5029 Hz

In this study, Scenario 2 is conducted by adding a SH voltage component to the grid voltage at 5029 Hz with an amplitude of 5% of the grid voltage one. Then, scenario 2 is compared with scenario 1, where no SH distortion is added to the grid. The experimental results of the inductor current, which is the DBR DC side current, and the grid current, which is the DBR AC side current, are shown in Figure 22 for both scenarios. It is obvious from the results of scenario 2 that the 5029   H z component appears as a band in the DC side of the DBR, for example, at 4979   H z and 5079   H z with Δ f 1 and Δ f 2 equal to 21   H z and 79   H z , respectively. Then, additional LF emissions are measured at 21   H z and 79   H z in the inductor current, which is not seen in scenario 1. The added LF emissions are then transferred through and affected by the DBR. Consequently, additional emissions at 29   H z and 71   H z are detected in scenario 2 grid current. Following Equation (4), the component at 29   H z is an AC side component of the DC side emission at 79   H z . While the one at 71   H z is an AC side component of the DC side emission at 21   H z . The additional emissions and their relationship with the grid distortion and the primary emissions of the PFC boost are summarized in Table 2 and Table 3.

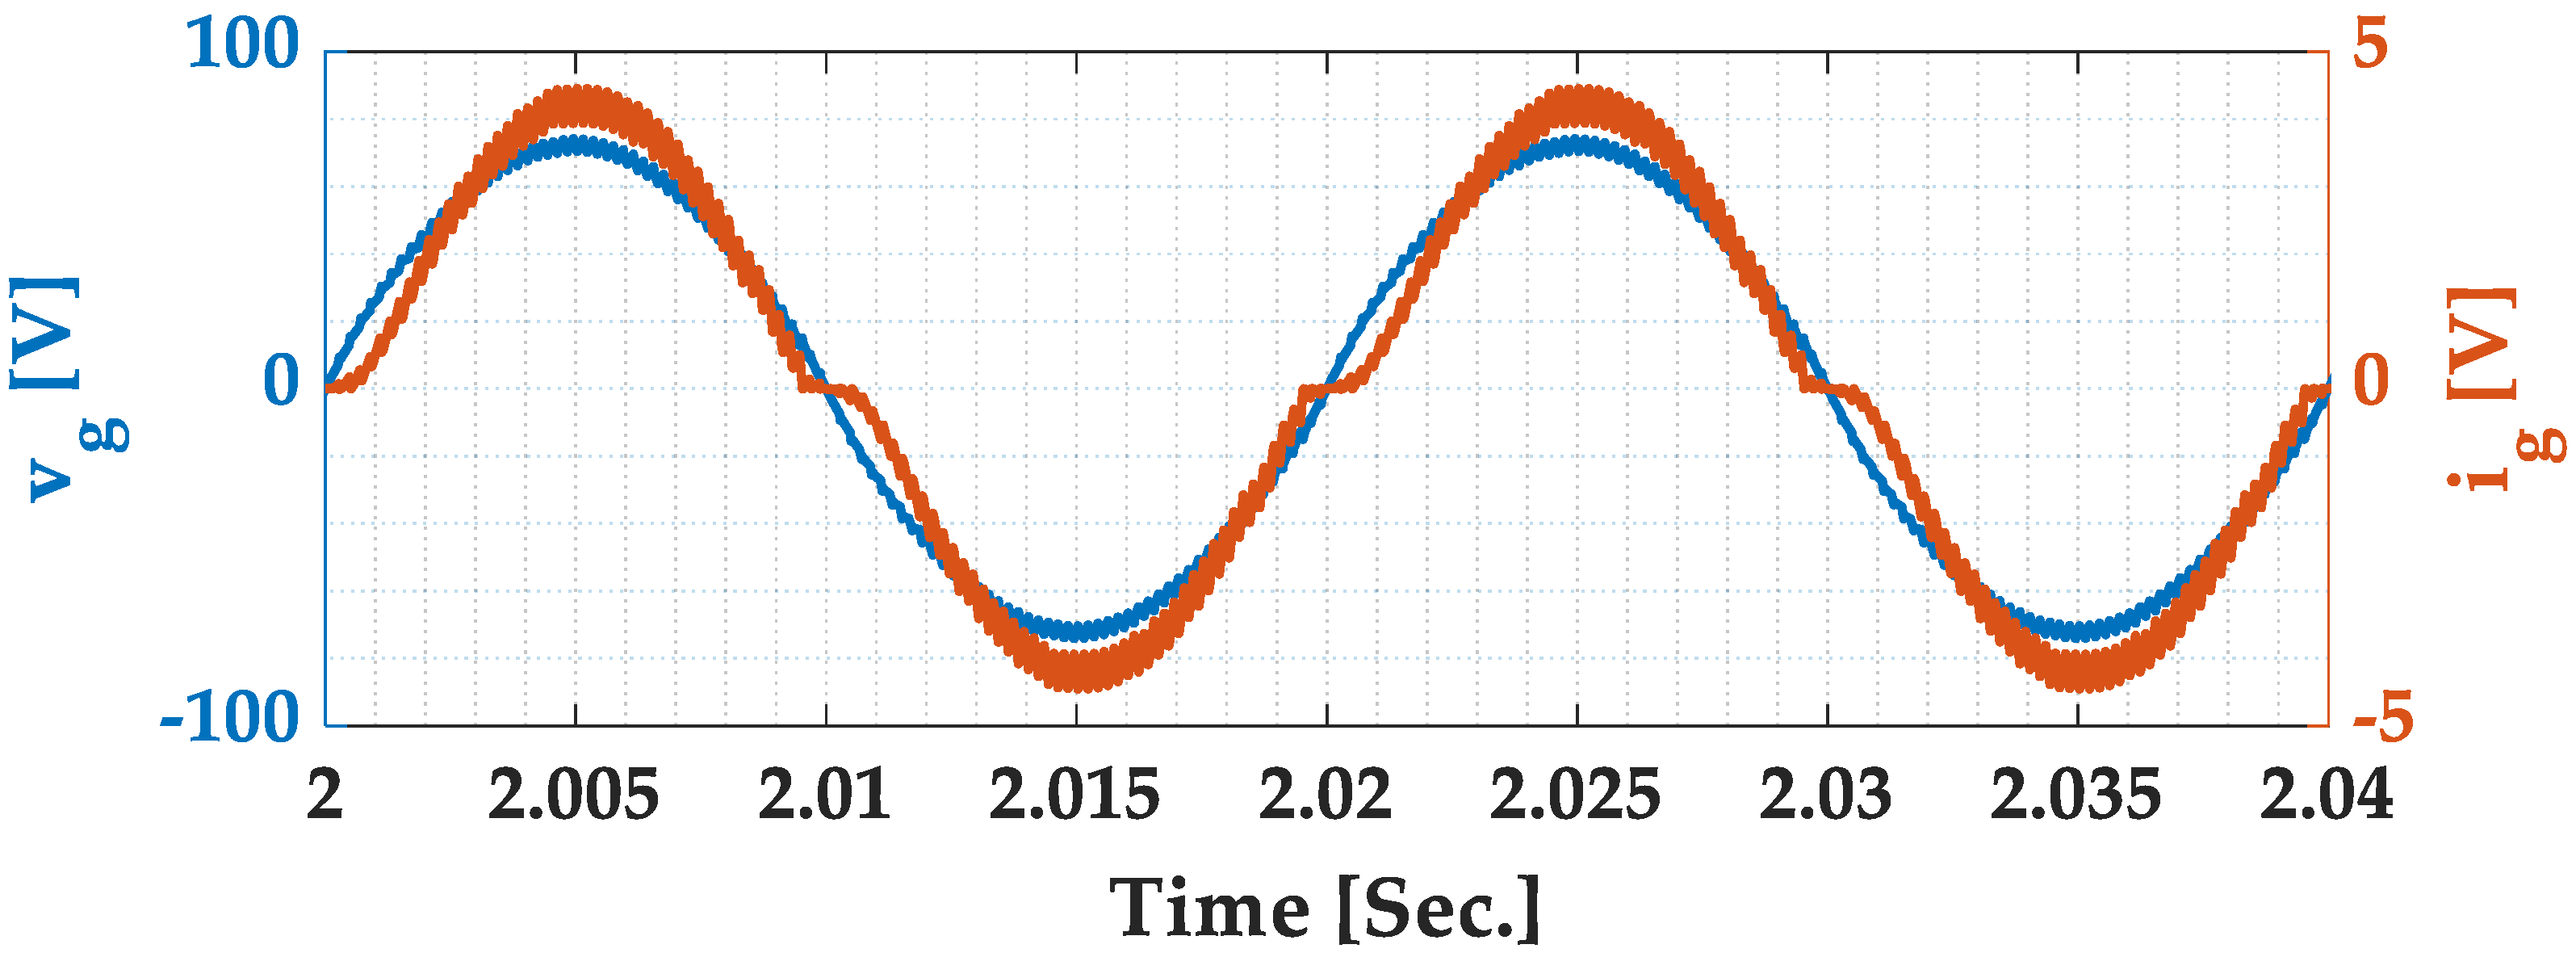
3.3.2. Case Study 2: Grid Voltage Distorted with a SH Component at 5038.6 Hz

Scenario 1 of study 2, where there is no SH distortion in the grid, is compared with scenario 2, where a SH voltage component at 5038.6   H z is added to the grid voltage with 5% amplitude of the grid one. The experimental study results of this study in the frequency domain are shown in Figure 23. In scenario 1, no additional emissions are measured in the AC and DC side currents of the DBR. However, adding a SH distortion at 5038.6   H z to the grid leads to measuring additional emissions in the grid and inductor currents of the PFC boost. As discussed in Section 2, The AC side component at 5038.6   H z is converted into an infinite number of components at the DC side; for example, at 4988.6   H z and 5088.6   H z with Δ f 1 and Δ f 2 equal to 11.4   H z and 88.6   H z , respectively. Then, additional emissions appear at 11.4   H z and 88.6   H z in the DC side current. These components flow towards the grid and are affected by the DBR. This, in turn, contributes to the additional emissions in the AC side current. For example, the additional emission at 38.6 Hz is a result of the DC component at 88.6   H z . While the one at 61.4   H z is an AC side component of the DC emission at 11.4   H z . Table 2 and Table 3 show the relationship between the additional emissions, the grid distortion, and the primary emissions of the PFC boost.

4. Conclusions and Future Work

In this paper, the effect of a distorted grid voltage in the SH range on the AC/DC converters has been studied. It has been found that the SH current generated from the distorted grid is reflected as a sideband of SH components in the DC side of the PFC boost converter directly after the DBR. The DBR function is the main reason for that phenomenon. These SH components in the DC side of the DBR interfere with the switching harmonics of the AC/DC converters in the SH range, resulting in additional emissions in the LF range. The additional emissions are transferred through and affected by the DBR. This results in the occurrence of LF components, both sub- and interharmonics, at the AC side current of the AC/DC converters. The study was conducted by implementing a dSPACE-based setup for a PFC boost as an example of AC/DC converters, and the results obtained were analyzed in a MATLAB software environment.
This work can be extended in the future to fulfill the following:
Developing a mathematical modeling approach to calculate the additional emissions resulting from the interference between the background voltage distortions in the SH range and the primary emissions of AC/DC converters. However, developing this mathematical model still faces many challenges [30], such as the grid impedance model in SH range still being simulation-based. However, obtaining a mathematical modeling approach in SH range for the grid is essential to predict the amplitudes and phases of this additional emissions which is still missing in literature [30].
This study will include the experimental interference in high-power AC/DC converters by taking into account the effect of the equivalent series resistance on the primary emissions of such converters.
Studying the effect of the continuous, critical and discontinuous modes on the primary emissions of AC/DC converter as is still missing in the literature [33]. This could help side by side with the grid modeling approach in predicting the effect of the aforementioned modes on the interference.

Author Contributions

M.S.O.: conceptualization, methodology.; software, formal analysis, investigation, resources, data curation, writing—original draft preparation, review and editing, visualization. A.M.A.: conceptualization, methodology.; software, formal analysis, investigation, resources, data curation, review, and editing, and visualization. J.K.: conceptualization, methodology.; software, formal analysis, investigation, resources, data curation, writing—original draft preparation, review and editing, visualization, supervision, project administration, funding acquisition. J.D. writing—review and editing, visualization, supervision. All authors have read and agreed to the published version of the manuscript.

Funding

This research is funded by Flanders Innovation and Entrepreneurship (VLAIO) and is part of the cSBO project IMPERFECT (HBC.2021.0175).

Data Availability Statement

Data are contained within the article.

Conflicts of Interest

The authors declare no conflict of interest.

Abbreviations

The following abbreviations are used in this manuscript:
DBRdiode bridge rectifier
EMIelectromagnetic interference
EVelectric vehicles
GCIgrid connected inverters
LEDlight emitting diode
LVlow voltage
PEpower electronics
PFCPower Factor Correction
RCripple control
SHsupraharmonic
VFDvariable frequency drives

Variables

The following variables are used in this manuscript:
f g Grid frequency
f S H The frequency of the SH current generated from the background distortion
I g S H The amplitude of the SH current generated from the background distortion
i g S H Instantaneous SH current generated from the background distortion
i D C S H The instantaneous reflection of i g S H in the DC side of the DBR
u D B R Diode bridge rectifier

References

  1. Osheba, M.S.; Lashine, A.E.; Mansour, A.S. Design, implementation and performance evaluation of multi-function boost converter. Sci. Rep. 2023, 13, 4276. [Google Scholar] [CrossRef] [PubMed]
  2. Harbi, I.; Ahmed, M.; Rodriguez, J.; Kennel, R.; Abdelrahem, M. Low-complexity finite set model predictive control for split-capacitor ANPC inverter with different levels modes and online model update. IEEE J. Emerg. Sel. Top. Power Electron. 2022, 11, 506–522. [Google Scholar] [CrossRef]
  3. Grevener, A.; Meyer, J.; Rönnberg, S.; Bollen, M.; Myrzik, J. Survey of supraharmonic emission of household appliances. CIRED-Open Access Proc. J. 2017, 2017, 870–874. [Google Scholar] [CrossRef]
  4. Alkahtani, A.A.; Alfalahi, S.T.; Athamneh, A.A.; Al-Shetwi, A.Q.; Mansor, M.B.; Hannan, M.A.; Agelidis, V.G. Power quality in microgrids including supraharmonics: Issues, standards, and mitigations. IEEE Access 2020, 8, 127104–127122. [Google Scholar] [CrossRef]
  5. Sakar, S.; Rönnberg, S. Modeling and analysis of dc-link capacitors subjected to high frequency conducted disturbances in electronic equipment. IEEE Trans. Power Electron. 2021, 37, 5949–5956. [Google Scholar] [CrossRef]
  6. CLC/TR 50669:2017; Investigation Results on Electromagnetic Interference in the Frequency Range Below 150 kHz. NSAI Standards, Irish Standard Recommendation, S.R. Gelenec: Dublin, Ireland, 2018; CENELEC SC 205A. CLC/TR 50669. (2017).
  7. CLC/TR 50627; Study Report on Electromagnetic Interference between Electrical Equipment/Systems in the Frequency Range Below 150 kHz. NSAI Standards, Irish Standard Recommendation, S.R. NSAI: Dublin, Ireland, 2013.
  8. Alfalahi, S.T.; Alkahtani, A.A.; Al-Shetwi, A.Q.; Al-Ogaili, A.S.; Abbood, A.A.; Mansor, M.B.; Fazea, Y. Supraharmonics in power grid: Identification, standards, and measurement techniques. IEEE Accesss 2021, 9, 103677–103690. [Google Scholar] [CrossRef]
  9. Aboutaleb, A.M.; Desmet, J.; Knockaert, J. Impact of Grid-Connected Inverter Parameters on the Supraharmonic Emissions in Distributed Power Generation Systems. Machines 2023, 11, 1014. [Google Scholar] [CrossRef]
  10. Darmawardana, D.; Perera, S.; Meyer, J.; Robinson, D.; Jayatunga, U.; Elphick, S. Development of high frequency (Supraharmonic) models of small-scale (<5 kW), single-phase, grid-tied PV inverters based on laboratory experiments. Electr. Power Syst. Res. 2019, 177, 105990. [Google Scholar]
  11. Klatt, M.; Stiegler, R.; Meyer, J.; Schegner, P. Generic frequency-domain model for the emission of PWM-based power converters in the frequency range from 2 to 150 kHz. IET Gener. Transm. Distrib. 2019, 13, 5478–5486. [Google Scholar] [CrossRef]
  12. Espín-Delgado, Á.; Busatto, T.; Ravindran, V.; Rönnberg, S.K.; Meyer, J. Evaluation of supraharmonic propagation in LV Networks based on the Impedance Changes Created by Household Devices. In Proceedings of the 2020 IEEE PES Innovative Smart Grid Technologies Europe (ISGT-Europe), The Hague, The Netherlands, 26–28 October 2020; pp. 754–758. [Google Scholar]
  13. Sakar, S.; Rönnberg, S.; Bollen, M.H. Immunity test of LED lamps based on IEC 61000-4 19 and unexpected consequence. In Proceedings of the 2018 18th International Conference on Harmonics and Quality of Power (ICHQP), Ljubljana, Slovenia, 13–16 May 2018; pp. 1–6. [Google Scholar]
  14. Rönnberg, S. Emission and Interaction from Domestic Installations in the Low Voltage Electricity Network, Up to 150 kHz. Ph.D. Thesis, Luleå Tekniska Universitet, Luleå, Sweden, 2013. [Google Scholar]
  15. Sakar, S.; Rönnberg, S.; Bollen, M. Interferences in AC–DC LED drivers exposed to voltage disturbances in the frequency range 2–150 kHz. IEEE Trans. Power Electron. 2019, 34, 11171–11181. [Google Scholar] [CrossRef]
  16. IEC 61000-4-19:2014; Part 4-19: Testing and Measurement Techniques—Test for Immunity to Conducted, Differential Mode Disturbances and Signalling in the Frequency Range 2 kHz to 150 kHz at a.c. Power Ports. International Electrotechnical Commission: Geneva, Switzerland, 2014.
  17. IEEE Recommended Practice and Requirements for Harmonic Control in Electric Power Systems. In IEEE Std 519-2014 (Revision of IEEE Std 519-1992); IEEE: Piscataway, NJ, USA, 2014; pp. 1–29. [CrossRef]
  18. Electromagnetic Compatibility (EMC) Part 2-2: Environment Compatibility Levels for Low Frequency Conducted Disturbances and Signaling in Public Low-Voltage Power Systems. IEC 61000-2-2, 27 June 2017. Available online: https://webstore.iec.ch/publication/60967 (accessed on 5 June 2024).
  19. Soltani, H.; Davari, P.; Zare, F.; Blaabjerg, F. Effects of modulation techniques on the input current interharmonics of adjustable speed drives. IEEE Trans. Ind. Electron. 2017, 65, 167–178. [Google Scholar] [CrossRef]
  20. Ravindran, V.; Busatto, T.; Rönnberg, S.K.; Meyer, J.; Bollen, M.H.J. Time-varying interharmonics in different types of grid-tied PV inverter systems. IEEE Trans. Power Del. 2020, 35, 483–496. [Google Scholar] [CrossRef]
  21. EN50160; Voltage Characteristics of Electricity Supplied by Public Electricity Networks. German Institute for Standardisation: Berlin, Germany, 2010.
  22. Drapela, J.; Slezingr, J. Flickering of Lamps Due to Ripple Control Signal. In Proceedings of the 2011 IEEE Trondheim PowerTech, Trondheim, Norway, 19–23 June 2011; pp. 1–7. [Google Scholar]
  23. Elphick, S.; Perara, S.; Browne, N. Ripple Singal Amplification Measurement, Modelling and Mitigation. Australasian Universities Power Engineering Conference. 2006, pp. 1–6. Available online: https://api.semanticscholar.org/CorpusID:11074685 (accessed on 5 June 2024).
  24. Espín-Delgado, Á.; Rönnberg, S. Modeling and analysis of supraharmonic propagation for stochastic studies. IEEE Trans. Power Deliv. 2022, 37, 4899–4910. [Google Scholar] [CrossRef]
  25. Wang, Y.; Luo, D.; Xiao, X. Evaluation of supraharmonic emission levels of multiple grid connected VSCs. IET Gener. Transm. Distrib. 2019, 13, 5597–5604. [Google Scholar] [CrossRef]
  26. Torquato, R.; Hax, G.T.; Freitas, W.; Nassif, A. Impact assessment of high-frequency distortions produced by PV inverters. IEEE Trans. Power Deliv. 2020, 36, 2978–2987. [Google Scholar] [CrossRef]
  27. Carbone, R.; Lo Schiavo, A.; Marino, P.; Testa, A. Frequency coupling matrices for multi-stage conversion system analysis. Eur. Trans. Electr. Power 2002, 12, 17–24. [Google Scholar] [CrossRef]
  28. Li, C.; Xu, W.; Tayjasanant, T. Interharmonics: Basic concepts and techniques for their detection and measurement. Electr. Power Syst. Res. 2003, 66, 39–48. [Google Scholar] [CrossRef]
  29. Sakar, S.; Rönnberg, S.K.; Bollen, M. Interharmonic emission in AC–DC converters exposed to nonsynchronized high-frequency voltage above 2 kHz. IEEE Trans. Power Electron. 2020, 36, 7705–7715. [Google Scholar] [CrossRef]
  30. Aboutaleb, A.M.; Gholizad, A.; Desmet, J.; Knockaert, J. Self-induced and Mutual-induced Emissions of Grid-Tied Converters. IEEE J. Emerg. Sel. Top. Power Electron. 2024. [Google Scholar] [CrossRef]
  31. Testing and Measurement Techniques General Guide on Harmonics and Interharmonics Measurements and Instrumentation, for Power Supply Systems and Equipment Connected Thereto, IEC 61000-4-7, June 2008. Available online: https://webstore.iec.ch/publication/4228#:~:text=IEC%2061000%2D4%2D7%3A2002%2BA1%3A2008,50%20Hz%20and%2060%20Hz (accessed on 5 June 2024).
  32. Slangen, T.; van Wijk, T.; Ćuk, V.; Cobben, S. The Propagation and Interaction of Supraharmonics from Electric Vehicle Chargers in a Low-Voltage Grid. Energies 2020, 13, 3865. [Google Scholar] [CrossRef]
  33. Esfetanaj, N.N.; Wang, H.; Blaabjerg, F.; Davari, P. Differential mode noise prediction and analysis in single-phase boost PFC for the new frequency range of 9–150 kHz. IEEE J. Emerg. Sel. Top. Ind. Electron. 2021, 3, 177–187. [Google Scholar] [CrossRef]
Figure 1. DBR with SH current component flowing from the AC side to the DC side. (a) Schematic of the circuit. (b) The SH current is in the frequency domain on both the AC and DC sides.
Electronics 13 02244 g001
Figure 2. DBR with SH current component flowing from the DC side to the AC side. (a) Schematic of the circuit. (b) The SH current is in the frequency domain on both the AC and DC sides.
Electronics 13 02244 g002
Figure 3. The AC/DC converter DBR is subjected to a SH current component, and the main emission of the AC/DC converter on the AC side contains a SH current from the background.
Electronics 13 02244 g003
Figure 4. The PFC boosts the main emission and the reflection of the main i g f S W at the DC side of the DBR.
Electronics 13 02244 g004
Figure 5. The DC side added emissions in the LF range of the PFC to boost DBR reflection on the AC side of the DBR.
Electronics 13 02244 g005
Figure 6. PFC boost. (a) power circuit, (b) control algorithm.
Electronics 13 02244 g006
Figure 7. Experimental setup.
Electronics 13 02244 g007
Figure 8. The simulated output voltage of the PFC boost at R o = 600   Ω .
Electronics 13 02244 g008
Figure 9. The simulated output voltage of the PFC boost R o = 100   Ω .
Electronics 13 02244 g009
Figure 10. Simulated PFC boost inductor current at R o = 600   Ω .
Electronics 13 02244 g010
Figure 11. Simulated PFC boost inductor current R o = 100   Ω .
Electronics 13 02244 g011
Figure 12. Simulated grid voltage and current at the PFC boost input terminals t h a t = 600   Ω .
Electronics 13 02244 g012
Figure 13. Simulated grid voltage and current at the PFC boost input terminals t h a t = 100   Ω .
Electronics 13 02244 g013
Figure 14. Simulation results of case study 1 at R o = 600   Ω , a comparison between a PFC boost converter exposed to a SH free grid voltage and the same PFC boost exposed to a distortion in the grid voltage at 5029 Hz. (a) The grid current, and (b) the inductor current.
Electronics 13 02244 g014
Figure 15. A comparison between a PFC boost converter exposed a SH free grid voltage under different loading conditions. (a) The grid current, and (b) the inductor current.
Electronics 13 02244 g015
Figure 16. A comparison between a PFC boost converter exposed to a distortion in the grid voltage at 5029 Hz under different loading conditions. (a) The grid current, and (b) the inductor current.
Electronics 13 02244 g016
Figure 17. Simulation results of case study 2 at R o = 600   Ω , a comparison between a PFC boost converter exposed to a SH free grid voltage and the same PFC boost exposed to a distortion in the grid voltage at 5038.6 Hz. (a) The grid current, and (b) the inductor current.
Electronics 13 02244 g017
Figure 18. A comparison between a PFC boost converter exposed to a distortion in the grid voltage at 5038.6 Hz under different loading conditions. (a) The grid current, and (b) the inductor current.
Electronics 13 02244 g018
Figure 19. Experimental data of the output voltage of the PFC boost.
Electronics 13 02244 g019
Figure 20. Experimental data of the PFC boost inductor current.
Electronics 13 02244 g020
Figure 21. Experimental data of grid voltage and current at the PFC boost input terminals.
Electronics 13 02244 g021
Figure 22. Case study 1 is a comparison between a PFC boost converter exposed to a SH free grid voltage and the same PFC boost exposed to a distortion in the grid voltage at 5029 Hz. (a) The grid current, and (b) the inductor current.
Electronics 13 02244 g022
Figure 23. Case study 2 is a comparison between a PFC boost exposed to a SH free grid voltage and the same PFC boost exposed to a distortion in the grid voltage at 5038.6 Hz. (a) The grid current, and (b) the inductor current.
Electronics 13 02244 g023
Table 1. System parameters were used for the simulation and experimental studies.
ParameterValue
Grid Voltage (Root mean square) 66   V
Boosting inductance 10   m H
Boosting capacitor 470   μ F
Output resistor 600   Ω
Switching frequency 5   k H z
Output voltage 120   V
Table 2. Relationship among the added LF emissions, main emissions, and the i g ( f S H ) components in the DC side of the DBR for both simulation and experimental studies.
SH Component Frequency Added to the Grid (Hz)Main SH Emission Frequency (Hz)ig(fSH) Components (Hz)Δf (Hz)
Case Study 150295000497921
507979
Case Study 25038.650004988.611.4
5088.688.6
Table 3. Additional harmonics in the LF range in the AC side of the DBR and their origin harmonics in the DC side in both simulation and experimental studies.
Origin Harmonic Frequency in the DC Side (Hz)Relationship Based on Equation (4)Added Emissions
Frequencies in the AC Side (Hz)
Case Study 179 79 f g 29
21 21 + f g 71
Case Study 288.6 88.6 f g 38.6
11.4 11.4 + f g 61.4
Disclaimer/Publisher’s Note: The statements, opinions and data contained in all publications are solely those of the individual author(s) and contributor(s) and not of MDPI and/or the editor(s). MDPI and/or the editor(s) disclaim responsibility for any injury to people or property resulting from any ideas, methods, instructions or products referred to in the content.

