Article

Localization of Coordinated Cyber-Physical Attacks in Power Grids Using Moving Target Defense and Machine Learning

School of Automation, Nanjing University of Science & Technology, Nanjing 210094, China
*
Author to whom correspondence should be addressed.
Electronics 2024, 13(12), 2256; https://doi.org/10.3390/electronics13122256
Submission received: 1 May 2024 / Revised: 1 June 2024 / Accepted: 6 June 2024 / Published: 8 June 2024
(This article belongs to the Special Issue Applications of Deep Neural Network for Smart City)

Abstract

:
Coordinated cyber-physical attacks (CCPAs) are dangerously stealthy and have considerable destructive effects against power grids. The problem of stealthy CCPA (SCCPA) localization, specifically identifying disconnected lines in attack, is a nonlinear multi-classification problem. To the best of our knowledge, only one paper has studied the problem; nevertheless, the total number of classifications is not appropriate. In the paper, we propose several methods to solve the problem of SCCPA localization. Firstly, considering the practical constraints and abiding by one of our previous studies, we elaborately determine the total number of classifications and design an approach for generating training and testing datasets. Secondly, we develop two algorithms to solve multiple classifications via the support vector machine (SVM) and random forest (RF), respectively. Similarly, we also present a one-dimensional convolutional neural network (1D-CNN) architecture. Finally, extensive simulations are carried out for IEEE 14-bus, 30-bus, and 118-bus power system, respectively, and we verify the effectiveness of our approaches in solving the problem of SCCPA localization.

1. Introduction

During the process of traditional power systems evolving into smart grids (SGs) in the field of power delivery, management, and maintenance, the desirable convenience may be achieved due to the enormous and advanced devices used. However, some malicious attacks will simultaneously arrive because of stealthy vulnerabilities in SGs. Until now, one type of attack, known as coordinated cyber-physical attacks (CCPAs), has been prevalent. Compared with a standalone attack, e.g., a false data injection attack (FDIA), a CCPA is more dangerous as it is a kind of synchronous attack consisting of a physical attack and a cyber-attack to mask the physical attack. One example was the December 2015 attack on the Ukrainian electrical grid [1]. As a result of this attack, CCPAs have received significant attention [2].
There exists a variety of work on defense against CCPAs. Strategies associated with securing a set of measurements [3] or relying on measurements from known secure phasor measurement units (PMUs) disposed in the grid [4] were proposed. Nevertheless, security upgrades in some devices whose life cycles are several decades long are quite expensive in power grids. Furthermore, it can be inferred that PMUs are vulnerable to FDIAs from extensive research. Machine learning (ML)-based methods have been used to detect malicious attacks [5,6]. However, recent research has confirmed that adversarial scenarios can limit ML-based algorithms’ efficacy [7].
As a result of the imperfect efficacy of existing defense mechanisms, several studies have been based on moving target defense (MTD) technique to detect CCPAs [2,8]. The concept of MTD technology is to invalidate the attacker’s knowledge through actively perturbing the power grid’s line reactance. This can be implemented using distributed flexible AC transmission system (D-FACTS) devices. Without an accurate knowledge of the transmission lines reactance, the attacker cannot launch an undetectable CCPA [3,4]. In the case of the work on MTD defense against attacks, it has largely focused on detecting FDIAs. Among these works, some metrics to design effective MTD were developed [9,10,11], a hidden MTD whose activation can avoid the attacker’s detection was proposed [12], and the cost–benefit trade-off was exposed [10]. When considering the work on MTD defense against CCPAs, the literature [2] proposed optimal D-FACTS device deployment to destroy the construction of CCPAs via a zero-sum game theoretical framework. Abiding by practical constraints, the literature [8] further studied the optimal D-FACTS device deployment. So far, most of the existing studies involved MTD focus on the problem of attack detection only. In contrast, the study of CCPA localization has not received attention.
Actually, the problem of FDIAs localization has become a hot spot [13,14,15,16]; however, the number of similar studies focused on CCPAs is only one [17]. Essentially, the problem of attack localization is a nonlinear multiple classifications problem. Specifically, the problem of CCPA localization is to identify the disconnected lines in the CCPA. After carefully taking the study in the literature [17] into account, we point to two main reasons for this situation. One is that the total number of classifications is not easy to determine. As the system becomes larger, the number of categories becomes larger and larger. For example, for an IEEE 14-bus power system, when supposing that the maximum number of tripped lines is 2, there are 210 categories, while the number is 15,931 for IEEE 118-bus system. The enormous total number of classifications greatly restricts the problem of CCPA localization to be solved. Another is how to formulate the data utilized to solve the problem. Our two previous studies [18,19] appropriately addressed the above two issues. As described in ref. [18], a sophisticated attack will not randomly select his/her target in addition to complying with the practical constraints. This means that the total number of classifications can be simply determined based on the set of transmission lines which are most likely attacked. Effectively, the data are the compromised measurements. In [17], a measurement formula was proposed as follows:
z c c p a _ e x t r a = z + ( H Δ θ + H c ) + ( Δ H θ p Δ H θ p )
For simplicity, the implication of each quantity in Formula (1) may be seen in [17]. The representation of Formula (1) is complex, which increases the difficulty of calculation. Correspondingly, the literature [19] also developed a formula to solve the measurements, as follows:
z m o c p _ e x t r a = H m x m p + H c + e
Similarly, the meaning of each quantity in Formula (2) can be seen in [19]. Obviously, the representation of Formula (2) is much simpler than that of Formula (1). Formula (2) can be used to calculate the measurements.
At the same time, there are a variety of ML-based multi-classification approaches, such as the support vector machine (SVM) [20,21], random forest (RF) [22], and convolutional neural network (CNN) [23], which is one of the dominant neural networks in recent years. After sweeping away the above two obstacles, in this paper, we have solved the problem of CCPA localization based on the above three ML algorithms, respectively.
In brief, the contributions of our work are three-fold.
After transforming the problem of CCPA localization into a multi-classification problem, we present a feasible scheme to determine the total number of classifications based on the subjective consciousness of a smart attacker, which serves as a firm foundation to establish the multi-classification problem.
We develop a method to acquire the full amount of data, owing to an excellent ability to extract features in it. For the above three ML approaches, the quality and scale of the data are both crucial and have a decisive impact on the classification results.
For solving the problem of CCPA localization, we propose three algorithms based on SVM, RF, and CNN, respectively.
The rest of this paper is organized as follows. Section 2 provides the related works. Section 3 reviews theory analysis. The proposed methodology is introduced in Section 4. Case studies are implemented in Section 5. The discussion are presented in Section 6. Section 7 provides the conclusions.

2. Related Works

From the perspective of SG security, the research on attack localization is necessary and valuable. Multiple methods exist to locate FDIAs. In general, these methods can be classified into two categories, known as model-based [24,25,26] and data-driven [13,15,16,27] approaches. The model-based approaches can successfully address FDIA localization by mainly relying on the SG model and appropriate algorithms. Contrarily, data-driven methods do not build a physical system model.
Multiple studies aiming to localize FDIAs have had a positive effect on the localization of CCPAs. Essentially, the problem of attack localization is a multi-classification problem. A variety of ML-based approaches exist that have capacities to cope with multi-classification problems. These include SVM, RF, and CNN. Multiple representative examples associated with conducting several multi-classification problems based on the three methods are listed in Table 1.

Deep Summary of Existing Works

According to the multiple instances provided in Table 1, after deeply analyzing every study, there are three questions related to the problem of CCPA localization. These are how to acquire data, how to determine the total number of multi-classifications, and how to develop algorithms to solve CCPA localization problems using SVM, RF, and CNN approaches, respectively.
After taking the above questions into account, the main innovations can be inferred as follows.
(1)
A method to acquire data is proposed.
We developed a method to acquire data to solve the problem of CCPA localization. For an IEEE 14-bus power system, IEEE 30-bus power system, and IEEE 118-bus power system, we adopt the method and acquire three groups of data, and then verify their performance via the XGBoost algorithm.
(2)
Elaborately determine the total number of multi-classifications.
As mentioned above, even for IEEE 14-bus power system (a small-scale system), the total number is not small. However, for a large-scale system, the number must be huge. This greatly restricts the construction of CNN models. Consequently, the number must be small. Based on the literature [18], the probability of being disconnected for each line in a power grid is different. As a sophisticated attacker aims to keep an attack stealthy and pursue his/her most desirable reward, he/she will attack the lines most likely to be attacked. Simultaneously, the attacker does not attack a “cut” line so as to avoid causing large power flow fluctuations perceived by a system operator. As such, the total number can be perfectly and reasonably reduced via game theory. It can be seen from Table 3 (Table 3 is a table from the literature [18], where 3 is the table serial number in the literature [18]) that the total number of lines most likely to be attacked are only 4, 4 and 11 for the IEEE 14-bus, 30-bus, and 118-bus power system, respectively. To this end, for the three systems, the total number of multi-classifications are initially determined as 10, 10 and 11, respectively. For the last system, we consider only the case where a physical attack disconnects a single line.
(3)
Design three algorithms for solving the CCPA localization problem via SVM, RF and 1D-CNN approaches, respectively.
The larger the dimensions of a CNN, the more precision there is in regard to the extracted features. But the larger the hyperparameters, the greater the computing power required, and the longer the operating time. The dimensions of the CNN model should be selected according to the actual situation. For example, in the literature [43], a 1D-2D joint CNN was constructed. Although a 1D-CNN can directly conduct convolution processing for the vibration signal, it struggles to make full use of the nonlinear information in the 1D space. As such, Wenliao Du et al. [43] proposed a 1D-2D joint CNN. In the literature [38], because of FLIM data, only temporal decay features need to be evaluated without considering spatial positions, and FLIM data should be treated as a 1D time series. At the same time, a 1D-CNN is faster, and complex matrix operations from high dimensional convolution are replaced by float-point additions and scalar multiplications in 1D-CNNs [38]; as such, a 1D-CNN model was selected. Certainly, starting from how to promote the extracted features’ performance and the generalization ability of the model, we can choose whether the constructed model is mixed or non-mixed. In our works, the data used to extract features are compromised measurements, which is a transposed 2D matrix. In the matrix, each row is actually a row vector, representing a 1D space. Simultaneously, our works have been limited by poor experimental conditions. In brief, we finally construct a 1D-CNN model to solve the problem of CCPA localization.

3. Theory Analysis

3.1. State Estimation & Bad Data Detection

Generally, a graph G = ( N , L ) can be used to characterize a power grid. N = { 1 , , n } is a set of buses, while L = { 1 , , l } indicates the set of transmission lines. A bus is selected as the slack bus. k = i , j , i j is a line connecting buses i and j. b i j is the line’s susceptance. The voltage phase angle of bus i is represented by θ i . Based on the DC power flow model, the active power flow on line k is shown as F i j = b i j ( θ i θ j ) .
Under the DC power flow model, the system’s state variable is the voltage phase angle θ = ( θ 1 , θ 2 , , θ n ) T . When considering z R M , H R M × ( n 1 ) denote the sensor measurements and the measurement matrix, respectively, and the sensor measurements are shown as follows:
z = H θ + e
where e represents the independent measurement noises that are assumed to be Gaussian. Relying on the weighted least squares (WLS) technique, the estimate of a system state is given as follows:
θ ^ = ( H T W H ) 1 H T W z
where W is a diagonal matrix whose elements are reciprocals of the variances of measurement errors [18]. The measurement residual, denoted by r, is formulated as follows:
r = z H θ ^
In bad data detection (BDD), the Euclidean norm of the measurement residual is compared with a predetermined threshold τ. If | | r | | 2 > τ, the BDD will trigger an alarm.

3.2. Coordinated Cyber-Physical Attacks

3.2.1. Undetectable FDIAs

After an FDIA is launched, the compromised measurement is denoted by the following:
z α = z + a
where a R M is an attack vector. If the attack vector follows a = H c , where c R n 1 , z α can bypass the BDD [4]. The FDIA is undetectable.

3.2.2. CCPA

A cyber-physical attack (CPA) is a synchronous attack consisting of a physical attack and a cyber-attack. When the physical attack disconnects a subset of the transmission lines, if the cyber-attack is elaborately designed, then the negative effect of the physical attack on the measurement residual can be perfectly masked, which can bypass the BDD. This CPA is stealthy and, as such, is called a CCPA.
The subscript “p” represents the system parameters after a physical attack. After the physical attack is launched, the measurements are denoted as follows:
z p = z + a p = z + H Δ θ + Δ H θ p
where Δ H and Δ θ are the change in the measurement matrix and phase angle between post-attack and pre-attack, given by Δ H = H p H and Δ θ = θ p θ .
Once the effect of the a p on the measurement residual can be eliminated, a CCPA follows. When the CCPA is launched, the compromised measurements are represented as follows:
z c c p a = z p + a c = z + H Δ θ
where a = Δ H θ p is a simplest FDIA that can mask the effect of the physical attack.
Actually, the stealthy CCPA (SCCPA) in Formula (8) is called the optimized CCPA [4], also termed as the “partial CCPA” [17]. Nevertheless, there is also one type of stealthy CCPA. The compromised measurements corresponding to the stealthy CCPAs [17] are denoted as follows:
z c c p a _ e x t r a = z c c p a + a e x t r a = z + H Δ θ + H c = z + H ( Δ θ + c )

3.3. Moving-Target Defense

MTD is a dynamic defense technology that actively perturbs the transmission line reactance settings utilizing D-FACTS devices to invalidate the knowledge grasped by an attacker. The MTD strategy has excellent capabilities to make it exceedingly difficult for the attacker to track the system’s dynamics and collect sufficient information to craft a stealthy CCPA.

3.3.1. D-FACTS Deployment and Operation

Both references [2,8] presented a sufficient condition for the MTD to defend against optimized CCPAs. Essentially, the two conditions are identical. For ensuring the launch of a stealthy CCPA, the attacker must grasp the knowledge of branch reactance within at-least one alternative route between the two ends of the tripped lines [17]. D-FACTS deployment should invalidate the knowledge grasped by the attacker to launch a stealthy CCPA. At least one D-FACTS device is deployed in each alternative path. To find the optimal D-FACTS devices’ deployment, reference [8] proposed an algorithm. Based on the results of reference [8], reference [18] further proposed a more comprehensive algorithm.
The settings of D-FACTS operation are a research hotspot and directly have a vital impact on the MTD defense efficiency. Suppose that a line reactance is x at the initial stage and a D-FACTS device is deployed on the line. We use the subscript “m” to represent system parameters after operating MTD. The line reactance after MTD is x m = λ x . λ is perturbation ratio. Specifically, the settings of D-FACTS operation are just how to determine λ when ensuring the MTD high detection rate. Several references [2,10,18] focus on how to determine λ . In general, λ [ 0.8   1.2 ] is selected.

3.3.2. CCPA Localization Based on MTD

There are two problems to be clarified in the subsection. The first problem is that we must study which types of stealthy CCPAs are in use. The second problem is why to utilize MTD technology in our work. Formula (8) expresses optimized CCPAs. Yexiang Chen et al. [17] explicitly pointed out that an optimized CCPA (that is a “partial CCPA”) can be directly localized by the CNN without MTD. For the “extra CCPA” denoted by Formula (9), an additional component c (i.e., Δ θ + c ) is added, which distorts the mapping between Δ θ and the disconnected line. So, in the paper, the “extra CCPA” is the subject of our study. Moreover, the problem of “extra CCPA” localization is studied based on MTD technology. In the rest of this paper, we use the term stealthy CCPA (SCCPA) to substitute for “extra CCPA”.

4. Proposed Method

4.1. Three Algorithms for Solving SCCPAs Localizaiton

In our work, we present three algorithms for solving SCCPAs localization. They are SVM, RF, and CNN, respectively. When applying SVM to solve a multi-class problem, there are three approaches to decouple the multi-class problem: “1-r”, “1-1”, and “1-1-r” [28,30]. In the paper, we select the “1-r” structure. For a k-class problem, “1-r” consists of k-binary classifiers. For every classifier, one class of samples is positive, the remaining are negative samples. RF is one of the most significant classification algorithms [32,33,35] and is an ensemble learning method. An RF consists of multiple decision trees. Each decision tree used as a weak classifier classifies randomly selected features. Through integrating all results from the trees, and the category of the major vote or computed by averaging, the RF outputs the final results. In the paper, the data used to extract features is compromised measurements, which are a 2D transposed matrix. In the matrix, each row is a vector representing a 1D space. Moreover, our works are limited by poor experimental conditions. As such we construct a 1D-CNN model to solve the problem of SCCPA localization.

4.2. Data Sampling Method Design

Data quality is crucial to the data-driven methods. In the paper, we design an algorithm for data sampling, which is described by Figure 1 as follows. In our work, data are the compromised measurements calculated by Formula (2). The MTD perturbation ratio is set between 0.8 and 1.2 (seen in Section 3.3.1), which serves as the outermost cycle condition of the data sampling algorithm. In the case of each specific perturbation ratio, the load profile is randomly changed, which acts as the inner cycle condition. Then, high-quality data are achieved. In the simulations, the quality of these data will be inspected using the XGBoost algorithm. The resulting data are a two-dimensional matrix which belongs to R n × m . The structure of any row of the matrix is shown in Figure 2.

4.3. Algorithm Development of SCCPA Localization Based on SVM

In the paper, we apply the “1-r” structure to conduct the problem of SCCPA localization, and develop an algorithm, namely Algorithm 1, as follows.
Algorithm 1: Conducting the problem of SCCPA localization based on an SVM
Input: The training data A R a × m , the training label α ,
    the testing data B R b × m , the testing label β ,   a + b = n .
Output: Several metrics.
1: for i = 1, 2, …, n do
2:   Extract the data corresponding to label i from A to obtain a new dataset,
     denoted as A 1 ;
3:   Randomly extract the same amount of data from A \ A 1 to form
     another dataset, denoted as A 2 ;
4:   Integrate A 1 and A 2 to shape a new dataset C , simultaneously,
    construct a new column vector (named as D ) where the elements
    corresponding to A 1 are set as “1” and the elements corresponding
    to A 2 are set as “−1”;
5:     Train the model using C and D.
6: End for
7: for i = 1, 2, …, n do
8:    Prediction with utilizing the trained model and B , and then obtain a
    matrix, denoted as label_scorei R b × 2 .
9: End for
10: Construct a new matrix named as score R b × n , the i-th column in the score
  is the second column of label_scorei.
11: Establish an empty vector final_labels R b × 1 .
12: for i=1, 2, …, b do
13:   Max function is applied to the i-th row vector in score and obtain the
      final prediction label assigned to the i-th element of final_labels.
14: End for
15: Acquire several metrics via β and final_labels.

4.4. Algorithm Development of SCCPA Localization Based on RF

In the paper, we also apply RF to solve the problem of SCCPA localization, and develop an algorithm, namely Algorithm 2, as follows.
Algorithm 2: Conducting the problem of SCCPA localization based on an RF
Input: The training data A R a × m , the training label α R a × 1 ,
    the testing data B R b × m , the testing label β R b × 1 ,   a + b = n .
Output: Confusion matrix.
1: A is transposed and assigned to the matrix P_train, similarly B is
 transposed and assigned to the matrix P_test.
2:  α is transposed and assigned to the vector T_train, similarly β is
 transposed and assigned to the vector T_test.
3: Set a number, denoted as N, and N is equal to b.
4: Normalize P_train and obtain a normalized matrix p_train and the
 mapping structure ps_input.
5: Apply mapminmax function to format P_test based on ps_input, and
 acquire a matrix p_test.
6: T_train is assigned to a new vector t_train, and T_test is also assigned to a
 new vector t_test.
7: p_train, p_test, t_train and t_test are all transposed. After being transposed,
 they are the training data formatted, the testing data formatted, the
 training label and the testing label, respectively.
8: Set the minimum number of leaves to 1.
9: Apply TreeBagger function to train the model.
10: Apply p_train and the trained model to predict the training label, denoted
  as T_sim1, similarly apply p_test and the trained model to predict the
  testing label, termed by T_sim2.
11: Apply confusionchart function to obtain a confusion matrix for the
  training data based on T_train and T_sim1.
12: Apply confusionchart function to obtain a confusion matrix for the testing
  data based on T_test and T_sim2.

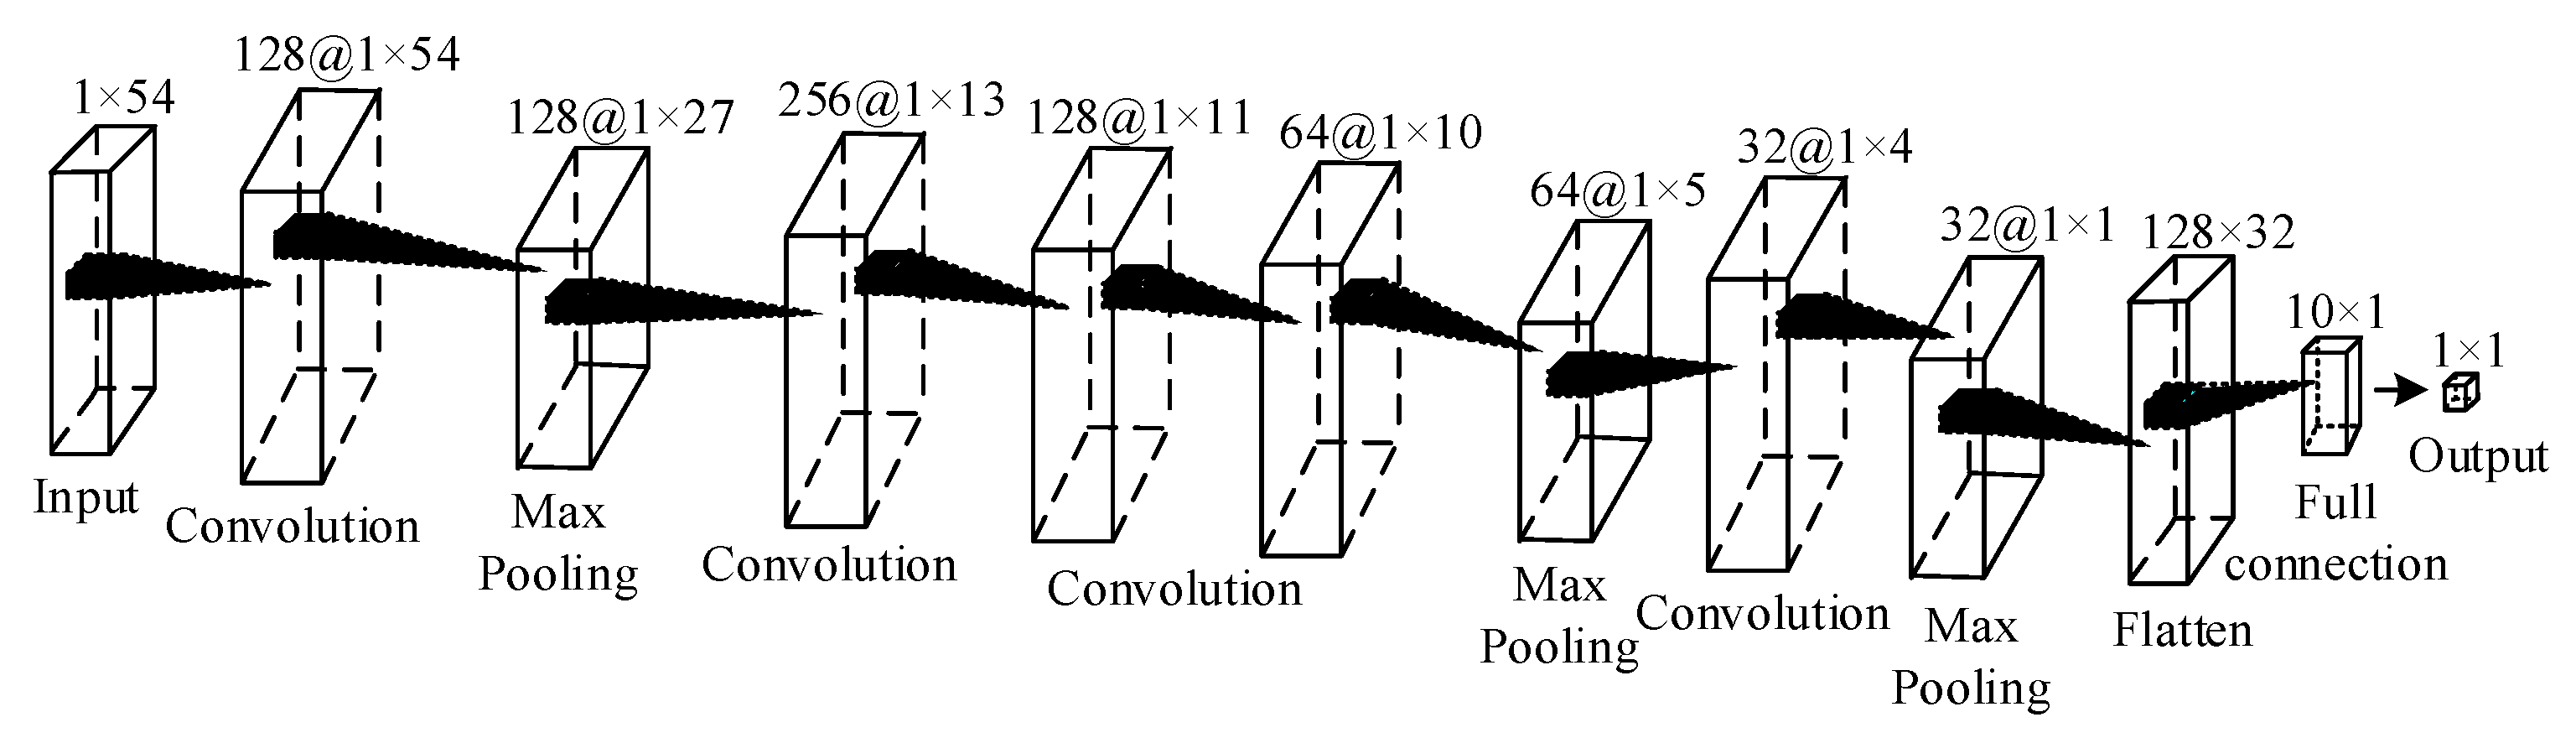
4.5. Architecture Design of 1D-CNN

Based on the knowledge of the basic architecture on 1D-CNN, we design a 1D-CNN architecture, as shown in Figure 3, for the problem of SCCPA localization.

5. Simulation

Our simulation results performed with the MATPOWER toolbox are presented below to show the effectiveness of the proposed algorithms. To be more convincing, we performed extensive simulations for IEEE 14-, 30-, and 118-bus power systems.

5.1. Hardware and Softwar Configuration

In general, CNN learning needs considerable computing power and sufficient computing resources. Due to the limited conditions, the hardware configuration in our work is as follows: (1) CPU, Intel Core i7-7700HQ; (2) main frequency, 2.8 GHz; (3) internal memory, RAM, 32GB; (4) operating system, 64-bit Windows 10.
The software configuration is divided into two parts. The first is the software simulation platform embedded within the MATPOWER 7.0 tool; the second part is the PyTorch 2.0 framework based on the Python language.

5.2. Sampled Data Acquisition

The data sampling method has been presented in Section 4.1, as shown in Figure 1. This section describes the acquisition methods of sampled data for IEEE 14-bus, IEEE 30-bus, and IEEE 118-bus power systems, respectively. In addition, the sampling process is generally an internal and external double cycle. However, for acquiring sufficient scale training and test sets, in the inner layer, another layer is added to describe load change scenarios.

5.2.1. Sampled Data Acquisition for the IEEE 14-bus Power System

When considering the full measurement system and the DC power flow model, sensor measurements is a column vector containing 54 elements. The reconstructed set of protected lines is {11, 17, 19, 20} in Ref [18]. Then, the total number of multi-classifications is equal to the number of labels, i.e., 10, which is shown in Table 2 below. In Table 2, Lab is an abbreviation for label. In the process of the simulation, the number of iterations in the outmost loop is 10, corresponding to 10 different groups of tripping line combinations. The number of iterations in the inner loop is set to 400. The 10th, 18th, and 19th line parameters need to be perturbed. The set of perturbation proportional coefficients is set as [0.8 0.9 0.95 1.05 1.15 1.2]. Additionally, in order to obtain sampled data of sufficient size, during the realistic implementation of data sampling, in the inner cycle, another cycle is added to describe the load change scenarios. In the end, an acquired training dataset may be served as a matrix belonging to R 75,200 × 55 , and another acquired testing dataset may also be served as a matrix belonging to R 4800 × 55 . In the training dataset, each sample is a row vector containing 55 elements, and the first one is a number representing the label. The same is true for the testing dataset.

5.2.2. Sampled Data Acquisition for the IEEE 30-bus Power System

The method of acquiring sampled data in the IEEE 30-bus power system is basically the same as the above example. The labels and the corresponding tripping line sets are shown in Table 3.
The set of lines perturbed is {15, 20, 23, 26}. The same three-tier loop yields a training dataset, with 75,200 samples and 112 features, and a testing dataset, containing 4800 samples and 112 features.

5.2.3. Sampled Data Acquisition for the IEEE 118-bus Power System

In the IEEE 118-bus power system, the reconstructed set of protected lines is {30, 36, 38, 41, 54, 93, 147, 151, 161, 171, 172}. For the system, we consider a case where one physical attack only disconnects a line, so the total number of multi-classifications equal to the number of labels is 11. Due to the one-to-one relationship, the label implies that the label setting is omitted. After sampling, the training dataset has 82,720 samples and 476 features, while the testing dataset contains 5280 samples and 476 features.

5.3. Sampled Data Quality Inspection

As mentioned above, sampled data quality is very crucial to the data-driven algorithm. In the section, we inspect the quality of sampled data obtained using the XGBoost algorithm. The inspection results are shown in Table 4.
In Table 4, “Testing set error rate (softmax)” implies the testing set error rate using the softmax function for multi-classification, while “Testing set error rate (softprob)” implies the testing set error rate using the softprob function for multi-classification. As can be seen from Table 4, for the IEEE 14-bus power system, after 100 training sessions, the testing set error rate using the softmax function is 0, while the testing set error rate using the softprob function is also 0; for the IEEE 30-bus power system, after 100 training sessions, the testing set error rate using the softmax function is 0.0943%, while the testing set error rate using the softprob function is also 0.0943%; for the IEEE 118-bus power system, after 100 training sessions, the testing set error rate using the softmax function is 0, and the testing set error rate using the softprob function is also 0.
In brief, the sampled data acquired are of high quality.

5.4. The Solution for SCCPA Localization via Three Algorithms for the IEEE 14-bus Power System

Firstly, we proposes the specific constructed 1D-CNN architecture shown in Figure 4.
Secondly, we presents three confusion matrices reflecting the results of SCCPA localization based on SVM, RF, and 1D-CNN; these matrices are shown in Figure 5, as follows.
P i = T P i T P i + F P i
R i = T P i T P i + F N i
F 1 i = 2 × P i × R i P i + R i
At the same time, a comprehensive accuracy evaluation of the system is shown in Table 5.
The diagnostic results of the metrics are shown in Table 6.

5.5. The Solution for SCCPA Localization via Three Algorithms for the IEEE 30-bus Power System

Similarly, we propose the specific constructed 1D-CNN architecture shown in Figure 6.
Then, we presents three confusion matrices reflecting the results of SCCPA localizations based on SVM, RF, and 1D-CNN; these matrices are shown in Figure 7, as follows.
Certainly, a comprehensive accuracy evaluation of the system is shown in Table 7.
A diagnostic results of the metrics is shown in Table 8.

5.6. The Solution for SCCPA Localization via Three Algorithms for the IEEE 118-bus Power System

We propose the specific constructed 1D-CNN architecture shown in Figure 8.
Similarly, we presents three confusion matrices reflecting the results of SCCPA localization based on SVM, RF, and 1D-CNN; these matrices are shown in Figure 9, as follows.
For the IEEE 118-bus power system, a comprehensive accuracy evaluation is shown in Table 9.
For the IEEE 118-bus power system, the diagnostic results of the metrics are shown in Table 10.

5.7. Experimental Analysis

From the above experimental results, on the whole, the three algorithms have a desirable performance in solving the multi-classification problem of SCCPA localization. The RF’s performance is the best, while the SVM’s performance greatly fluctuates for different systems. In the IEEE 14-bus power system and IEEE 118-bus power system, SVM’s performance is perfect, but in the IEEE 30-bus power system, its representation is barely satisfactory. The performance of 1D-CNN is stable and good. Although the computing power is restricted by practical constraints, the simulation times of the three systems are 236.1 s, 343.5 s, and 931.17 s, respectively, which verifies 1D-CNN’s high efficiency. To suppress the overfitting and to boost generalization ability, we added a dropout layer to the 1D-CNN model in the simulations for the IEEE 30-bus power system and IEEE 118-bus power system. We think that due to the obtained data’s construction, the performance of three algorithms benefits from this step. In our work, these data are the comprised measurements whose transposed row vector is a sample. Moreover, there is also no nonlinear noise interference in the data. This means that features are easily extracted, and that CNN’s powerful convolution computing is not much of an advantage.

6. Discussion

When considering the problem of SCCPA localization, the crucial problem is how to appropriately determine the total number of multi-classifications. Even for a small-scale power system (e.g., the IEEE 14-bus power system), when supposing that the maximum number of tripped lines is 2, there are 210 categories. The enormous total number of classifications greatly restricts the problem of SCCPA localization to be solved. In the paper, through utilizing one of our previous studies [18], the total number of classifications can be simply determined based on the set of transmission lines which are most likely to be attacked. Once the total number of multi-classifications is determined, the SVM and RF algorithms can be easily developed, and the CNN’s architecture is also not difficult to build. Although the time complexity of Algorithm 1 is O ( n ) and the time complexity of Algorithm 2 is O ( 1 ) , the simulation results can validate the two algorithms are efficient.
In addition, because SVM, RF, and CNN have a strong ability to solve multi-classification problems, in the paper, we only consider using them to conduct the problem of SCCPA localization. Certainly, there are other ML algorithms that can also solve the problem of SCCPA localization.

7. Conclusions

In this paper, the problem of SCCPA localization is deeply studied as a problem of multi-classification. Based on the game theory, the total number of multi-classification is appropriately determined. Moreover, three methods to solve the problem of SCCPA localization are proposed via SVM, RF, and 1D-CNN algorithms. Extensive simulations are carried out for IEEE 14-bus, IEEE 30-bus, and IEEE 118-bus power systems, respectively. The experimental results verify the proposed methods’ correctness and efficiency.

Author Contributions

Conceptualization and methodology, J.Y.; software, J.Y.; validation, Q.L. and L.L.; formal analysis, J.Y. and L.L.; writing—original draft J.Y.; writing—review and editing, Q.L. and L.L. All authors have read and agreed to the published version of the manuscript.

Funding

This research received no external funding.

Data Availability Statement

The original data used to support the results of this study are from MATPOWER.

Acknowledgments

The authors would like to thank all of the editors and anonymous reviewers for their careful reading and insightful remarks.

Conflicts of Interest

The authors declare no conflicts of interest.

Nomenclature

SGSmart grid
FDIAsFalse data injection attacks
CCPAsCoordinated cyber-physical attacks
PMUsPhasor measurement units
MLMachine learning
MTDMoving target defense
D-FACTSDistributed flexible AC transmission system
WLSWeighted least squares
BDDBad data detection
G Graph representing the topology of the system
N Set of the buses in the system
L Set of the lines in the system
i, jBus index
b i j Susceptance of the line between buses i and j
z Vector of all measurements
HMeasurement matrix
e Measurement error vector
θVoltage phase angles vector
θ i Voltage phase angle at bus i
rMeasurement residual vector
τThreshold of the BDD system
AReduced branch–bus incidence matrix
DDiagonal branch susceptance matrix
aAttack vector
z a Compromised vector of all measurements
XGBoostExtreme gradient boosting
SVMSupport vector machine
RFRandom forest
CNNConvolutional neural network

References

  1. Presekal, A.; Stefanov, A.; Rajkumar, V.S.; Palensky, P. Attack graph model for cyber-physical power systems using hybrid deep learning. IEEE Trans. Smart Grid 2023, 14, 4007–4020. [Google Scholar] [CrossRef]
  2. Lakshminarayana, S.; Belmega, E.V.; Poor, H.V. Moving-target defense against cyber-physical attacks in power grids via game theory. IEEE Trans. Smart Grid 2021, 12, 5244–5257. [Google Scholar] [CrossRef]
  3. Li, Z.; Shahidehpour, M.; Alabdulwahab, A.; Abusorrah, A. Bilevel model for analyzing coordinated cyber-physical attacks on power systems. IEEE Trans. Smart Grid 2016, 7, 2260–2272. [Google Scholar] [CrossRef]
  4. Deng, R.; Zhuang, P.; Liang, H. CCPA: Coordinated cyber-physical attacks and countermeasures in smart grid. IEEE Trans. Smart Grid 2017, 8, 2420–2430. [Google Scholar] [CrossRef]
  5. Said, D.; Elloumi, M.; Khoukhi, L. Cyver-attack on P2P energy transaction between connected electric vehicles: A false data injection detection based machine learning model. IEEE Access 2022, 10, 63640–63647. [Google Scholar] [CrossRef]
  6. He, Y.; Mendis, G.J.; Wei, J. Real-time detection of false data injection attacks in smart grid: A deep learning-based intelligent mechanism. IEEE Trans. Smart Grid 2017, 8, 2505–2526. [Google Scholar] [CrossRef]
  7. Sayghe, A.; Anubi, O.M.; Konstantinou, C. Adversarial examples on power systems state estimate. In Proceedings of the IEEE 2020 IEEE Power & Energy Society Innovative Smart Grid Technologies Conference (ISGT), Washington, DC, USA, 1–5 February 2020. [Google Scholar]
  8. Zhang, Z.; Tian, Y.; Deng, R.; Ma, J. A double-benefit moving target defense against cyber-physical attacks in smart grid. IEEE Internet Things J. 2022, 9, 17912–17925. [Google Scholar] [CrossRef]
  9. Liu, C.; Wu, J.; Long, C.; Kundur, D. Reactance perturbation for detecting and identifying FDI attacks in power system state estimation. IEEE J. Sel. Top. Signal Process 2018, 12, 763–776. [Google Scholar] [CrossRef]
  10. Lakshminaraya, S.; Yau, D.K.Y. Cost-benefit analysis of moving target defense in power grids. IEEE Trans. Power Syst. 2021, 36, 1152–1163. [Google Scholar] [CrossRef]
  11. Zhang, Z.; Deng, R.; Yau, D.K.Y.; Cheng, P.; Chen, J. Analysis of moving target defense against false data injection attacks on power grid. IEEE Trans. Inf. Forensics Secur. 2020, 15, 2320–2335. [Google Scholar] [CrossRef]
  12. Higgins, M.; Teng, F.; Parisini, T. Stealthy MTD against unsupervised learning-based blind FDI attacks in power systems. IEEE Trans. Inf. Forensics Secur. 2021, 16, 1275–1287. [Google Scholar] [CrossRef]
  13. Wang, S.; Bi, S.; Zhang, Y.-J.A. Locational detection of the false data injection attack in a smart grid: A multilabel classification approach. IEEE Internet Things J. 2020, 7, 8218–8227. [Google Scholar] [CrossRef]
  14. Boyaci, O.; Narimani, M.R.; Davis, K.R.; Ismail, M.; Overbye, T.J.; Serpedin, E. Joint detection and localization of stealth false data injection attacks in smart grids using graph neural networks. IEEE Trans. Smart Grid 2022, 13, 807–819. [Google Scholar] [CrossRef]
  15. Peng, S.; Zhang, Z.; Deng, R.; Cheng, P. Localizing false data injection attacks in smart grid: A spectrum-based neural network approach. IEEE Trans. Smart Grid 2023, 14, 4827–4838. [Google Scholar] [CrossRef]
  16. Zhu, J.; Meng, W.; Sun, M.; Yang, J.; Song, Z. FLLF: A fast-lightweight location detection framework for false data injection attacks in smart grids. IEEE Trans. Smart Grid 2024, 15, 911–920. [Google Scholar] [CrossRef]
  17. Chen, Y.; Lakshminarayana, S.; Teng, F. Localization of coordinated cyber-physical attacks in power grids using moving target defense and deep learning. In Proceedings of the 2022 IEEE International Conference on Communications, Control, and Computing Technologies for Smart Grids (SmartGridComm), Singapore, 25–28 October 2022. [Google Scholar]
  18. Yu, J.; Li, Q. Optimal deployment in moving target defense against coordinated cyber-physical attacks via game theory. Electronics 2023, 12, 2484. [Google Scholar] [CrossRef]
  19. Yu, J.; Li, Q. Moving target defense for detecting coordinated cyber-physical attacks on power grids via a modified sensor measurement expression. Electronics 2023, 12, 1679. [Google Scholar] [CrossRef]
  20. Vapnik, V. The Nature of Statistical Learning Theory; Springer: New York, NY, USA, 1995. [Google Scholar]
  21. Khabbouchi, I.; Said, D.; Oukaira, A.; Mellal, I. Machine learning and game theoretic model for advanced wind energy management protocol (AWEMP). Energies 2023, 16, 2179. [Google Scholar] [CrossRef]
  22. Ham, J.; Chen, Y.; Crawford, M.M.; Ghosh, J. Investigation of the random forest framework for classification of hyperspectral data. IEEE Trans. Geosci. Remote Sens. 2005, 43, 492–501. [Google Scholar] [CrossRef]
  23. Tan, Z.; Chen, J.; Kang, Q.; Zhou, M.; Abusorrah, A.; Sedraoui, K. Dynamic embedding projection-gated convolutional neural networks for text classification. IEEE Trans. Neural Netw. Learn. Syst. 2022, 33, 973–982. [Google Scholar] [CrossRef]
  24. Nudell, T.R.; Nabavi, S.; Chakrabortty, A. A real-time attack localization algorithm for large power system networks using graph-theoretic techniques. IEEE Trans. Smart Grid 2015, 6, 2551–2559. [Google Scholar] [CrossRef]
  25. Khalaf, M.; Youssef, A.; El-Saadany, E. Joint detection and mitigation of false data injection attacks in AGC system. IEEE Trans. Smart Grid 2019, 10, 4985–4995. [Google Scholar] [CrossRef]
  26. Luo, X.; Li, Y.; Wang, X.; Guan, X. Interval observer-based detection and localization against false data injection attack in smart grids. IEEE Internet Things J. 2021, 8, 657–671. [Google Scholar] [CrossRef]
  27. Mohammadpourfard, M.; Genc, I.; Lakshminarayana, S.; Konstantinou, C. Attack detection and localization is smart grid with image-based deep learning. In Proceedings of the 2021 IEEE International Conference on Communications, Control, and Computing Technologies for Smart Grids (SmartGridComm), Aachen, Germany, 25–28 October 2021. [Google Scholar]
  28. Angulo, C.; Parra, X.; Català, A. A support vector machine for multi-class classification. Neurocomputing 2003, 55, 57–77. [Google Scholar] [CrossRef]
  29. Tang, Q.; Qiu, W.; Zhou, Y. Classification of complex power quality disturbances using optimized s-transform and kernel SVM. IEEE Trans. Ind. Electron. 2020, 67, 9715–9723. [Google Scholar] [CrossRef]
  30. Chen, Y.; Mao, Q.; Wang, B.; Duan, P.; Zhang, B.; Hong, Z. Privacy-preserving multi-class support vector machine model on medical diagnosis. IEEE J. Biomed. Health Inform. 2022, 26, 3342–3353. [Google Scholar] [CrossRef] [PubMed]
  31. Rezvani, S.; Wu, J. Handling multi-class problem by intuitionistic fuzzy twin support vector machines based on relative density information. IEEE Trans. Pattern Anal. Mach. Intell. 2023, 45, 14653–14664. [Google Scholar] [CrossRef] [PubMed]
  32. Yuan, S.; Sun, Y.; He, W.; Gu, Q.; Xu, S.; Mao, Z.; Tu, S. MSLM-RF: A spatial feature enhanced random forest for on-board hyperspectral image classification. IEEE Trans. Geosci. Remote Sens. 2022, 60, 5534717. [Google Scholar] [CrossRef]
  33. Chen, D.; Yongchareon, S.; Lai, E.M.-K.; Sheng, Q.Z.; Liesaputra, V. Locally weighted ensemble-detection-based adaptive random forest classifier for sensor-Based online activity recognition for multiple residents. IEEE Internet Things J. 2022, 15, 13077–13085. [Google Scholar] [CrossRef]
  34. Tong, F.; Zhang, Y. Spectral-spatial and cascaded multilayer random forests for tree species classification in airborne hyperspectral Images. IEEE Trans. Geosci. Remote Sens. 2022, 60, 4411711. [Google Scholar] [CrossRef]
  35. Wang, T.; Xue, F.; Zhou, Y.; Ming, A. MARF: Multiscale adaptive-switch random forest for leg detection with 2-D laser scanners. IEEE Trans. Cybern. 2023, 53, 6200–6210. [Google Scholar] [CrossRef]
  36. Li, S.; Chen, Z.; Li, X.; Lu, J.; Zhou, J. Unsupervised variational video hashing with 1D-CNN-LSTM networks. IEEE Trans. Multimed. 2020, 6, 1542–1554. [Google Scholar] [CrossRef]
  37. Tabrizi, S.S.; Pashazadeh, S.; Javani, V. Comparative study of table tennis forehand strokes classification using deep learning and SVM. IEEE Sens. J. 2020, 20, 13552–13561. [Google Scholar] [CrossRef]
  38. Xiao, D.; Chen, Y.; Li, D.D.-U. One-dimensional deep learning architecture for fast fluorescence lifetime imaging. IEEE J. Sel. Top. Quantum Electron. 2021, 27, 7000210. [Google Scholar] [CrossRef]
  39. Yang, S.; Zhou, J.; Zhao, Y.; Hua, G.; Sun, H.; Zheng, N. Robust and efficient star identification algorithm based on 1-D convolutional neural network. IEEE Trans. Aerosp. Electron. Syst. 2022, 58, 4156–4167. [Google Scholar] [CrossRef]
  40. Mohine, S.; Bansod, B.S.; Bhalla, R.; Basra, A. Acoustic modality based hybrid deep 1D CNN-BiLSTM algorithm for moving vehicle classification. IEEE Trans. Intell. Transp. Syst. 2022, 23, 16206–16216. [Google Scholar] [CrossRef]
  41. Husari, F.; Seshadrinath, J. Incipient interturn fault detection and severity evaluation in electric drive system using hybrid HCNN-SVM based model. IEEE Trans. Ind. Inform. 2022, 18, 1823–1832. [Google Scholar] [CrossRef]
  42. Lee, G.; Kim, S.-W.; Jeon, M. Machinery value estimation method based on IIoT system utilizing 1D-CNN model for low sampling rate vibration signals from MEMS. IEEE Internet Things J. 2023, 14, 12261–12275. [Google Scholar] [CrossRef]
  43. Du, W.; Hu, P.; Wang, H.; Gong, X.; Wang, S. Fault diagnosis of rotating machinery based on 1D–2D joint convolution neural network. IEEE Trans. Ind. Electron. 2023, 70, 5277–5285. [Google Scholar] [CrossRef]
  44. Xu, Y.; Feng, K.; Yan, X.; Sheng, X.; Sun, B.; Liu, Z.; Yan, R. Cross-modal fusion convolutional neural networks with online soft-label training strategy for mechanical fault diagnosis. IEEE Trans. Ind. Inform. 2024, 20, 73–84. [Google Scholar] [CrossRef]
Figure 1. The flow chart of data sampling.
Electronics 13 02256 g001
Figure 2. The structure of a sample.
Electronics 13 02256 g002
Figure 3. Architecture of 1D-CNN to address SCCPA localization.
Electronics 13 02256 g003
Figure 4. Architecture of the 1D-CNN (IEEE 14-bus power system).
Electronics 13 02256 g004
Figure 5. Three confusion matrices based on SVM, RF, and 1D-CNN, respectively, for the IEEE 14-bus power system. Lastly, we apply precision (P), recall (R), and F1 value to comprehensively evaluate the simulation results. These metrics’ formulations [44] are presented as follows.
Electronics 13 02256 g005
Figure 6. Architecture of 1D-CNN (IEEE 30-bus power system).
Electronics 13 02256 g006
Figure 7. Three confusion matrices based on SVM, RF and 1D-CNN, respectively, for the IEEE 30-bus power system.
Electronics 13 02256 g007
Figure 8. Architecture of 1D-CNN (IEEE 118-bus power system).
Electronics 13 02256 g008
Figure 9. Three confusion matrices based on SVM, RF, and 1D-CNN, respectively, for the IEEE 118-bus power system.
Electronics 13 02256 g009
Table 1. Summary of related works.
AuthorPublication
Year
Algorithm
Used
Main Contributions
Cecilio Angulo et al. [28]2003SVM with a
“1-1-r” structure
Am SVM, named as KSVCR, was designed based on Vapnik’s support vector theory.
Qiu Tang
et al. [29]
2020KSVMAn optimized S-transform (OST) and a kernel SVM (KSVM). Subsequently, a classification framework to detect and classify various PQD signals through integrating OST and KSVM was developed.
Yange Chen
et al. [30]
2022Multi-class SVMs composed of several binary classification SVMsA privacy-preserving medical diagnosis scheme based on multi-class SVMs and a secure computing protocol to calculate the key process of the SVM classification algorithm.
Salim Rezvani et al. [31]2023SVM with a
“1-1-r”
The intuitionistic fuzzy twin SVM (IFTSVM) can reduce the negative impact of noise and outliers. A new version of the IFTSVM using relative density information was proposed. Then, all the training points were evaluated using a “1-1-r” strategy to construct the k-class classification hyperplanes.
Shuai Yuan
et al. [32]
2022RFA multiscale local maximum RF (MSLM-RF) was proposed. The MSLM-RF relied on RF for classification after spectral and spatial features fusion.
Dong Chen
et al. [33]
2022RFBased on a locally weighted ensemble detection-based adaptive RF(LED-ARF) classifier, a novel OL architecture was proposed [33].
Fei Tong et al.
[34]
2022RFA spectral–spatial and cascaded multilayer RF(SSCMRF) method was proposed to classify tree species in a high-spatial-resolution hyperspectral image [34]. Two classification stages were adopted to fully exploit the spatial information. By concatenating the output of the superpixel-based classification, two kinds of spatial information were integrated.
Tianxi Wang
et al. [35]
2023RFA multiscale adaptive-switch RF was proposed. First, the adaptive-switch decision tree was designed to use noise-sensitive features to conduct binary classification [35]. Second, a multiscale RF structure to detect legs at different distances was designed.
Shuyan Li et al. [36]2020 1D-CNN-LSTMA 1D-CNN-LSTM model, shaped by fusing 1D-CNN and a long-short term memory (LSTM) network, was designed to better exploit the global information of videos. The model processed long frame sequences in a parallel and hierarchical way and exploited the correlations between frames to reconstruct the frame-level features [36].
Sahar S. Tabrizi
et al. [37]
2020SVM with RBF
LSTM
2D-CNN
A comparative study was performed to examine the forehand strokes classification of three ML models in table tennis [37]. The paper studied tuning the models’ parameters and examining sensitivities of the models and type of data.
Dong Xiao
et al. [38]
20211D-CNNA deep learning architecture with 1D-CNN was presented for quickly analyzing fluorescence lifetime imaging (FLIM) data. Simultaneously, the reason of selecting the 1D-CNN was thoroughly illustrated.
Shaofei Yang et al. [39]20221D-CNNA robust and efficient star identification algorithm utilizing 1D-CNN was proposed. Moreover, a combined star points selection strategy technique and a mixed initial features extraction technique were presented.
Shailesh Mohine et al. [40]20221D-CNN-BiLSTMAn acoustic modality-based hybrid deep 1D-CNN-bidirectional LSTM technique for moving vehicle classification was proposed. The high-level features sequentially detected from experimentally generated vehicles signal were automatically extracted, and these features were kept in the network for analyzing the time-varying characteristic for classification by the presented algorithm.
Fatima Husari et al. [41]2022Hybrid HCNN-SVMFor the incipient interturn fault diagnosis of drive-fed machines, a novel two-level hybrid architecture consisting of CNN and SVM was created. The first level of the structure was to identify the pattern of interturn fault, and the second level was developed to recognize the fault severity. The shared layers of HCNN can automatically extract the features, which were suitably used to train the SVM for classification.
Gyuho Lee et al. [42]20231D-CNNAfter a sensor was designed to acquire the vibration and magnetic field data of equipment, a 1D CNN was proposed to classify the status of machinery based on the data from the sensor.
Wenliao Du et al. [43]20231D-2D Joint CNNCombining a 1D-CNN and 2D-CNN can make full use of their advantages. A 1D-2D joint CNN was constructed for rotating machinery fault diagnosis. Specifically, 1D convolution can obtain the multiscale feature vectors of the vibration signal; these feature vectors were transformed into 2D maps, and then these 2D vectors were injected into the 2D CNN.
Yadong Xu et al. [44]2024CMFCNNA cross-modal fusion convolutional neural network (CMFCNN), which adopted two parallel modality-specific networks and a cross-modal knowledge-sharing network was proposed. To achieve effective feature propagation and fusion, a cross-modal fusion module was introduced to integrate cross-modal features and pass the fused information to the next layer [44].
Table 2. Labels and corresponding tripping line sets (IEEE 14-bus power system).
LabTripping
Line Set
LabTripping
Line Set
LabTripping
Line Set
LabTripping
Line Set
LabTripping
Line Set
111217319420511, 17
611, 19711, 20817, 19917, 201019, 20
Table 3. Labels and corresponding tripping line sets (IEEE 30-bus power system).
LabTripping
Line Set
LabTripping
Line Set
LabTripping
Line Set
LabTripping
Line Set
LabTripping
Line Set
017118221322417, 18
517, 21611, 22718, 21818, 22921, 22
Table 4. Quality test results of the sampling data using the XGBoost algorithm.
Test MacroTotal Number
of Training Sessions
Testing Set Error Rate (Softmax)Testing Set Error Rate (Softprob)
IEEE 14-bus power system1000.00.0
IEEE 30-bus power system1000.0009430.000943
IEEE 118-bus power system1000.00.0
Table 5. Model accuracy performance metrics (IEEE 14-bus power system).
ClassificationApproach
SVMRF1D-CNN
PRF1PRF1PRF1
1111111111
2111111111
3111111111
4111111111
511111110.9860.993
61111110.98210.99
7111111111
8111111111
911111110.9870.993
101111110.98710.993
Table 6. Diagnostic results of the metrics (IEEE 14-bus power system).
ApproachHighest-Acc (%)Minimum-Acc (%)Avg-Acc (%)Avg-F1 (%)
SVM100100100100
RF100100100100
1D-CNN10098.299.799.7
Table 7. Model accuracy performance metrics (IEEE 30-bus power system).
ClassificationApproach
SVMRF1D-CNN
PRF1PRF1PRF1
10.5520.6920.6140.99610.9980.92310.96
211111110.9980.999
31111110.9780.9320.95
40.5950.4460.5111110.9280.96
511111110.9540.977
60.97890.9940.9861110.8810.937
7111111111
8111111111
91111110.9670.920.943
101111110.987610.994
Table 8. Diagnostic results of the metrics (IEEE 30-bus power system).
ApproachHighest-Acc (%)Minimum-Acc (%)Avg-Acc (%)Avg-F1 (%)
SVM10055.291.391.1
RF10099.699.9699.98
1D-CNN1008897.497.2
Table 9. Model accuracy performance metrics (IEEE 118-bus power system).
ClassificationApproach
SVMRF1D-CNN
PRF1PRF1PRF1
1111111111
21111110.99210.996
31111110.9810.9830.982
4111111111
51111110.9790.9830.981
611111110.9940.997
71111110.98510.992
811111110.9950.998
911111110.9880.993
10111111111
111111110.98810.994
Table 10. Diagnostic results of the metrics (IEEE 118-bus power system).
ApproachHighest-Acc (%)Minimum-Acc (%)Avg-Acc (%)Avg-F1 (%)
SVM100100100100
RF100100100100
1D-CNN10097.997.899.4
Disclaimer/Publisher’s Note: The statements, opinions and data contained in all publications are solely those of the individual author(s) and contributor(s) and not of MDPI and/or the editor(s). MDPI and/or the editor(s) disclaim responsibility for any injury to people or property resulting from any ideas, methods, instructions or products referred to in the content.

