Abstract
This research introduces a novel framework utilizing a sequential gated graph convolutional neural network (GGCN) designed specifically for botnet detection within Internet of Things (IoT) network environments. By capitalizing on the strengths of graph neural networks (GNNs) to represent network traffic as complex graph structures, our approach adeptly handles the temporal dynamics inherent to botnet attacks. Key to our approach is the development of a time-stamped multi-edge graph structure that uncovers subtle temporal patterns and hidden relationships in network flows, critical for recognizing botnet behaviors. Moreover, our sequential graph learning framework incorporates time-sequenced edges and multi-edged structures into a two-layered gated graph model, which is optimized with specialized message-passing layers and aggregation functions to address the challenges of time-series traffic data effectively. Our comparative analysis with the state of the art reveals that our sequential gated graph convolutional neural network achieves substantial improvements in detecting IoT botnets. The proposed GGCN model consistently outperforms the conventional model, achieving improvements in accuracy ranging from marginal to substantial—0.01% for BoT IoT and up to 25% for Mirai. Moreover, our empirical analysis underscores the GGCN’s enhanced capabilities, particularly in binary classification tasks, on imbalanced datasets. These findings highlight the model’s ability to effectively navigate and manage the varying complexity and characteristics of IoT security threats across different datasets.
1. Introduction
With the expansion of the Internet of Things (IoT) ecosystem, it is foreseen that a substantial portion—approximately 52%—of these devices will comprise low-cost and low-maintenance massive IoT devices, which can perform simple tasks and lack the ability to run complex real-time algorithms for attack detection [1]. As a consequence, IoT devices are frequently vulnerable to attackers [2,3,4], with denial-of-service (DoS) attacks being a common type, accounting for approximately 20% of all attacks targeting the IoT [5]. With the rapid growth of IoT systems, the threat landscape has witnessed a surge in emerging botnet attacks, posing significant challenges to intrusion detection systems (IDSs). Conventional deep learning and machine learning techniques [6], while effective in certain domains, have struggled to effectively capture the intricate patterns and dynamics of IoT botnet attacks due to the absence of inherent graph-like structures in their methodologies. However, graph neural networks (GNNs) [7,8] have emerged as a promising solution for structured data analysis in various domains, such as social media and recommendation systems, enabling the exploitation of underlying graph structures in data representations. Given that network traffic inherently possesses underlying topology, it can be naturally expressed as nodes and edges, leveraging network flow information for improved botnet detection. GNNs are particularly well-suited for this task, as they excel in capturing and learning from graph-structured data, allowing for a more comprehensive representation of complex and interconnected network behavior.
One of the key advantages of GNNs in botnet detection lies in their ability to handle the sequential nature of botnet attacks [9,10]. Botnets often exhibit dynamic and evolving behaviors over time, which conventional methods struggle to model effectively. GNNs, however, can inherently capture temporal dependencies by aggregating information from neighboring nodes in sequential order. This sequential nature of botnet attacks can be depicted in the architecture of GNNs, facilitating the detection of sophisticated and evasive botnet activities in real-time network traffic. The incorporation of GNNs into the domain of botnet detection opens up promising strategies for enhanced accuracy and adaptability, which otherwise are crucial in countering ever-evolving cyber threats in IoT networks.
In this paper, we propose a novel sequential gated graph convolutional neural network (GGCN) framework specifically designed for botnet detection in IoT network environments, which takes sequential network flows as input and learns the relation between them using a gated mechanism. By harnessing the capabilities of GNNs in representing network traffic as graph structures and handling the sequential dynamics of botnet attacks, we improve the accuracy and efficiency of attack detection in emerging IoT botnet threats. The proposed GGCN architecture allows the botnet detection model to iteratively update and refine node embeddings based on information propagated from neighboring nodes and edge attributes representing network traffic, enabling a deeper understanding and analysis of sequential network behavior. The proposed intrusion detection model presents the key contributions aimed at enhancing botnet detection in IoT network environments as below:
- We propose a time-stamped multi-edge graph structure representing network traffic flows provided by edge attributes, enabling the temporal dynamics of bot network to be discerned. This unique feature enables the model to uncover hidden patterns and dependencies in the data, leading to more accurate and timely detection of sophisticated botnet activities.
- We propose a sequential graph learning framework that comprises time-sequenced edges and features in a multi-edged graph structure, and a two-layered gated graph model with modified message-passing layers and aggregation functions to effectively handle time-series traffic characteristics. This novel design provides the model with a deeper understanding of the relations of edges in time underlying network topology. By efficiently capturing complex dependencies and patterns in the graph data, our model can better distinguish different types of attacks and make accurate predictions in binary classification tasks.
We demonstrate the efficacy of our approach in capturing the intricacies of botnet behavior and its superiority over conventional deep learning and machine learning techniques for IoT botnet detection through extensive experimental evaluations on diverse datasets. Our work contributes to the growing body of research on applying GNNs to cybersecurity and reinforces the significance of topology-aware approaches in combating the evolving landscape of cyber attacks. The results demonstrate performance improvement, particularly as a binary classifier, across different performance metrics as compared to the multi-edged model proposed in [11].
This research paper diverges from our earlier research endeavors, where we introduced various graph structures for NIDS in IoT networks. In one of our previous paper [12], we integrated both node and edge attributes within a directed graph structure. Each node represented an application layer process, while edge attributes conveyed the network layer characteristics whereas node attributes captured the application layer attributes. In another of our papers [11], we escalated the intricacy of the graph structure to encompass multiple edges with multi-dimensional edge features. The IoT devices were represented as nodes, and the inter-node communication was represented through the multiple edges, each possessing corresponding multi-dimensional features. New functions were proposed to cater to the multiple edges and their features and the graph model consisted of a unique combination of a GCN (graph convolutional neural network) and GAT (graph attention) layer to capture the intricacies of the network graph. By contrast, in this paper, we extend the idea of multiple edges into their temporal sequencing to capture the sequential dynamics of the attack types that are sequential in nature. We apply GGCN and extend its original layers to encompass temporally sequenced multiple edges and their corresponding features within the message passing and aggregation mechanisms.
2. Related Work
Network traffic analysis has been a focal point in cybersecurity research, with ML and DL techniques emerging as powerful tools for deciphering sequential data patterns. Table 1 presents the summary of the state-of-the-art reseaches in the area of botnet detection. Amin et al. employed a pre-trained convolutional neural network (CNN) to extract features from processed data streams, followed by an optimized deep autoencoder (DAE) to capture temporal changes in surveillance actions. Subsequent training with a quadratic support vector machine (SVM) facilitated effective classification of human activities [13]. Similarly, Sahu et al. leveraged recurrent neural networks (RNNs), specifically long short-term memory (LSTM), coupled with a fully connected network (FCN), for multi-classification of malicious connections in intrusion datasets [14]. Alazab et al. introduced the Gray Wolves Optimization (GWO) algorithm, augmented with a wrapper feature selection technique, to optimize binary feature spaces and enhance botnet detection accuracy in IoT environments [15]. In another innovative approach, Rajasekaran et al. designed a gated recurrent unit (GRU) based on a bidirectional weighted feature averaging (GRU-BWFA) classifier to effectively detect distributed denial-of-service (DDoS) attacks and capture time-series events [16]. These studies collectively demonstrate the significance of ML and DL techniques in analyzing sequential network traffic data. However, the evolving nature of cybersecurity threats necessitates continual advancements in detection methodologies.

Table 1.
Summary of state-of-the-art research in botnet detection.
Recent advancements in integrating GNNs with other cutting-edge technologies have shown significant potential in enhancing cybersecurity solutions. In a comprehensive survey by Tam et al. (2024), the authors explored the fusion of GNNs with deep reinforcement learning (DRL) for end-to-end networking solutions. They highlighted the ability of GNNs to model complex network structures and enhance dynamic network configurations, thus revolutionizing network management policies and resource optimization [17]. Another study discussed the application of GNNs in defensive cyber operations, focusing on node-, edge-, and graph-level classifications. This research emphasized how GNNs can effectively identify and categorize different network components and relationships, aiding in sophisticated cybersecurity strategies [23]. Additionally, another research work delved into the explainability aspect of GNNs in cyber malware detection. Their work underscored the importance of not only accurately detecting malicious activities but also providing interpretable results to cybersecurity professionals, thereby enhancing trust and transparency in automated security systems [18]. These studies collectively underscore the versatility and robustness of GNNs in addressing various cybersecurity challenges, from network management to malware detection, making them a crucial component of modern cybersecurity frameworks. Continuing the trend in leveraging advanced computational techniques for enhancing network security, recent years have witnessed a notable surge in the utilization of GNN architectures, particularly in the fields of IDSs and network anomaly detection. Lo et al. introduced a novel approach utilizing a GraphSage-based NIDS, which outperformed non-GNN approaches on four out of six datasets. Their method incorporated an edge aggregate function within the graph structure, demonstrating improved predictive performance over non-GNN approaches on four out of six datasets [19]. Similarly, Pujol-Perich et al. focused on designing graph representations of network flows to capture meaningful structural patterns for robust NIDS. Their proposed message-passing function for learning from host connection graphs showcased resilience to artificially altered traffic flows, maintaining baseline accuracy even under such conditions. Evaluation on the CIC-IDS2017 dataset reveals that the proposed GNN model maintains baseline accuracy even when subjected to artificially altered traffic flows, whereas other models show degraded performance [20]. Furthermore, Protogerou et al. proposed a distributed anomaly detection scheme based on graph structures for monitoring multi-agent systems (MASs). By transforming flow-level information into node-level representations, their approach provided a comprehensive framework for monitoring network-wide anomalies [21]. Additionally, Yang et al. introduced a peer-to-peer (P2P) botnet detection framework utilizing node and topological features. While their results exhibited a high false positive rate (FPR), they underscored the necessity for further advancements in model performance to effectively combat emerging threats [22]. Overall, these studies demonstrate the potential of GNN-based approaches in network traffic analysis for intrusion detection. While they show promising results, challenges related to sequential attacks and multi-classification need further exploration.
A few studies have expanded their focus to the integration of GNNs in sequential attack detection, owing to their adeptness in capturing botnet topology. In a study by Zhou et al. [24], an end-to-end data-driven approach employing GNNs successfully detected P2P botnets. To comprehensively evaluate this automated detection method, synthetic or real botnet topologies were overlaid with diverse communication patterns on large-scale real background traffic graphs, thus generating datasets for analysis. Additionally, innovative methods, e.g., BD (botnet detection)-GNNExplainer [25], utilized GNNs to assess the trustworthiness of botnet detection models. BD-GNNExplainer extracted the most influential data for the GNN’s decision-making process, quantifying a score that enhanced interpretability, guided model optimization, and improved the overall understandability of the botnet detection methodology. In another contribution [26], a GNN-based botnet detection model addressed the challenge of over-smoothing and enhanced network forensics. Moreover, the integration of GNNExplainer and saliency maps facilitated the identification of suspicious network flows and botnet nodes, thereby enhancing transparency and interpretability in the automated network forensics process—features that are lacking in the existing botnet detection literature.
The related work in botnet detection using GNNs has demonstrated notable advancements in capturing graph patterns and improving detection accuracy. However, a significant gap in the existing literature lies in the lack of exploration regarding the utilization of gated graph convolution neural networks for detecting botnets in network traffic. These are a powerful variant of GNN that excels in capturing the sequential nature of botnet activities, which is essential for detecting dynamic and evolving botnet behaviors in real-time network traffic. This specific gap in the research indicates an unexplored avenue to leverage the sequential information inherent in botnet activities through gated GNN-based models. By introducing them into the botnet detection domain, the interpretability and effectiveness of the botnet detection process can improve, leading to more robust and efficient methods for combating evolving botnet threats in dynamic IoT network environments.
3. The Proposed Framework
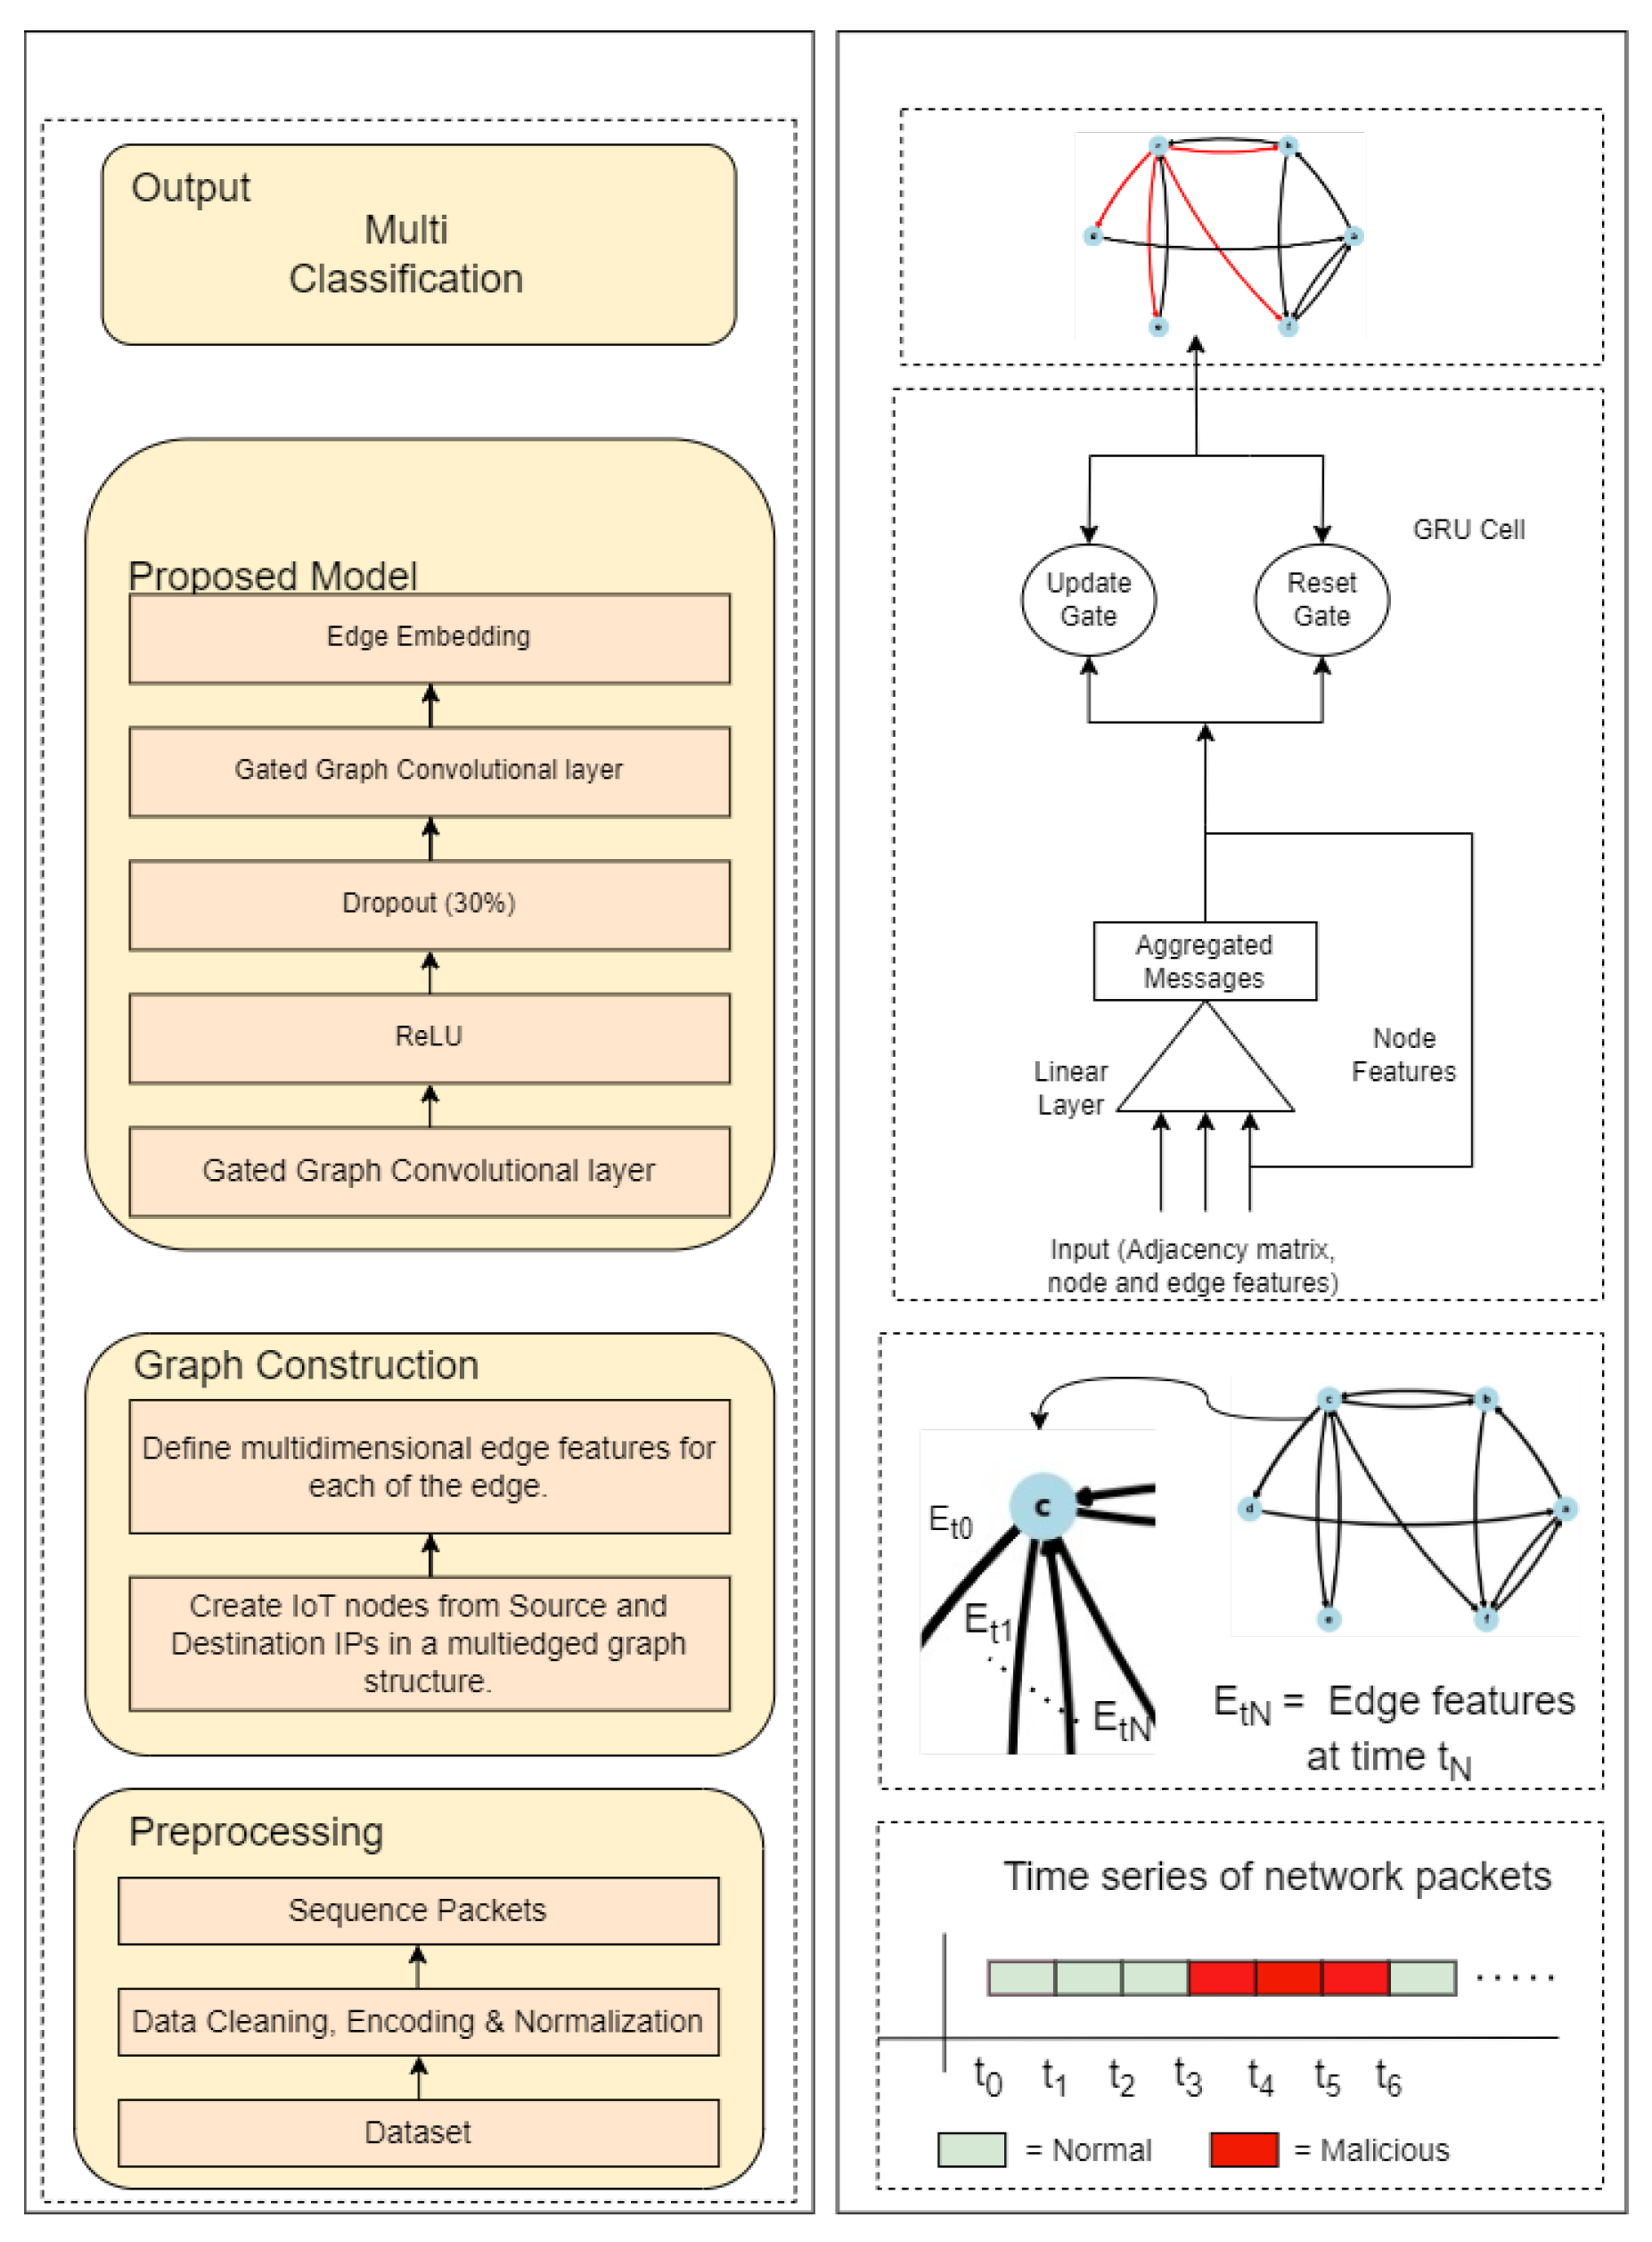
This section presents a detailed description of the proposed GNN-based botnet detection. Our proposed system incorporates a time-series multi-edged-graph structure and a GGNN model for learning the complex patterns in time and underlying topology, thus paving ways for enhanced botnet detection. The overall framework comprises three stages, namely, data preprocessing, graph construction, the proposed model and the output, as illustrated in Figure 1. Table 2 summarizes the notation and definitions used in the paper.
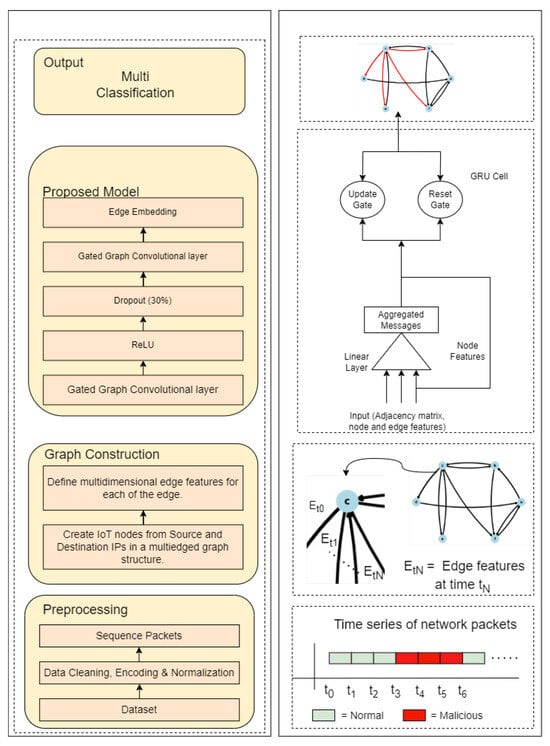
Figure 1.
The proposed framework: Textual representation (left) and visual representation (right). The left-hand side outlines the textual representation of the methodology, including data preprocessing, graph construction, model architecture, and output. The right-hand side visually depicts the detailed structure of the model, highlighting the gated graph convolutional layers, GRU cell mechanisms, and the flow of data from input to output. Directional arrows illustrate the data flow through the framework’s stages. The output is presented as a graph featuring normal edges (depicted in black) and malicious edges (depicted in red).
Table 2.
Notation and definitions used in the paper.
3.1. Data Preprocessing
The data preprocessing utilizes existing knowledge and techniques to streamline the proposed research process and build on previous work [11,12,19]. Additionally, the datasets are converted into time series. Firstly, the source and destination IP addresses are transformed into small integer values, replacing each unique IP address with a unique integer to save the computational load due to long IP addresses originally present in the dataset and to make the learning process independent of the fixed IP addresses. Data are then cleansed from null and NaN values to avoid ambiguity arising from unknown values. The feature encoding is achieved using a categorical encoder for the categorical features, and a standard scalar for the numerical features in order to normalize them. The dataset is now ready to be moved into stage 2 of the proposed framework.
3.2. Graph Construction
To model an IoT communications graph containing botnet traffic, we construct a multigraph to represent the topology of an IoT network. The graph comprises nodes representing IoT devices and edges representing device communication at time . Formally, we define , where is a set of N IoT nodes identified by their IP addresses, and collects number of edges, representing network flows between pairs of IoT nodes over time, and is the maximum number of edges. The network flows in are time series, capturing the temporal dynamics of communications between devices.
Let and denote the feature matrices associated with nodes and edges, respectively, to characterize their properties within the constructed graph. The feature matrix is -dimensional (), where K represents K-dimensional node features. The feature matrix represents the edge features of the sequential network flows and has dimensions of (). Here, denotes the cardinality of the multi-edge set , and K represents the number of features associated with each edge. Specifically, the features of edge are collected in the matrix . In contrast, the node features are represented by matrices of all ones, matching the dimensions of the edge features, which ensures consistent dimensions and preserves the significance of edge feature values, such as traffic flows, during the graph embedding process. In this representation, the graph captures the evolving nature of IoT device communication by incorporating time-series network flows, while the feature matrix provides additional information about the characteristics and properties of time-series edges in the IoT network.
The adjacency matrix of a multigraph is an -dimensional matrix. The matrix elements correspond to the multiplicity of existing edges over time. For the element at the i-th row and j-th column, , the following conditions apply: If there is no edge from node to at any time step, i.e., for all , then . If there are edges from node to over time, then . Furthermore, the multi-edge neighborhood of node , denoted by , is defined as the set of all nodes connected to through any of its edges, and can be expressed as , where .
This graph considers the time-series nature of the edge features in the adjacency matrix , capturing the evolving connectivity patterns of the multigraph over multiple time steps.
3.3. Proposed GNN Model
The key feature of the proposed botnet detection model is its ability to cater for time-series traffic characteristics in its architecture with modified message-passing layers and aggregation functions. We propose a graph structure that depicts a time series of network flows and a novel GGCN architecture with an improved message-passing mechanism to include sequential multi-edged features in the proposed GNN model, as given in Algorithm 1. Our model effectively exploits the underlying topology of network traffic, represented as nodes and edges, to address the unique challenges of botnet detection in IoT environments. This sequential analysis aligns well with the inherent nature of botnet activities in network traffic.
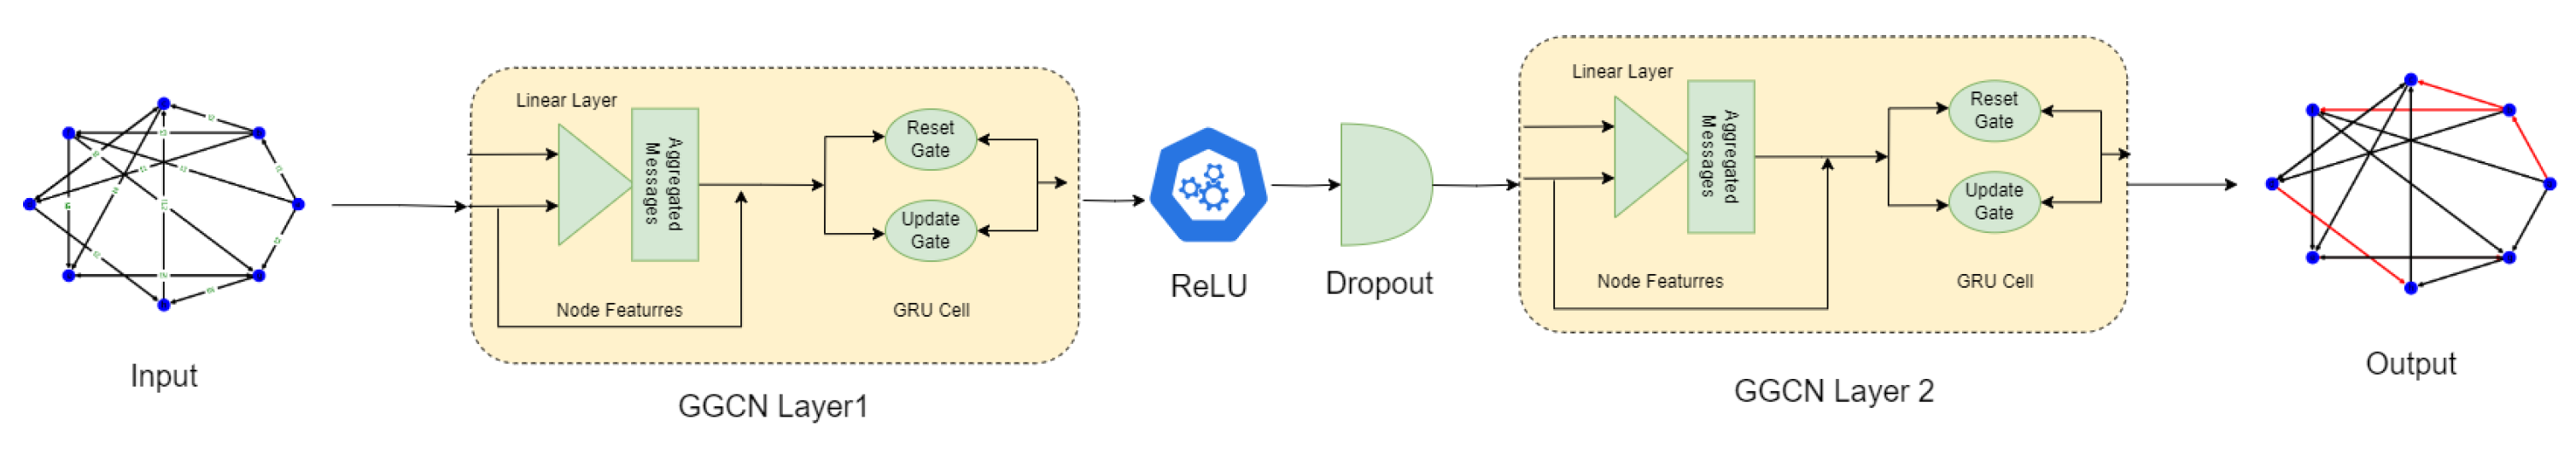
The proposed botnet detection model comprises two GGCN layers to learn the meaningful representations from the underlying topology, and the sequential relationships in edges by considering the corresponding edge features. The layered architecture of the proposed GGCN model is illustrated in Figure 2 and is expressed as
where and are the weight matrices of the hidden layers 1 and 2, respectively, and are trained using gradient descent. , K is the dimensions of the node and edge features, and is the dimension of the first hidden layer. Similarly, , and is the dimension of the third layer. is the sparse adjacency matrix and can be represented as . belongs to the set of real numbers () and has a shape of . denotes a non-linear activation function, i.e., ReLU [27] in this paper. For a matrix , ReLU can be given by
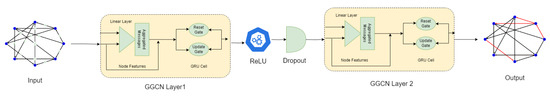
Figure 2.
Proposed model: Two-layered GGCN model with time-sequential network graph at the input and edge-level anomaly detection at the output. The output is presented as a graph featuring normal edges (depicted in black) and malicious edges (depicted in red).
Equation (1) summarizes the forward pass of two-layered GGNN propagation that takes as input the node features , adjacency matrix , and the time-dependent edge features . In the first layer, the proposed model learns from the underlying graph structure and network traffic information by concatenating the features of neighboring nodes and the corresponding edge features, and passes them through a linear layer. The aggregated messages are combined with the current node embeddings using a GRU cell. This process iterates until the desired number of layers is reached. The number of layers in the GGCN determines the depth and complexity of the model’s architecture. Each layer allows the network to iteratively update and refine the node embeddings based on the information propagated from neighboring nodes and the edge attributes representing network traffic. The activation function (e.g., ReLU) applied in the first layer helps introduce non-linearity and capture complex relationships in the data.
In the second layer, both the updated node features from the first layer and the edge features continue to contribute to the overall graph embedding. The edge features contain information about the relationships and attributes associated with the connections between nodes, such as network traffic patterns or communication characteristics. These edge features provide additional context and fine-grained details to refine the node embeddings. The node features, on the other hand, are set as all ones. They may act as a bias or constant term during the graph convolution operations. Combining the updated node features and edge features in the second layer allows the GGCN to capture and integrate both the global graph structure and the local edge-level information. Since the edge attributes contain time-dependent information (e.g., time-stamped network traffic flows), the model can capture the temporal dynamics of the network. Overall, the model can learn representations that capture the complex interplay between nodes and their connections, enhancing its ability to understand and analyze sequential network behavior.
| Algorithm 1: Sequential GGCN Algorithm |
Input: Graph Multi-edge adjacency matrix Node features matrix Edge features Output: Edge embedding |
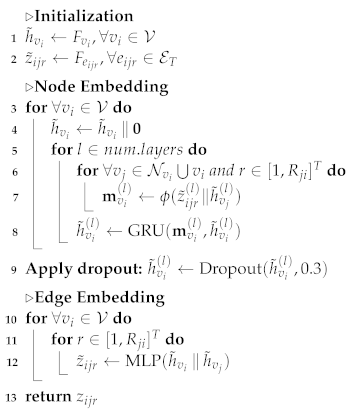 |
The input of Algorithm 1 consists of a multi-edge graph with node features set to all ones for each node and edge features to parallel edge features. Steps 1 and 2 are the initialization steps and copy node and edge features into the first hidden states.
The node embedding spans step 3 through to step 8. In step 4, the node features are combined with a zero vector to initialize the hidden states for all the nodes in the graph. Then, in steps 7 and 8, the proposed model iterates over the specified number of layers to create messages for all the nodes and multiple edges in the graph. In each layer, the node features are transformed using a weight matrix, followed by message-passing and aggregation operations. The message passing in step 7 concatenates the features of neighboring nodes and the corresponding edge features, and passes them through a linear layer. The aggregated messages are combined with the current node embeddings using a GRU cell as shown in step 8. The hidden states are updated using the GRU operation, incorporating both the aggregated messages and the previous hidden states in step 9. This process iterates until the desired number of layers () is reached to capture complex dependencies and patterns in the graph data. Step 9 applies the dropout technique [28] between two GGCN layers in order to remove overfitting during the learning process.
The edge embeddings are retrieved from the concatenation of neighboring node embeddings as shown in steps 11 and 12, that returns all edges between them, and [29] is applied to learn more expressive and informative representations of edges. This transformed representation of the edge features is utilized for edge classification tasks. The captures higher-level features and interactions between the connected nodes, which provides valuable information for distinguishing different types of edges or making predictions about their properties or labels.
In our proposed framework, we introduce a time-stamped multigraph structure to effectively capture the dynamic nature of network traffic data in IoT environments. This structure incorporates time-series information into the topology of the graph, allowing for a comprehensive representation of evolving communication patterns among IoT devices. Within this multigraph framework, each edge represents a network flow between devices at a specific time instance, enabling the model to analyze temporal dependencies and detect anomalies associated with botnet activities. To process the time-series data within the multigraph structure, we employ techniques such as sequential edge feature extraction and aggregation, ensuring that temporal dynamics are accurately captured and integrated into the botnet detection process. By leveraging the time-stamped multigraph structure, our framework enhances the sensitivity and specificity of the detection system, enabling more effective identification of botnet-related behavior amidst the complex and evolving landscape of IoT network traffic.
In summary, the proposed framework for GNN-based botnet detection is designed to address the intricate challenges inherent in IoT network environments. At its core, the framework integrates a time-series multi-edged graph structure with a novel GGCN model. The framework is organized into three key stages: Data preprocessing, graph construction, and the proposed GNN model. During data preprocessing, existing techniques are leveraged to streamline the research process, including converting datasets into time series and cleansing data from null and NaN values. In graph construction, a multigraph representation is constructed to model IoT communications, capturing both the topology of the network and the temporal dynamics of device communication. This involves defining the graph with nodes representing IoT devices and edges representing device communication over time. Features associated with nodes and edges are encoded into feature matrices and , respectively, to characterize their properties within the graph. The adjacency matrix encapsulates the multiplicity of existing edges over time, reflecting the evolving connectivity patterns of the multigraph . The proposed GNN model utilizes a sequential analysis approach to exploit the underlying topology of network traffic and address the unique challenges of botnet detection in IoT environments. The model consists of two GGCN layers, each incorporating node and edge features to learn meaningful representations from the network topology and sequential relationships in edges. The architecture of the GGCN model involves message passing, aggregation, and utilization of a GRU cell to update node embeddings iteratively. Furthermore, an algorithm is provided for sequential GGCN propagation, facilitating the creation of messages for all nodes and multiple edges in the graph. The model’s efficacy is enhanced by leveraging edge embeddings, retrieved through concatenation of neighboring node embeddings and processed using an MLP for edge classification tasks. Overall, the proposed framework presents a comprehensive and sophisticated approach to botnet detection, effectively leveraging GNNs and temporal graph structures to address the evolving challenges in IoT network security.
4. Experimental Results
This section summarizes the outcomes of various experiments conducted during model evaluation. It provides a detailed analysis of the model’s performance and its effectiveness, dataset description, and the evaluation metrics used.
4.1. Performance Evaluation Metrics
The multi-classification task at hand is effectively tackled by the proposed model. To assess the model’s performance in detecting attacks, the evaluation comprises of the following classification metrics:
- Accuracy: This metric quantifies the proportion of accurately classified observations among all the data instances.
- Precision:This metric quantifies the precision of the model in accurately predicted positive instances out of all the instances predicted as positive.
- Recall:This metric quantifies the ratio of correctly predicted true positives by a model among all the actual positive instances.
- F1-score:The F1-score is a metric that combines precision and recall, commonly utilized in scenarios involving imbalanced data.
- False Alarm Rate (FAR):The false alarm rate is a metric that evaluates the number of normal data points that are incorrectly classified as malicious.
4.2. Datasets
The evaluation of the proposed model involves the utilization of two prominent datasets, namely, BoT IoT [30] and Mirai [31]. These datasets hold significant prominence in the domain of botnet detection considering IoT network traffic.
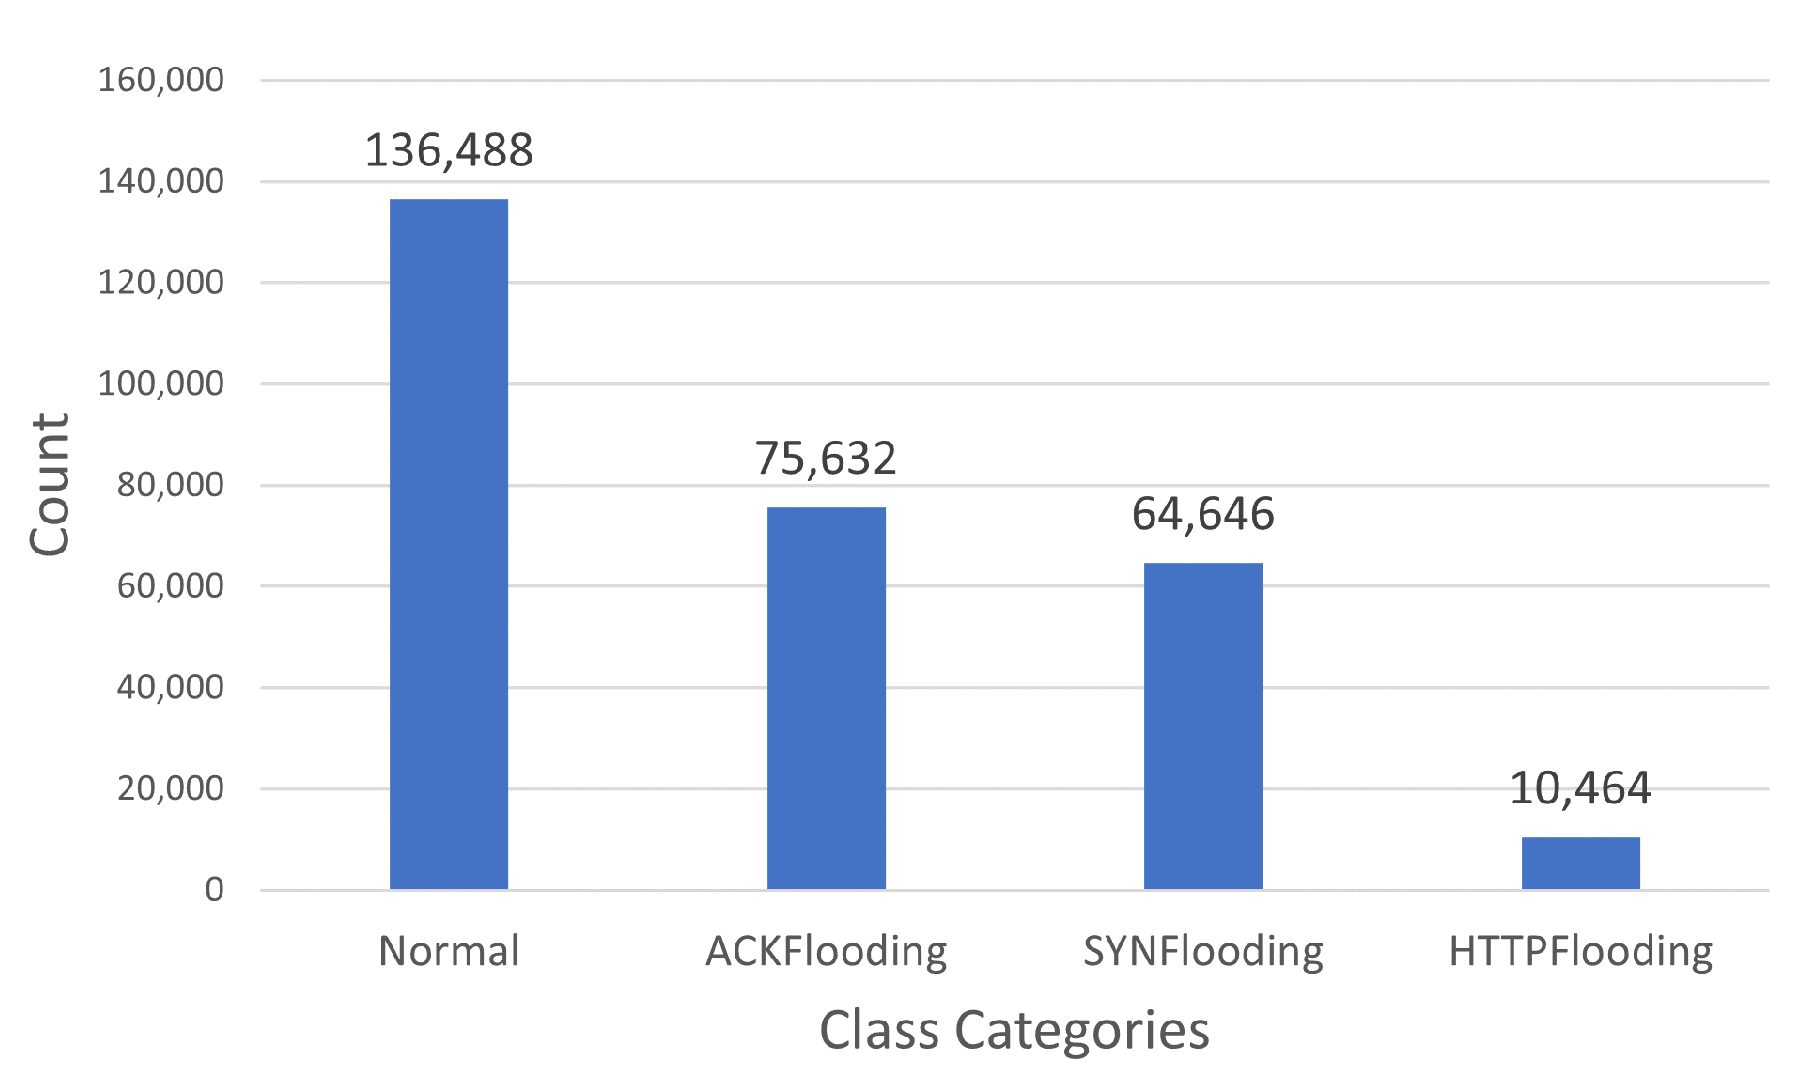
The Mirai [31] dataset comprises multiple classes of network traffic instances, with normal traffic representing the majority at 136,488 instances. It also includes instances of ACKFlooding (75,632), SYNFlooding (64,646), and HTTPFlooding (10,464), each showcasing distinct patterns of network activity, as shown in Figure 3. This distribution offers an opportunity to explore and analyze various types of IoT network flooding attacks, along with a substantial representation of normal traffic, facilitating the development and evaluation of effective intrusion detection strategies.
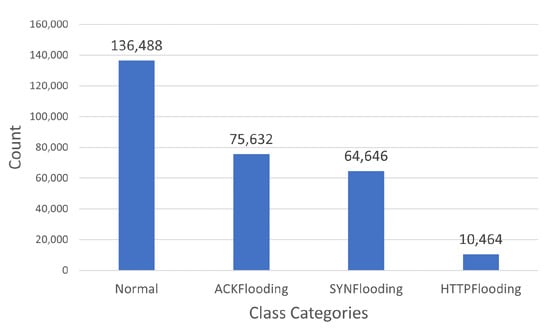
Figure 3.
A graph showing categories of network traffic instances and their counts in the Mirai dataset.
The BoT IoT [30] dataset comprises diverse classes of network traffic instances, including 576,884 instances of DDoS attacks, 91,082 instances of reconnaissance activities, 477 instances classified as normal traffic, and 79 instances categorized as theft events, as shown in Figure 4. This distribution showcases the prevalence of DDoS attacks and reconnaissance activities, while highlighting the relatively limited occurrence of normal and theft classes. This dataset provides a valuable opportunity to explore the detection and classification of botnet attacks in IoT traffic, with a focus on modeling sequential patterns and capturing the behavior of different attack types.
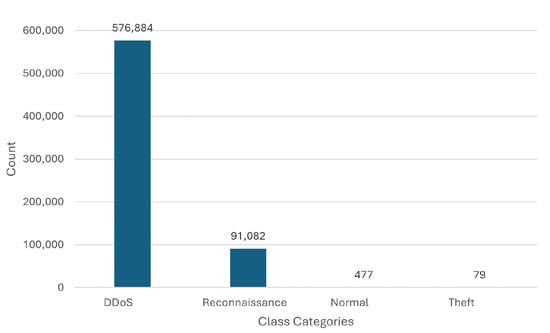
Figure 4.
A graph showing categories of network traffic instances and their count in the BoT IoT dataset.
4.3. Experimental Setup
Prior to model evaluation, the datasets undergo preprocessing and transformation into multi-edged graphs. Each graph is enriched with nodes, edges, and associated features. Comprehensive details pertaining to each knowledge graph, including dataset sizes prior to knowledge graph construction, are tabulated in Table 3. To facilitate the evaluation process, the knowledge graphs are mapped to split the edges, allocating 70% for training and the remaining 30% for testing. We adopted a non-traditional edge-based splitting method to ensure robust validation. Specifically, 70% of the edges were used for training, and the remaining 30% were reserved for testing. This approach maintains the graph’s structural integrity and prevents overlap between training and validation data. The training dataset enabled the model to learn intricate relationships and dependencies within the graph, while the independent testing dataset ensured an unbiased evaluation of the model’s performance. To effectively address class imbalance and enhance the model’s performance, we implemented class weights in the training process, calculated using the ‘class_weight’ function from Scikit-Learn, to ensure that under-represented classes received appropriate emphasis during training. This adjustment aids in mitigating potential biases and enhances model robustness against overfitting. For the model configuration, we employed the optimizer for model training with a learning rate of . The loss function used was , incorporating the class weights. The number of hyperparameters was set to equal the number of features in the dataset, ensuring that model complexity was aligned with data dimensionality. The experiments were conducted on Google Colab, employing server specifications encompassing an Intel(R) Xeon(R) CPU @ 2.00 GHz, Python version 3.10, Pytorch Geometric version 2.3.0, and CUDA 121.
Table 3.
Dataset descriptions in terms of total data entries, number of malicious and normal data entries, and the no. of nodes and edges in each graph.
4.4. Results and Discussion
We begin by presenting the results of our analysis focused on binary classification. This involves distinguishing between normal attacks and malicious network activity. Next, we extend the experiment derive results from our experiments involving multiclass classification. Here, the focus shifts to identifying various specific types of attacks associated with each network flow.
4.4.1. Binary Classification Results
In this subsection, we assess the performance of our proposed model by comparing it against state-of-the-art models using two datasets characterized by bot-like behaviors. This comparison is specifically focused on binary classification results.
Performance Evaluation on BoT IoT Dataset
The comparative analysis of the proposed model against the state of the art [11] on the BoT IoT dataset on a binary classification task is illustrated in Figure 5. The proposed model achieves an accuracy of 99.97%, illustrating its effectiveness in accurately distinguishing between benign and malicious traffic scenarios. It records precision, recall, and F1-score values at 99.98%, 99.97%, and 99.97%, respectively, demonstrating high consistency in its performance across these metrics. Although the multi-edged model shows comparable metrics, the proposed model’s edge in precision and F1-score indicates a superior balance in handling both false positives and negatives. This improvement suggests that the proposed model not only maintains strong competitive metrics but also introduces potential enhancements in predictive reliability and accuracy.
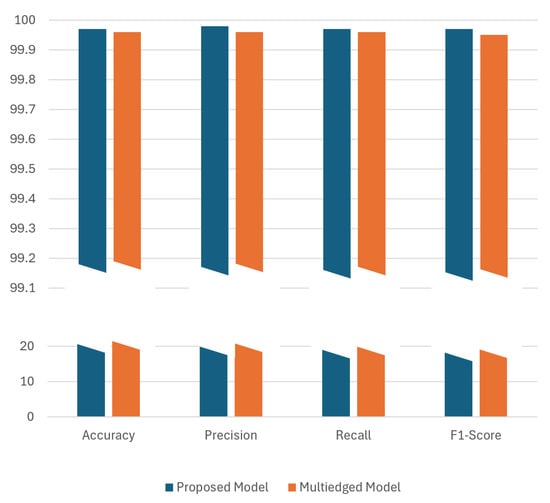
Figure 5.
Performance evaluation of the proposed GGCN with another state-of-the-art GNN model on BoT IoT dataset. The y-axis is divided into two segments: the lower segment (up to 20) shows regions of similar performance between the models, and the upper segment (starting from 99) employs a finer scale to detail minor yet significant performance differences, emphasizing where one model outperforms the other.
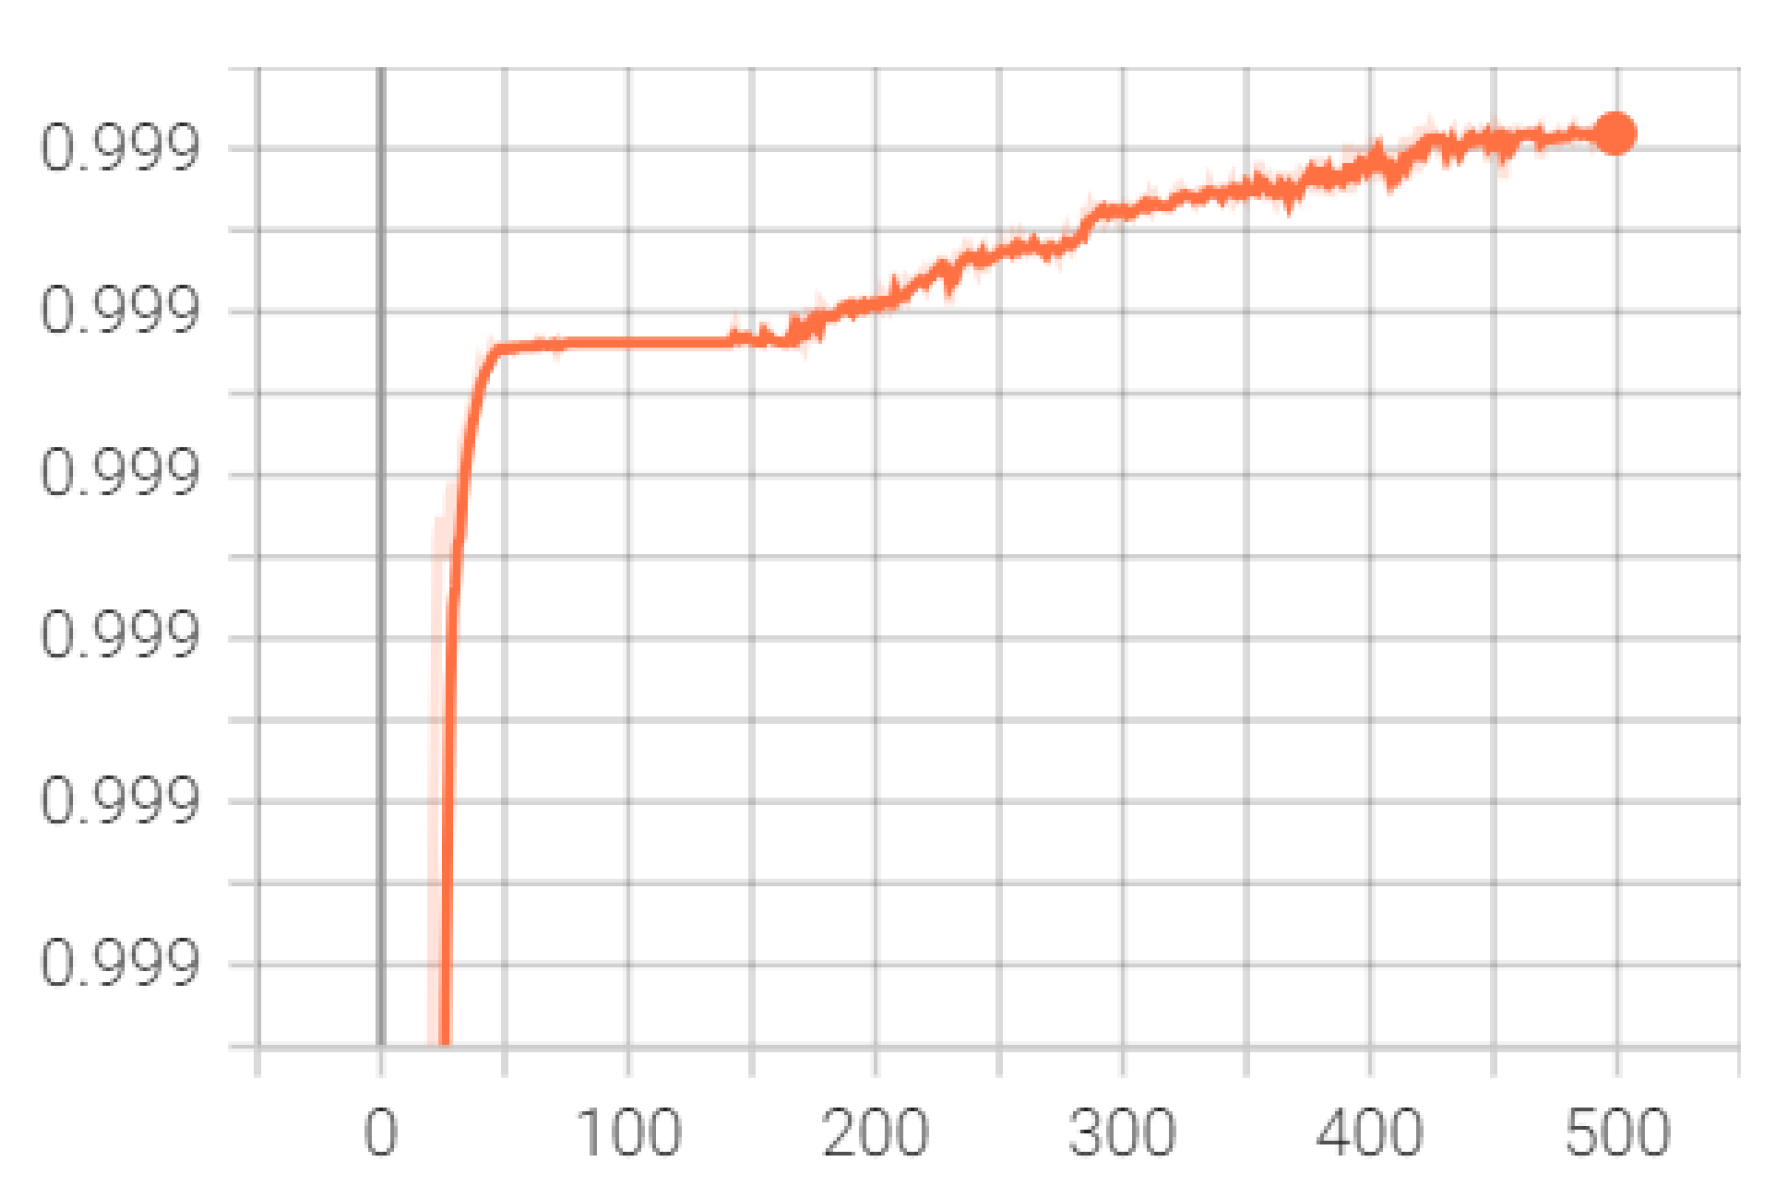
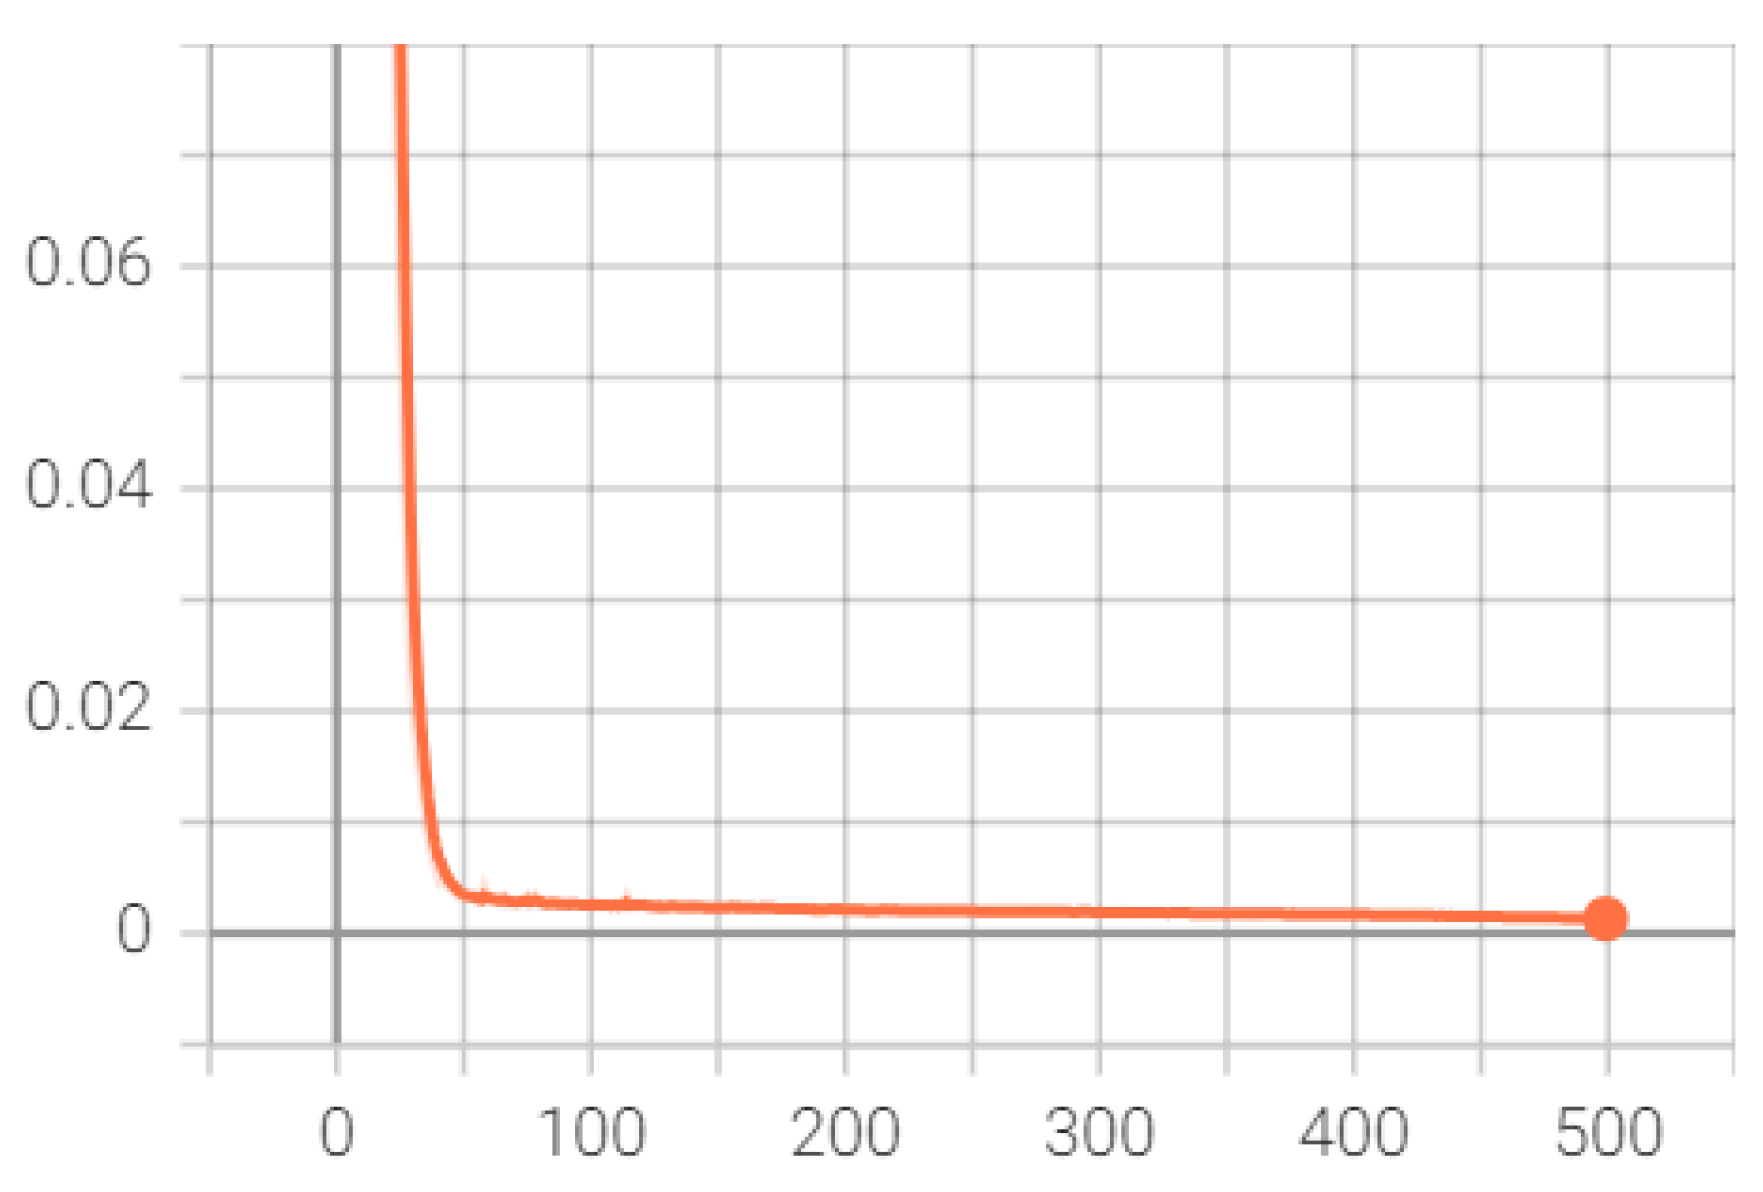
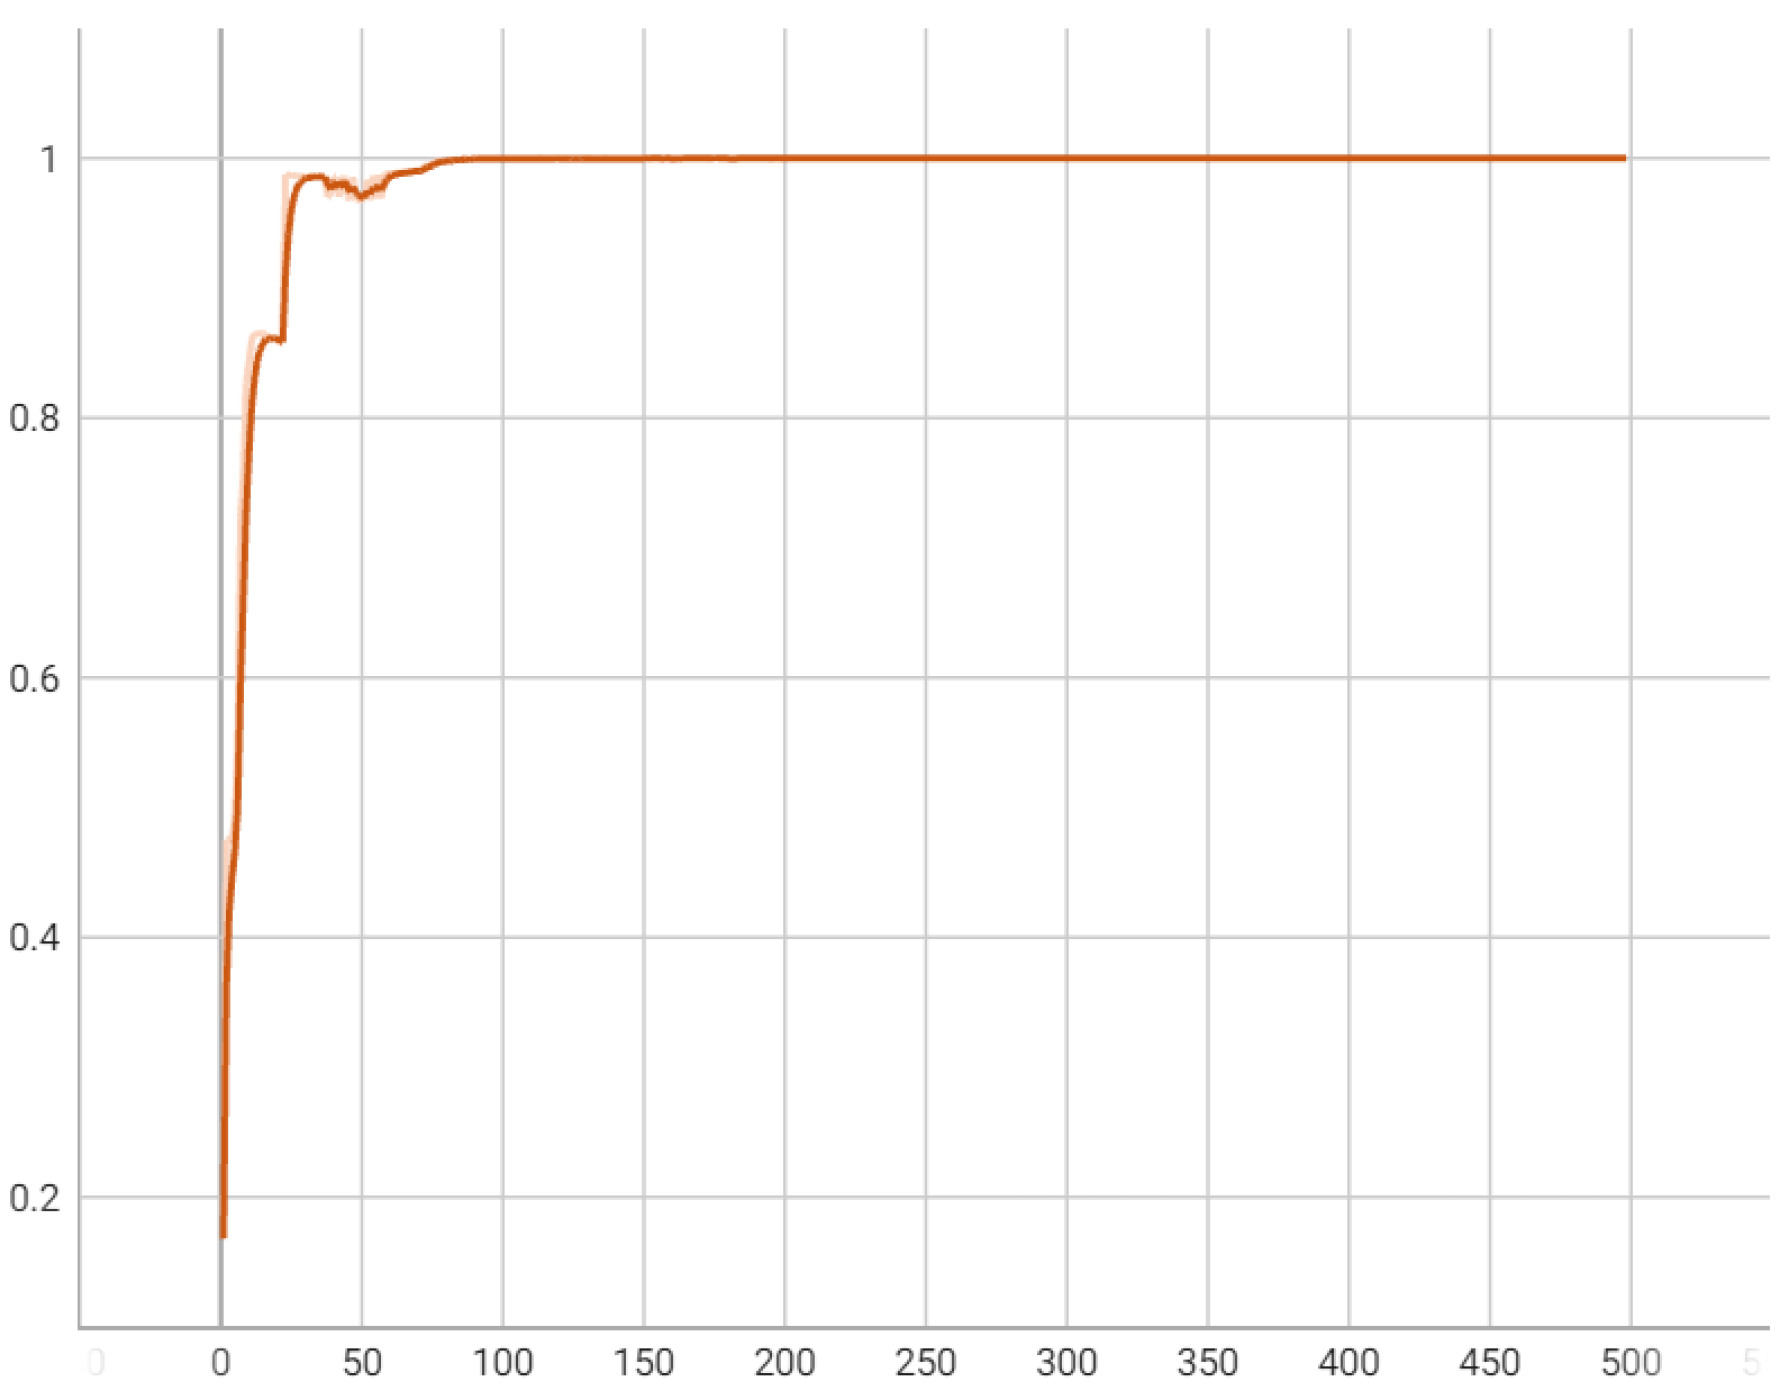
Figure 6 and Figure 7 offer insights into the model’s performance over training iterations, showcasing a rapid convergence to high accuracy and a corresponding sharp decrease in error rates. Figure 6 illustrates that the model’s accuracy swiftly approaches an exceptionally high level near 0.9999 and maintains this throughout the training, indicating efficient learning and pattern recognition from the data. Figure 7 complements this by displaying a steep reduction in error, which quickly stabilizes near zero, reflecting effective model adaptation and minimal loss in later training stages. These graphs together suggest that the model is well-tuned, benefiting from optimal initialization, appropriate learning rate settings, and a model architecture that is highly suited to the task. This performance implies strong potential for generalization to unseen data, though further validation on an independent set is essential to confirm this and ensure the model has not overfit to the training dataset.
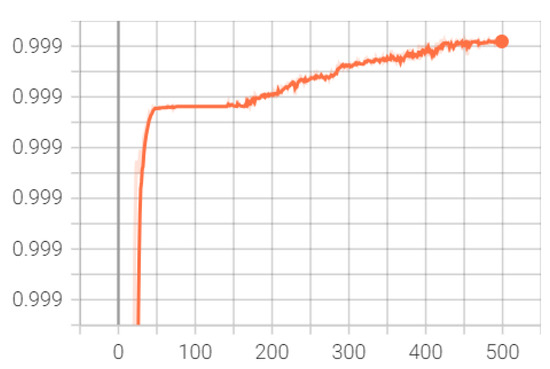
Figure 6.
Accuracy over training iterations: Progression of the proposed model’s accuracy over the training iterations, indicative of the model’s effective learning and pattern recognition capabilities.
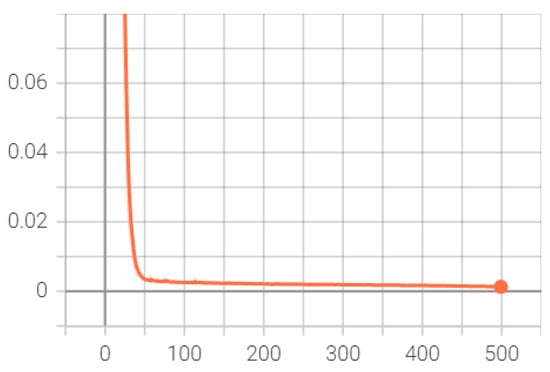
Figure 7.
Error rate over training iterations: Illustrates the sharp decline in the model’s error rate during the training phase, highlighting the model’s robust adaptation and minimal loss in advanced training stages.
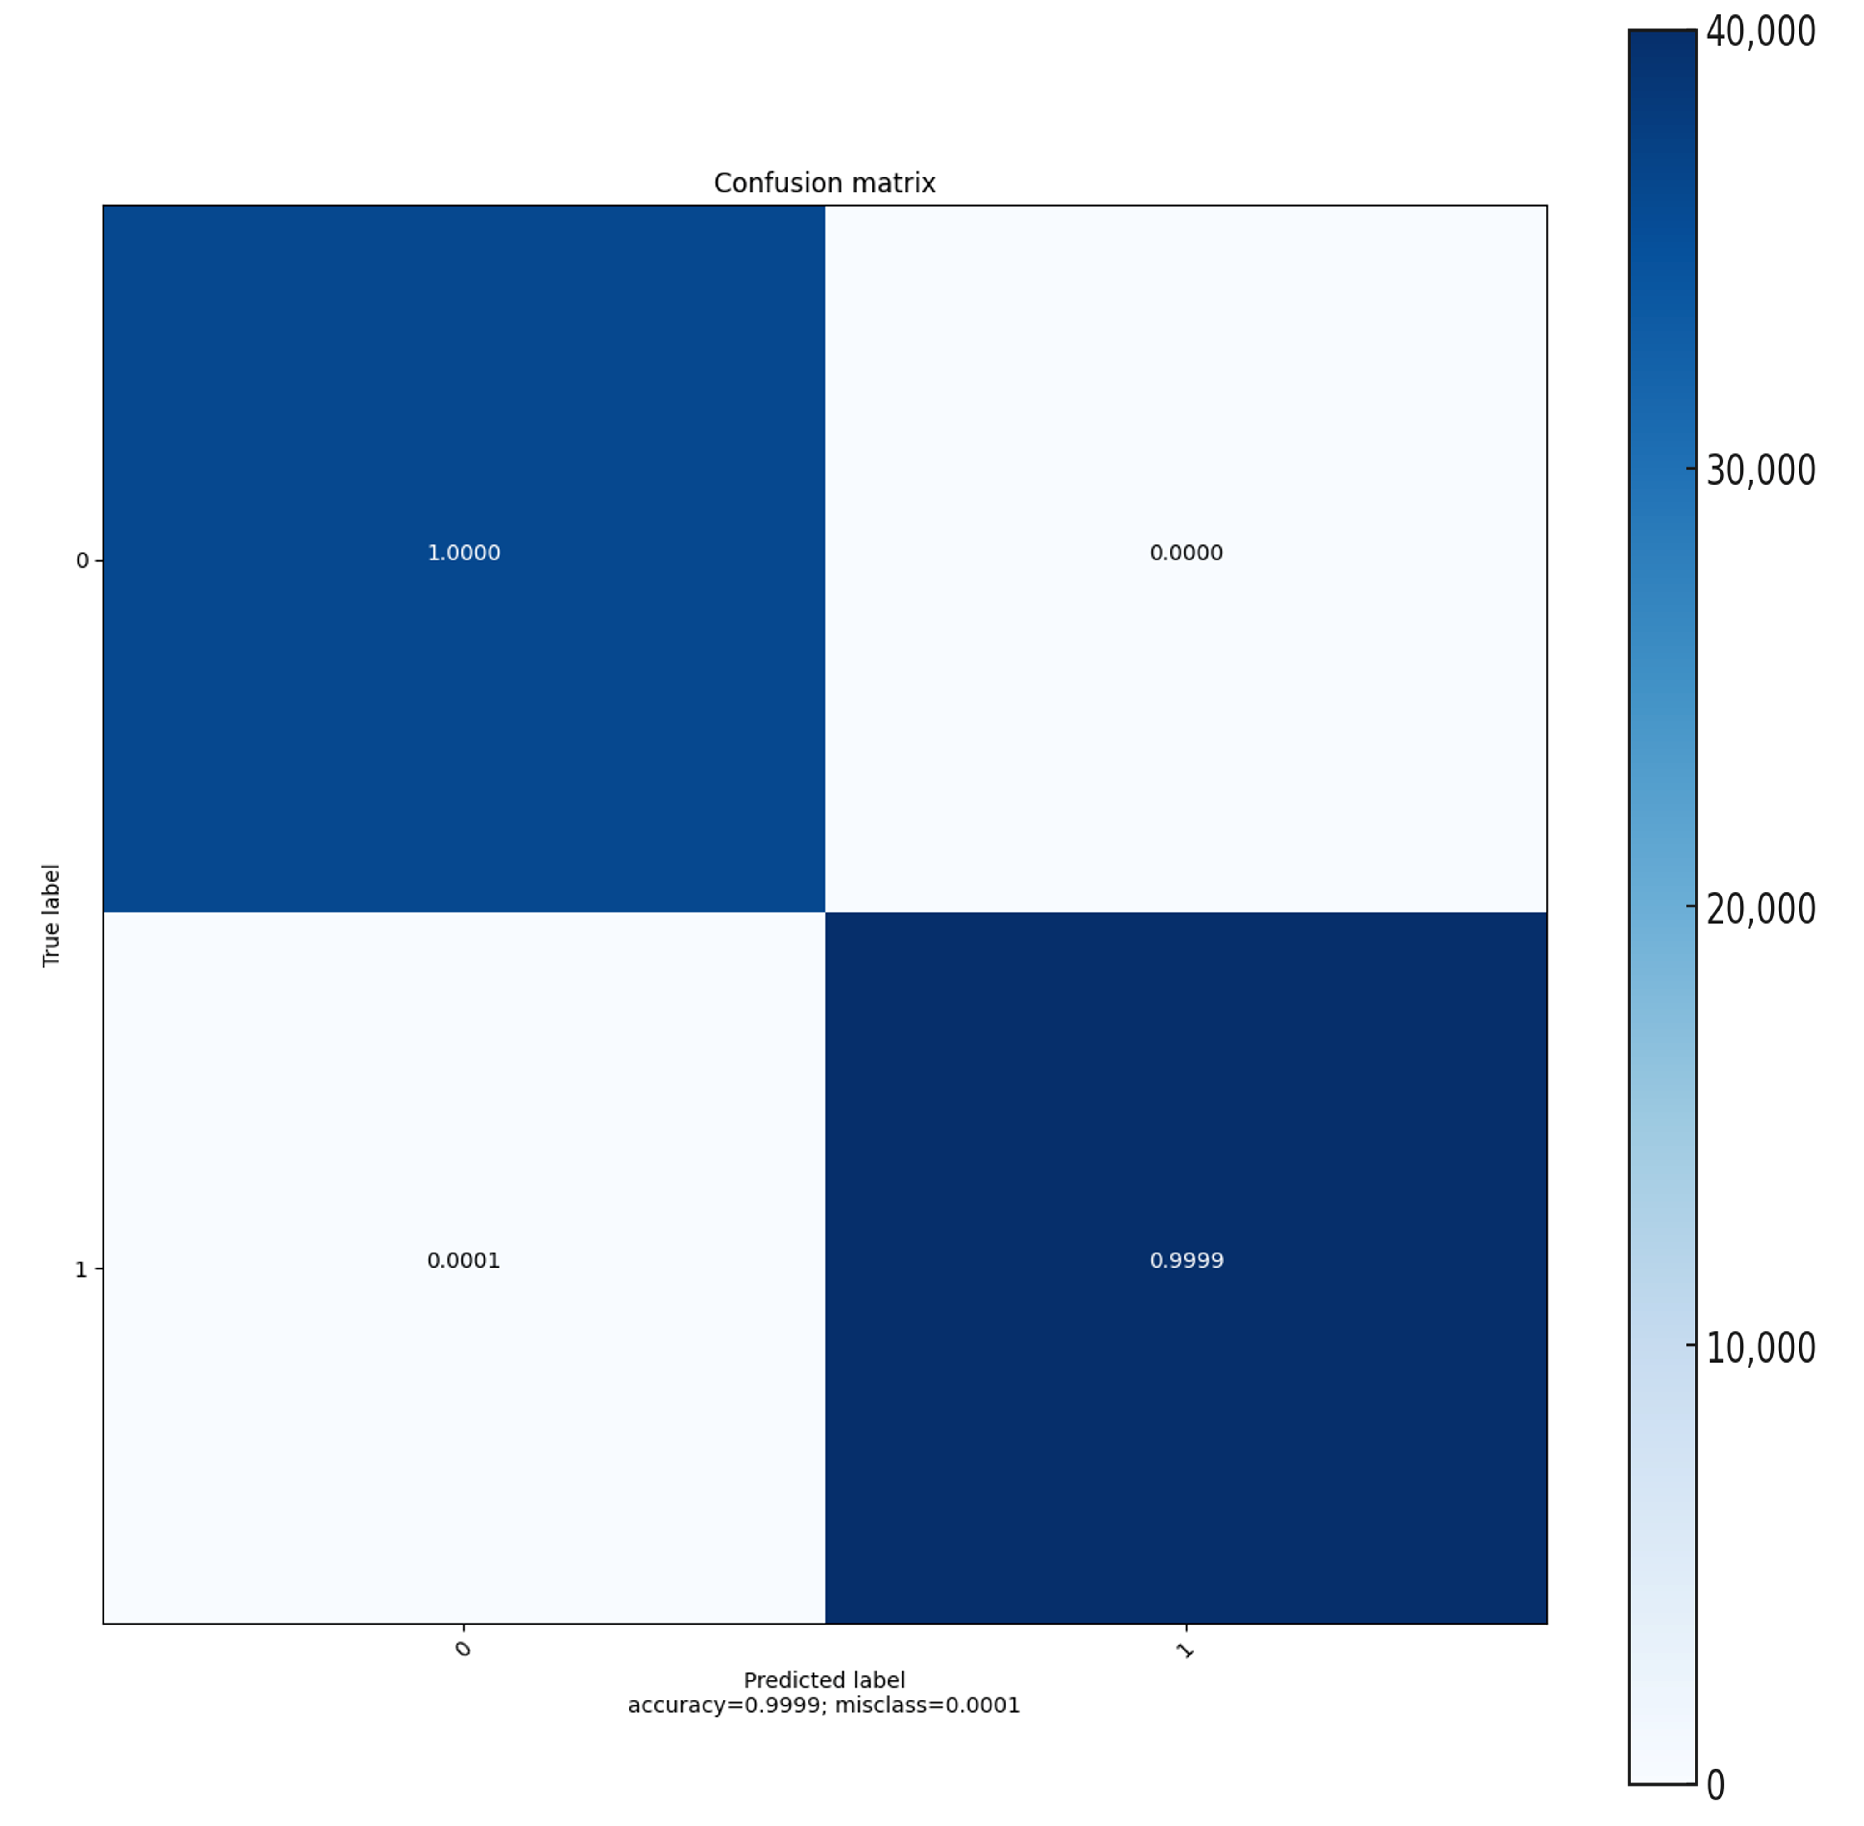
Furthermore, the confusion matrix provided in Figure 8 reveals that true negatives (TNs) are nearly absent, indicating a potential scarcity of actual negative samples or a classifier bias towards the positive class. False positives (FPs) are also virtually nonexistent, which aligns with the extremely low misclassification rate of 0.0003. Notably, the matrix shows a minuscule amount of false negatives (FNs), affirming that the classifier is highly precise in identifying true positives (TPs), as evidenced by the vast majority of predictions falling into this category. This precision is further supported by the accuracy metric (0.9997), suggesting that the classifier successfully predicts the correct labels with exceptional reliability for the dataset at hand.
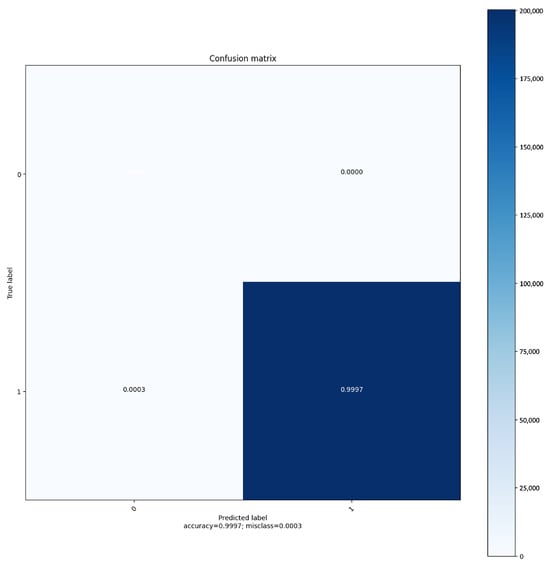
Figure 8.
Confusion matrix: The matrix visualizes the performance of the classifier on the BoT IoT dataset.
Performance Evaluation on Mirai Dataset
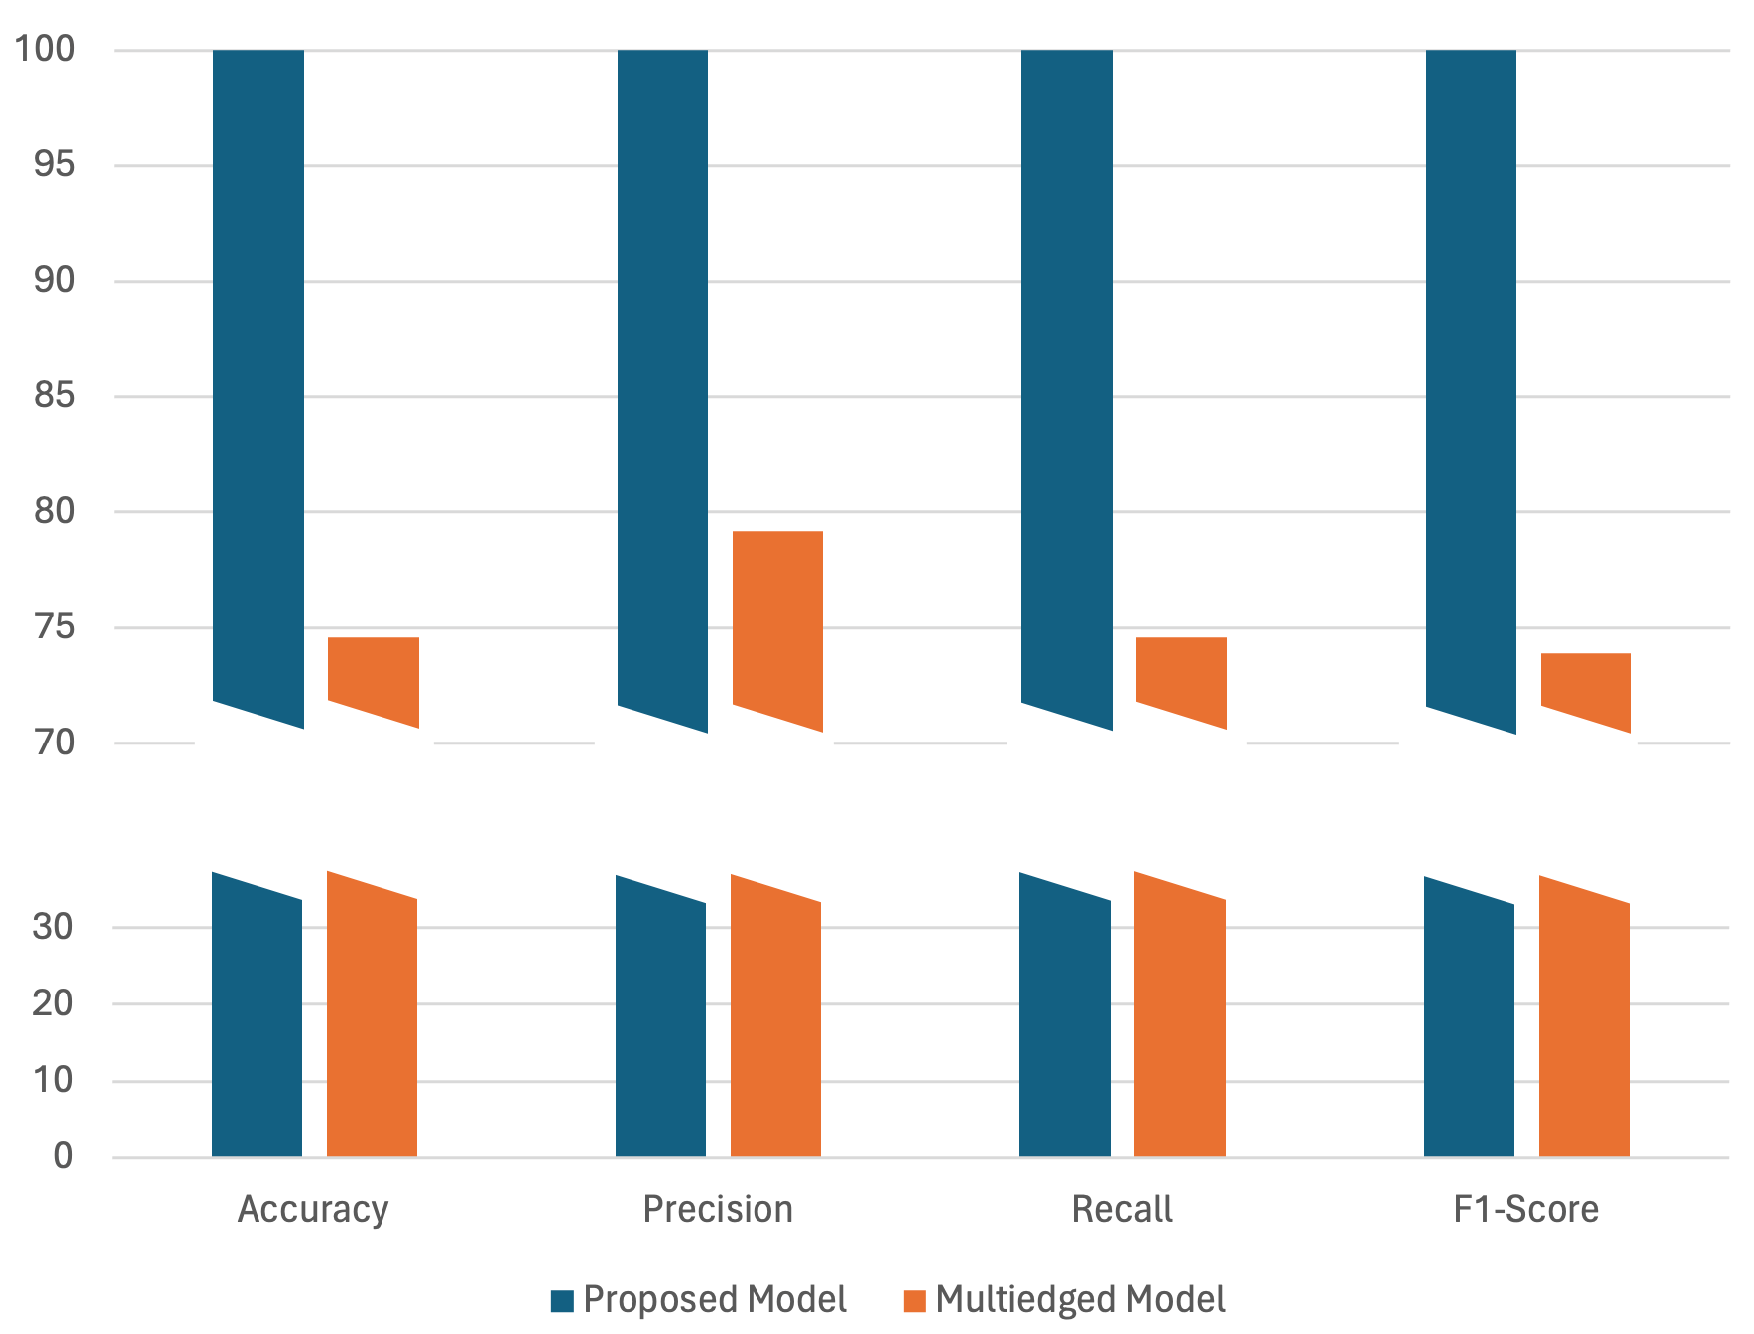
The comparative analysis of the proposed model against the state-of-the-art [11] on the Mirai dataset is illustrated in Figure 9. The performance metrics from the comparative analysis distinctly highlight the superior capabilities of the proposed model in handling binary classification tasks, particularly in the context of detecting sequential attacks. With near-perfect scores across accuracy, precision, recall, and F1-score (all at 99.99%), the proposed model demonstrates exceptional performance in correctly identifying and classifying both benign and malicious activities with minimal error. This contrasts sharply with the multi-edged model, which presents much lower scores—accuracy at 74.58%, precision at 79.17%, recall also at 74.58%, and F1-score of 73.88%. This underscores the effectiveness of the proposed model’s use of time-sequential graphs and GatedGraphConv layers. These techniques enable the proposed model not only to capture the structural and temporal dynamics of the data but also to maintain high sensitivity and specificity in its predictions, thus offering a significant advancement in detecting complex, time-sequenced malicious activities. In the proposed framework, Figure 10 and Figure 11 provide a concise overview of the model’s training behavior on the Mirai dataset. Figure 10 displays a rapid attainment of peak performance, indicating the model’s effectiveness in quickly adapting to the patterns within the dataset. Figure 11 shows a big drop in errors at the start, but this improvement slows down over time, suggesting that more training does not help after a certain point.
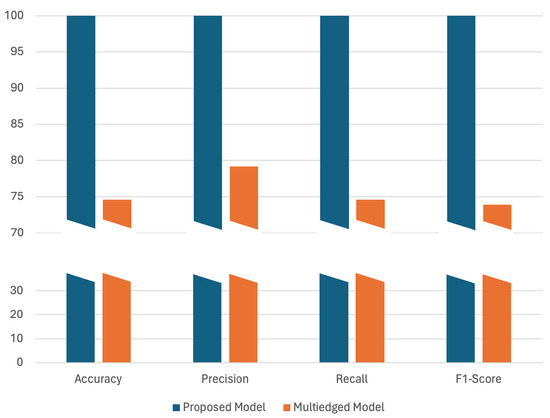
Figure 9.
Performance evaluation of the proposed GGCN with another state-of-the-art GNN model on the Mirai dataset. The y-axis is divided into two segments: the lower segment (up to 30) shows regions of similar performance between the models, and the upper segment (starting from 70) employs a finer scale to detail minor yet significant performance differences, emphasizing where one model outperforms the other.
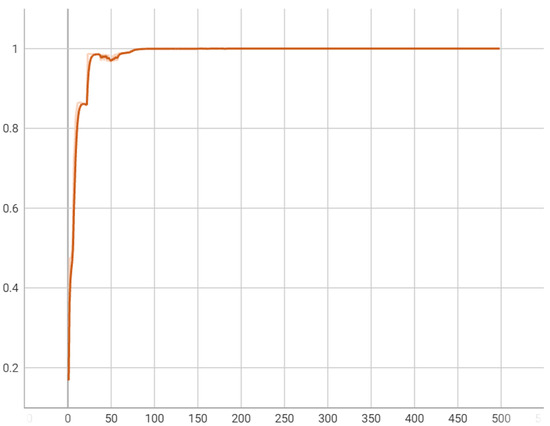
Figure 10.
Accuracy over training iterations: Progression of the proposed model’s accuracy over the training iterations, indicative of the model’s effective learning and pattern recognition capabilities.
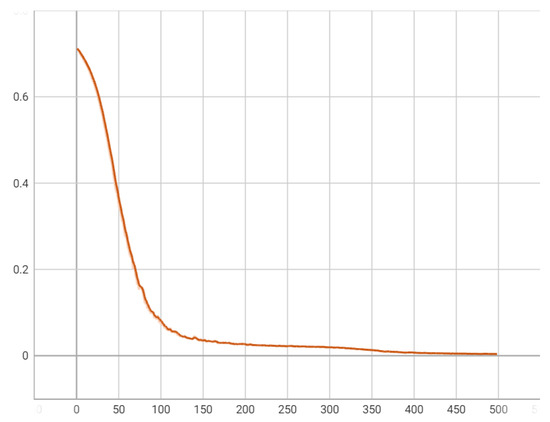
Figure 11.
Error rate over training iterations: Illustrates the sharp decline in the model’s error rate during the training phase, highlighting the model’s robust adaptation and minimal loss in advanced training stages.
The confusion matrix displayed in Figure 12 demonstrates the high performance of a binary classifier with an accuracy of 99.99%. The top-left cell shows that all negative predictions were correct, while the bottom-right cell reveals almost perfect accuracy in predicting positive cases. Both the top-right and bottom-left cells show very low values, indicating an exceptionally low rate of incorrect predictions. Specifically, the model rarely misclassified negative cases as positive and vice versa, highlighting its effective and reliable distinction between the two classes in this classification task.

Figure 12.
Confusion matrix: The matrix visualizes the performance of the classifier on Mirai dataset.
The comparative analysis of the proposed model and the multi-edged model on the BoT IoT and Mirai datasets highlights distinct performance dynamics. While the performance differences on the BoT IoT dataset remain marginal, underscoring both models’ capacity to handle significant class imbalance and a complex array of attack types, the latest results from the Mirai dataset accentuate the proposed model’s superior performance. This dataset, characterized by more balanced class distribution and predominantly flooding attacks, aligns well with the proposed model’s strengths.
The architecture of the proposed model, which adeptly handles time-sequential data, proves especially effective in environments like the Mirai dataset. It captures temporal dynamics and patterns over time with high accuracy, which is crucial for detecting progressive behaviors typical of flooding attacks. This ability not only enhances its predictive accuracy but also demonstrates its specific applicability to scenarios where understanding attack sequences is vital to accurate classification. In contrast, the less pronounced benefits in the BoT IoT dataset suggest that while the model copes with complex data and class imbalance, the advantage of its sequential pattern capture is somewhat mitigated by the overwhelming challenges posed by extreme class distribution. These insights underscore the necessity for further refinement of the model’s capabilities. An enhanced focus on optimizing its performance in highly imbalanced and complex environments will ensure that it remains effective across a broader range of operational contexts. This ongoing development is crucial to adapt the model to diverse and challenging scenarios, ensuring robust performance regardless of dataset variability.
4.4.2. Multiclass Classification Results
In this subsection, we will evaluate the performance of our proposed model on two datasets characterized by bot-like behaviors, with a specific focus on multi-classification results.
We showcase the performance of the proposed model as a multi-classifier on the BoT and Mirai datasets across various metrics in Table 4. The comparative analysis highlights the proposed model’s overall performance as a multi-classifier across different operational contexts. For the BoT IoT dataset, the model achieves high performance metrics, with an accuracy of 98.86%, precision of 98.95%, F1-score of 98.88%, and recall of 98.86%, alongside a low FAR of 0.0114. Conversely, in the Mirai dataset, the model exhibits lower effectiveness, with accuracy at 76.70%, precision at 90.02%, F1-score at 81.70%, and recall also at 76.70%, with a notably higher FAR of 0.2330.
Table 4.
Performance evaluation of the proposed GGCN as a multi-classifier.
The critical analysis of the proposed model’s performance across different datasets, and the observed disparity when used as a multi-classifier compared to a binary classifier, offers significant insights into its operational capabilities and limitations. In binary classification, the model has demonstrated high accuracy and efficiency, primarily due to the simplicity of distinguishing between only two classes. This task allows for more straightforward learning and decision-making processes, often leading to higher performance metrics due to the clear demarcation between the target categories. In contrast, the performance disparity observed when the model is applied as a multi-classifier on different datasets such as BoT IoT and Mirai can be attributed to several factors inherent to multiclass classification challenges. First, the complexity of handling multiple classes increases the difficulty of establishing accurate and distinct decision boundaries. Each additional class introduces variability and potential overlaps in feature space, complicating the model’s training and predictive accuracy. This is particularly evident in the Mirai dataset results, where a lower performance metric suggests the model struggles with the dataset’s broader range of attack types and their nuanced signatures. Additionally, the amount of training data available for each class in multiclass settings significantly influence the model’s ability to generalize across new, unseen examples. The inherent complexity of multiclass classification also raises the likelihood of error propagation, where an error in classifying one class correctly can affect the overall accuracy more severely than in binary classification.
The future scope for enhancing the proposed model’s performance in multiclass classification settings involves several strategic initiatives. Key areas of focus include implementing advanced data augmentation strategies tailored for graph data, such as edge modification, node feature smoothing, or subgraph sampling, which can be instrumental in addressing class imbalance and enhancing the robustness of the model. Additionally, incorporating advanced GNN architectures, e.g., GATs or dynamic GNNs, which adapt to evolving graph structures, could significantly improve the model’s ability to generalize across diverse datasets and complex classification scenarios. These advancements will aim to leverage the unique capabilities of GNNs to refine the model’s performance, ensuring its efficacy and scalability in handling sophisticated multiclass classification tasks.
5. Conclusions
This paper presents a sophisticated intrusion detection model tailored for botnet detection in IoT network environments. By leveraging a novel GGCN architecture combined with sequential analysis, this model effectively captures and analyzes the temporal dynamics of network traffic, making it highly capable of detecting and responding to dynamic cyber threats. The model not only outperforms traditional GNN-based state-of-the-art approaches across all performance metrics as a binary classifier but also demonstrates remarkable adaptability to the unique challenges of sequential attacks in IoT environments. Extensive evaluations confirm that the proposed model provides a robust and efficient solution for improving the security and resilience of IoT networks. Future research will focus on enhancing the model’s capabilities in multiclass classification tasks, which remains an area with room for improvement. This study contributes significantly to the advancement of network security technologies, setting the stage for future research aimed at evolving these systems to keep pace with the rapidly changing landscape of cyber threats in an interconnected world.
Author Contributions
Conceptualization, T.A. and X.W.; methodology, T.A. and X.W.; software, T.A.; validation, W.N. and G.Y.; formal analysis, W.N. and G.Y.; investigation, T.A., X.W., W.N. and G.Y.; writing—original draft preparation, T.A. and X.W.; writing—review and editing, W.N., G.Y., R.P.L. and R.B.; visualization, T.A. and X.W.; supervision, R.P.L. and R.B. All authors have read and agreed to the published version of the manuscript.
Funding
This research received no external funding.
Data Availability Statement
Data is contained within the article.
Conflicts of Interest
The authors declare no conflicts of interest.
References
- Cisco. Cisco Annual Internet Report (2018–2023). 2020. Available online: https://www.cisco.com/c/en/us/solutions/collateral/executive-perspectives/annual-internet-report/white-paper-c11-741490.html (accessed on 9 March 2020).
- Frustaci, M.; Pace, P.; Aloi, G.; Fortino, G. Evaluating critical security issues of the IoT world: Present and future challenges. IEEE Internet Things J. 2018, 5, 2483–2495. [Google Scholar] [CrossRef]
- Lin, J.; Yu, W.; Zhang, N.; Yang, X.; Zhang, H.; Zhao, W. A survey on internet of things: Architecture, enabling technologies, security and privacy, and applications. IEEE Internet Things J. 2017, 4, 1125–1142. [Google Scholar] [CrossRef]
- Yang, Y.; Wu, L.; Yin, G.; Li, L.; Zhao, H. A survey on security and privacy issues in internet-of-things. IEEE Internet Things J. 2017, 4, 1250–1258. [Google Scholar] [CrossRef]
- Benzarti, S.; Triki, B.; Korbaa, O. A survey on attacks in Internet of Things based networks. In Proceedings of the 2017 International Conference on Engineering & MIS (ICEMIS), Monastir, Tunisia, 8–10 May 2017; IEEE: Piscataway, NJ, USA, 2017; pp. 1–7. [Google Scholar]
- Jiang, W. Graph-based deep learning for communication networks: A survey. Comput. Commun. 2022, 185, 40–54. [Google Scholar] [CrossRef]
- Zhou, J.; Cui, G.; Hu, S.; Zhang, Z.; Yang, C.; Liu, Z.; Wang, L.; Li, C.; Sun, M. Graph neural networks: A review of methods and applications. AI Open 2020, 1, 57–81. [Google Scholar] [CrossRef]
- Mekala, S.H.; Baig, Z.; Anwar, A.; Zeadally, S. Cybersecurity for Industrial IoT (IIoT): Threats, countermeasures, challenges and future directions. Comput. Commun. 2023, 208, 294–320. [Google Scholar] [CrossRef]
- Gelenbe, E.; Nakip, M. Traffic Based Sequential Learning during Botnet Attacks to Identify Compromised IoT Devices. IEEE Access 2022, 10, 126536–126549. [Google Scholar] [CrossRef]
- Daneshgar, F.F.; Abbaspour, M. A two-phase sequential pattern mining framework to detect stealthy P2P botnets. J. Inf. Secur. Appl. 2020, 55, 102645. [Google Scholar] [CrossRef]
- Altaf, T.; Wang, X.; Ni, W.; Yu, G.; Liu, R.P.; Braun, R. A new concatenated Multigraph Neural Network for IoT intrusion detection. Internet Things 2023, 22, 100818. [Google Scholar] [CrossRef]
- Altaf, T.; Wang, X.; Ni, W.; Liu, R.P.; Braun, R. NE-GConv: A lightweight node edge graph convolutional network for intrusion detection. Comput. Secur. 2023, 130, 103285. [Google Scholar] [CrossRef]
- Amin, M.; Tanveer, T.A.; Tehseen, M.; Khan, M.; Khan, F.A.; Anwar, S. Static malware detection and attribution in android byte-code through an end-to-end deep system. Future Gener. Comput. Syst. 2020, 102, 112–126. [Google Scholar] [CrossRef]
- Sahu, S.K.; Mohapatra, D.P.; Rout, J.K.; Sahoo, K.S.; Pham, Q.V.; Dao, N.N. A LSTM-FCNN based multi-class intrusion detection using scalable framework. Comput. Electr. Eng. 2022, 99, 107720. [Google Scholar] [CrossRef]
- Alazab, M. A discrete time-varying greywolf IoT botnet detection system. Comput. Commun. 2022, 192, 405–416. [Google Scholar] [CrossRef]
- Rajasekaran, P.; Magudeeswaran, V. Malicious attacks detection using GRU-BWFA classifier in pervasive computing. Biomed. Signal Process. Control 2023, 79, 104219. [Google Scholar] [CrossRef]
- Tam, P.; Ros, S.; Song, I.; Kang, S.; Kim, S. A Survey of Intelligent End-to-End Networking Solutions: Integrating Graph Neural Networks and Deep Reinforcement Learning Approaches. Electronics 2024, 13, 994. [Google Scholar] [CrossRef]
- Esmaeili, B.; Azmoodeh, A.; Dehghantanha, A.; Srivastava, G.; Karimipour, H.; Lin, C.-W. A GNN-Based Adversarial Internet of Things Malware Detection Framework for Critical Infrastructure: Studying Gafgyt, Mirai and Tsunami Campaigns. IEEE Internet Things J. 2023, 1, 1. [Google Scholar] [CrossRef]
- Lo, W.W.; Layeghy, S.; Sarhan, M.; Gallagher, M.; Portmann, M. E-GraphSAGE: A Graph Neural Network based Intrusion Detection System for IoT. In Proceedings of the NOMS 2022—2022 IEEE/IFIP Network Operations and Management Symposium, Budapest, Hungary, 25–29 April 2022; pp. 1–9. [Google Scholar] [CrossRef]
- Pujol-Perich, D.; Suarez-Varela, J.; Cabellos-Aparicio, A.; Barlet-Ros, P. Unveiling the Potential of Graph Neural Networks for Robust Intrusion Detection. SIGMETRICS Perform. Eval. Rev. 2022, 49, 111–117. [Google Scholar] [CrossRef]
- Protogerou, A.; Papadopoulos, S.; Drosou, A.; Tzovaras, D.; Refanidis, I. A graph neural network method for distributed anomaly detection in IoT. Evol. Syst. 2021, 12, 19–36. [Google Scholar] [CrossRef]
- Yang, Y.; Wang, L. LGANet: Local Graph Attention Network for Peer-to-Peer Botnet Detection. In Proceedings of the 2021 3rd International Conference on Advances in Computer Technology, Information Science and Communication, CTISC 2021, Shanghai, China, 23–25 April 2021; pp. 31–36. [Google Scholar] [CrossRef]
- Mitra, S.; Chakraborty, T.; Neupane, S.; Piplai, A.; Mittal, S. Use of Graph Neural Networks in Aiding Defensive Cyber Operations. arXiv 2024, arXiv:2401.05680. [Google Scholar] [CrossRef]
- Zhou, J.; Xu, Z.; Rush, A.M.; Yu, M. Automating Botnet Detection with Graph Neural Networks. In Proceedings of the AutoML for Networking and Systems Workshop of MLSys 2020 Conference, Austin, TX, USA, 2–4 March 2020. [Google Scholar]
- Zhu, X.; Zhang, Y.; Zhang, Z.; Guo, D.; Li, Q.; Li, Z. Interpretability Evaluation of Botnet Detection Model based on Graph Neural Network. In Proceedings of the IEEE INFOCOM 2022—IEEE Conference on Computer Communications Workshops (INFOCOM WKSHPS), New York, NY, USA, 2–5 May 2022; pp. 1–6. [Google Scholar] [CrossRef]
- Lo, W.W.; Kulatilleke, G.; Sarhan, M.; Layeghy, S.; Portmann, M. XG-BoT: An explainable deep graph neural network for botnet detection and forensics. Internet Things 2023, 22, 100747. [Google Scholar] [CrossRef]
- Shang, W.; Sohn, K.; Almeida, D.; Lee, H. Understanding and improving convolutional neural networks via concatenated rectified linear units. In Proceedings of the 33rd International Conference on Machine Learning, New York, NY, USA, 19–24 June 2016; Volume 5, pp. 3276–3284. [Google Scholar]
- Srivastava, N.; Hinton, G.; Sutskever, I.; Krizhevsky, A.; Salakhutdinov, R. Dropout: A Simple Way to Prevent Neural Networks from Overfitting. J. Mach. Learn. Res. 2014, 299, 345–350. [Google Scholar] [CrossRef]
- Collobert, R.; Bengio, S. Links between Perceptrons, MLPs and SVMs. In Proceedings of the ICML ’04: Proceedings of the Twenty-First International Conference on Machine Learning, New York, NY, USA, 4–8 July 2004; p. 23. [Google Scholar] [CrossRef]
- Koroniotis, N.; Moustafa, N.; Sitnikova, E.; Turnbull, B.P. Towards the Development of Realistic Botnet Dataset in the Internet of Things for Network Forensic Analytics: Bot-IoT Dataset. Future Gener. Comput. Syst. 2019, 100, 779–796. [Google Scholar] [CrossRef]
- Kalupahana Liyanage, K.S.; Divakaran, D.M.; Singh, R.P.; Gurusamy, M. NSS Mirai Dataset; IEEE Dataport: Piscataway, NJ, USA, 2020. [Google Scholar] [CrossRef]


Disclaimer/Publisher’s Note: The statements, opinions and data contained in all publications are solely those of the individual author(s) and contributor(s) and not of MDPI and/or the editor(s). MDPI and/or the editor(s) disclaim responsibility for any injury to people or property resulting from any ideas, methods, instructions or products referred to in the content. |
© 2024 by the authors. Licensee MDPI, Basel, Switzerland. This article is an open access article distributed under the terms and conditions of the Creative Commons Attribution (CC BY) license (https://creativecommons.org/licenses/by/4.0/).