Article

Fault-Tolerant Three-Vector Model-Predictive-Control-Based Grid-Connected Control Strategy for Offshore Wind Farms

1
State Centre for Engineering Research, Ministry of Education for Renewable Energy Generation and Grid-Connected Control (Xinjiang University), Urumqi 830047, China
2
State Grid Xinjiang Integrated Energy Service Company Limited, Urumqi 830011, China
*
Author to whom correspondence should be addressed.
Electronics 2024, 13(12), 2316; https://doi.org/10.3390/electronics13122316
Submission received: 8 May 2024 / Revised: 4 June 2024 / Accepted: 12 June 2024 / Published: 13 June 2024

Abstract

:
In the conventional dual-loop vector control strategy of Voltage Source Converter-based High Voltage Direct Current (VSC-HVDC) systems employed in offshore wind farms, challenges such as complex PI parameter-tuning and slow response speed exist. Furthermore, a single-phase bridge-arm fault in the converter station can lead to a change in system parameters, resulting in the failure of the original control strategy. Hence, this paper proposes a fault-tolerant control strategy for grid-connected offshore wind farms, based on model predictive control (MPC). Firstly, the predictive models for both normal and fault-tolerant states of the grid-side converter station are established based on the system structure of the grid-side converter station and a super-local model. Subsequently, a cost function is constructed using the power error, with the optimization objective set as the value function. This approach allows for accurate prediction of the future switching states of the grid-tied inverter to track the reference power. Finally, a simulation model of the offshore wind power grid system is established in the MATLAB/Simulink (2022a) environment. The results demonstrate that the grid-side converter station can effectively operate in a fault-tolerant manner under the proposed control strategy, thereby enhancing the disturbance resistance and fault-recovery capabilities of the offshore wind VSC-HVDC system.

1. Introduction

China possesses conditions favorable for the extensive development of offshore wind power on a large scale due to its extensive coastline and abundant wind resources of high quality [1]. Furthermore, coastal regions face a scarcity of mineral resources and have witnessed significant economic growth, leading to a substantial demand for electricity. Offshore wind power can conveniently meet this demand by being located nearby [2]. The immense potential for power generation from offshore wind has captured global attention, prompting research and development efforts in offshore wind power. As offshore power generation moves towards large-scale and long-distance deployment, the control challenges associated with grid connection become increasingly vital for both conventional “AC collection–AC transmission” and “AC collection–DC transmission” grid-connected systems [3,4].
With advancements in model predictive control (MPC) techniques, researchers have started exploring the technology’s application in converter control strategies, including those in the field of converter stations. MPC is renowned for its flexibility, decoupling capability, and ability to incorporate constraints, as well as its online optimization capacity, which does not require modulators [5,6,7,8,9]. Recently, MPC has gained widespread acceptance in various areas, such as modular multilevel converters [10], uninterruptible power supplies [11], and neutral-point-clamped converters [12], as well as in other applications. In [13], the authors utilized finite-set MPC (FCS-MPC) in the converter station, eliminating the requirement for modulators. Additionally, they introduced a load current observer to enhance the system’s robustness.
In [14], a model-based current prediction approach is introduced to obtain the reference voltage for control. The reference voltage can be predicted in advance by utilizing the current model, and the optimal voltage vector is determined by identifying the corresponding voltage region. Then, this optimal voltage vector serves as the output of the controller. Low computational complexity is a notable advantage of this approach, which makes it easily implementable in practical applications. In [15], a switching MPC approach is proposed to enhance the fault-response speed and steady-state performance of the system. References [16,17] addressed the conservativeness issue in conventional MPC by introducing multi-step MPC, improving control performance. Reference [18] employed MPC for both the voltage outer loop and the current inner loop to achieve an optimal vector, thereby reducing computational complexity while retaining the benefits of MPC and enhancing control performance.
The traditional model predictive control (MPC) also suffers from latency issues due to the substantial computational load associated with cyclic value function traversal and optimization [7,19,20,21]. As the number of control objectives increases, the computational demands escalate, leading to increased system latency and, consequently, larger control errors, significantly impacting system performance [22].
Many scholars have conducted relevant studies on grid-connection methods for offshore wind power based on the current research achievements. However, the majority of these studies focus on grid-connection control strategies, considering the normal operation or transient fault conditions within wind farms. There exists a relatively limited amount of research on grid-connection control strategies that specifically addresses the common fault scenario of single-phase permanent bridge-arm failure. In this scenario, the grid-side converter station transitions from controlling three-phase current to two-phase fault-tolerant operations.
Based on the analysis above, this study addresses the issue by developing a detailed electromagnetic transient simulation model for offshore wind farms using a dual-end VSC-HVDC system. In this case, a fault-tolerant grid-connection control strategy for offshore wind farms is proposed based on the three-vector power MPC model. Compared to the conventional dual closed-loop control strategy, the fault-tolerant MPC strategy exhibits excellent dynamic performance and robustness to model parameters, which significantly improves the disturbance rejection and fault-recovery capabilities of offshore wind VSC-HVDC grid-connected systems, while reducing the total harmonic distortion (THD) of grid voltage and current during grid integration. The main contributions of this study include the following determinations:
(1)
Replacing the single-vector control used in conventional MPC with three-vector control helps eliminate significant output power fluctuations due to errors between the desired and actual vectors; the replacement thereby enhances control accuracy.
(2)
In the proposed fault-tolerant control, the network-side converter station of the offshore wind farm is managed in the event of a single-phase bridge-arm failure, ensuring the normal grid connection for the offshore wind power source.
The rest of this paper is organized as follows: Section 2 introduces the offshore wind farm grid-connected topology and the control strategy for wind farm-side converter stations. In Section 3, the grid-side converter station fault-tolerant topology and the fault-tolerant model-free predictive control strategy are presented. Section 4 provides simulation results for the proposed schemes. Finally, Section 5 summarizes this paper.

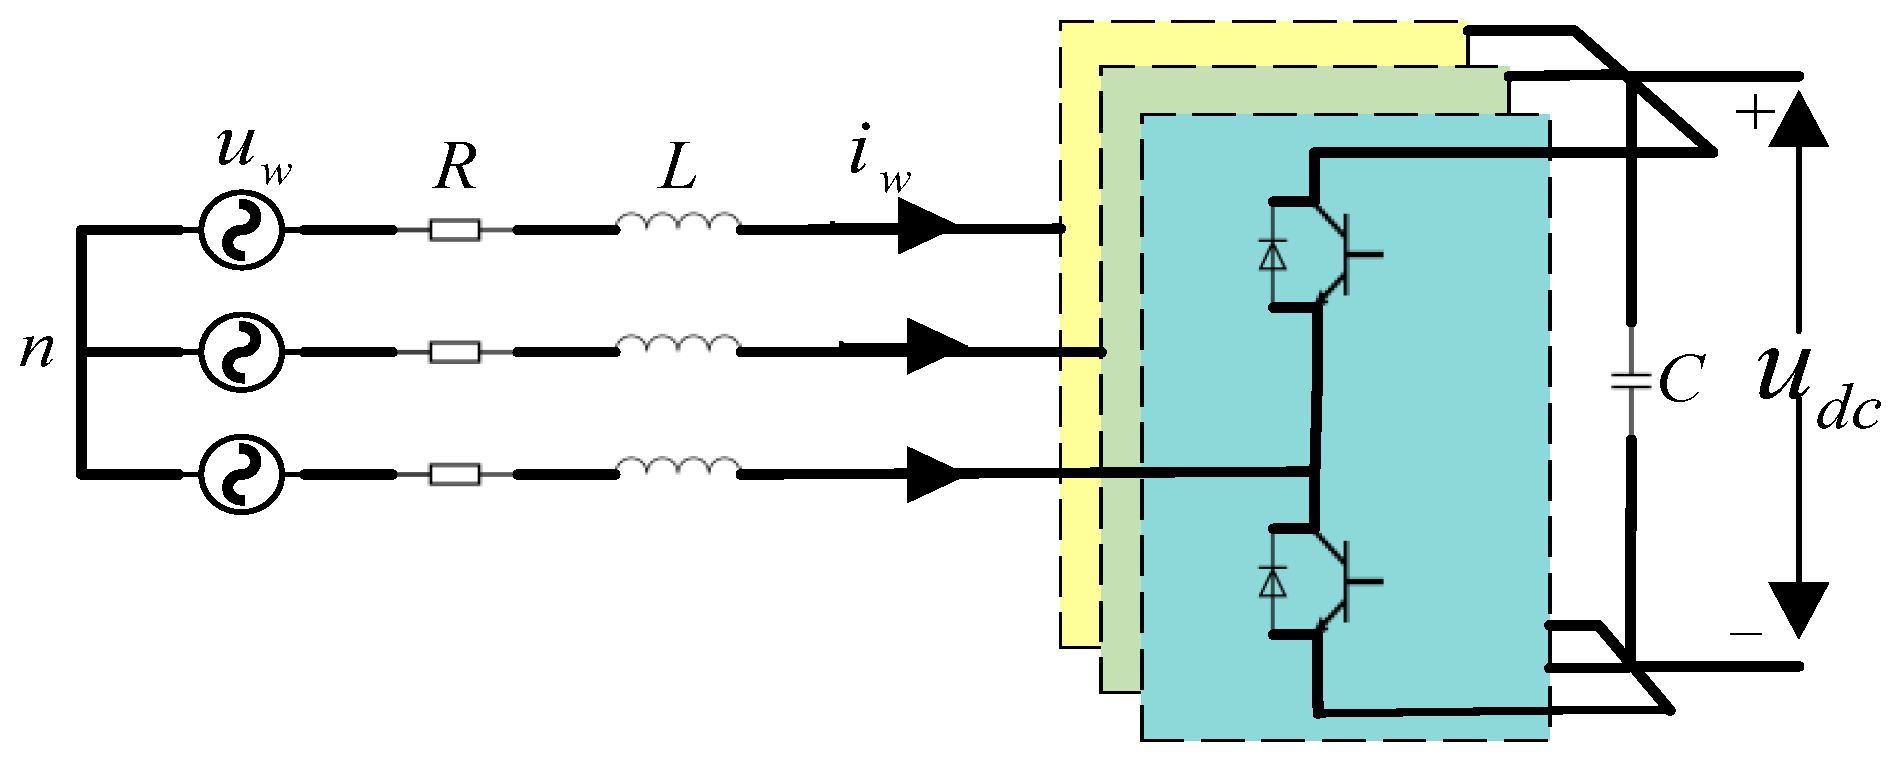
2. Control Strategy for OWF-VSC

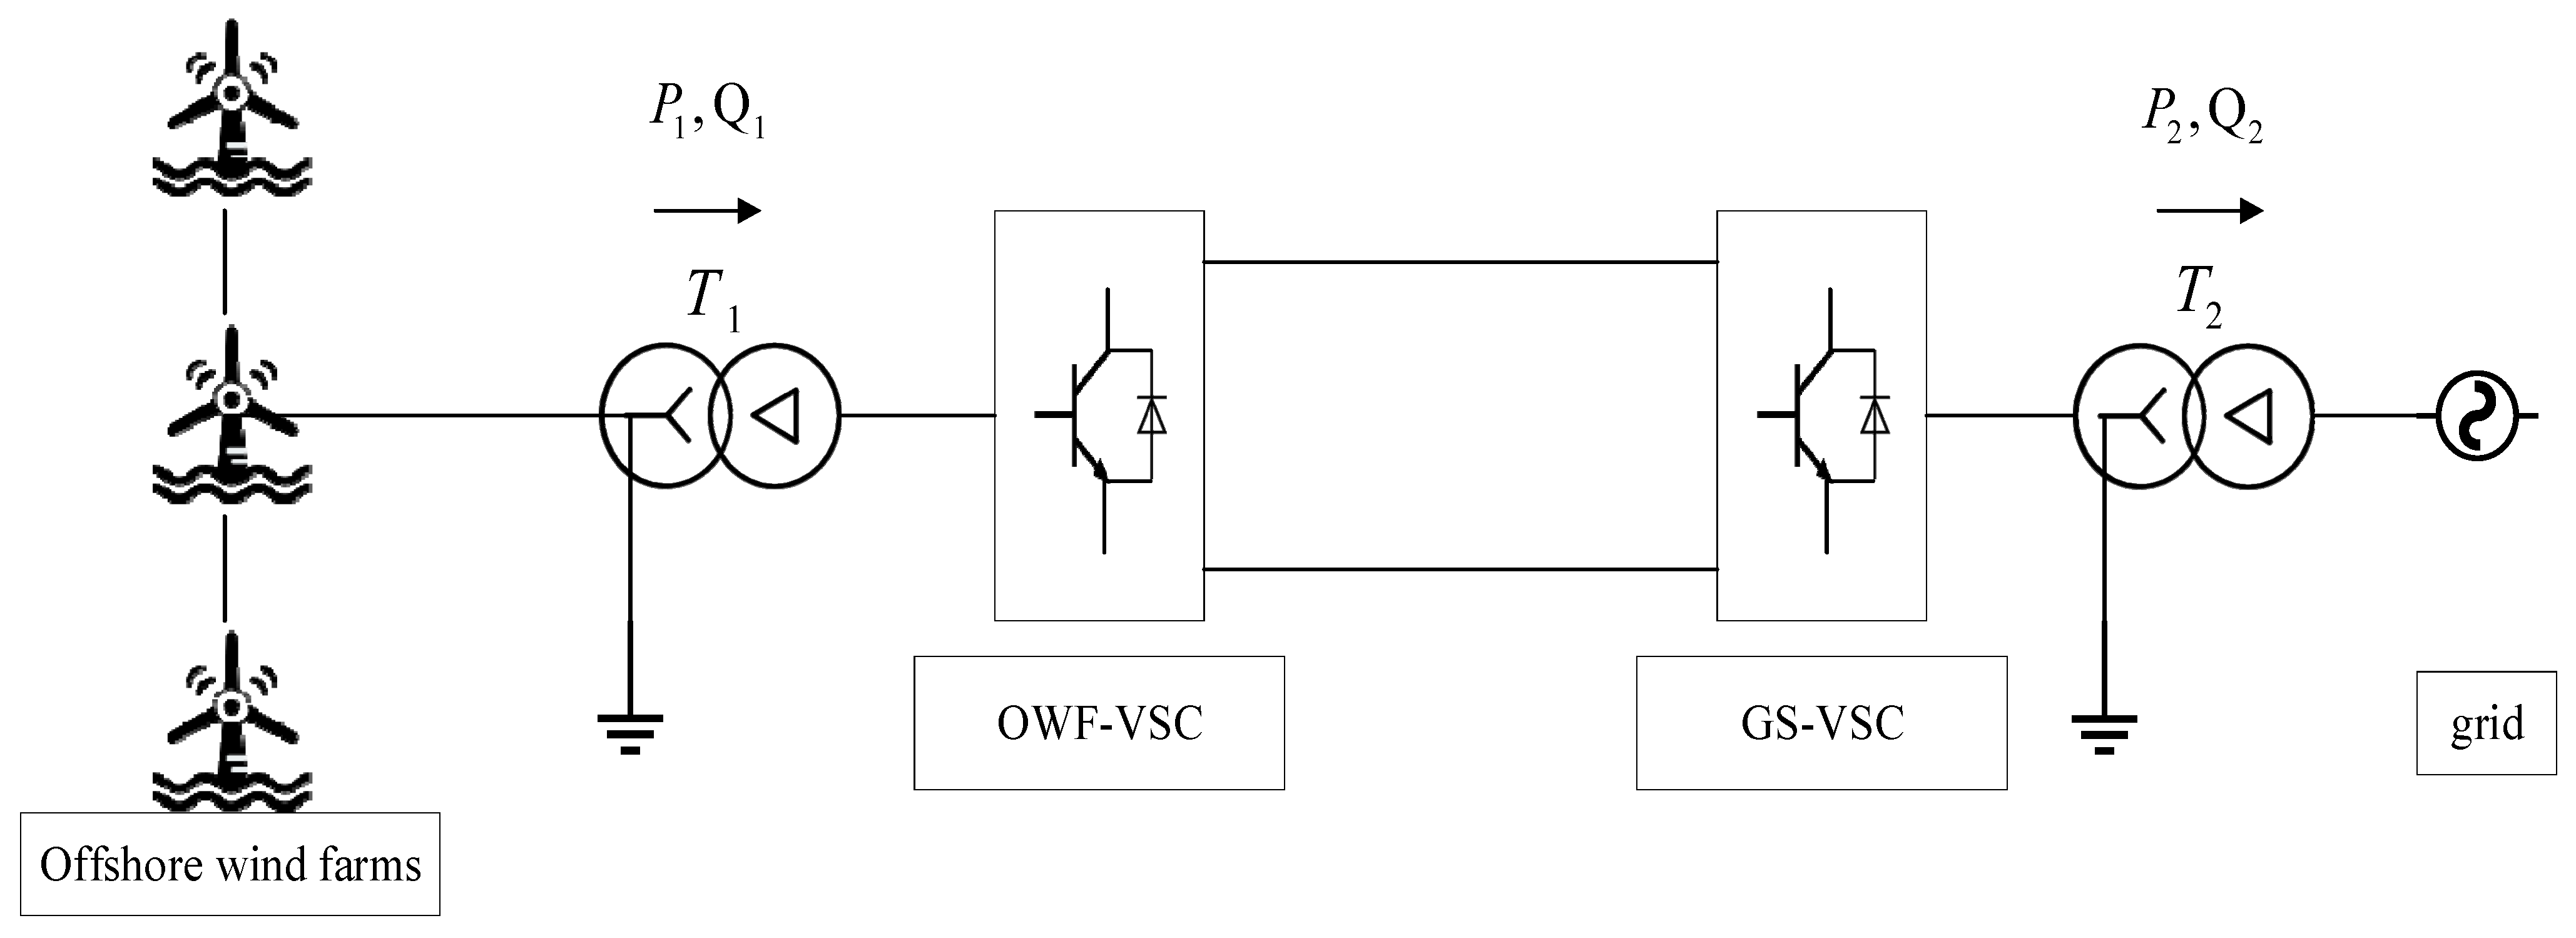
2.1. Basic Framework of the Offshore Wind Farm

The topology of an offshore wind farm connected to the grid through the VSC-HVDC system is illustrated in Figure 1. The system comprises three main components: the offshore wind farm cluster, the VSC-HVDC grid-connected system, and the AC grid. Within the VSC-HVDC system, there are two converters, including a voltage-source converter on the offshore wind farm side (OWF-VSC) and a voltage-source converter on the grid side (GS-VSC), as well as an underwater DC transmission line. Maintaining the power balance within the VSC-HVDC system is crucial to ensuring the grid integration of offshore wind power and the safe operation of the transmission system. Consequently, the primary role of the OWF-VSC is to maintain a constant voltage magnitude and frequency on the offshore wind farm side. The diagram of the OWF is presented in Figure 1.

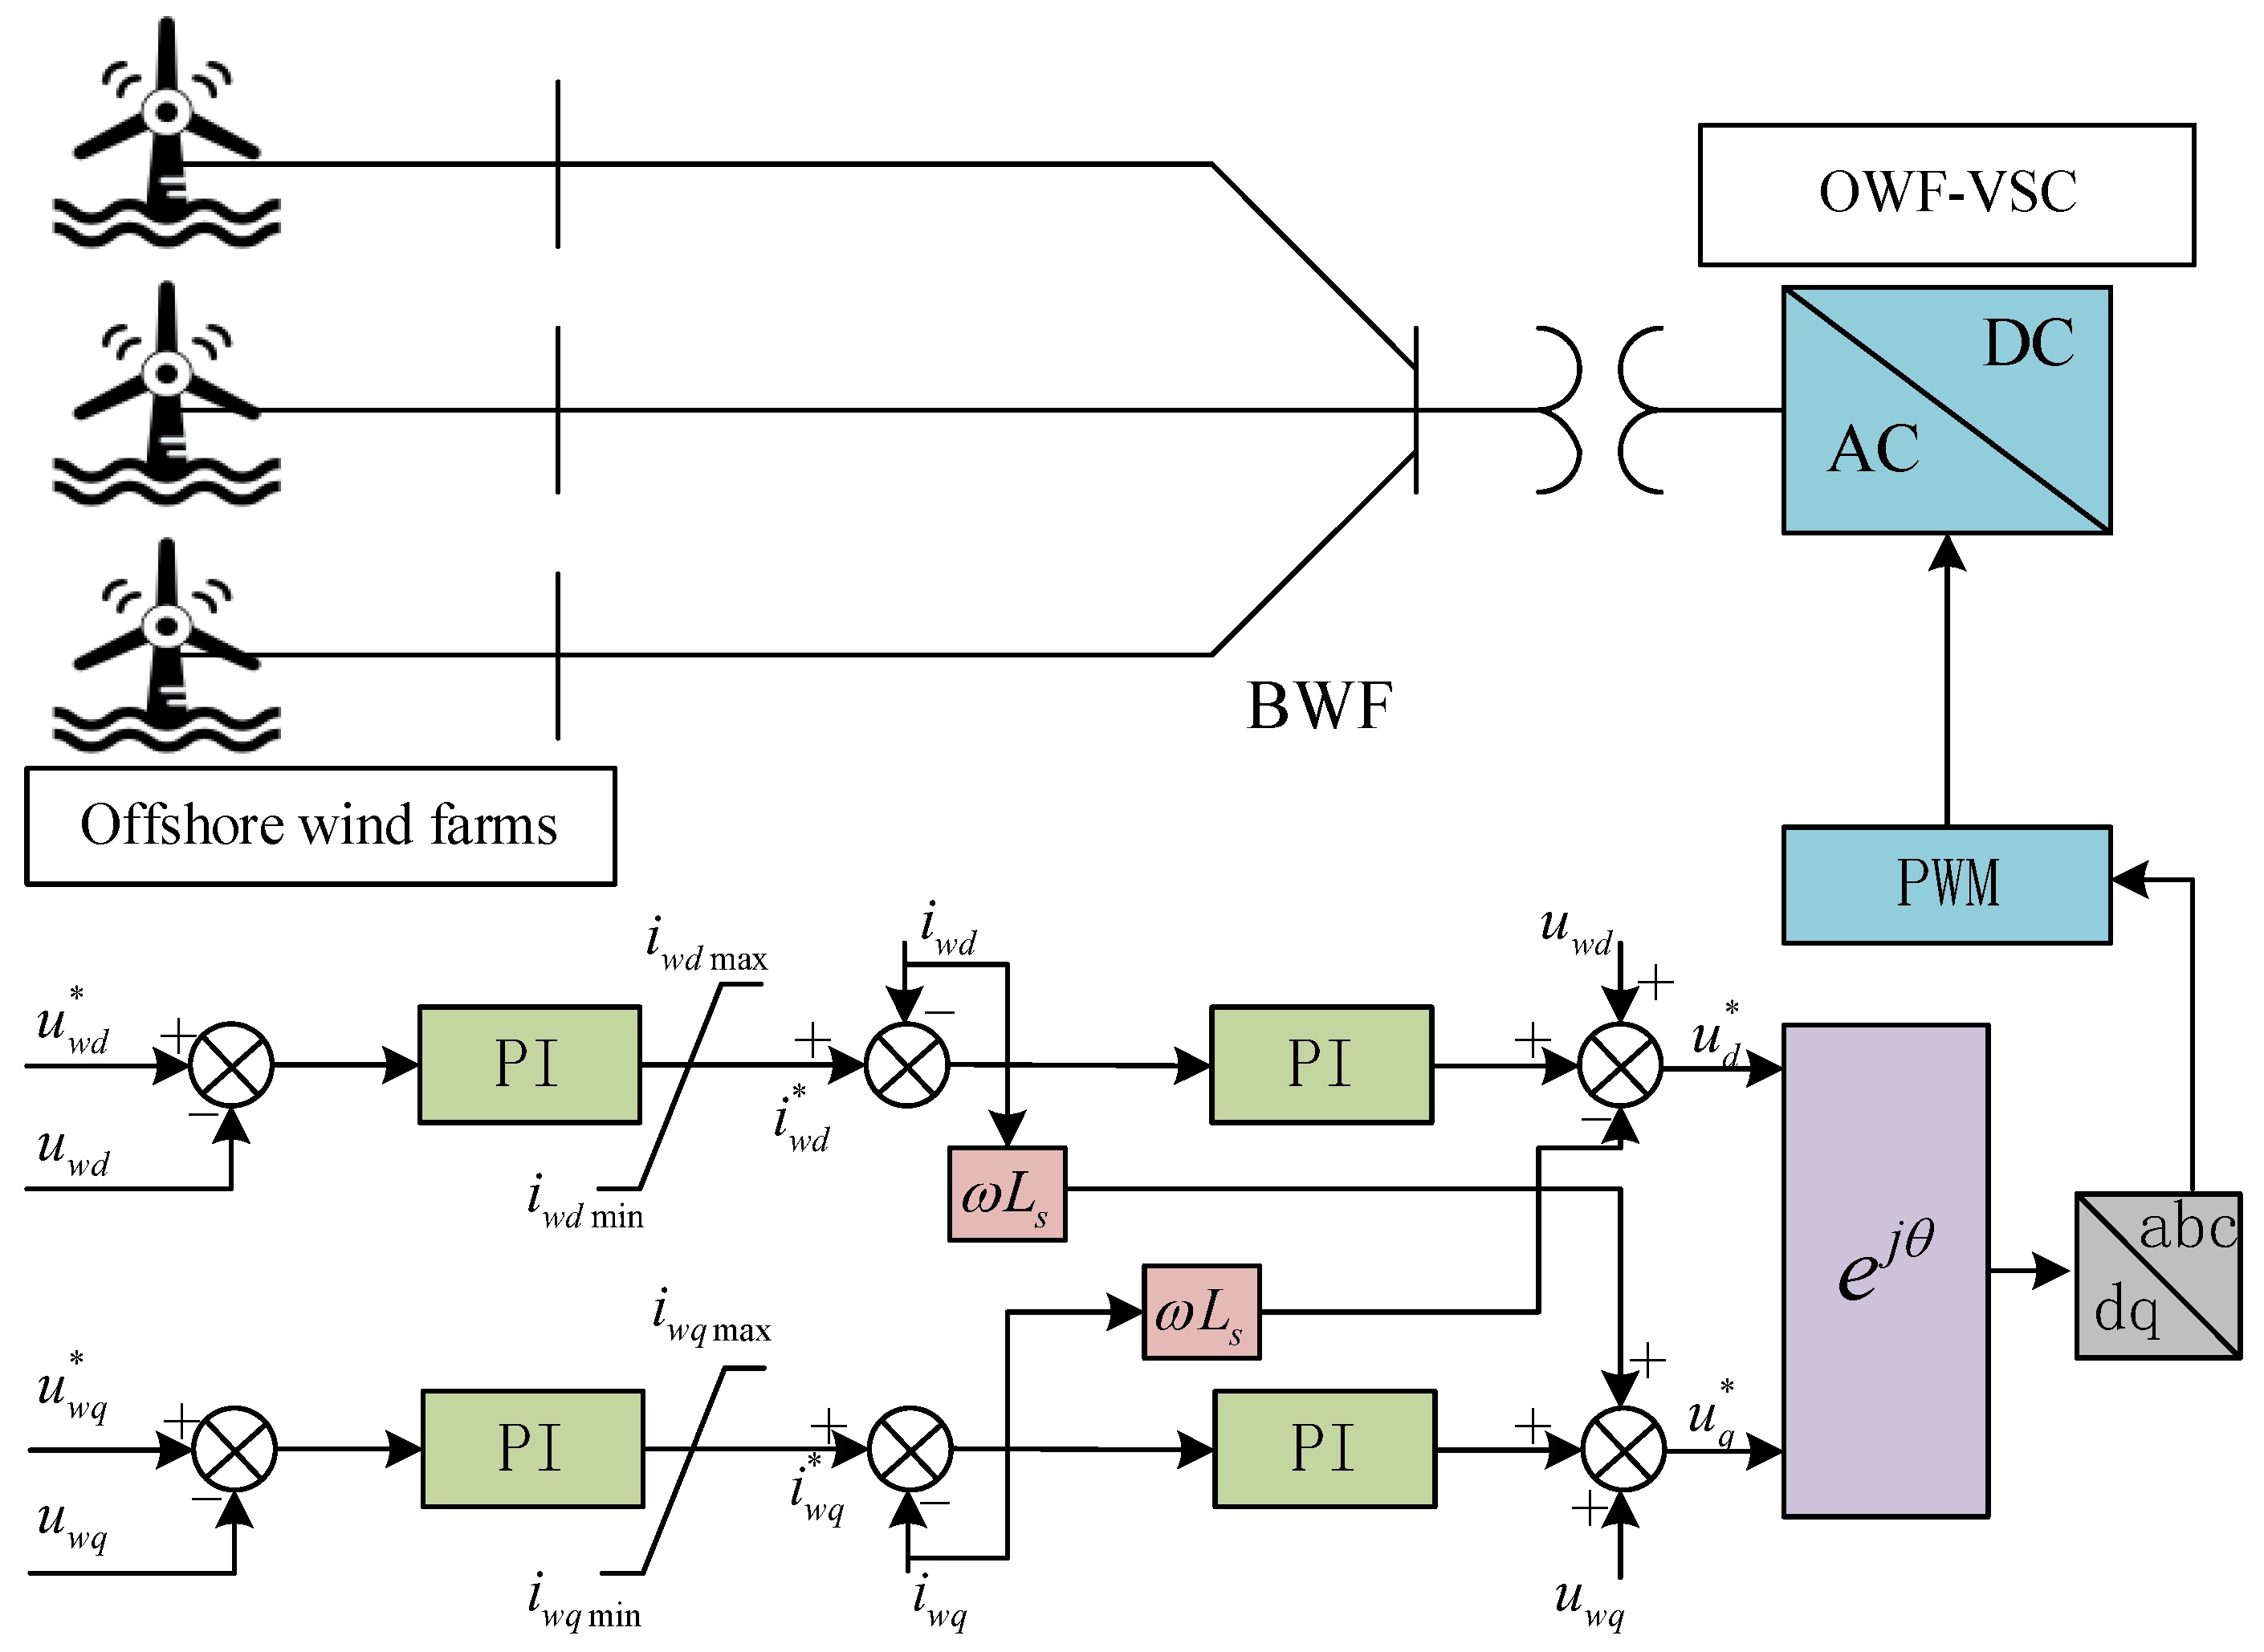
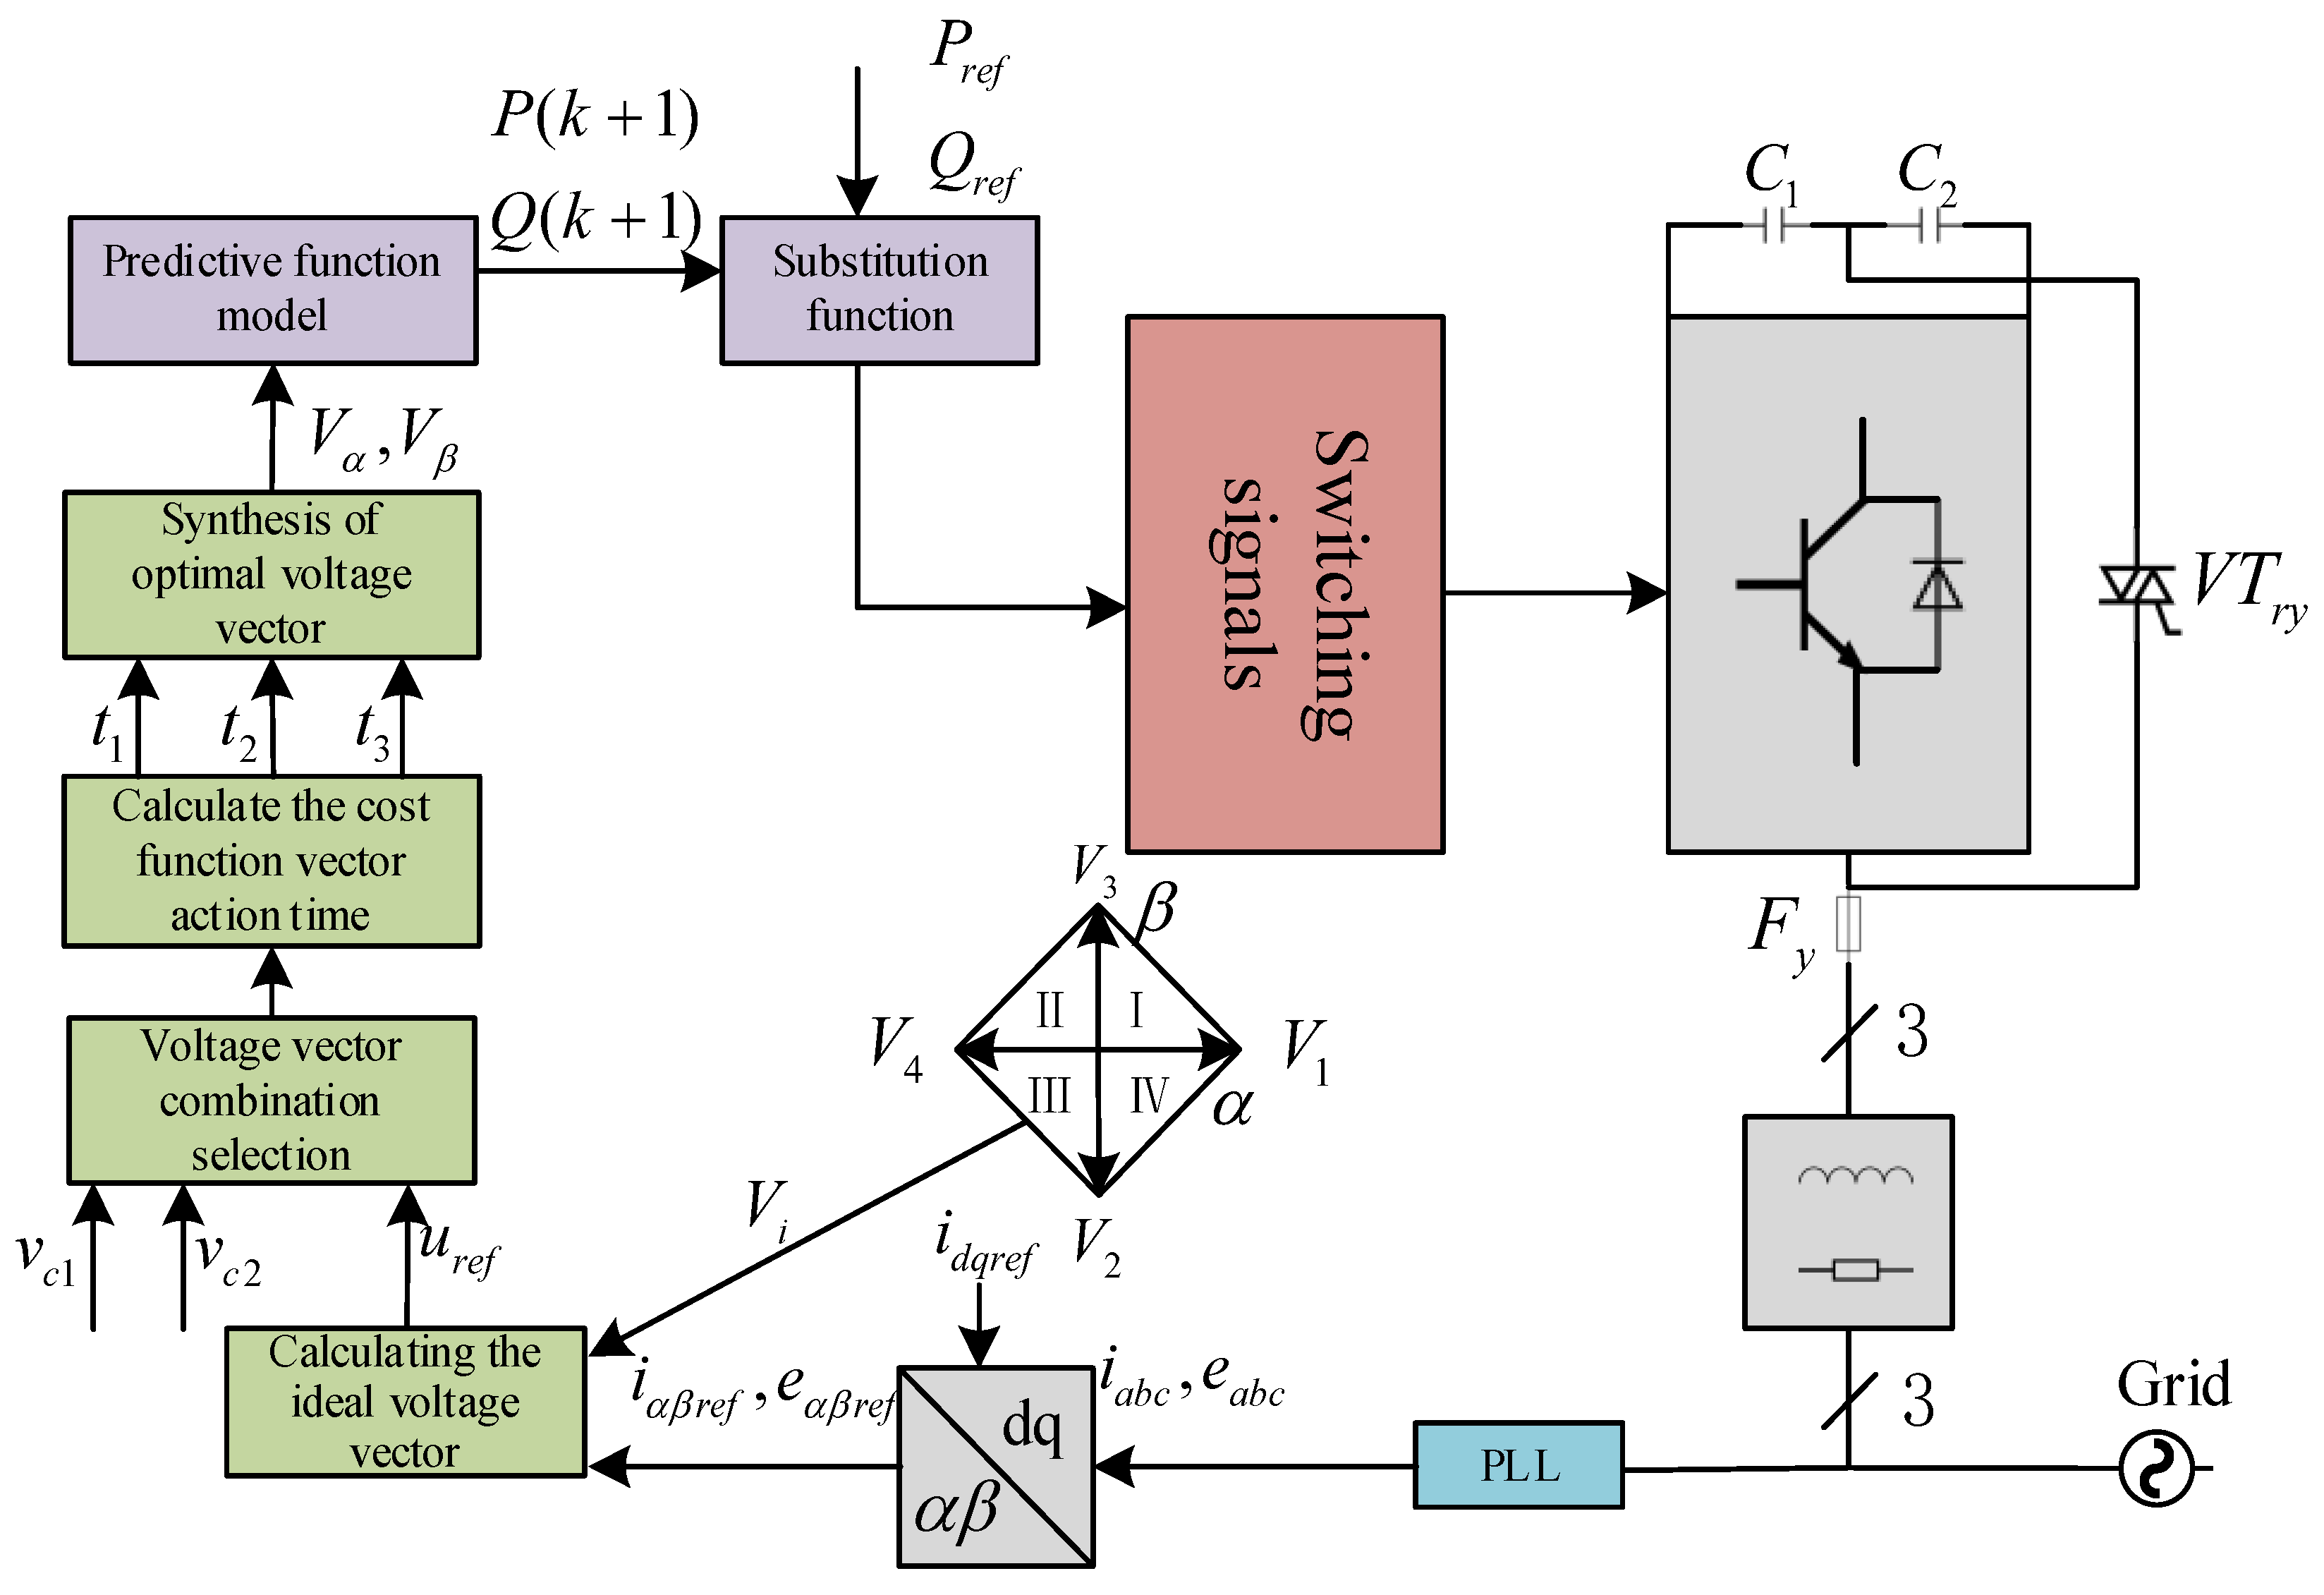
2.2. Control Strategy

The topology diagram of the OWF-VSC is illustrated in Figure 2.
The theoretical model of an OWF-VSC in the d-q coordinate system is given as follows:
L d i w d d t = u w d i w d R + ω s L i w q v w d L d i w q d t = u w q i w q R ω s L i w d v w q C d u d c d t = 3 2 ( S w d i s d + S w q i w q ) i d c
where  u w d  and  u w q  represent the components of the OWF-AC busbar voltage under the d-q axes,  i w d  and  i w q  indicate the components of the OWF-AC busbar current under the d-q axes,  v w d  and  v w q  denote the component of the output voltage of OWF-VSC on the d-q axes, and  S w d  and  S w q  signify the switching function. Moreover,  ω s  is the angular frequency of the grid. Equation (1) indicates that the components of the OWF-VSC’s output current in the d-q axis are coupled with the components of the voltage in the d-q axis.
Therefore, the inner loop adopts the current vector feedforward decoupling control, and the current regulator adopts PI control. The control equation for the offshore wind farm AC side voltage  v w d  and  v w q  can be expressed as follows:
v w d = ( K m 1 + K i 1 s ) ( i d r e f i w d ) + ω L i w q + u w d v w q = ( K m 2 + K i 2 s ) ( i q r e f i w q ) ω L i w d + u w q
where  K m 1  and  K m 2  indicate the proportional adjustment gain of the current inner loop control,  K i 1  and  K i 2  denote the integral adjustment gain, and  i d r e f  and  i q r e f  represent the reference quantities of  i w d  and  i w q , respectively.
On occasion, the q-axis aligns with the A-phase voltage of the grid, namely  U w q = 0 . In this case, the active power (P) and reactive power (Q) are shown below.
P = u w d i w d + u w q i w q = u w d i w d Q = u w d i w d u w q i w q = u w d i w q
Based on the analysis above, the control flowchart of the OWF-VSC is depicted in Figure 3. Control of the amplitude and phase of the grid voltage in offshore wind farms is achieved by setting the d-q axis reference and the synchronous rotation angle reference within the OWF-VSC control system. To simplify the control, the initial phase angle of the offshore wind farm voltage is set to 0, and feedback control is applied only to the magnitudes of the AC system’s d-q axis voltages. The difference between the reference commands of the wind farm AC d-q axis voltage magnitudes and the real-time d-q axis voltage magnitudes undergoes processing using a PI controller to generate a modulation ratio (M), which produces corresponding triggering pulses.

3. Fault-Tolerant Control Strategies for GS-VSC

3.1. Discrete Prediction Model for GS-VSC

The GS-VSC plays a crucial role in connecting the offshore wind power system to the grid, and its excellent control performance is a prerequisite for ensuring the stable grid integration of offshore wind energy. The topology of the fault-tolerant GS-VSC is illustrated in Figure 4, in which the midpoint of the DC capacitor is connected to the three-phase power supply using three bidirectional thyristors  V T r y ( y = a , b , c ) . Moreover, each bridge arm is equipped with a series-connected fast-acting fuse  F y y = a , b , c . Under the normal conditions of GS-VSC operation, the bidirectional thyristors remain open. The modified structure can isolate faults, such as open-circuit or short-circuit faults, in power semiconductors. However, in a single-phase bridge-arm fault, the corresponding fast-acting fuse is activated, interrupting the faulted phase. Simultaneously, the bidirectional thyristor corresponding to the faulted phase activates, restructuring the system into a fault-tolerant configuration, as shown in Figure 4b. This enables the converter to continue operating despite the presence of the fault. The faulted phase is directly connected to the midpoints of the DC capacitors, while the remaining two phases continue normal operation with their respective four switching devices. On the AC side, the connection to the grid is maintained by filtering inductors  L g  and line resistors  R g . To establish a predictive model for grid current, mathematically modeling the fault-tolerant GS-VSC is necessary. Equation (4) represents the state equation of the grid current in the time domain.
L g d i g d t = u e g R i g
where  i g  and  e g  represent the current and voltage of the grid, respectively. Moreover, u indicates the voltage output of the GS-VSC.
The switching function  S x ( x = a , b , c ) , responsible for controlling the switching states of the bridge arms within the fault-tolerant converter, can be defined as follows:
S x = 0 , if the   top   bridge   arm   is   turned   off   , 1 , if the   top   bridge   arm   is   conducting .
The current–voltage space vector expression is:
i u e = 2 3 i a i b i c u a N u b N u c N e a e b e c 1 a a 2
where  a = e j 2 π / 3 . In addition,  u a N u b N , and  u c N  represent the output voltage of the GS-VSC to the neutral point N, respectively. Moreover,  u a N u b N , and  u c N  can be obtained from the product of the switching function  S x  and the DC voltage:
u x N = S x U d c , ( x = a , b , c )
Applying the Clarke transformation, the voltage vectors in αβ coordinates  u α  and  u β  can be obtained, as shown in Table 1.
Assuming a signal sampling period of  T s , the discretization of the grid current derivative using the first-order forward difference method can be expressed as follows:
d i g d t i g ( k + 1 ) i g ( k ) T s
where  i g ( k + 1 )  and  i g ( k )  represent the current values obtained from the (k + 1)th and kth sampling periods, respectively.
The discrete expression of the predicted GS-VSC current can be obtained as follows:
i g ( k + 1 ) = i g ( k ) + T s L g ( u ( k ) R i g ( k ) e g ( k ) )
Δ i g ( k ) = T s L g ( u ( k ) R i g ( k ) e g ( k ) )
where  Δ i g ( k )  indicates the current gradient under the action of vector  u ( k ) , which can be calculated according to the mathematical model of the GS-VSC.
Applying the Clarke transformation, the discrete expression of Equation (9) in the αβ coordinate system is obtained as follows:
i g α ( k + 1 ) i g β ( k + 1 ) = i g α ( k ) i g β ( k ) + T s L g u α ( k ) R g i g α ( k ) e g α ( k ) u β ( k ) R g i g β ( k ) e g β ( k )
According to the instantaneous power theory, the active power P and reactive power Q of the GS-VSC can be determined as follows:
P Q = 3 2 e g α e g β e g β e g α i g α i g β
Assuming that the sampling frequency  T s  is significantly higher than the grid frequency for a balanced grid, the following assumptions can be made.
e g α ( k + 1 ) = e g α ( k ) e g β ( k + 1 ) = e g β ( k )
where  e g α ( k + 1 )  and  e g β ( k + 1 )  are the αβ components of the output grid voltage of the GS-VSC at the moment  t k + 1 , respectively.
The model for predictive power control of the GS-VSC at time  t k + 1  can be obtained as follows:
P ( k + 1 ) Q ( k + 1 ) = P ( k ) Q ( k ) + 3 T s 2 L e g α e g β e g β e g α u α ( k ) e g α R g i g α ( k ) u β ( k ) e g β R g i g β ( k )

3.2. Fault-Tolerant Control Strategy for GS-VSC Based on MPC

The primary objective of the GS-VSC is to regulate and maintain the power balance within the bidirectional VSC-HVDC grid-connected system, ensuring the seamless integration of power generated by offshore wind farms into the grid. Typically, the GS-VSC is controlled using a dual-closed-loop strategy. However, this approach is sensitive to variations in system model parameters, posing challenges in tuning the PI parameters. The dual-closed-loop control strategy also requires decoupling and faces difficulties in achieving optimized control objectives. Thus, this paper proposes a fault-tolerant MPC strategy for the seamless integration of offshore wind farms in VSC-HVDC systems, to overcome the limitations of conventional control strategies.
Traditional model predictive control (MPC) starts the entire control process from time k by sequentially performing operations such as electrical quantity sampling, system Clark transformation, power prediction, and value function traversal, ultimately achieving optimal control effectiveness at time k + 1 within the local region of the value function. However, the iterative traversal optimization of the value function results in significant computational overhead, which increases as control objectives expand. As the computational load increases, system delays lengthen, leading to larger control errors and greatly impacting system performance. Moreover, traditional MPC utilizes only one voltage vector for control within a sampling period, often resulting in errors between the actual required vector and the applied vector, leading to significant output power fluctuations.
To address these challenges, improvements to traditional model predictive control strategies are necessary to reduce computational time and workload while enhancing control accuracy and steady-state performance.
By integrating model predictive control with spatial voltage vectors, the enhanced three-vector MPC strategy significantly reduces computational workload, as compared to traditional MPC, which requires the calculation of seven different voltage vectors to determine optimal switch states. The improved three-vector MPC strategy requires accurate determination of the target voltage vector’s location, enabling a single calculation process that substantially reduces computational overhead. Additionally, the adoption of three-vector control allows for accurate tracking of the target voltage, achieving theoretical control improvements based on the shift from error-based to error-free control processes. To achieve rapid and precise tracking of the provided power reference, a cost function associated with power is formulated as follows, considering both actual power and predicted power.
g M P C = P r e f * P ( k + 1 ) + Q r e f * Q ( k + 1 )
The vector selection principle and spatial vectors for the three-vector model predictive control are depicted in the diagram below (Figure 5).
Taking the target vector in Sector I as an example:
(1)
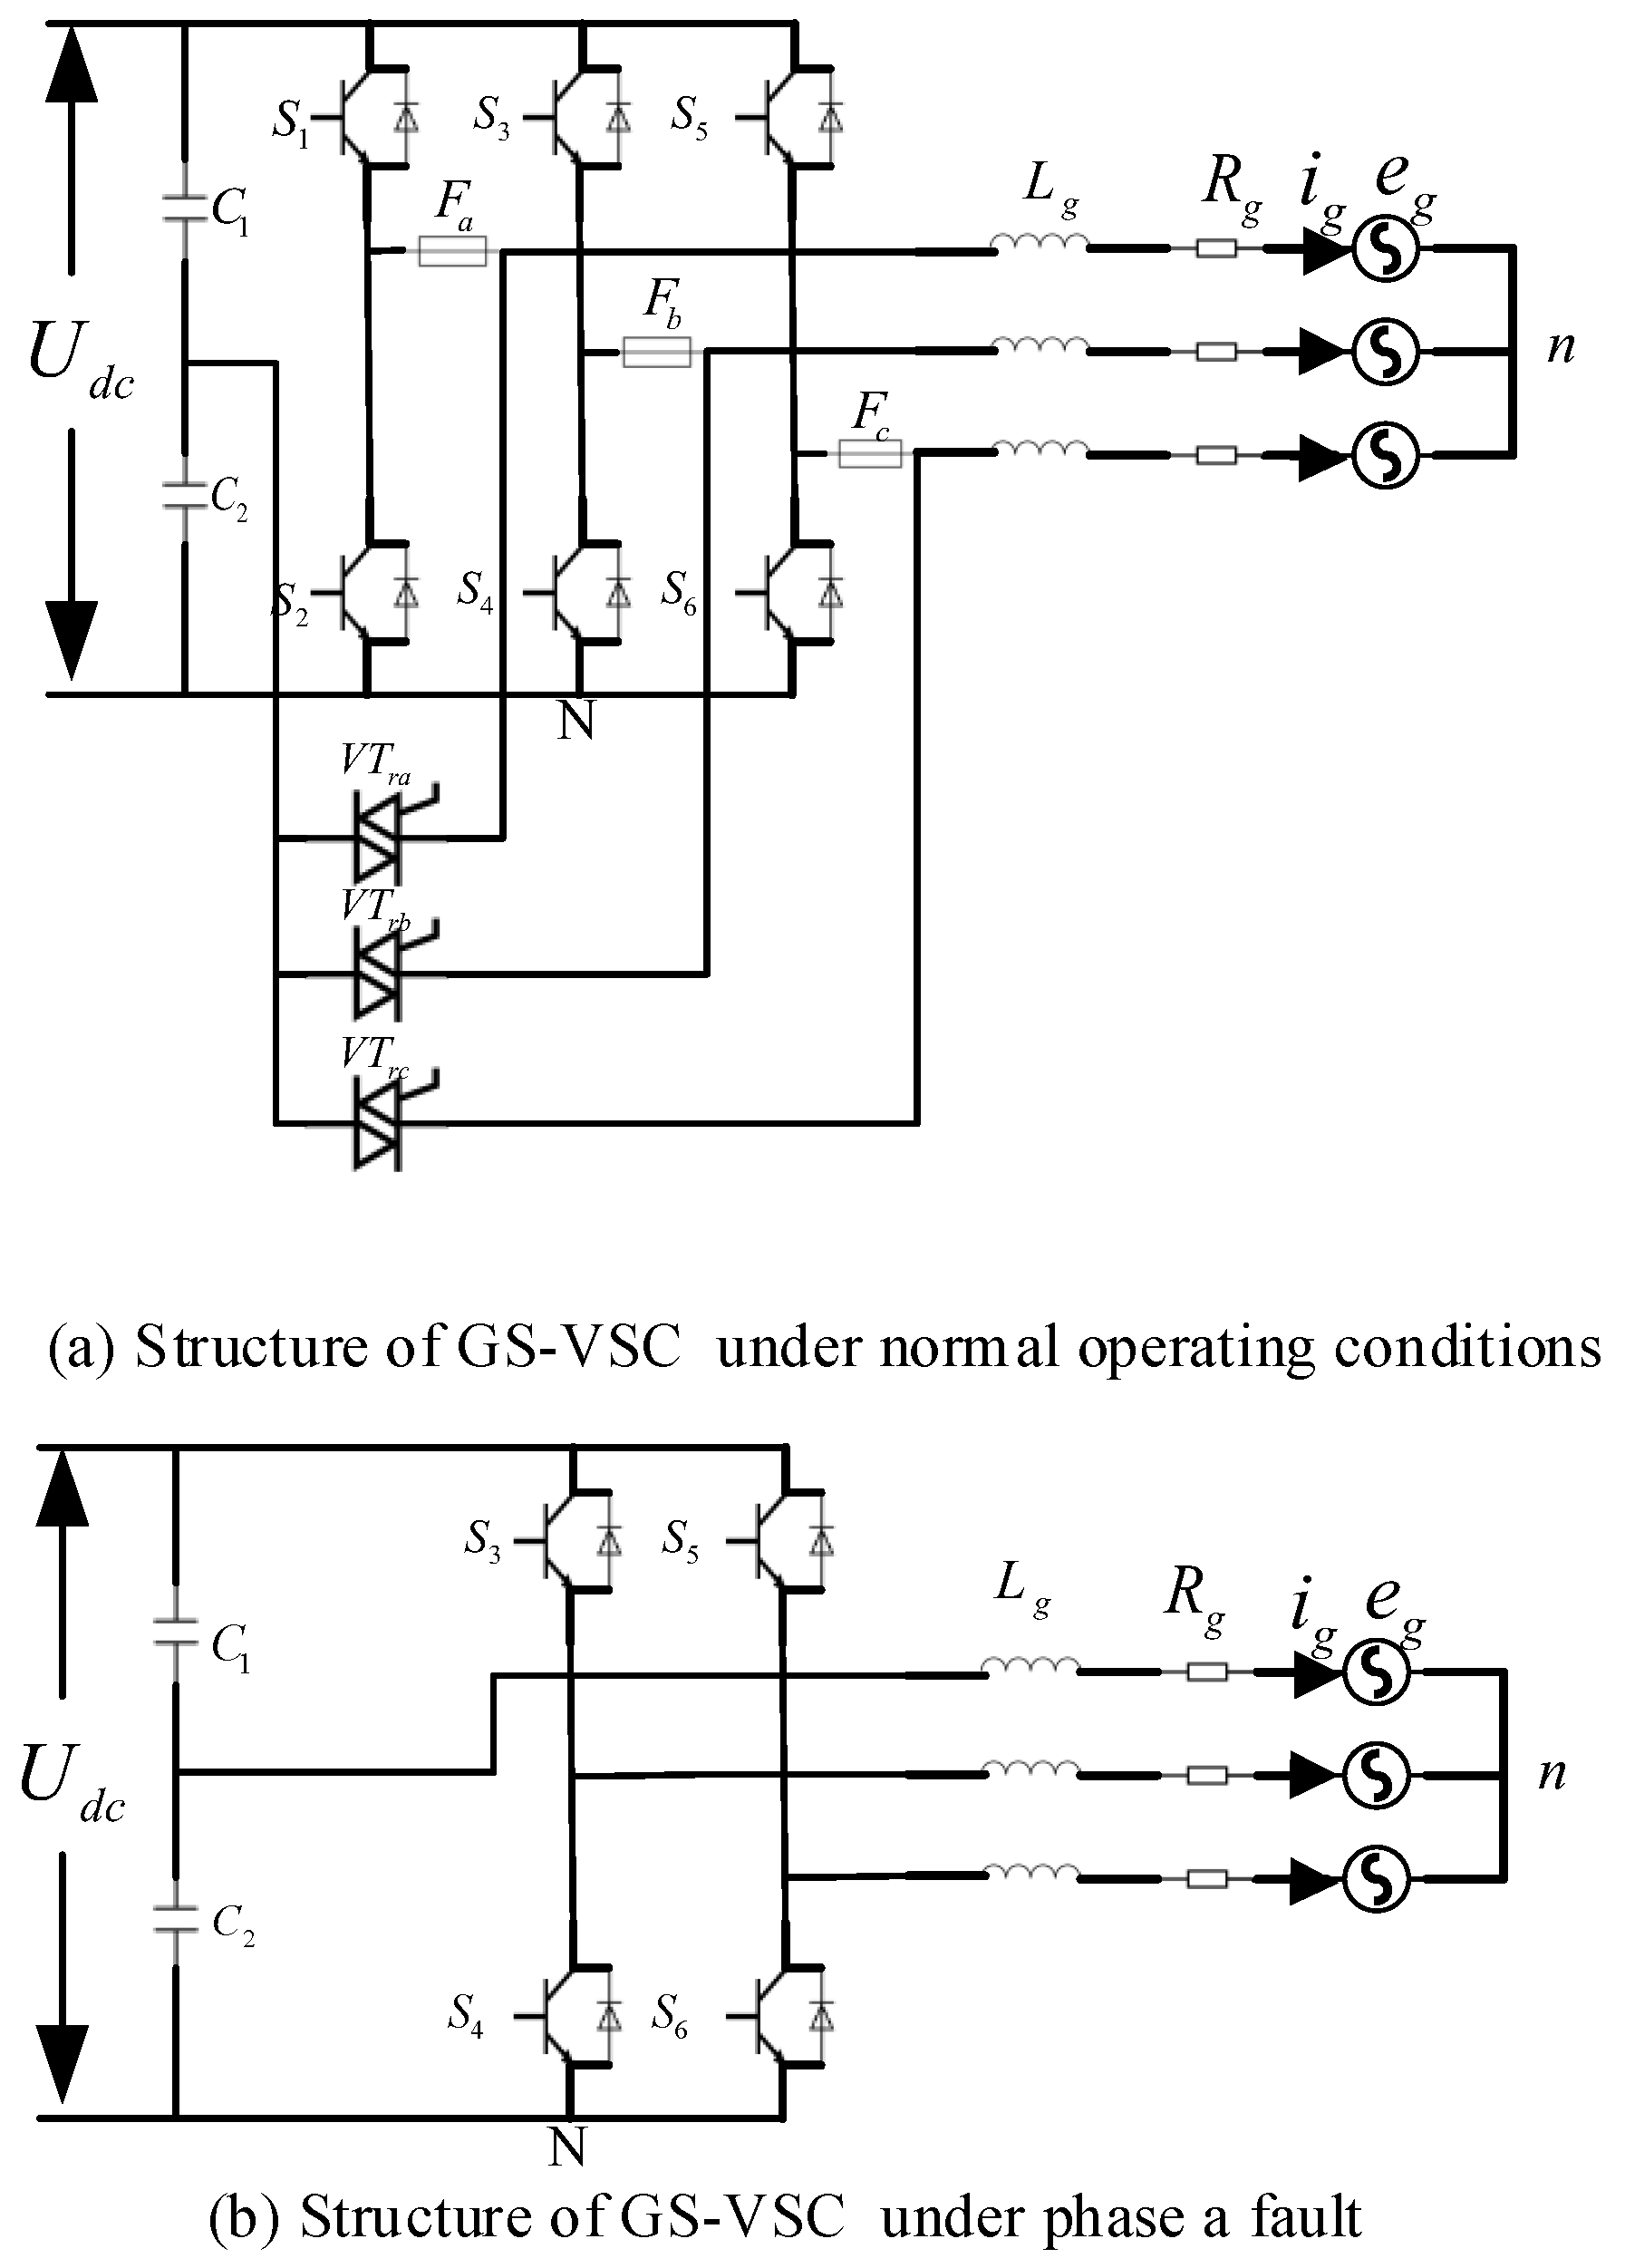
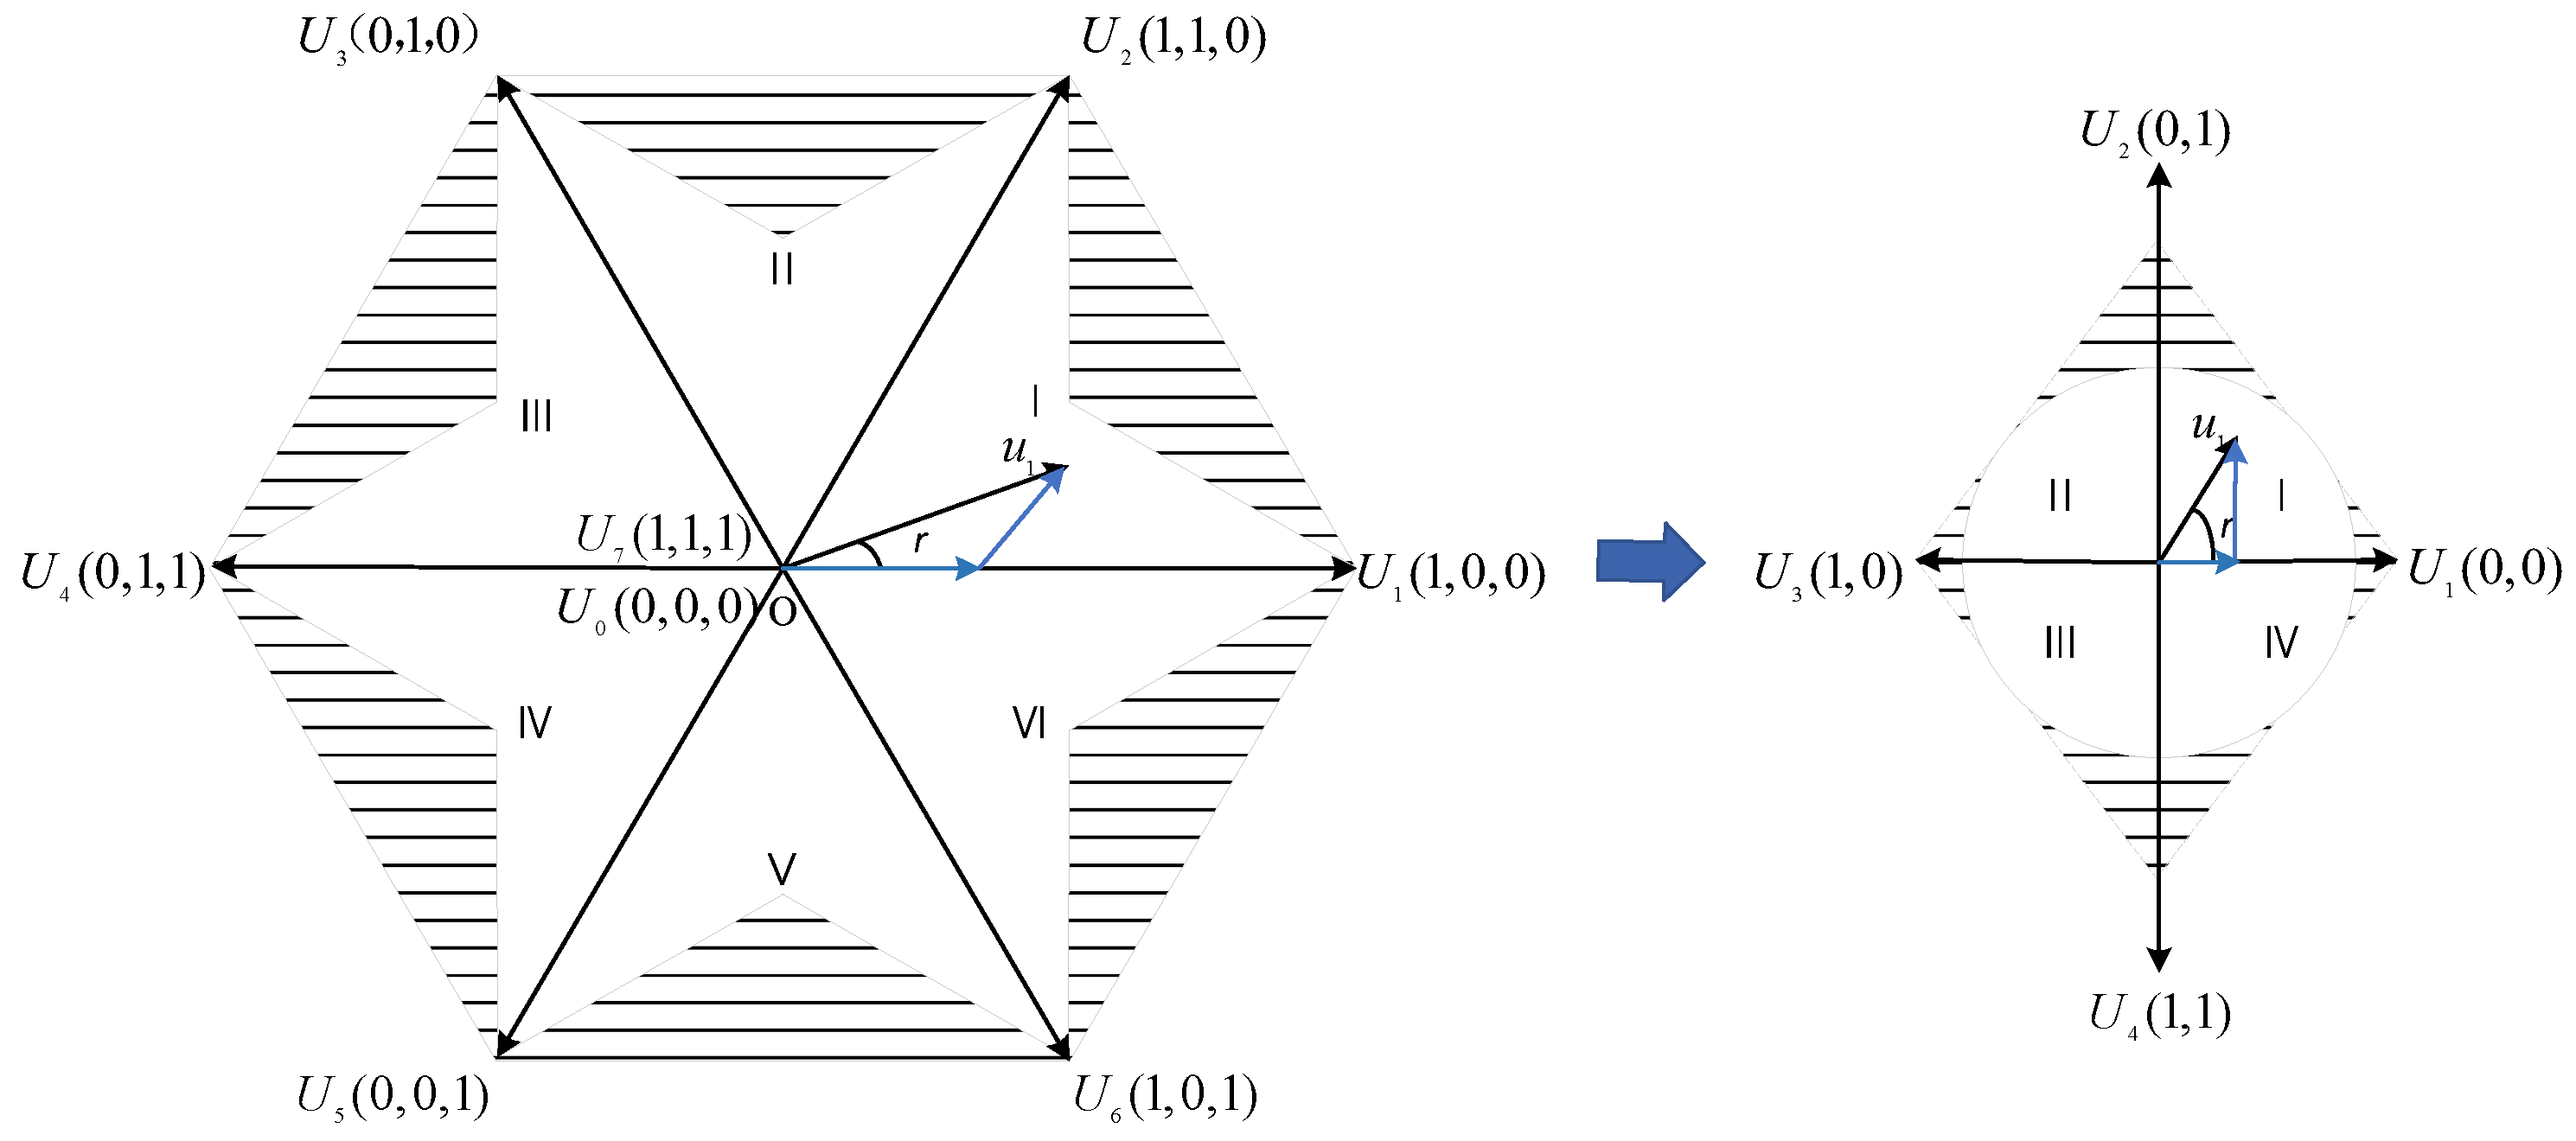
Under normal operation of the converter station: If the target vector u1 is determined to be in Sector I of the spatial vectors, the optimal set of voltage vectors that minimizes the cost function consists of the nearest non-zero vectors U1 and U2, along with the zero vector U0 or U7.To reduce the switching losses and lower the switching frequency, the voltage vectors can be sequentially arranged with only one pulse signal change at a time. For example, for the target vector in Sector I, the sequence of applied voltage vectors is {U0, U1, U2, U7, U2, U1, U0}.
(2)
Under fault-tolerant operation of the converter station (phase a fault): If the target vector u1 is determined to be in Sector I of the spatial vectors, the optimal set of voltage vectors that minimizes the cost function consists of the nearest non-zero vectors U1 and U2. In this case, since there are no zero vectors in the fault-tolerant state, a pair of non-zero vectors with equal magnitudes but in the opposite direction, such as U1 and U4, are used to synthesize the zero vector. Similarly, to reduce switching losses and lower the switching frequency, the sequence of applied voltage vectors is  { U 1 , U 2 , U 3 , U 2 , U 1 } .
(3)
Particular cases in which the target voltage vector lies at the boundary of sectors: Under normal operation, only the nearest non-zero vector that coincides with the target voltage vector needs to be synthesized, along with the zero vector. Under fault-tolerant operation, only the nearest non-zero vector that coincides with the target voltage vector and its corresponding non-zero vector of equal magnitude but opposite direction need to be synthesized.
The selection principle as to target vectors falling within other sectors is the same as that for those of Sector I, and the vectors and the order of action are shown in the following table (Table 2):
After determining the vectors, the duration of action for each vector needs to be calculated. Under normal operation of the converter station, when the target vector is in Sector I, the action times T1 and T2 correspond to the non-zero vectors U1 and U2, respectively. The action time for the zero vector is T0.
Based on the calculation rules of spatial vectors and the law of sines, we have
U 1 T 1 sin ( π 3 r ) = U 2 T 2 sin r = u 1 T sin 2 π 3 T = T 0 + T 1 + T 2 u 1 = U 1 T 1 T + U 2 T 2 T + U 0 T 0 2 + U 7 T 0 2
During converter station fault-tolerant operation (phase a fault), when the target vector is in Sector I, the individual action times for the non-zero vectors U1 and U2 are T1 and T2, respectively. The combined action time for U1 and U2 is T0. The calculation method is the same as above:
U 1 T 1 sin ( π 2 r ) = U 2 T 2 sin r = u 1 T 1 T = 2 T 0 + T 1 + T 2 u 1 = U 1 T 1 T + U 2 T 2 T + U 1 T 0 + U 2 T 0
Considering the first sector as an example, the calculation of the synthesized virtual voltage vector can be obtained after determining the duration and sequence of the voltage vector application within the sector using the following equation.
V α j = ( V α 0 t 0 + V α 1 t 1 + V α 3 t 3 ) V β j = ( V β 0 t 0 + V β 1 t 1 + V β 3 t 3 )
where  V α j  and  V β j  are the components of the synthesized virtual voltage vector of αβ, respectively, and j = I, II, III, IV.
The obtained synthesized virtual voltage vector is subsequently substituted into the equation to identify the vector combination that minimizes the cost function. The corresponding voltage vectors associated with the switch states are applied in the next cycle. This process is repeated in the next sampling period, and it continues cyclically to achieve rolling optimization control of the output power of the GS-VSC. Figure 6 illustrates the diagram of the fault-tolerant MPC for the GS-VSC.

4. Example Analysis

To evaluate the effectiveness of the proposed fault-tolerant MPC, a model of a cluster of offshore wind farms comprising four 300 MW wind farms connected to the VSC-HVDC system is simulated in MATLAB/Simulink (2022a), as shown in Figure 1. The detailed simulation parameters are provided in Table 3.

4.1. Case Description

4.1.1. Case 1: Grid-Side AC Three-Phase Fault Conditions

Under normal operating conditions, the DC busbar voltage reference is set to 300 kV, and the GS-VSC’s reactive power reference is set to 0 VAR. At t = 0.5 s, a three-phase fault occurs on the grid and is cleared after 100 ms. The response curves of the offshore wind power grid system, comparing the conventional dual-loop vector control strategy with the fault-tolerant MPC strategy, are shown in Figure 7.
Under the two aforementioned control strategies, the AC busbar voltage of the offshore wind farm remains constant, while the DC busbar voltage experiences a decline during the fault period. Under the action of the fault-tolerant MPC strategy, the DC busbar voltage returns to its set value and stabilizes within 100 ms after the fault clearance. Moreover, the reactive power of the grid-side converter station experiences an instantaneous jump and quickly stabilizes at 0 VAR. The AC busbar voltage of the offshore wind farm maintains stability with no waveform distortion. In contrast, when employing the conventional dual-loop vector control strategy, the DC busbar voltage returns to the desired set value and stabilizes within 260 ms after the fault clearance. In this case, the reactive power of the GS-VSC exhibits significant fluctuations, taking approximately 300 ms to return to 0 VAR. It is worth noting that the AC busbar voltage of the offshore wind farm remains stable, but with slight distortion.
Hence, it can be concluded that the fault-tolerant MPC strategy proves superior in controlling the DC busbar voltage and power compared to the conventional dual-loop vector control strategy. This strategy enables a quick recovery to normal operating conditions after a fault occurrence, with a fast dynamic response speed.

4.1.2. Case 2: Sudden Changes in Reactive Power

In normal operating conditions, the DC busbar voltage is set to 300 kV, and the reactive power setpoint for the GS-VSC is maintained at 0 VAR. After a duration of 0.5 s, the reactive power setpoint for the GS-VSC experiences an abrupt change to 1GVAR. The simulation results for both the conventional dual-loop vector control strategy and the fault-tolerant MPC strategy are presented in Figure 8.
Under both control strategies, the DC busbar voltage remains unaffected and stable after the sudden reactive power change at the GS-VSC. In the fault-tolerant MPC strategy, the GS-VSC promptly adjusts the reactive power to the new setpoint, maintaining stability and stabilizing the AC busbar voltage at the wind power plant without distortion. Conversely, the GS-VSC stabilizes the reactive power at the new setpoint within approximately 350 ms when employing the conventional dual-loop vector control strategy. Although the AC busbar voltage at the wind power plant remains stable, there is slight distortion, which indicates that the fault-tolerant MPC strategy has a faster response to power variations and superior control performance compared to the conventional dual-loop vector control strategy.

4.1.3. Case 3: Sudden Changes in DC Busbar Voltage

Initially, the DC busbar voltage is set to 300 kV under normal operating conditions, and the GS-VSC has a reactive power setpoint of 0 VAR. After 0.5 s, the DC busbar voltage setpoint experiences a momentary disturbance, dropping the voltage to 240 kV for a duration of 100 ms before it returns to its original setpoint. The simulation results for the conventional dual-loop vector control and the fault-tolerant MPC strategies are illustrated in Figure 9.
Under both control strategies, the AC busbar voltage of the offshore wind farm remains unaffected and stable throughout the DC busbar voltage disturbance during the simulation. In the fault-tolerant MPC strategy, the AC busbar voltage of the wind farm remains stable and without any distortion, even when subjected to the DC voltage disturbance. The DC busbar voltage takes approximately 100 ms to return to the desired value of 300 kV after the setpoint change. The reactive power experiences a brief step response and quickly stabilizes at 0 VAR. In contrast, using the conventional dual-loop vector control strategy, the AC busbar voltage of the wind farm remains stable, with slight distortions. Following the change in the DC voltage setpoint, the DC busbar voltage reaches 300 kV at around 300 ms, and the voltage deviation is greater than that of the MPC strategy. The reactive power takes approximately 250 ms to recover and stabilize at 0 VAR.
In summary, both the fault-tolerant MPC strategy and the conventional dual-loop vector control strategy effectively regulate the DC busbar voltage and reactive power. Nevertheless, the fault-tolerant MPC strategy demonstrates faster dynamic response and superior control performance for the DC busbar voltage and reactive power during fault conditions.

4.1.4. Case 4: Single-Phase Bridge-Arm Faults in the GS-VSC

The DC bus voltage setpoint is 300 kV under normal operating conditions, with a reactive power setpoint of 0 var for the grid-side converter station. A single-phase bridge-arm fault occurs at the grid-side converter station after 0.5 s, persisting continuously. The response curves of the offshore wind farm’s double-ended VSC-HVDC system with a traditional non-fault-tolerant converter station and a fault-tolerant converter station are shown in Figure 10 under a fault-tolerant three-vector MPC control strategy and a conventional dual-loop vector control strategy.
Under the fault condition of the phase-a bridge arm, the DC bus voltage, three-phase grid current waveform, and total harmonic distortion (THD) of the grid current for the grid-side converter station under two control strategies are shown in Figure 10. Comparing the waveforms in the figures, it is evident that the non-fault-tolerant converter station, operating under a conventional dual-loop control which does not consider fault tolerance, exhibits no current in the faulty phase a, significant distortion in the currents of the other two phases, and a grid current THD of 31.41%, failing to meet the relevant standards for grid current. Additionally, during the fault occurrence, the DC bus voltage fluctuates continuously and cannot stabilize at the setpoint of 300 kV.
In contrast, the fault-tolerant converter station, operating under conventional dual-loop control, exhibits a three-phase grid current despite the fault, with a reduced, but still inadequate, grid current THD of 11.48%, due to changes in the system structure.
However, under the proposed fault-tolerant three-vector MPC control strategy, the fault-tolerant converter station demonstrates stable AC bus voltage within approximately 260 ms after the single-phase bridge-arm fault, with the DC bus voltage recovering to the setpoint of 300 kV. The output voltage and grid current waveforms are satisfactory, with a grid current THD of 1.84%, meeting the relevant standards for wind power grid connection.
These results indicate that the traditional dual-loop control strategy is inadequate for controlling the grid-side converter station during bridge-arm faults, while the proposed fault-tolerant three-vector MPC control strategy exhibits excellent control performance, high robustness, strong fault-recovery capability, and fast dynamic response.

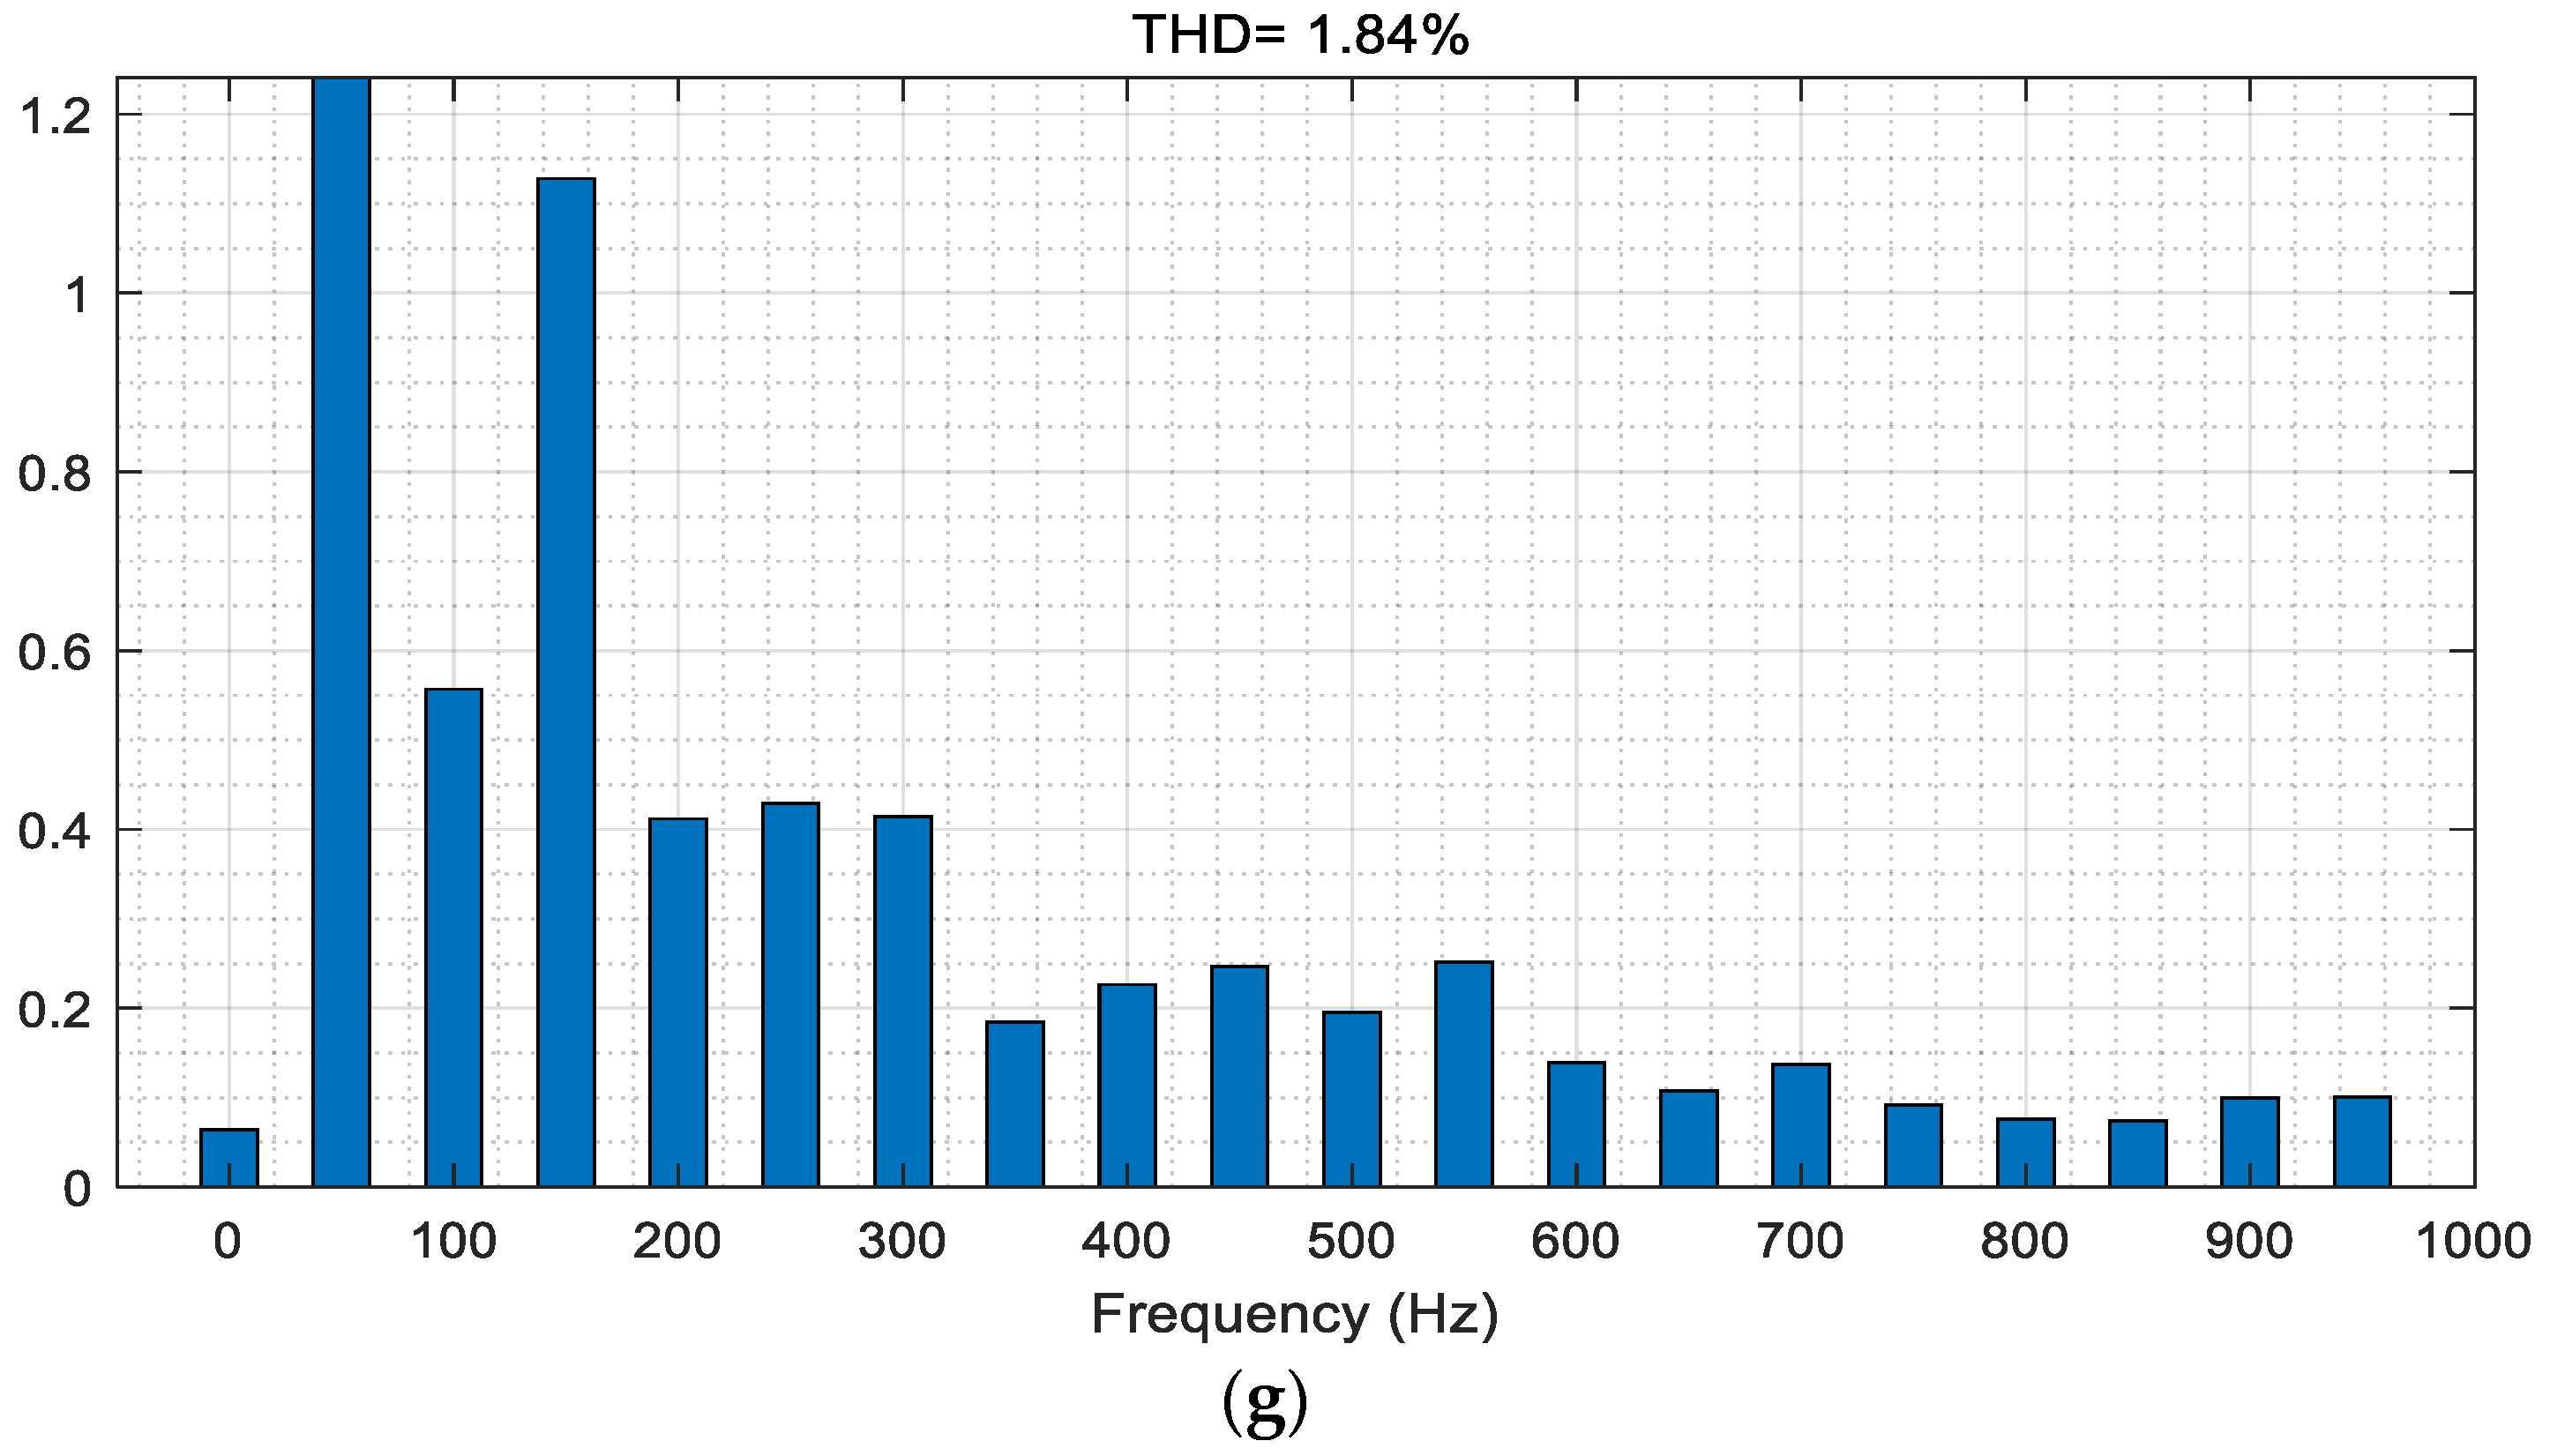
4.2. Comparative Analysis of Harmonic Distortion Rates

To conduct the Fourier analysis, the stable periods after the clearance of the aforementioned faults (Case 1 to Case 4) are chosen. The THD values for the grid AC busbar voltage and current under various operating conditions are presented in Figure 11.
Region I represents the Fourier analysis results for the grid AC busbar voltage and current during stable operation in a grid three-phase fault. Region II indicates the Fourier analysis results for the grid AC busbar voltage and current during stable operation in a reactive power variation. Region III shows the Fourier analysis results for the grid AC busbar voltage and current during stable operation in a DC busbar voltage variation. Finally, Region IV represents the Fourier analysis results for the grid AC busbar voltage and current during stable operation in a single-phase bridge-arm fault at the GS-VSC.
As can be seen in the graph, when employing the fault-tolerant MPC strategy, the THD of the GS-VSC voltage and current remains below 2%, significantly lower than the THD obtained with the conventional dual closed-loop control strategy.

5. Conclusions

As described in this paper, the proposed MPC strategy offers a simple structure, eliminating the complex tuning process of PI parameters and enabling precise tracking of reference power in offshore wind VSC-HVDC transmission systems. Furthermore, the proposed control strategy considers fault-tolerant operation in response to changes in system parameters resulting from single-phase bridge-arm faults, thereby enhancing the disturbance rejection capability and fault-recovery capacity of offshore wind VSC-HVDC grid-connected systems.
Simulation analyses were conducted to assess the performance of the MPC strategy in various operating conditions, encompassing grid three-phase faults, reactive power variations, DC busbar voltage variations, and single-phase bridge-arm faults at the GS-VSC. The simulations’ results demonstrated that the fault-tolerant MPC strategy exhibits outstanding dynamic performance and robustness to model parameters compared to the conventional dual closed-loop control strategy. This method significantly improved the disturbance-rejection capability and fault-recovery capacity of offshore wind VSC-HVDC grid-connected systems, while reducing the THD of grid voltage and current during grid integration.

Author Contributions

Conceptualization, J.L.; methodology, J.L.; software, J.L.; validation, J.L. and J.W.; formal analysis, J.L.; investigation, H.W.; resources, J.W.; data curation, G.L.; writing—original draft preparation, J.L.; writing—review and editing, J.L.; supervision, Y.R.; project administration, J.W.; funding acquisition, J.W. All authors have read and agreed to the published version of the manuscript.

Funding

This research was funded by Key Laboratory in Xinjiang Uygur Autonomous Region of China (2023D04071), and the National Natural Science Foundation of China (52167016). Project Supported by Key Research and Development Project of Xinjiang Uygur Autonomous Region (2022B01020-3).

Data Availability Statement

Data are contained within the article.

Conflicts of Interest

Author Guodong Li was employed by the company State Grid Xinjiang Integrated Energy Service Company Limited. The remaining authors declare that the research was conducted in the absence of any commercial or financial relationships that could be construed as a potential conflict of interest.

References

  1. Liu, J.Z.; Ma, L.; Wang, Q.; Fang, F.; Zhu, Y. Offshore wind power supports China’s energy transition. Strateg. Study Chin. Acad. Eng. 2021, 23, 149–159. [Google Scholar]
  2. She, J.; Blauw, A.; Laakso, L.; Mourre, B.; Schulz-Stellenfleth, J.; Wehde, H. Fit-for-Purpose Information for Offshore Wind Farming Applications—Part-II: Gap Analysis and Recommendations. J. Mar. Sci. Eng. 2023, 11, 1817. [Google Scholar] [CrossRef]
  3. Carayannis, E.G.; Ilinova, A.; Cherepovitsyn, A. The future of energy and the case of the arctic offshore: The role of strategic management. J. Mar. Sci. Eng. 2021, 9, 134. [Google Scholar] [CrossRef]
  4. Yang, B.; Liu, B.; Zhou, H.; Wang, J.; Yao, W.; Wu, S.; Shu, H.; Ren, Y. A critical survey of technologies of large offshore wind farm integration: Summary, advances, and perspectives. Prot. Control Mod. Power Syst. 2022, 7, 17. [Google Scholar] [CrossRef]
  5. Fuchs, A.; Imhof, M.; Demiray, T.; Morari, M. Stabilization of Large Power Systems Using VSC–HVDC and Model Predictive Control. IEEE Trans. Power Deliv. 2014, 29, 480–488. [Google Scholar] [CrossRef]
  6. Cortes, P.; Kazmierkowski, M.P.; Kennel, R.M.; Quevedo, D.E.; Rodriguez, J. Predictive Control in Power Electronics and Drives. IEEE Trans. Ind. Electron. 2008, 55, 4312–4324. [Google Scholar] [CrossRef]
  7. Cortes, P.; Rodriguez, J.; Silva, C.; Flores, A. Delay Compensation in Model Predictive Current Control of a Three-Phase Inverter. IEEE Trans. Ind. Electron. 2011, 59, 1323–1325. [Google Scholar] [CrossRef]
  8. Kouro, S.; Cortes, P.; Vargas, R.; Ammann, U.; Rodriguez, J. Model Predictive Control—A Simple and Powerful Method to Control Power Converters. IEEE Trans. Ind. Electron. 2009, 56, 1826–1838. [Google Scholar] [CrossRef]
  9. Cortés, P.; Wilson, A.; Kouro, S.; Rodriguez, J.; Abu-Rub, H. Model Predictive Control of Multilevel Cascaded H-Bridge Inverters. IEEE Trans. Ind. Electron. 2010, 57, 2691–2699. [Google Scholar] [CrossRef]
  10. Rivera, S.; Kouro, S.; Wu, B.; Alepuz, S.; Malinowski, M.; Cortes, P.; Rodriguez, J. Multilevel Direct Power Control—A Generalized Approach for Grid-Tied Multilevel Converter Applications. IEEE Trans. Power Electron. 2014, 29, 5592–5604. [Google Scholar] [CrossRef]
  11. Cortes, P.; Ortiz, G.; Yuz, J.I.; Rodriguez, J.; Vazquez, S.; Franquelo, L.G. Model Predictive Control of an Inverter With Output $LC$ Filter for UPS Applications. IEEE Trans. Ind. Electron. 2009, 56, 1875–1883. [Google Scholar] [CrossRef]
  12. Calle-Prado, A.; Alepuz, S.; Bordonau, J.; Nicolas-Apruzzese, J.; Cortés, P.; Rodriguez, J. Model Predictive Current Control of Grid-Connected Neutral-Point-Clamped Converters to Meet Low-Voltage Ride-Through Requirements. IEEE Trans. Ind. Electron. 2015, 62, 1503–1514. [Google Scholar] [CrossRef]
  13. Dirscherl, C.; Hackl, C.M.; Schechner, K. Explicit model predictive control with disturbance observer for grid-connected voltage source power converters. In Proceedings of the 2015 IEEE International Conference on Industrial Technology (ICIT), Seville, Spain, 17–19 March 2015; pp. 999–1006. [Google Scholar] [CrossRef]
  14. Guo, L.L.; Zhang, X.; Yang, S.Y.; Xie, Z. An improved model predictive direct torque control method for permanent magnet synchronous generator. Proc. CSEE 2016, 36, 5053–5061. [Google Scholar]
  15. Aguilera, R.P.; Lezana, P.; Quevedo, D.E. Switched Model Predictive Control for Improved Transient and Steady-State Performance. IEEE Trans. Ind. Inform. 2015, 11, 968–977. [Google Scholar] [CrossRef]
  16. Zou, J.; Xu, W.; Yu, X.; Liu, Y.; Ye, C. Multistep Model Predictive Control With Current and Voltage Constraints for Linear Induction Machine Based Urban Transportation. IEEE Trans. Veh. Technol. 2017, 66, 10817–10829. [Google Scholar] [CrossRef]
  17. Yang, X.; Biegler, L.T. Advanced-multi-step nonlinear model predictive control. J. Process Control 2013, 23, 1116–1128. [Google Scholar] [CrossRef]
  18. Silva, B.; Moreira, C.L.; Seca, L.; Phulpin, Y.; Lopes, J.A.P. Provision of Inertial and Primary Frequency Control Services Using Offshore Multiterminal HVDC Networks. IEEE Trans. Sustain. Energy 2012, 3, 800–808. [Google Scholar] [CrossRef]
  19. Laraba, M.T.; Olaru, S.; Niculescu, S.I. Linear model predictive control and time-delay implications. IFAC-Pap. 2017, 50, 14406–14411. [Google Scholar]
  20. Yang, Y.; Wen, H.; Li, D. A fast and fixed switching frequency model predictive control with delay compensation for three-phase inverters. IEEE Access 2017, 5, 17904–17913. [Google Scholar] [CrossRef]
  21. Uddin, M.; Mekhilef, S.; Nakaoka, M.; Rivera, M. Model predictive control of induction motor with delay time compensation: An experimental assessment. In Proceedings of the 2015 IEEE Applied Power Electronics Conference and Exposition (APEC), Charlotte, NC, USA, 15–19 March 2015. [Google Scholar]
  22. Zhang, X.; Wang, K.; Zhang, W.; Wang, Y.; Wang, P.; Gao, D. Dual delay-compensation-based model predictive control for the semi-controlled open-winding PMSM system. IEEE Access 2019, 7, 69947–69959. [Google Scholar] [CrossRef]
Figure 1. Offshore wind farm grid integration diagram.
Electronics 13 02316 g001
Figure 2. Topology diagram of the OWF-VSC.
Electronics 13 02316 g002
Figure 3. OWF-VSC control strategy.
Electronics 13 02316 g003
Figure 4. Topology diagram of the fault-tolerant GS-VSC.
Electronics 13 02316 g004
Figure 5. Vector range.
Electronics 13 02316 g005
Figure 6. The GS-VSC fault-tolerant MPC strategy.
Electronics 13 02316 g006
Figure 7. Response curves for grid-side AC three-phase faults under two types of control: (a) DC bus voltage and (b) the GS-VSC’s reactive power.
Electronics 13 02316 g007
Figure 8. Response curves for reactive power glitch under two controls: (a) DC bus voltage and (b) the GS-VSC’s reactive power.
Electronics 13 02316 g008
Figure 9. Response curves for a reactive power glitch under two controls: (a) DC bus voltage and (b) the GS-VSC’s reactive power.
Electronics 13 02316 g009
Figure 10. Response curves for single-phase bridge-arm faults under both controls: (a) DC bus voltage; (b) grid-connected current waveforms under fault-free conventional double closed-loop control; (c) grid-connected current waveforms under fault-tolerant conventional dual-loop control; (d) grid-connected current waveforms under fault-tolerant three-vector MPC control; (e) THD of grid-connected current under fault-free conventional double closed-loop control; (f) THD of grid-connected current under fault-tolerant conventional double closed-loop control; and (g) THD of grid-connected current under fault-tolerant three-vector MPC control.
Electronics 13 02316 g010aElectronics 13 02316 g010bElectronics 13 02316 g010c
Figure 11. Harmonic distortion ratio comparison.
Electronics 13 02316 g011
Table 1. GS-VSC voltage vectors. (1) GS-VSC voltage vector under normal operating conditions. (2) Fault-tolerant GS-VSC voltage vector under single-phase bridge-arm fault.
(1)
Voltage VectorSwitch Status u α u β
U 0 0, 0, 000
U 1 1, 0, 0 2 U d c / 3 0
U 2 1, 1, 0 U d c / 3 3 U d c / 3
U 3 0, 1, 0 U d c / 3 3 U d c / 3
U 4 0, 1, 1 2 U d c / 3 0
U 5 0, 0, 1 U d c / 3 3 U d c / 3
U 6 1, 0, 1 U d c / 3 3 U d c / 3
U 7 1, 1, 100
(2)
Voltage VectorSwitch Status u α u β
U 1 0, 0 2 U d c 2 / 3 0
U 2 1, 0 ( U d c 2 U d c 1 ) / 3 3 ( U d c 2 U d c 1 ) / 3
U 3 0, 1 ( U d c 2 U d c 1 ) / 3 3 ( U d c 2 + U d c 1 ) / 3
U 4 1, 1 2 U d c 1 / 3 0
Table 2. Sequence of action of voltage vectors: (a) under normal operation of the converter station and (b) fault-tolerant operation of the converter station for phase a faults.
(a)
SectorOrder of Voltage Vector Application
I U 0 , U 1 , U 2 , U 7 , U 2 , U 1 , U 0
II U 0 , U 3 , U 2 , U 7 , U 2 , U 3 , U 0
III U 0 , U 3 , U 4 , U 7 , U 4 , U 3 , U 0
IV U 0 , U 5 , U 4 , U 7 , U 4 , U 5 , U 0
V U 0 , U 5 , U 6 , U 7 , U 6 , U 5 , U 0
VI U 0 , U 1 , U 6 , U 7 , U 6 , U 1 , U 0
(b)
SectorOrder of Voltage Vector Application
I U 1 , U 2 , U 3 , U 2 , U 1
II U 2 , U 4 , U 3 , U 4 , U 2
III U 3 , U 4 , U 2 , U 4 , U 3
IV U 1 , U 3 , U 4 , U 3 , U 1
Table 3. Model parameters.
ParametersNumerical Values
Wind farm rated power P/MW1200
DC voltage  u d c / k V  300
Length of DC transmission lines/km250
DC capacitance C/ μ F  80
Line inductors L/mH200
Sampling period  T s / μ s  50
Disclaimer/Publisher’s Note: The statements, opinions and data contained in all publications are solely those of the individual author(s) and contributor(s) and not of MDPI and/or the editor(s). MDPI and/or the editor(s) disclaim responsibility for any injury to people or property resulting from any ideas, methods, instructions or products referred to in the content.

