Abstract
This paper presents a novel approach for electricity consumption profiling in households through the fusion of usage data for individual smart devices. The novelty of the approach consists of leveraging the data representing the usage of individual appliances rather than using direct measurements of energy consumption. Our methodology focuses on merging signals representing the interaction of the user with the device to compute patterns in the total energy consumption per household. Subsequently, we apply data mining techniques—specifically, unsupervised clustering—to analyze the resulting time-series data representing daily energy consumption. Through this approach, we aim to identify and characterize patterns in energy usage within households, enabling insights for energy optimization strategies and resource allocation. This information can be further used in practical tasks, such as flattening energy consumption. The proposed approach offers an alternative to the direct measurement of energy usage, considering the potential for sensor failure or malfunction. This underscores the importance of implementing a complementary method for verifying and validating energy consumption data.
1. Introduction
The deployment of smart devices in modern households has revolutionized the way we interact with our living spaces. These devices, equipped with sensors capable of capturing various aspects of our daily activities, offer a wealth of data that can be leveraged for a multitude of purposes. One such area of interest is electricity consumption profiling, which plays a crucial role in understanding and managing energy usage within households.
Electricity consumption profiling contributes to creating efficient management of energy consumption. Multiple countries have different costs for the same amount of supplied energy based on the consumer type and the time. In [1], the authors showcase this concept in Poland, which has different costs in different time frames of the same day. Efficient management of electricity consumption is of paramount importance from the perspective of cost reduction. Our work contributes to shifting the research focus from investigating ways of customizing the prices, such as in the work presented in [2], to making consumption more efficient.
Having an efficient management of energy consumption not only contributes to cost savings for consumers but also has significant implications for environmental sustainability. To this end, accurate profiling of electricity consumption patterns is essential for identifying areas of inefficiency, optimizing resource allocation, and implementing targeted energy conservation measures.
Understanding the energy usage patterns of a smart home can play a critical role in smart appliance management systems that target the reduction of peaks in electricity consumption. Worldwide, the electricity taxes are different, but multiple countries penalize the peaks in electricity consumption [3]. Avoiding the peaks in energy consumption of households is a contributor to predictable costs. Building and maintaining infrastructure to accommodate peak electricity demand can be expensive. By managing and reducing peak consumption, we can potentially delay or avoid the need for costly investments in new power plants, transmission lines, and distribution systems. Overall, avoiding peak electricity consumption promotes economic efficiency, environmental sustainability, and prudent infrastructure management, explaining the interest in the topic in recent years [4,5]. Having flat consumption is also more and more important in light of recent research on energy generation via photovoltaic methods [6]. Understanding electricity usage patterns can contribute to the better management of programable and controllable devices [7], which are the main core of electricity consumption optimization algorithms.
Smart meters play a pivotal role in enabling efficient energy consumption planning by providing real-time data that facilitate informed decision making and optimization of energy usage. As a consequence, smart meter technologies have a dedicated research track in the literature [8,9,10,11]. In [12], the authors propose smart meters for electricity profiling, but the proposal is in the context of entire buildings. Even if studies show that smart meters play an important role in efficient energy management in contexts such as smart grids and energy management for buildings, the solution has the disadvantage of costs, as concluded in the study of [13]. As a consequence, studying the possibility of optimizing the number of sensors needed for the efficient capture of the environment has emerged as a research topic [14]. The literature even explores alternatives to measuring electricity directly. In [15], the authors use indirect sensing to evaluate the power consumption of home appliances. Our work pursues the direction of deriving energy-related insights from data generated by sensors that are already deployed on devices by manufacturers for other purposes. We aim to leverage data generated by sensors that monitor device usage. Our proposed approach offers an alternative method for inferring a household’s energy consumption profile instead of directly monitoring energy usage. This approach has benefits in verifying the accuracy of energy meters and can serve as a backup in energy management systems. Traditionally, electricity consumption profiling has relied on aggregate measurements obtained from utility meters, providing limited insights into the specific usage patterns of individual appliances within a household [16,17,18]. However, the advent of smart devices equipped with sensor technology presents an opportunity to obtain granular data on appliance-level usage, allowing for a more detailed analysis of energy consumption dynamics.
In this paper, we propose a novel approach for electricity consumption profiling in households through the fusion of individual device usage data. Our methodology involves data fusion by integrating input data representing the usage of different appliances to compute the total energy consumption per household. Subsequently, we apply data mining techniques, particularly unsupervised clustering, to analyze the resulting time-series data representing daily energy consumption. Through this approach, we aim to identify recurring patterns in energy usage within households, providing valuable insights for energy management and optimization strategies. The focus of this work is to establish a methodology for inferring electricity consumption patterns rather than exploring the application of this information for efficient energy management or peak detection, which constitutes a separate and broader study topic. The findings open new research directions, such as distributed optimization methods [19], which can help to optimize the roles and contributions of different devices in home energy consumption.
The remainder of this paper is organized as follows: Section 2 provides an overview of related work in the field of electricity consumption profiling and data mining techniques applied to energy data. Section 3 presents the theoretical concepts needed for understanding the steps of the proposed methodology. Section 4 outlines the methodology proposed in this paper, including the data fusion techniques and unsupervised clustering algorithms employed for energy consumption analysis. Section 5 presents the experimental results and discusses findings derived from the application of the proposed methodology. Finally, Section 6 concludes the paper with a summary of the key findings and directions for future research.
2. Related Work
Understanding and effectively managing household electricity consumption have become paramount in the pursuit of sustainability and efficient resource utilization. In this section, we delve into the existing literature and research efforts that contribute to the field of home appliance sensor data processing.
In [20], the authors explore the extraction of usage patterns from the power data of home appliances in a smart home environment. The authors tackle the challenges associated with the Big Data nature of power usage data while mining the sequences and extracting interesting sequence patterns with PrefixSpan [21]. The appliances taken into consideration in this research are TVs, washing machines, microwaves, dryers, ovens, air conditioners, lights, and fridges. The authors identify sequences of appliances that function one after another or sequences of appliances that function at the same time. The efforts made in this work are on the same line with our proposal, but they follow an inverse direction: the authors try to infer usage patterns from measured power data, while we try to extract energy consumption patterns from usage data.
The topic of extracting usage patterns is also tackled in [22]. The authors use a clustering approach in order to extract usage patterns from appliance data while leveraging the smart home concept. This research is a reassurance that the clustering approach applied to this kind of data mining task, recurring pattern extraction, is a viable solution.
One of the primary objectives of extracting energy usage data is to contribute to appliance scheduling with the aim of smoothing out energy consumption. Scheduling is a heavily researched topic within the community. In [23], the scheduling of smart appliances is investigated to improve energy usage management. Appliances are categorized into two primary groups: those operating once per day and those operating twice per day. While we consider this idea innovative, we believe that the limitation to the two types of appliances is not in line with a real application of the processing pipeline because the real data usage of smart devices is more complex. We try to address this limitation, and we do not rely on predefined categories of usage in our study. We propose methods that can handle any type of usage pattern.
The research community’s interest in associating home appliance usage with energy consumption is evident through studies focusing on diverse tasks, such as prediction. For instance, in [24], a predictive task is undertaken to anticipate appliance usage using electrical consumption data. Three algorithms (the histogram algorithm, pattern search algorithm, and Bayesian inference algorithm) are applied to datasets containing the electrical consumption data of individual households.
To the best of our knowledge, the extraction of electricity consumption patterns from smart home appliance usage data has not yet been addressed. Consequently, a discussion on methods employed for this specific task is not included in this section.
3. Theoretical Background
In order to provide a comprehensive theoretical foundation for the subsequent analysis, this section delves into key concepts and methodologies that are essential for understanding the topic at hand.
3.1. Syntactical Forms of Smart Device Usage
In order to facilitate algorithmic processing, the representation of smart device usage data requires transformation. The device usage data captured by sensors deployed on devices manifest as events marking the initiation and termination of user interactions. Transitioning from this syntactic representation to a format comprehensible to algorithms is essential. Given the temporal nature of the data, this transformed representation adopts a time-series syntax.
In [25], we present the topic of transforming user interaction events into time series in depth. A taxonomy of transforming event-based signals into time series is proposed. The methods presented in this taxonomy are used in this study to transform various event-based signals generated by user interactions with smart devices. As a result, the usage of a smart device is described by the signal defined in Equation (1).
3.2. Energy Consumption Derived from Device Usage
The usage signal is utilized further in this study to calculate the energy consumption for each type of device, as depicted in Equation (2). In the equation, DSC represents the device-specific constant, and the type parameter pertains to the appliance type for which the energy consumption equation is applied. The device type can be classified as independent (INDEP), where the energy consumption function remains unaffected by the device’s usage, implying a constant energy consumption regardless of the device’s operation. Conversely, devices categorized as dependent (DEP) entail energy consumption functions that vary based on their usage. An illustrative example of such devices includes washing machines or tumble dryers, which consume energy solely during the execution of a running cycle.
The individual energy consumption is used to formalize the total household energy consumption, as shown in Equation (3), where n is the total number of devices.
3.3. Feature Extraction from Time Series
The task of pattern recognition in time series can be simplified as a shape-based similarity challenge. Establishing whether two time series share similar shapes is fundamental for identifying patterns within them. A crucial step in computing this similarity involves extracting representative features. This not only contributes to reducing dimensionality but also significantly impacts the performance of data mining algorithms.
In [26], various methods of feature extraction from time series are categorized into temporal, statistical, and spectral domains.
Several approaches to determining shape similarity are discussed in [27]. While the Euclidean distance is one such method, it has drawbacks, such as sensitivity to distortions and strict requirements regarding the lengths of the compared time series. Dynamic time warping (DTW) and the longest common subsequence address these limitations but are computationally expensive. In [28], DTW is employed to extract discriminative features, yielding competitive results in real-world applications compared to state-of-the-art methods such as InceptionTime and convolutional neural networks.
The effectiveness of shape-based similarity strategies is demonstrated in [27] for comparing short time series. However, for longer time series, alternative methods such as structural similarity need to be considered. The frequency domain is extensively explored in the literature as a method for extracting features that characterize time series [29,30,31,32].
3.4. Discrete Fourier Transform
The discrete Fourier transform offers a method of incorporating frequency indicators into data representations by decomposing a signal into individual spectral components, thus revealing frequency information. This transform translates a signal into two vectors that denote the influence of corresponding basis functions in the original signal.
Upon applying the Fourier transform to a signal comprising N points, the result is a representation of N complex numbers. However, for feature space reduction, it is unnecessary to consider all coefficients. Instead, focusing on the first X coefficients offers a concise representation of the original signal, with X typically being determined by the specific business context. In [33], an alternative approach to selecting these coefficients is proposed. The authors argue that prioritizing the largest coefficients enhances the fidelity of the representation of the original signal.
The discrete Fourier transform (DFT) of a sequence of length N is given by
where is the k-th frequency component of the DFT.
The fast Fourier transform (FFT) computes the DFT of a sequence of length N in time . The output is the same as that of the DFT. The algorithm is based on the divide-and-conquer principle, which breaks down the DFT computation into smaller sub-problems and combines their solutions to obtain the final result. The FFT is a popular method for extracting features from time series [32,34], and there are multiple frameworks for computing the FFT [26].
3.5. Clustering in Pattern Mining
Pattern mining methods aim to extract meaningful patterns from vast datasets, leveraging the derived insights to enhance domain understanding or decision-making processes.
Clustering techniques involve the segmentation of objects into cohesive groups, striving to maximize intra-group similarity while minimizing inter-cluster similarity [35]. This field has garnered significant attention within the computer science literature, leading to the development of numerous algorithms and libraries. In [35], clustering techniques are categorized into six types: partitioning, hierarchical, grid-based, model-based, constraint-based, and density-based, each serving distinct purposes.
Density-based clustering techniques offer a non-parametric approach, eliminating the need for specifying the number of clusters as an input parameter, thereby making them well suited for unsupervised learning models. Notably, in the realm of large databases, DBSCAN (Density-Based Spatial Clustering of Applications with Noise) [36], GDBSCAN [37], and DENCLUE [38] have emerged as popular density-based algorithms that are designed with a focus on efficient scalability [39]. DBSCAN, in particular, stands out as one of the most widely cited density-based algorithms, with over 27,000 citations in the literature, and it is widely implemented in various frameworks [40], bolstering its credibility and adoption. DBSCAN is a clustering algorithm that groups together points based on their density, requiring parameters for radius and minimum points. It identifies core points, border points, and outliers, making it robust for discovering clusters of varying shapes and sizes in noisy datasets.
4. Methodology
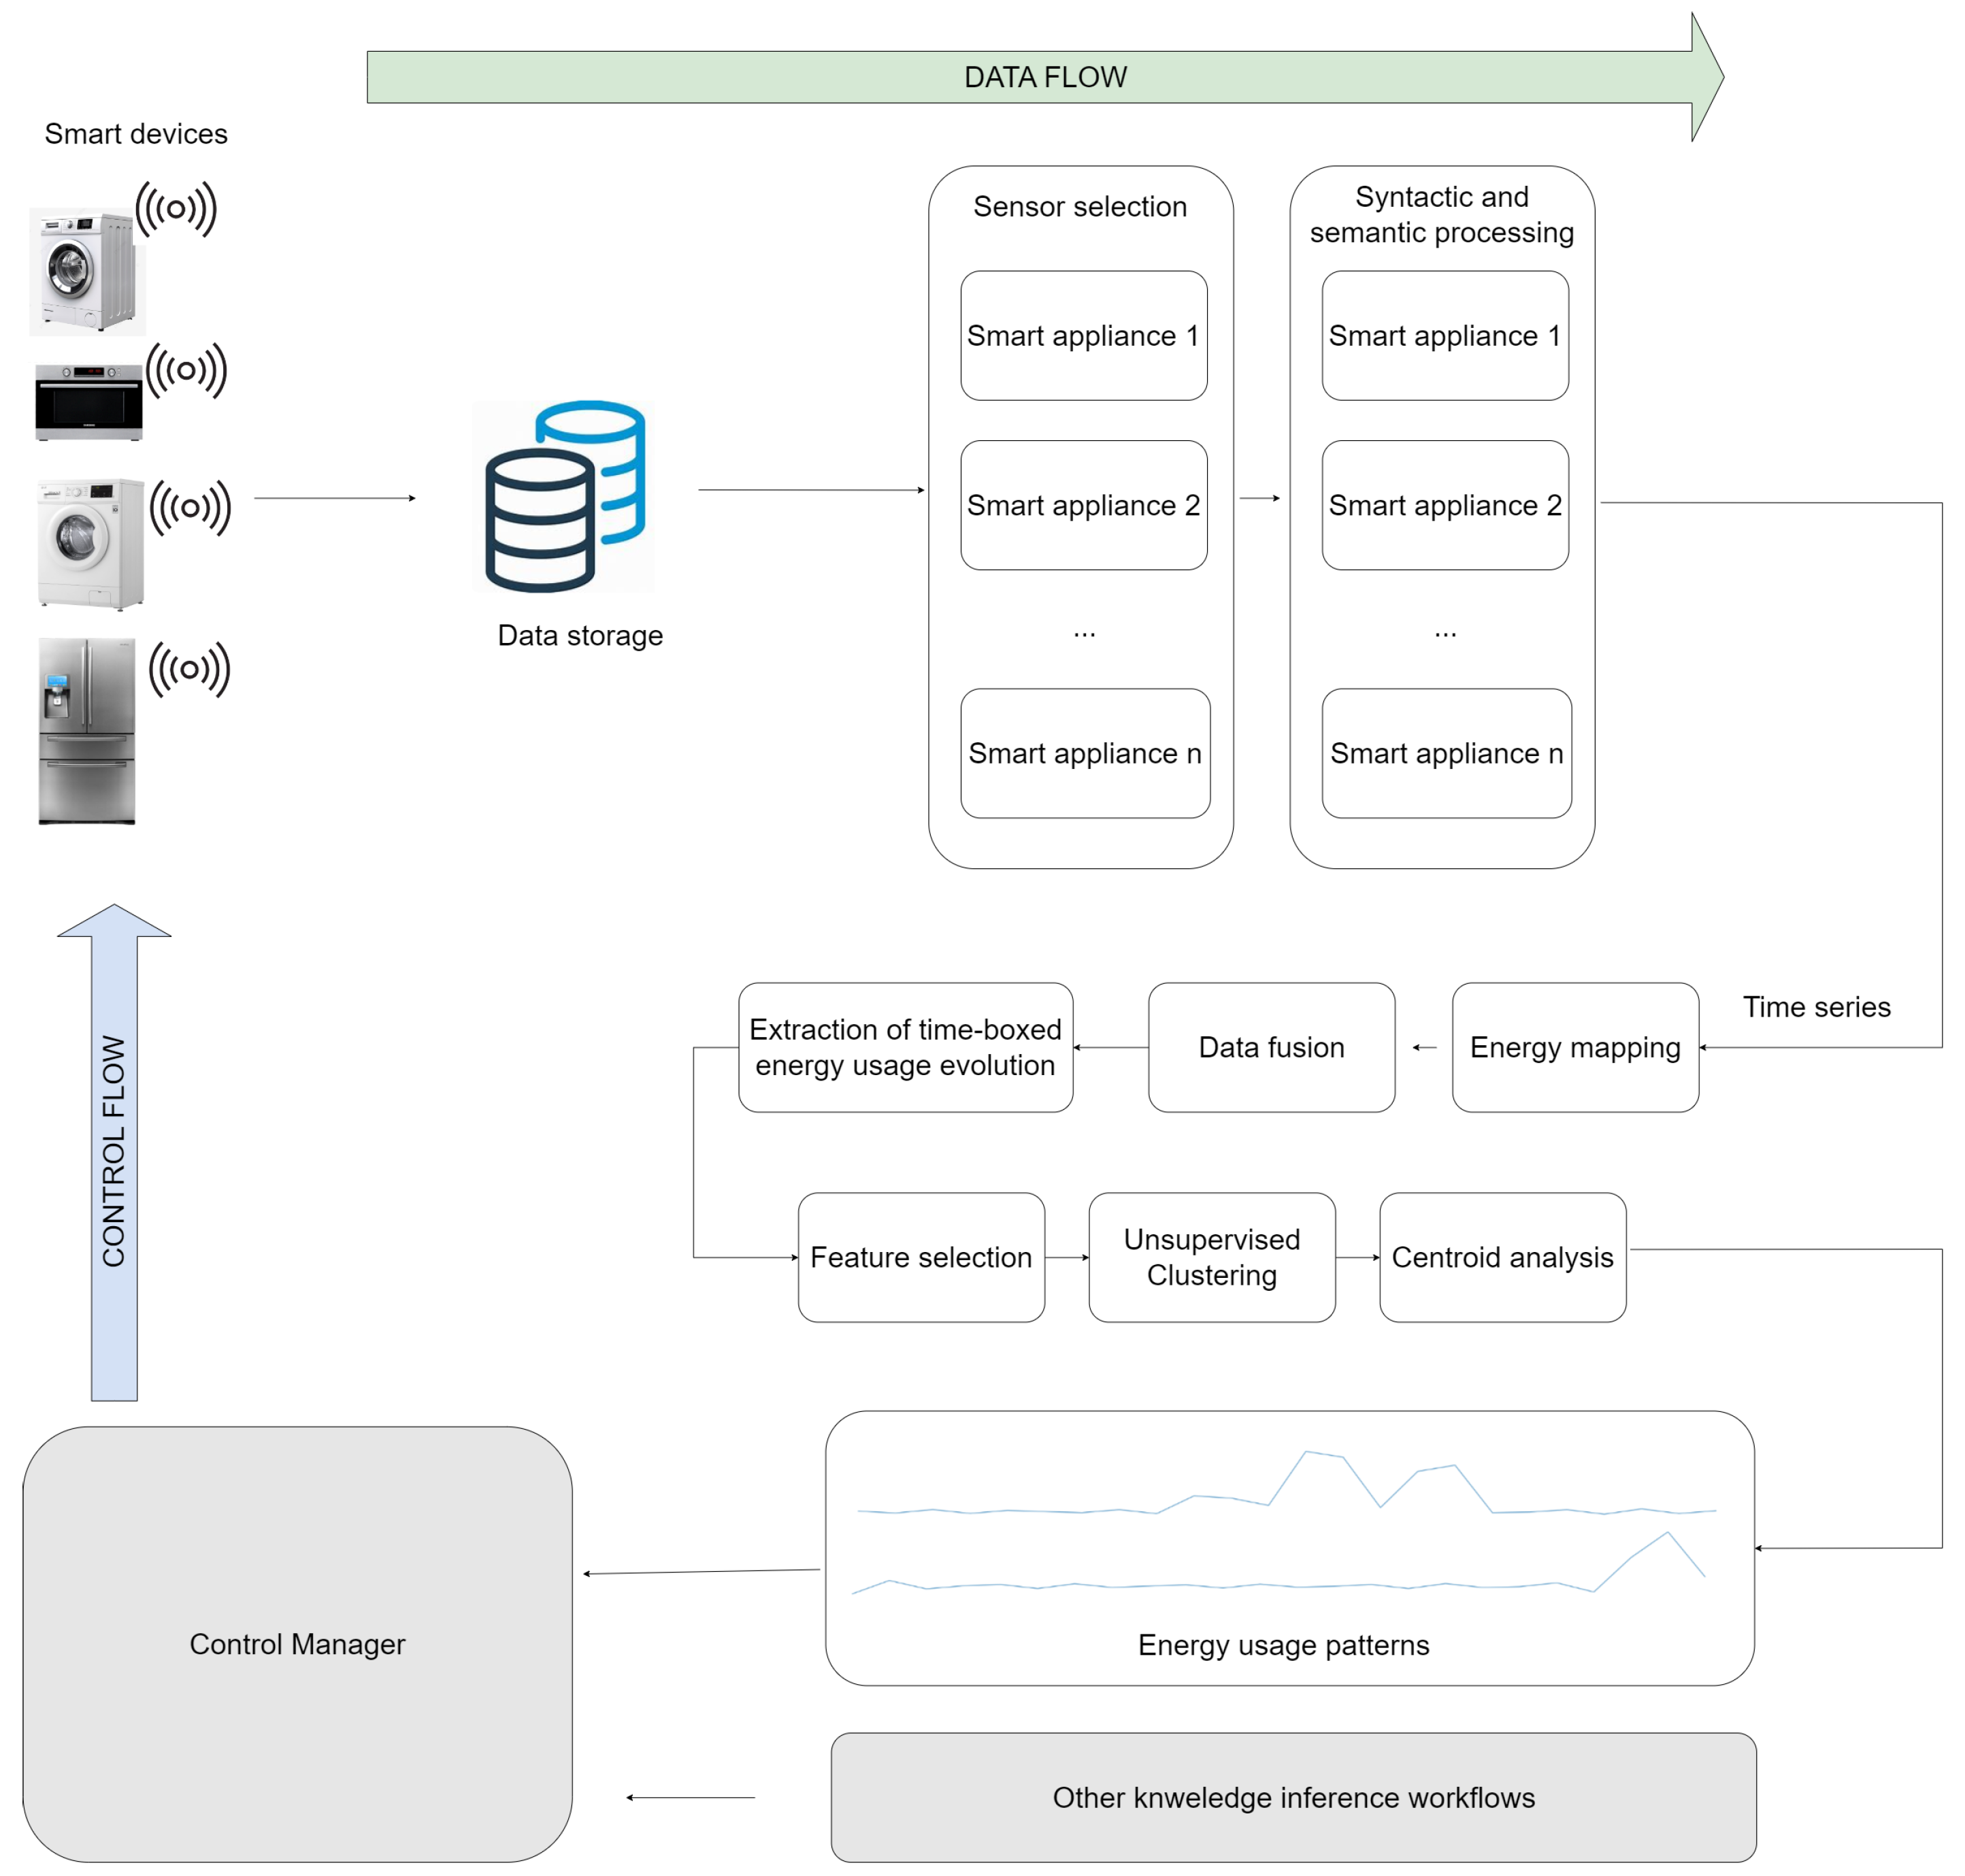
In Figure 1, we present the proposed pipeline for extracting daily electricity usage patterns from data generated by various smart home appliances integrated into a smart home architecture. The input for the data mining system is generated by various smart devices equipped with sensors capable of capturing different characteristics of the environment where the smart devices are deployed, as well as the interactions of the user with these smart devices. It is important to emphasize that the sensing information is given by sensors that are already deployed on the smart devices, not by external sensors. The devices shown in the figure do not represent the exact devices that are used for the experiments in this work. The devices currently present in the diagram are a symbolic representation of household smart devices equipped with sensors capable of measuring the interactions of the user with the devices. The sensor measurements are transmitted to cloud data storage. Using Big Data technologies, the relevant measurements are extracted for each. The extracted measurements differ based on the appliance type because each appliance can give insights about its usage and the corresponding energy usage with different measurements. For example, from a smart washing machine, we can extract the active running time to compute the energy because this type of smart device consumes energy while executing washing cycles, and it does not consume energy while idle. Other smart devices, such as refrigerators, can consume a rather constant amount of energy.
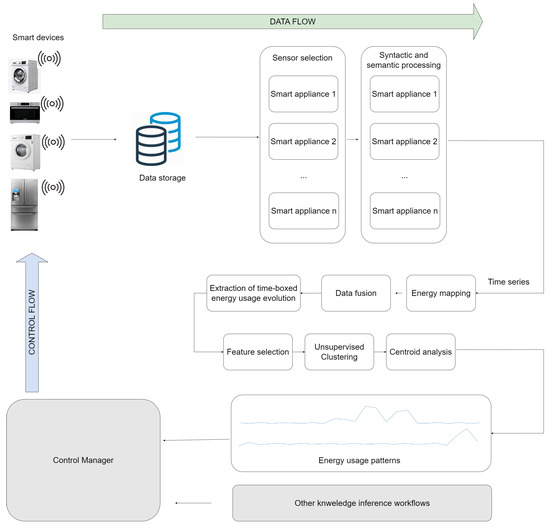
Figure 1.
High-level pipeline of the data fusion and electricity usage extraction system integrated into a smart home architecture.
After a business analysis of the available measurements for each device, a syntactic and semantic processing step is required to align the data with available processing tools that are suitable for time series, such as machine learning algorithms. This step is also specific to each device because each subset of measurements chosen at the precedent processing step is different. The result of this step is a time-series representation of the measurements relevant to electricity consumption. The result of this step is generically defined now because different measurements indicating energy can exist in the data. For example, some devices might directly measure the energy consumption and transmit these data, while for others, we might need to infer the electricity consumption. An example of such an inference would be the previously exemplified washing machine; we know that it consumes energy only while washing and it does not consume any (or very little) energy while idle. Knowing, in this case, the start and end of a washing cycle together with the energy consumption per unit of time is sufficient to compute the total energy consumption. The computation of the energy consumption based on the available measurements is performed in the next step of the proposed pipeline, the energy mapping phase.
After the energy mapping phase, the intermediary result is the energy usage for each appliance. A data fusion step combines all of these energy usages to obtain the total energy usage of the house. The goal of this paper is to extract daily patterns from the energy usage; hence, a time-splitting of the signal modeling the energy usage is performed. As a result, the total energy usage is split into daily usages. For each daily usage, a feature selection phase is applied to extract relevant features and to decrease the data dimensionality. The daily usages, now represented by a set of features, are given to an unsupervised clustering algorithm. The clustering phase groups the daily usages into clusters containing similar usages, represented by a centroid. The resulting centroids are the energy usage patterns identified in the historical data.
5. Experiments and Results
In this section, we present the experimental setup, the datasets used, and the results obtained by applying the proposed methodology for electricity consumption profiling. The experiments are performed in the cloud via the Databricks platform [41], a unified analytics platform designed for data engineering, data science, and collaborative data-driven decision making. It is built on top of Apache Spark and provides an integrated environment that simplifies the management of Big Data and enables scalable data processing and analytics.
5.1. Dataset Description
For the experimental part of this research, we use data generated from three categories of smart devices: refrigerators, washing machines, and tumble dryers. In our study, while we acknowledge the diverse range of smart devices in a typical smart home, we have specifically chosen to focus on refrigerators, washing machines, and tumble dryers to demonstrate the applicability of our methodology. These appliance categories were selected based on the appliance taxonomy that we defined in the theoretical background, allowing us to showcase how our approach can be effectively applied across different kinds of appliances within the smart home ecosystem.
The data are represented by the usage of the smart devices. The usage is measured with sensors of interactions existing in the smart devices and is dependent on the type of device. The usage of a smart refrigerator is measured with sensors tracking the closing and opening of the smart device. To measure the usage of a smart washing machine and smart tumble dryer, a rotor position sensor is used. However, the exact sensor is not relevant in this work because the considered inputs are usage events that are obtained from the data measured by the sensors applied in the smart devices. The considered usage events are the beginning and ending of a functioning program, which are further considered as the beginning and ending of a user’s interaction with that device. User interaction with each device is managed by the devices themselves, not by a management application.
To generate the refrigerator data, we applied the approach we proposed in [42], where a synthetic data generation framework is presented. The synthetic data are generated by emulating the syntactic and semantic characteristics of real data. We applied the synthetic data generation framework, and we generated usage data in a syntactic form of events: opening and closing the door of a refrigerator. In the case of the washing machine and tumble dryer, we simulated the data in a syntactic form of usage events: starting and ending a running cycle. We simulated the data based on inspection of the syntactic form of real sensor-generated data and on research performed in this domain. According to the findings reported in [20], a dryer is always used after or during a washing machine’s use. We inserted this finding into the rules governing the data generation process.
The following datasets were generated:
- DS1: We planted simple patterns to validate the proposed processing pipeline. The refrigerator usage pattern is described by two active periods during each day when the user interacts with the device (with events of opening and closing the door). For the washing machine, we planted the following pattern: each Tuesday, the user initiates a washing cycle (the same cycle each time). After the washing cycle is finished, the user initiates interaction with the tumble dryer by starting a program. Each Thursday, the user shows the same behavior, but at a different hour. On Saturday, the user initiates two washing cycles in the middle of the day. We have a total of four different usage patterns of the overall appliances, matching the number of energy consumption patterns that need to be extracted from the data by applying the proposed pipeline.
- DS2: For this dataset, we introduced complexity in the data by varying the starting time of each washing cycle. We kept the same usage for the refrigerator. The starting time was randomly selected from a two-hour span. The same number of energy consumption patterns are expected to be identified in the data.
- DS3: We kept the characteristics of DS1, but we varied the types of running programs for the washer and tumble dryer. As a result, there was a different time for the running cycles of the devices, leading to different values for the energy consumption in that period of the day. However, the same number of energy consumption patterns as in DS1 are expected to be identified in the data.
The time period of all datasets is six months. The first day for which data are generated according to the above-mentioned strategies is 19 March 2023, and the last day is 18 September 2023. The number of user interaction events depends on the type of appliance. For the smart refrigerator, we have a total of 3126 user interactions in this period of recording. For the tumble dryer and washing machine, the interaction consists of activating the running cycle, leading to a total of 96 user interaction events for each of the devices.
5.2. Syntactic and Semantic Processing
The generated data are represented by the sensors capturing the usage of the devices. From the syntactic form of usage events, we transform each signal into a time-series syntactic form according to the methodology proposed in [25].
As a result, the usage of the refrigerator is modeled by a signal with values 0 and 1, as described in Equation (5).
For the washing machine and tumble dryer, we represent the usage with a signal that has values of 0 and 1, as described in Equation (6).
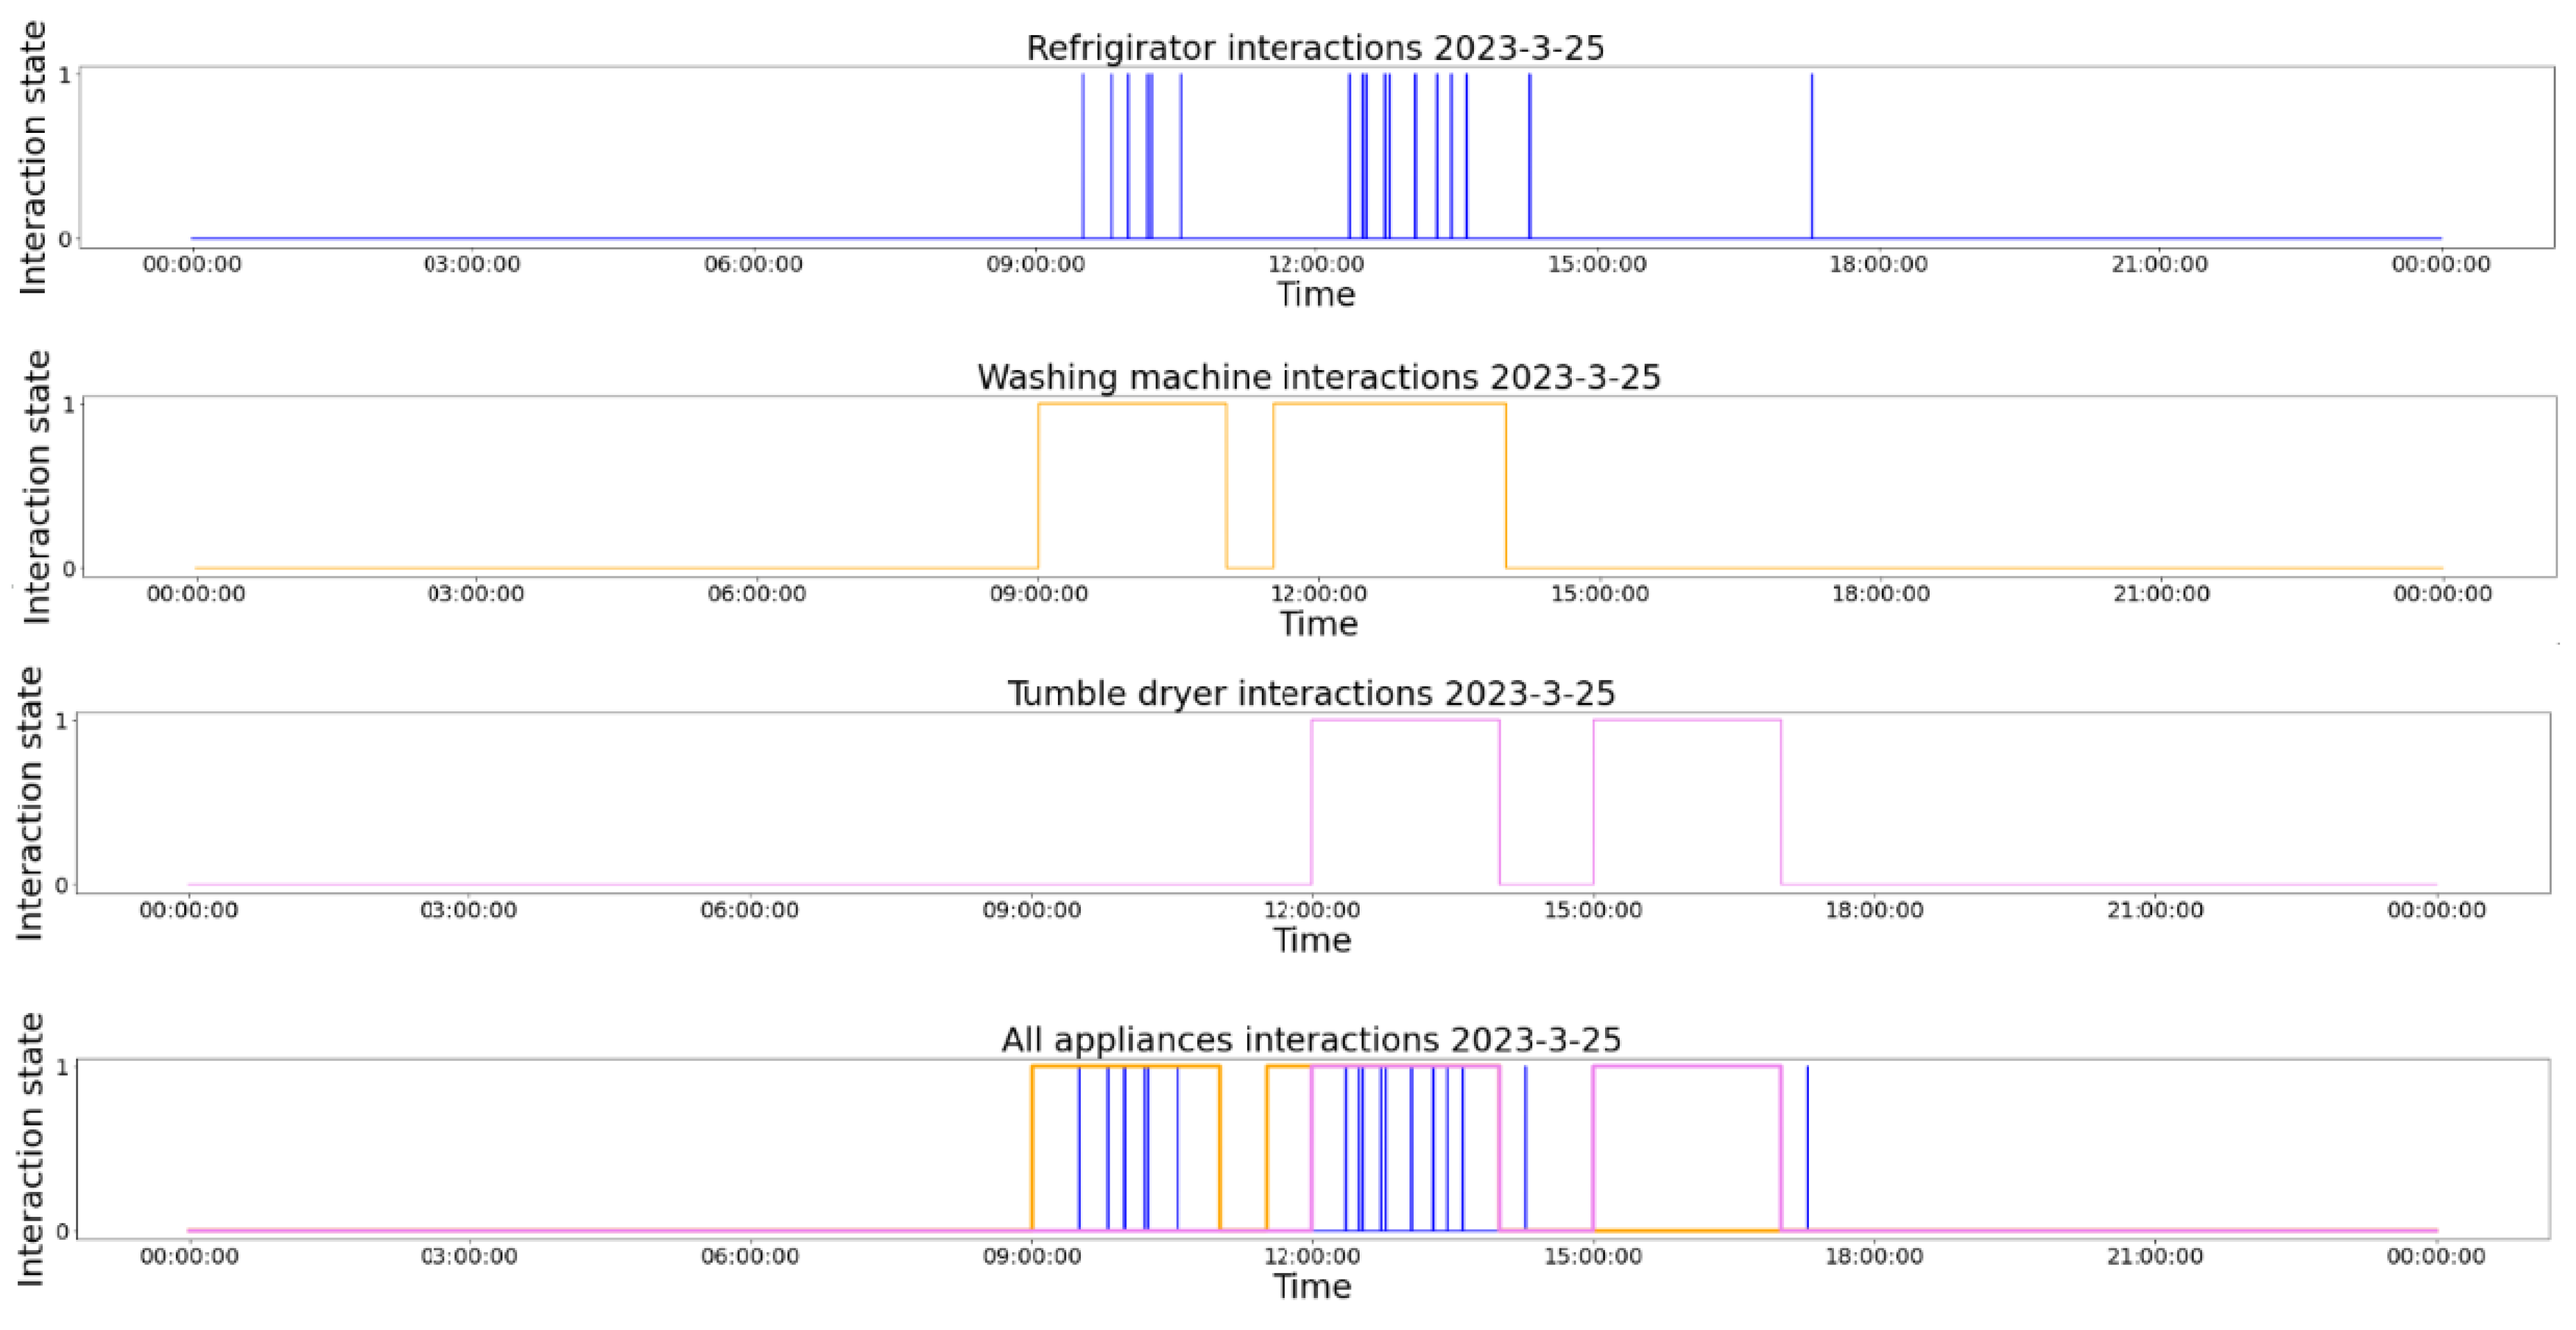
A visual representation of the time-series modeling of the usages of the three smart devices is presented in Figure 2. In the figure, we observe the usage of the refrigerator, the washing machine, and the tumble dryer in one day. The last section of the figure contains all of the usages in the same time period. The usage of the smart devices is taken from dataset DS1. We chose this day for exemplification because the interaction of the user with all of the smart devices is present.
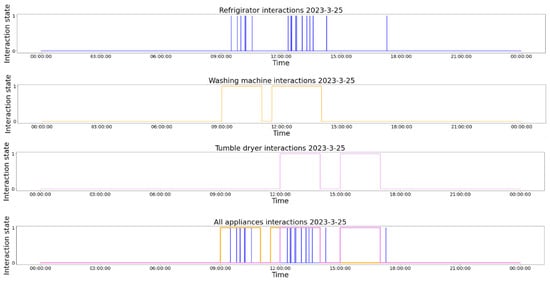
Figure 2.
Time-series representation of the daily usage of the smart devices (24 h of usage).
5.3. Energy Mapping and Data Fusion
To obtain an overview of the entire household energy consumption, we transform the usage signals into energy usage by applying energy mappings specific to each device according to Equation (2). For each appliance, we need to decide the typeparameter of the formula and the DSC value.
To determine the energy usage for the refrigerator, we assume a constant energy consumption, regardless of usage (as the refrigerator continuously consumes energy to maintain cooling). We acknowledge the simplification made here, as higher usage of the refrigerator would result in increased energy consumption, especially due to the warmer air entering the freezing cavities when the door is opened frequently. However, the energy fluctuations observed in the experiments conducted for this research are negligible compared to the overall energy usage caused by the washing machine and tumble dryer. Therefore, we classify the refrigerator with a ‘type’ parameter equal to INDEP. Since both the washing machine and tumble dryer only consume energy during their running cycles, the ‘type’ parameter for these appliances is set to DEP. The ‘type’ parameter and the corresponding DSC values for each device used in the experiments are presented in Table 1. The DSC values from Table 1 are a result of investigating the reported technical characteristics of the appliances available on the market at the current time.

Table 1.
Values of the parameters from Equation (2) for each device.
In Figure 3, we present the above transformation of the appliance usage signal into appliance energy consumption. The usage represented by the interactions with the smart devices is shown, and the obtained energy consumption for each device in the same time period is presented below.
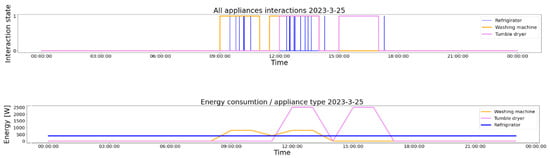
Figure 3.
Visual representation of the signals modeling the interactions with the smart devices and the corresponding energy usage recorded in 24 h. Each color represents the same device in both representations, and both visualizations are made in the same period of time.
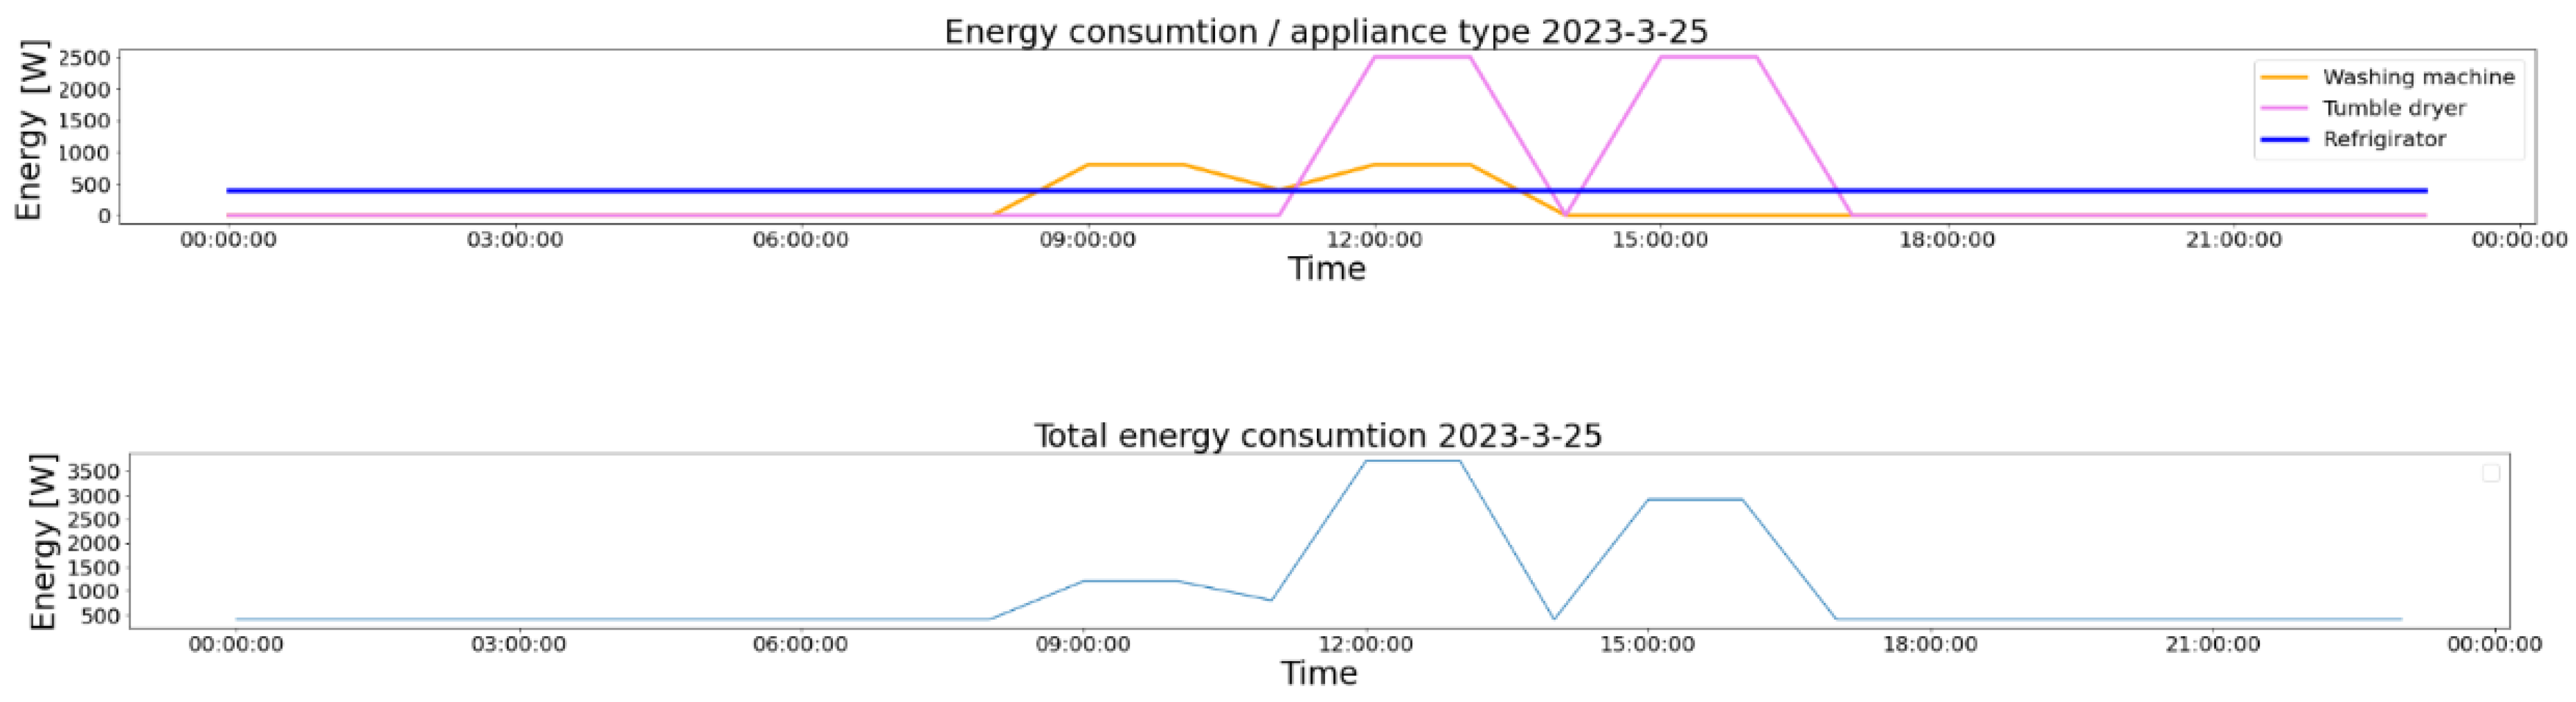
To obtain the total household energy consumption signal, we apply Equation (3). This step consists of adding the energy consumption signals obtained for each individual appliance. In Figure 4, we show the evolution of the individual energy consumption and the result of the data fusion in the same time period. In the upper part of the figure, the energy consumption for each device that is considered in the experimental setup is presented. Aligning on the exact time (the same day represented), the resulting total energy consumption is presented at the bottom of the figure (light blue). For both representations, on the OX axis is the time, and on the OY axis is the energy.
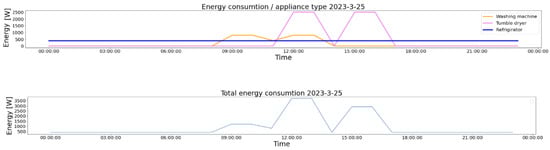
Figure 4.
Visual representation of the total daily energy consumption signal obtained from the individual energy consumption.
5.4. Feature Extraction and Clustering
Applying the FFT to time-series data enables the extraction of frequency-domain features, making the data suitable for the clustering step that follows. Following an empirical investigation, it was determined that the initial 10 coefficients of the FFT method would be chosen for integration into the clustering algorithm as features.
After this process, the events occurring during a single day of user interaction with the appliance were characterized by 20 real numbers, considering that each FFT coefficient comprised real and imaginary parts. To ensure uniformity across features, a normalization operation was executed on all of them by utilizing a min-max scaler [43].
For the clustering phase, the Python implementation of the DBSCAN algorithm [40] was utilized. It was configured with the Euclidean distance metric. The leaf size parameter was set to 30, while the epsilon parameter and the minimum sample parameter (representing the minimum number of points required to form a dense region) were determined empirically by performing the experiments presented in Table 2. The results presented in the table were aggregated for the entire historical dataset. Each dataset contained six months of records of user interactions with the device. For each device, given the fact that in the experiments, we looked for daily patterns, the historical data were split into days. Each day of the recording period was a point in the clustering phase. Given the synthetic nature of the data, we computed the F1-score (Equation (7)) because we evaluated the matching of the patterns assigned by the clustering algorithm (if any) with the pattern planted in the dataset.
Table 2.
Experiments performed in the clustering phase with DBSCAN clustering algorithms.
The obtained centroids corresponding to each cluster serve as a representation of the household energy consumption patterns. To revert to the original value space before normalization, the features constituting the centroid undergo de-normalization. Subsequently, the inverse Fourier transform (IFFT) is applied to these de-normalized centroid features.
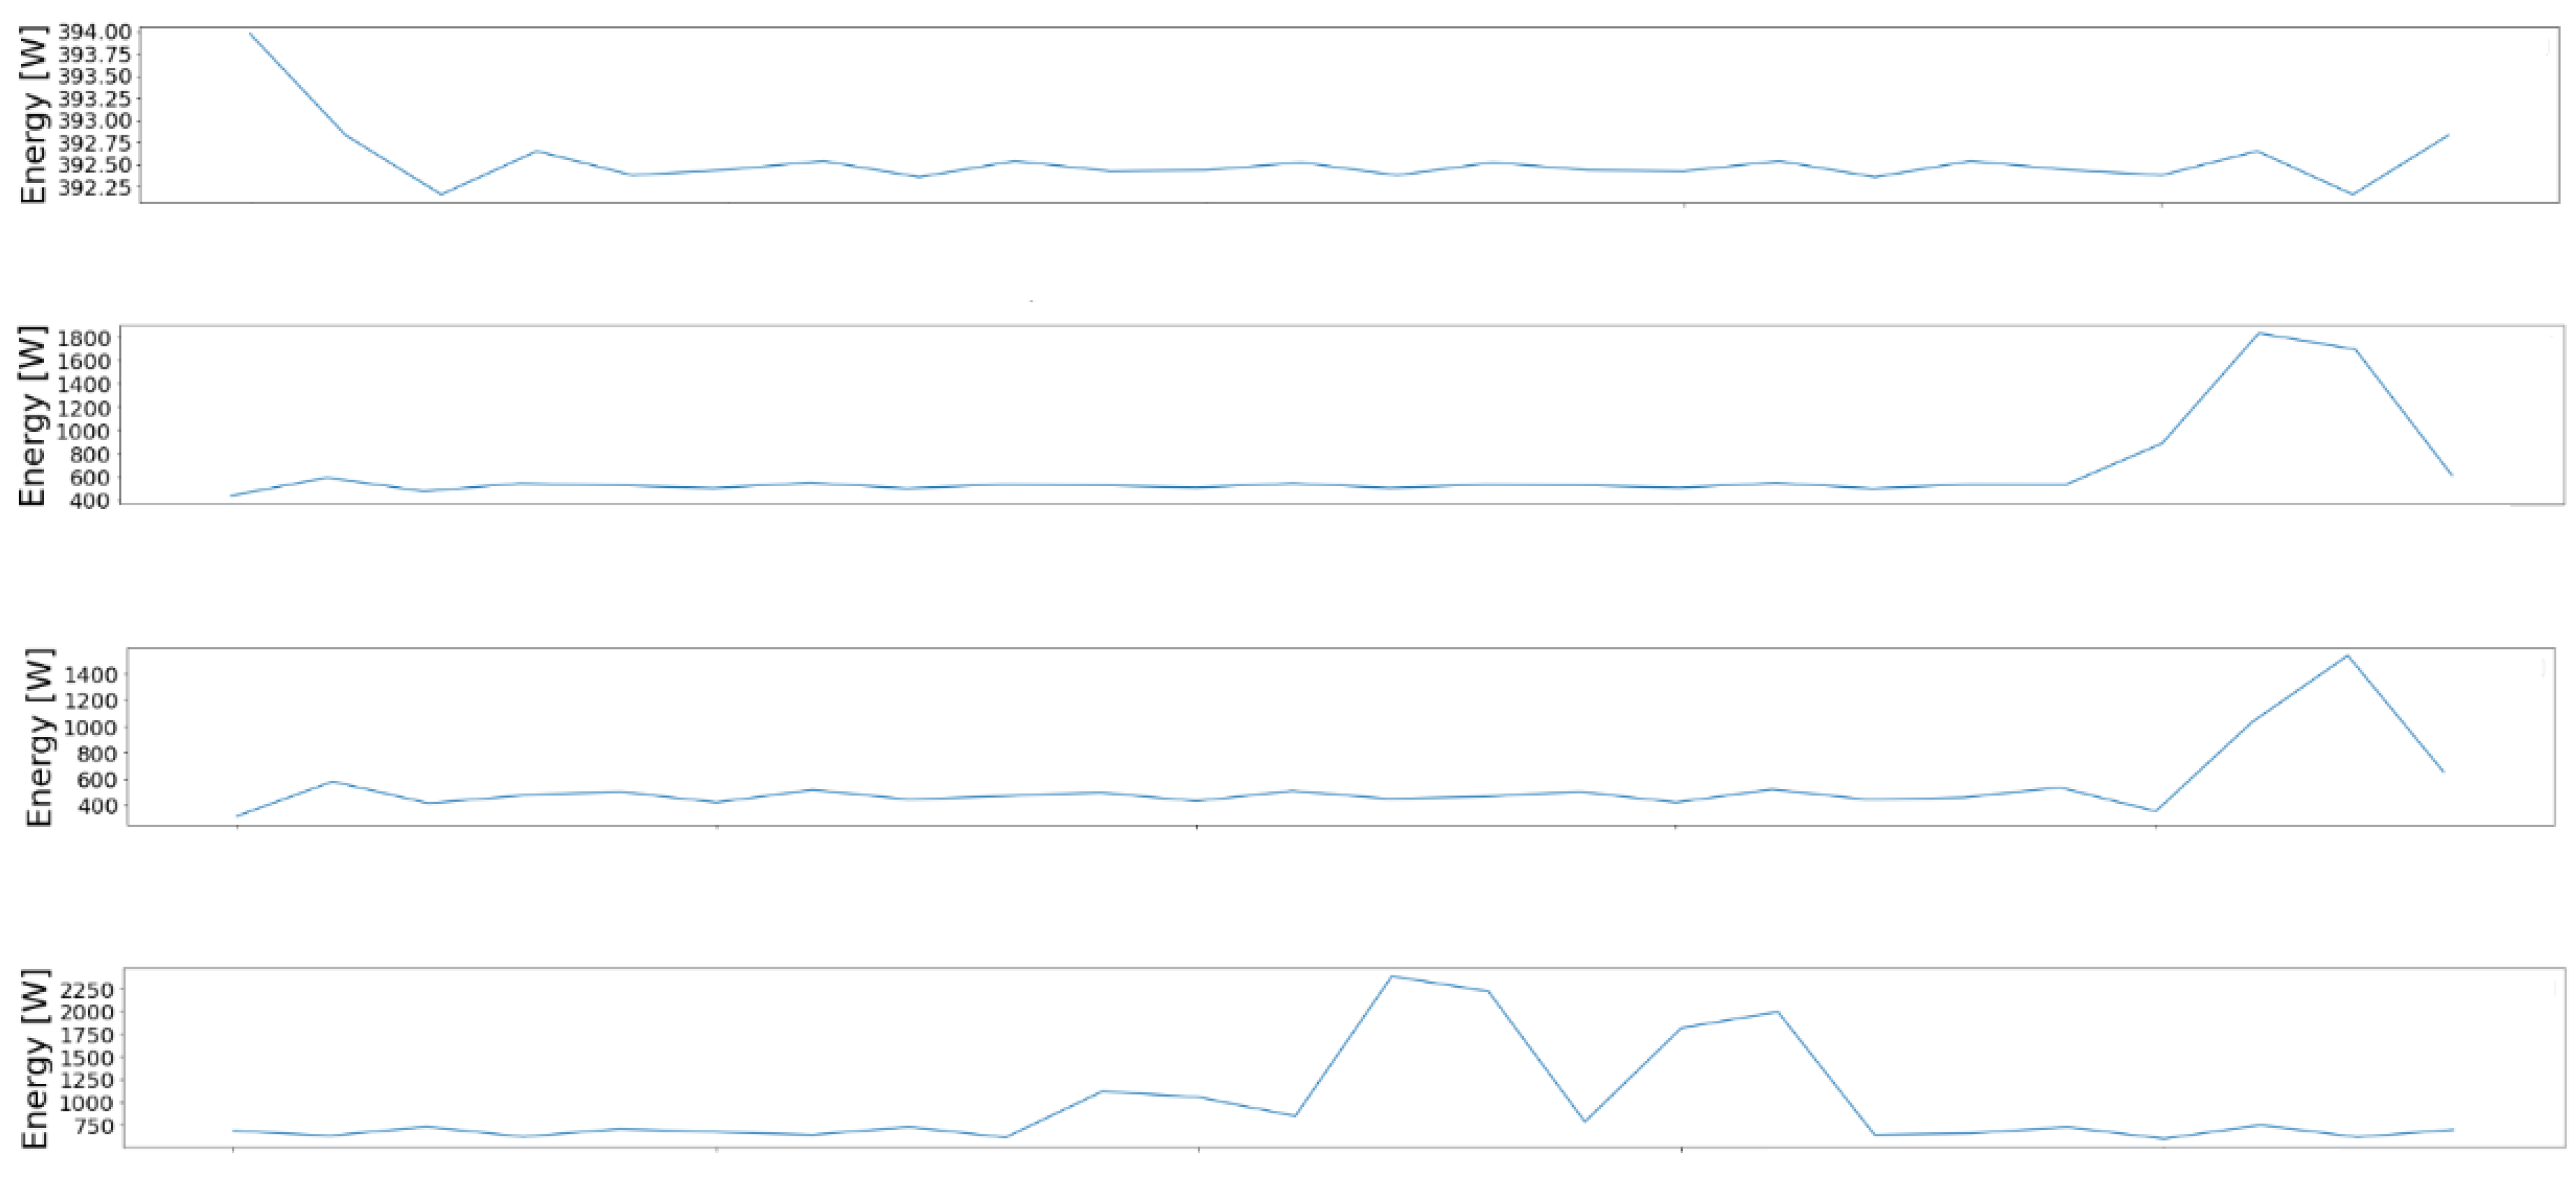
Figure 5 presents the results of applying the clustering phase of the proposed pipeline on dataset DS1. As we can see, four energy consumption patterns are correctly extracted.
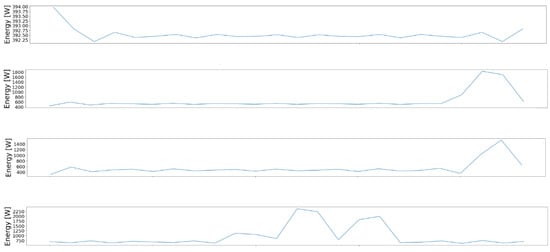
Figure 5.
Example of the daily energy consumption patterns obtained after applying de-normalization and the inverse FFT on the centroids obtained after clustering. On the OX axis, we represent the time, and on the OY axis, we represent the energy consumption measured in Watts per hour.
5.5. Discussion
The application of DBSCAN to electricity consumption data has provided valuable insights into the patterns present within the dataset. This section discusses the implications of the results obtained and addresses several key points raised during the analysis.
In Table 2, we observe that setting the MS parameter to 5 enables accurate inference of all patterns within the dataset, confirming the effectiveness of the proposed pipeline. Nonetheless, the simplicity of the patterns in dataset DS1 prompted the generation of DS2 and DS3 to introduce complexity. Remarkably, the proposed pipeline achieves favorable results even with the introduction of this complexity, represented by unknown factors in program execution and start times. Through our empirical study, we found that setting the EPS parameter to 0.65 maximizes the results. The EPS parameter determines the maximum distance between two samples that are considered neighbors, with smaller values promoting the formation of multiple clusters and stricter similarity between samples. This aligns with the rules and results of data generation, as randomness in the program type influences the device runtime and discrepancies in the total energy consumption values. However, it is crucial to ensure that such samples are grouped together, particularly when the program start times are identical, as in the case of DS3. Having a larger value for the EPS parameter addresses this situation.
The experiments are focused on extracting daily patterns. However, patterns in the usage can be more complex. The considered time frame can vary, which is why the time window for the searched pattern is considered a parameter of the processing pipeline. Taking into account that the solution works on historical data for finding patterns, not on real-time flow incoming from the devices, the corresponding time frame can be found in a trial-and-error manner by varying the time window.
5.5.1. Scalability
When discussing the scalability of the method, the most important aspect is the representation of the usage, which is different for each device. The sensor selection step and syntactic and semantic processing are specific to each device. Once the interaction state equation is obtained (similarly to the ones presented in Equations (5) and (6) for the devices considered in this work), the methodology of integrating the data into the existing framework is prepared for scaling. The addition fusion model is adaptable to any scale because an increase in the number of devices will generate an overall increase in the energy scale. The rest of the processing pipeline (feature extraction and clustering) is resilient to these changes.
5.5.2. Applicability
From the perspective of applicability, the discovered usage patterns can be integrated into the control flow described in Figure 1. Based on the discovered daily patterns, the Control Manager component from the referenced high-level pipeline (Figure 1) can associate a pattern with its placement in time. This is an entire research topic that deserves special attention. In [44], we present an unsupervised method that uses an explainable AI component to discover when a certain pattern occurs in time. The methodology can be extended to the energy consumption patterns extracted with the current approach. This will lead to extracted information that will provide an explanation for a pattern’s occurrence. A symbolic representation of time-dependent rules governing the occurrence of certain energy consumption patterns is presented in Figure 6.
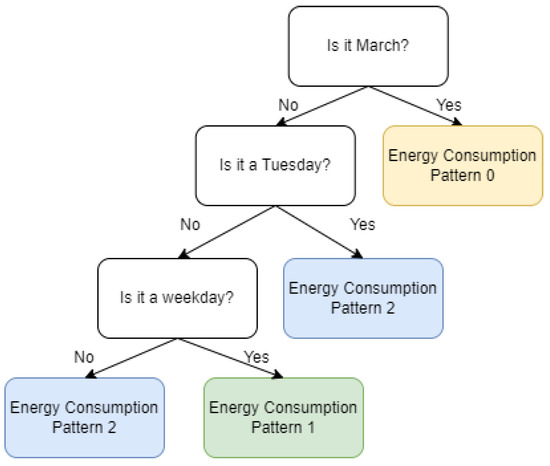
Figure 6.
Example of the representation of time-dependent rules governing the occurrence of certain energy consumption patterns.
The Control Manager component can further utilize this information to associate a timeframe for starting smart appliances that are flexible in a period of time where the general energy consumption is low. For example, given the major energy consumption patterns found in the dataset, the following patterns can be considered:
- Pattern 1—high usage in the morning between 8 a.m. and 10 a.m.
- Pattern 2—high usage in the evening between 6 p.m. and 11 p.m.
After associating the mined patterns with the time-placement rules of Pattern 1 occurring every weekday and Pattern 2 occurring every weekend using the mentioned methodology, the Control Manager will program the air conditioner of that household to start in the afternoon if it is a weekday to encourage a flattened energy consumption while preserving the comfort of the household’s inhabitants.
6. Conclusions
In this paper, we presented a novel approach for electricity consumption profiling in households through the fusion of sensor data from smart devices and the application of data mining techniques. Our methodology involved integrating input data representing the usage of individual appliances to compute the total energy consumption per household. Subsequently, we applied unsupervised clustering algorithms to analyze the resulting time-series data representing daily energy consumption patterns.
Through the experimental validation of synthetically generated datasets, we demonstrate the effectiveness of our approach in identifying and characterizing energy consumption patterns within households. We used three datasets consisting of events of user interactions with smart appliances over a period of six months. The efficacy of our proposal is proven by the experiments made with DS1, a dataset containing simple patterns, where in 100% of the cases, the pipeline correctly categorizes the existing electricity patterns. For complex patterns, which were planted in two separate datasets used in the experiments, we obtained 0.895 and 0.952 for the F1-score. Since this study relies on proprietary data that were generated in the context of this study and are not publicly available, it is not feasible to directly compare our results with those in the existing literature.
The insights gained from our analysis can inform energy management strategies, enabling households to optimize their energy usage, reduce their costs, and contribute to environmental sustainability efforts.
While our methodology has shown promising results, there are several avenues for future research and improvement. One area of interest is the refinement of clustering algorithms to better capture subtle variations and anomalies in energy consumption patterns. Varying the clustering algorithm or exploring other feature extraction algorithms is also a potential research direction for improving the proposed pipeline. Additionally, the integration of additional data sources, such as occupancy information, could further enhance the accuracy and granularity of energy consumption profiling. Addressing uncertainty in the context of different equipment usage patterns is another considered future research direction.
Overall, our work contributes to the growing body of research aimed at leveraging sensor data and data mining techniques for energy management and sustainability initiatives. By providing households with actionable insights into their energy usage patterns, we aim to empower individuals to make informed decisions and take proactive measures toward efficient energy consumption.
Author Contributions
Conceptualization, R.T.; Data curation, R.T. and R.P. (Raluca Portase); Formal analysis, R.T. and R.P. (Raluca Portase); Investigation, R.T.; Methodology, R.T.; Project administration, R.T., R.P. (Raluca Portase) and R.P. (Rodica Potolea); Resources, R.T.; Software, R.T.; Supervision, R.P. (Rodica Potolea); Validation, R.T., R.P. (Raluca Portase) and R.P. (Rodica Potolea); Visualization, R.T.; Writing—original draft, R.T.; Writing—review and editing, R.T. and R.P. (Raluca Portase). All authors have read and agreed to the published version of the manuscript.
Funding
This research received no external funding.
Data Availability Statement
The datasets used in the experiments are published on the Kaggle platform and are available at https://www.kaggle.com/datasets/ramonatolas/hosehold-smart-device-usage (accessed on 11 June 2024).
Conflicts of Interest
The authors declare no conflicts of interest.
Abbreviations
The following abbreviations are used in this manuscript:
| FFT | Fast Fourier transform |
| IFFT | Inverse fast Fourier transform |
| DBSCAN | Density-based spatial clustering |
| DSC | Domain-specific consumption |
References
- Gajowniczek, K.; Bator, M.; Ząbkowski, T. Whole time series data streams clustering: Dynamic profiling of the electricity consumption. Entropy 2020, 22, 1414. [Google Scholar] [CrossRef] [PubMed]
- Yang, J.; Zhao, J.; Wen, F.; Dong, Z. A model of customizing electricity retail prices based on load profile clustering analysis. IEEE Trans. Smart Grid 2018, 10, 3374–3386. [Google Scholar] [CrossRef]
- Khan, I. A survey-based electricity demand profiling method for developing countries: The case of urban households in Bangladesh. J. Build. Eng. 2021, 42, 102507. [Google Scholar] [CrossRef]
- Tang, S.; Huang, Q.; Li, X.Y.; Wu, D. Smoothing the energy consumption: Peak demand reduction in smart grid. In Proceedings of the 2013 Proceedings IEEE INFOCOM, Turin, Italy, 14–19 April 2013; IEEE: Piscataway, NJ, USA, 2013; pp. 1133–1141. [Google Scholar]
- Alanazi, S.; Dabbagh, M.; Hamdaoui, B.; Guizani, M.; Zorba, N. Reducing data center energy consumption through peak shaving and locked-in energy avoidance. IEEE Trans. Green Commun. Netw. 2017, 1, 551–562. [Google Scholar] [CrossRef]
- Lazaroiu, G.C.; Longo, M.; Roscia, M.; Pagano, M. Comparative analysis of fixed and sun tracking low power PV systems considering energy consumption. Energy Convers. Manag. 2015, 92, 143–148. [Google Scholar] [CrossRef]
- Shafqat, W.; Lee, K.T.; Kim, D.H. A Comprehensive Predictive-Learning Framework for Optimal Scheduling and Control of Smart Home Appliances Based on User and Appliance Classification. Sensors 2023, 23, 127. [Google Scholar] [CrossRef] [PubMed]
- Cetin, K.S.; O’Neill, Z. Smart meters and smart devices in buildings: A review of recent progress and influence on electricity use and peak demand. Curr. Sustain./Renew. Energy Rep. 2017, 4, 1–7. [Google Scholar] [CrossRef]
- Barai, G.R.; Krishnan, S.; Venkatesh, B. Smart metering and functionalities of smart meters in smart grid-a review. In Proceedings of the 2015 IEEE Electrical Power and Energy Conference (EPEC), London, ON, Canada, 26–28 October 2015; IEEE: Piscataway, NJ, USA, 2015; pp. 138–145. [Google Scholar]
- Mogles, N.; Walker, I.; Ramallo-González, A.P.; Lee, J.; Natarajan, S.; Padget, J.; Gabe-Thomas, E.; Lovett, T.; Ren, G.; Hyniewska, S.; et al. How smart do smart meters need to be? Build. Environ. 2017, 125, 439–450. [Google Scholar] [CrossRef]
- George, D.; Swan, L.G. A method for distinguishing appliance, lighting and plug load profiles from electricity ‘smart meter’datasets. Energy Build. 2017, 134, 212–222. [Google Scholar] [CrossRef]
- Czétány, L.; Vámos, V.; Horváth, M.; Szalay, Z.; Mota-Babiloni, A.; Deme-Bélafi, Z.; Csoknyai, T. Development of electricity consumption profiles of residential buildings based on smart meter data clustering. Energy Build. 2021, 252, 111376. [Google Scholar] [CrossRef]
- Rausser, G.; Strielkowski, W.; Štreimikienė, D. Smart meters and household electricity consumption: A case study in Ireland. Energy Environ. 2018, 29, 131–146. [Google Scholar] [CrossRef]
- Mitra, A.; Trystram, D.; Cerin, C. Privacy Sensitive Building Monitoring Through Generative Sensors. In Proceedings of the 2024 International Conference on Internet of Things, Big Data and Secuirty (IoTBDS), Angers, France, 28–30 April 2024. [Google Scholar]
- Kim, Y.; Schmid, T.; Charbiwala, Z.M.; Srivastava, M.B. ViridiScope: Design and implementation of a fine grained power monitoring system for homes. In Proceedings of the 11th International Conference on Ubiquitous Computing, Orlando, FL, USA, 30 September–3 October 2009; pp. 245–254. [Google Scholar]
- Ruzzelli, A.G.; Nicolas, C.; Schoofs, A.; O’Hare, G.M. Real-time recognition and profiling of appliances through a single electricity sensor. In Proceedings of the 2010 7th Annual IEEE Communications Society Conference on Sensor, Mesh and Ad Hoc Communications and Networks (SECON), Boston, MA, USA, 21–25 June 2010; IEEE: Piscataway, NJ, USA, 2010; pp. 1–9. [Google Scholar]
- Nordahl, C.; Boeva, V.; Grahn, H.; Persson Netz, M. Profiling of household residents’ electricity consumption behavior using clustering analysis. In Proceedings of the Computational Science—ICCS 2019: 19th International Conference (Part V 19), Faro, Portugal, 12–14 June 2019; Springer: Berlin/Heidelberg, Germany, 2019; pp. 779–786. [Google Scholar]
- Duarte, O.G.; Rosero, J.A.; Pegalajar, M.d.C. Data Preparation and Visualization of Electricity Consumption for Load Profiling. Energies 2022, 15, 7557. [Google Scholar] [CrossRef]
- Ding, B.; Li, Z.; Li, Z.; Xue, Y.; Chang, X.; Su, J.; Jin, X.; Sun, H. A CCP-based distributed cooperative operation strategy for multi-agent energy systems integrated with wind, solar, and buildings. Appl. Energy 2024, 365, 123275. [Google Scholar] [CrossRef]
- Honarvar, A.R.; Sami, A. Extracting usage patterns from power usage data of homes’ appliances in smart home using big data platform. Int. J. Inf. Technol. Web Eng. (IJITWE) 2016, 11, 39–50. [Google Scholar] [CrossRef]
- Han, J.; Pei, J.; Mortazavi-Asl, B.; Pinto, H.; Chen, Q.; Dayal, U.; Hsu, M. Prefixspan: Mining sequential patterns efficiently by prefix-projected pattern growth. In Proceedings of the 17th International Conference on Data Engineering, Heidelberg, Germany, 2–6 April 2001; IEEE: Piscataway, NJ, USA, 2001; pp. 215–224. [Google Scholar]
- Chen, Y.C.; Ko, Y.L.; Peng, W.C. An intelligent system for mining usage patterns from appliance data in smart home environment. In Proceedings of the 2012 Conference on Technologies and Applications of Artificial Intelligence, Tainan, Taiwan, 16–18 November 2012; IEEE: Piscataway, NJ, USA, 2012; pp. 319–322. [Google Scholar]
- Alimi, O.A.; Ouahada, K. Smart home appliances scheduling to manage energy usage. In Proceedings of the 2018 IEEE 7th International Conference on Adaptive Science & Technology (ICAST), Accra, Ghana, 22–24 August 2018; IEEE: Piscataway, NJ, USA, 2018; pp. 1–5. [Google Scholar]
- Huber, P.; Gerber, M.; Rumsch, A.; Paice, A. Prediction of domestic appliances usage based on electrical consumption. Energy Inform. 2018, 1, 265–271. [Google Scholar] [CrossRef]
- Tolas, R.; Portase, R.; Dinsoreanu, M.; Potolea, R. Mining user behavior: Inference of time-boxed usage patterns from household generated data. In Proceedings of the eKNOW 2023, the Fifteenth International Conference on Information, Process, and Knowledge Management, Venice, Italy, 24–28 April 2023. [Google Scholar]
- Barandas, M.; Folgado, D.; Fernandes, L.; Santos, S.; Abreu, M.; Bota, P.; Liu, H.; Schultz, T.; Gamboa, H. TSFEL: Time Series Feature Extraction Library. SoftwareX 2020, 11, 100456. [Google Scholar] [CrossRef]
- Lin, J.; Williamson, S.; Borne, K.; DeBarr, D. Pattern recognition in time series. Adv. Mach. Learn. Data Min. Astron. 2012, 1, 3. [Google Scholar]
- Nikolai, W.; Schlegl, T.; Deuse, J. Feature extraction for time series classification using univariate descriptive statistics and dynamic time warping in a manufacturing environment. In Proceedings of the 2021 IEEE 2nd International Conference on Big Data, Artificial Intelligence and Internet of Things Engineering (ICBAIE), Nanchang, China, 26–28 March 2021; IEEE: Piscataway, NJ, USA, 2021; pp. 762–768. [Google Scholar]
- Herff, C.; Krusienski, D.J. Extracting features from time series. In Fundamentals of Clinical Data Science; SpringerOpen: New York, NY, USA, 2019; pp. 85–100. [Google Scholar]
- Lu, Y.; Tang, J. On time-frequency domain feature extraction of wave signals for structural health monitoring. Measurement 2018, 114, 51–59. [Google Scholar] [CrossRef]
- Qiao, H.; Wang, T.; Wang, P.; Qiao, S.; Zhang, L. A time-distributed spatiotemporal feature learning method for machine health monitoring with multi-sensor time series. Sensors 2018, 18, 2932. [Google Scholar] [CrossRef] [PubMed]
- Wang, W.K.; Chen, I.; Hershkovich, L.; Yang, J.; Shetty, A.; Singh, G.; Jiang, Y.; Kotla, A.; Shang, J.Z.; Yerrabelli, R.; et al. A systematic review of time series classification techniques used in biomedical applications. Sensors 2022, 22, 8016. [Google Scholar] [CrossRef] [PubMed]
- Mörchen, F. Time Series Feature Extraction for Data Mining Using DWT and DFT; Philipps-Marburg University: Marburg, Germany, 2003. [Google Scholar]
- Alegeh, N.; Thottoli, M.; Mian, N.; Longstaff, A.; Fletcher, S. Feature extraction of time-series data using dwt and fft for ballscrew condition monitoring. In Proceedings of the Advances in Manufacturing Technology XXXIV: Proceedings of the 18th International Conference on Manufacturing Research, Incorporating the 35th National Conference on Manufacturing Research, Derby, UK, 7–10 September 2021; IOS Press: Amsterdam, The Netherlands, 2021; Volume 15, p. 402. [Google Scholar]
- Khan, K.; Rehman, S.U.; Aziz, K.; Fong, S.; Sarasvady, S. DBSCAN: Past, present and future. In Proceedings of the The Fifth International Conference on the Applications of Digital Information and Web Technologies (ICADIWT 2014), Bangalore, India, 17–19 February 2014; pp. 232–238. [Google Scholar] [CrossRef]
- Ester, M.; Kriegel, H.P.; Sander, J.; Xu, X. A Density-Based Algorithm for Discovering Clusters in Large Spatial Databases with Noise. In Proceedings of the Second International Conference on Knowledge Discovery and Data Mining (KDD’96), Portland, OR, USA, 2–4 August 1996; AAAI Press: Washington, DC, USA, 1996; pp. 226–231. [Google Scholar]
- Sander, J.; Ester, M.; Kriegel, H.P.; Xu, X. Density-Based Clustering in Spatial Databases: The Algorithm GDBSCAN and Its Applications. Data Min. Knowl. Discov. 1998, 2, 169–194. [Google Scholar] [CrossRef]
- Hinneburg, A.; Keim, D.A. An Efficient Approach to Clustering in Large Multimedia Databases with Noise. In Proceedings of the Fourth International Conference on Knowledge Discovery and Data Mining (KDD’98), New York, NY, USA, 27–31 August 1998; AAAI Press: Washington, DC, USA, 1998; pp. 58–65. [Google Scholar]
- Campello, R.J.G.B.; Kröger, P.; Sander, J.; Zimek, A. Density-based clustering. WIREs Data Min. Knowl. Discov. 2020, 10, e1343. [Google Scholar] [CrossRef]
- Scikit-Learn. DBSCAN. Available online: https://scikit-learn.org/stable/modules/generated/sklearn.cluster.DBSCAN.html (accessed on 19 January 2023).
- DataBricks. Available online: https://www.databricks.com/ (accessed on 26 January 2023).
- Tolas, R.; Portase, R.; Potolea, R. GeMSyD: Generic Framework for Synthetic Data Generation. Data 2024, 9, 14. [Google Scholar] [CrossRef]
- Scikit-learn MinMaxScaler. Available online: https://scikit-learn.org/stable/modules/generated/sklearn.preprocessing.MinMaxScaler.html (accessed on 11 June 2024).
- Tolas, R.; Portase, R.; Lemnaru, C.; Dinsoreanu, M.; Potolea, R. Unsupervised Clustering and Explainable AI for Unveiling Behavioral Variations Across Time in Home-Appliance Generated Data. In Proceedings of the International Conference on Information Integration and Web Intelligence, Denpasar, Indonesia, 4–6 December 2023; Springer: Berlin/Heidelberg, Germany, 2023; pp. 147–161. [Google Scholar]


Disclaimer/Publisher’s Note: The statements, opinions and data contained in all publications are solely those of the individual author(s) and contributor(s) and not of MDPI and/or the editor(s). MDPI and/or the editor(s) disclaim responsibility for any injury to people or property resulting from any ideas, methods, instructions or products referred to in the content. |
© 2024 by the authors. Licensee MDPI, Basel, Switzerland. This article is an open access article distributed under the terms and conditions of the Creative Commons Attribution (CC BY) license (https://creativecommons.org/licenses/by/4.0/).