Abstract
The significant differences in target scales of remote sensing images lead to remarkable variations in visual features, posing significant challenges for feature extraction, fusion, regression, and classification. For example, models frequently struggle to capture features of targets across all scales, inadequately consider the weights and importance of features at different scales during fusion, and encounter accuracy limitations when detecting targets of varying scales. To tackle these challenges, we proposes a Scale-Robust Feature Aggregation and Diffusion Network (SRFAD-Net) for remote sensing target detection. This model includes a Scale-Robust Feature Network (SRFN), an Adaptive Feature Aggregation and Diffusion (AFAD) module, and a Focaler-GIoU Loss. SRFN extracts scale-robust features by constructing a multi-scale pyramid. It includes a downsampling (ADown) module that combines the advantages of average pooling and max pooling, effectively preserving background information and salient features. This further enhances the network’s ability to handle targets of varying scales and shapes. The introduced Deformable Attention(DAttention) mechanism captures target features effectively through adaptive adjustment of the receptive field’s shape and size, reducing background clutter and substantially enhancing the model’s performance in detecting distant objects. In the feature fusion stage, we propose the AFAD module, which utilizes a dimension-adaptive perceptual selection mechanism and parallel depthwise convolutional operations to precisely aggregate multi-channel information. It then employs a diffusion mechanism to spread contextual information across various scales, greatly improving the network’s ability to extract and fuse features across multiple scales. For the detection head, we adopt the Focaler-GIoU Loss, leveraging its advantages in handling non-overlapping bounding boxes, effectively alleviating the difficulty of localization caused by scale variations. We have undertaken experiments on two widely utilized aerial target datasets: the Remote Sensing Scene Object Detection Dataset (RSOD) and NWPU VHR-10, which is a high-resolution object detection dataset from Northwestern Polytechnical University. The findings of these experiments clearly illustrate that SRFAD-Net surpasses the performances of mainstream detectors.
1. Introduction
Remote sensing images, a crucial technological tool for acquiring information about the Earth’s surface, have demonstrated their irreplaceable potential for applications in environmental monitoring, urban development, and military surveillance. However, as remote sensing technology continues to advance rapidly, the speed of generating remote sensing data has sharply increased. Identifying target objects accurately and efficiently from vast remote sensing images has become a significant challenge in contemporary scientific research. In recent years, the flourishing development of deep learning technology has opened up a new research direction for the field of remote sensing image data analysis. Deep learning, with its outstanding feature extraction and learning capabilities, significantly enhances the precision of object detection and recognition in remote sensing applications.
Object detection frameworks are generally divided into two main categories: one-stage detectors and two-stage detectors. Two-stage detectors first extract Regions of Interest (RoI) and then use detection heads to classify the RoI features into target categories and regress their positions. Typical representatives include Faster-RCNN [1], Mask RCNN [2], Cascade-RCNN [3], etc. In contrast, one-stage detectors do not have a process of filtering the foreground. Instead, they directly classify and regress the feature maps generated by the backbone network. Typical one-stage detectors include SSD [4], RetinaNet [5], YOLO [6,7,8,9,10,11,12] series, etc. Many object detection methods are based on these two types of detector frameworks. Recently, emerging methods such as Visual Transformer [13], DETR [14], and Mamba [15] have achieved new SOTA in various fields. Due to changes in factors such as the shooting angle and sensor attitude, target detection faces challenges such as large-scale differences, complex and variable backgrounds, and imbalanced difficulty samples. However, in remote sensing target detection, scale difference is a core challenge that directly affects the effectiveness of feature extraction, fusion, regression, and classification.
Feature Extraction: Significant differences in target scales in remote sensing images lead to notable changes in the visual features of the target, including texture, shape, and edge information [16]. Traditional feature extraction methods often struggle to capture target features across all scales [17,18,19]. This limitation arises from their reliance on fixed scales, rendering feature extractors unable to adapt to scale changes. Deep learning methods primarily extract features by constructing multi-scale pyramids to mitigate large-scale differences [16,20]. However, small targets in remote sensing images may experience gradual dilution or loss during the construction of feature pyramids. Large-sized targets also exhibit complexity and diversity, posing challenges for feature extraction [21]. The model proposed in this article is designed with a Scale-Robust Feature Network (SRFN) in the Backbone stage, which includes a downsampling module(ADown) and a Deformable Attention (DAttention) mechanism [22]. This reduces the loss caused by downsampling during feature pyramid construction and can dynamically adjust sampling positions and attention weights to enhance the model’s ability to model distant targets, thereby improving feature extraction capability.
Feature Fusion: Multi-scale feature fusion serves as a pivotal technique for enhancing detection performance in remote sensing target detection. Features at different scales exhibit significant differences in expression form, resolution, and semantic information [20,23]. This difference makes it challenging to directly fuse features of different scales using simple fusion methods that cannot effectively utilize the information of these features. Many methods employ simple feature stacking or concatenation for feature fusion, overlooking the differences and complementarity between features at different scales [4,20,24]. Moreover, most methods only perform feature fusion at a single level, such as fusing solely at the last layer of the backbone network, thereby failing to fully exploit the semantic information and resolution of different layers. Furthermore, current feature fusion methods lack self-adaptability, unable to adjust fusion strategies adaptively based on specific tasks and datasets. Consequently, models exhibit poor generalization ability across different scenarios and fail to adapt to diverse remote sensing image data [4,5,25]. To address these challenges, an Adaptive Feature Aggregation and Diffusion(AFAD) module was designed in the neck section, which accurately selects multi-scale features through a channel perception selection mechanism, aggregates local and contextual information using multiple convolutional kernels, and transmits information to various scales through a unique diffusion mechanism. This effectively solves the problems of large-scale differences, background interference, and adaptive fusion strategies, significantly improving the model’s feature fusion ability.
Regression and Classification: In object detection, regression is utilized to forecast the positions and dimensions of bounding boxes. However, in cases of large differences in target scale, regression algorithms may struggle to accurately adapt to targets of varying scales, resulting in significant deviations between the predicted positions and sizes and the actual targets [26,27,28,29]. Because of the varying visual features of targets at different scales, classifiers may struggle to accurately recognize targets across all scales, leading to a decrease in classification performance. This article proposes the utilization of a Focaler-GIoU Loss to enhance the similarity measurement between predicted and ground truth bounding boxes. Additionally, it prioritizes challenging samples during training, thereby improving detection accuracy.
Therefore, this article proposes a Scale-Robust Feature Aggregation and Diffusion Network (SRFAD-Net) for remote sensing image detection, which includes Backbone, Neck, and Head. The network effectively addresses the challenges of feature extraction, fusion, regression, and classification caused by large-scale differences in remote sensing images through different strategies. In the Backbone stage, we designed SRFN to extract key features from images. In order to enhance the robustness of the network to targets of different scales and shapes and effectively alleviate the problem of the easy loss of small target information in downsampling, we adopt a special ADown module that combines the advantages of average pooling and max pooling, thereby highlighting important features while retaining background information. At the upper level of the feature pyramid, we introduce a DAttentionmechanism that can adjust the focus point based on the shape and size of the object, enabling the network to more accurately capture distant targets in the image. In the feature fusion section, we propose an AFADmodule that intelligently selects and integrates feature information from different channels and effectively transmits this information to various scales through a diffusion mechanism to achieve comprehensive feature fusion. Finally, in the detection head section, the network converts the fused features into the final prediction result. In order to more accurately evaluate the matching degree between the predicted results and the actual target, we adopted a Focaler-GIoU loss function, which can help the model focus on the challenging samples and effectively handle the problem of bounding box overlap, further improving the accuracy of detection. Our main contributions are as follows:
- The ADown downsampling module combines the benefits of average pooling and max pooling. This not only extends the contextual information capture range but also adeptly preserves crucial features like edges, corners, and textures during the construction of a multi-scale feature pyramid. Consequently, it greatly enhances the network’s resilience to targets of varied scales and shapes.
- The DAttention module merges Deformable Convolution and self-attention mechanisms to dynamically adjust sampling positions and attention weights. This enables the model to concentrate on distant target areas in the image, extract more precise and accurate feature representations, and enhance its adaptability to objects of diverse shapes and scales. Consequently, it improves the model’s capability to model long-range targets.
- The AFAD module employs a channel-aware selection mechanism to precisely select features. It aggregates local and contextual information via multiple convolutional kernels, and then uniformly disperses features containing rich contextual information across various scales through a unique diffusion mechanism. This greatly enhances the network’s information fusion capability and effectively mitigates issues arising from large-scale differences and background interference.
- The Focaler-GIoU Loss merges the benefits of Focaler-IoU in emphasizing challenging samples and the advantages of GIoU in managing non-overlapping bounding boxes. This results in higher accuracy in describing target positions and shapes, thereby enhancing detection accuracy.
The structure of this article is as follows: Section 2 provides a comprehensive review of relevant literature on remote sensing target detection and feature extraction. Section 3 details our proposed model, thoroughly outlining each module. Section 4 shows the results of ablation and comparative experiments conducted on our model architecture, highlighting the effectiveness of the module design and model performance, along with a visual analysis. Lastly, Section 5 concludes the article and outlines potential directions for future research.
2. Related Work
Currently, remote sensing image target detection predominantly relies on Depthwise Convolutional Neural Networks (DCNNs) [17], which combine feature extraction with bounding box regression. Despite the significant progress made by existing two-stage and one-stage detectors, substantial challenges persist in feature extraction, feature fusion, regression, and classification due to significant scale differences in real-world remote sensing environments. Addressing these challenges primarily focuses on two aspects: enhancing remote sensing target detectors and improving feature extraction capabilities.
2.1. Remote Sensing Target Detector
In recent years, a series of arbitrary direction object detectors based on RCNN have emerged. [30] conducts multiple merged RoI pools on the convolutional feature map for each candidate region and employs tilted NMS for post-processing to detect rotating targets. [31] generates candidate regions in any direction by rotating the anchor box to any angle. It extends the RoI pooling layer to a rotating RoI pooling layer to enable the integration of all detection steps into a unified network and achieve end-to-end training. Additionally, regression is applied to the direction angle of the bounding box to enhance the accuracy of candidate regions generated by the tilted target. Ma [32] proposed a two-stage RRPN algorithm, which adds directional parameters to the anchor box and designs a rotating anchor to enable anchor-based algorithms to detect objects in any direction. Oriented R-CNN [33] is a versatile two-stage direction detector that extracts features from candidate regions in each direction through rotating RoI. It conducts classification and regression to enhance detection accuracy. Ding [34] introduced the RoI Transformer method within the two-stage Faster-RCNN framework, incorporating a RoI spatial transformation structure. This method involves learning horizontal anchor boxes, rotating the region of interest, and utilizing the extracted features for object recognition and detection, leading to a significant enhancement in rotating object detection performance.
Several variants proposed based on the RCNN framework include ReDet [35], which captures target features in various directions by incorporating rotation-equivariant modules into the network structure. It aggregates these features into the detection process, thereby enhancing the recognition capability of rotating targets. [36] implements a progressive regression method from coarse to fine. It designs a feature refinement module (FRM), employs feature interpolation to derive position information corresponding to refined anchor points, and reconstructs the entire feature map at a pixel level to achieve feature alignment. SCRNet [37] devises a feature fusion structure (SF-Net) focusing on feature fusion and anchor sampling. It accentuates remote sensing prospect features while diminishing background features. The loss function is augmented with an IoU constant factor to facilitate the coordinate prediction of any target angle. SCRDet++ [38] conducts instance-level denoising on feature maps. It introduces a new InLD component to approximate the separation of features from different object categories into distinct channels. In the spatial domain, object features are boosted while background features are subdued, with the aim of enhancing the detection of small and cluttered objects.
2.2. Remote Sensing Image Feature Extraction
The -Net [39] architecture has a FAM module that generates high-quality anchors via refinement networks and dynamically aligns features. The ODM uses active rotation filters to encode directional information, producing direction-sensitive and invariant features. This addresses the inconsistency between classification scores and positioning accuracy.
Pu [40] introduced Adaptive Rotation Convolution (ARC), which predicts the kernel’s rotation angle via a routing function, extracting features in various directions. ARC includes a conditional computing mechanism to handle object directional variations, addressing rotating object detection challenges. ARC can be integrated into various backbones, enhancing oriented object detection and representation.
PKINet [41] tackles the challenges of high background noise and overly sparse feature representation in remote sensing detection. It employs a multi-scale convolution kernel that does not necessitate expansion to extract object features across different scales and capture local context. Additionally, a Context Anchored Attention (CAA) module is introduced in parallel to capture contextual information from remote areas.
LSKNet [42] consists of two main sub-blocks: the Large Kernel Selection (LK Selection) sub-block and the Feedforward Network (FFN) sub-block. The LK Selection sub-block dynamically adapts the network’s receptive field, enabling it to more accurately capture the diverse environmental conditions of objects within remote sensing scenes.
Besides CNN-based frameworks, recent methods including Visual TransFormer [13,43,44,45], DETR [14,46], and Mamba [15,47] have also been applied to remote sensing detection tasks, contributing to increased research diversity.
3. Method
3.1. Overall Architecture
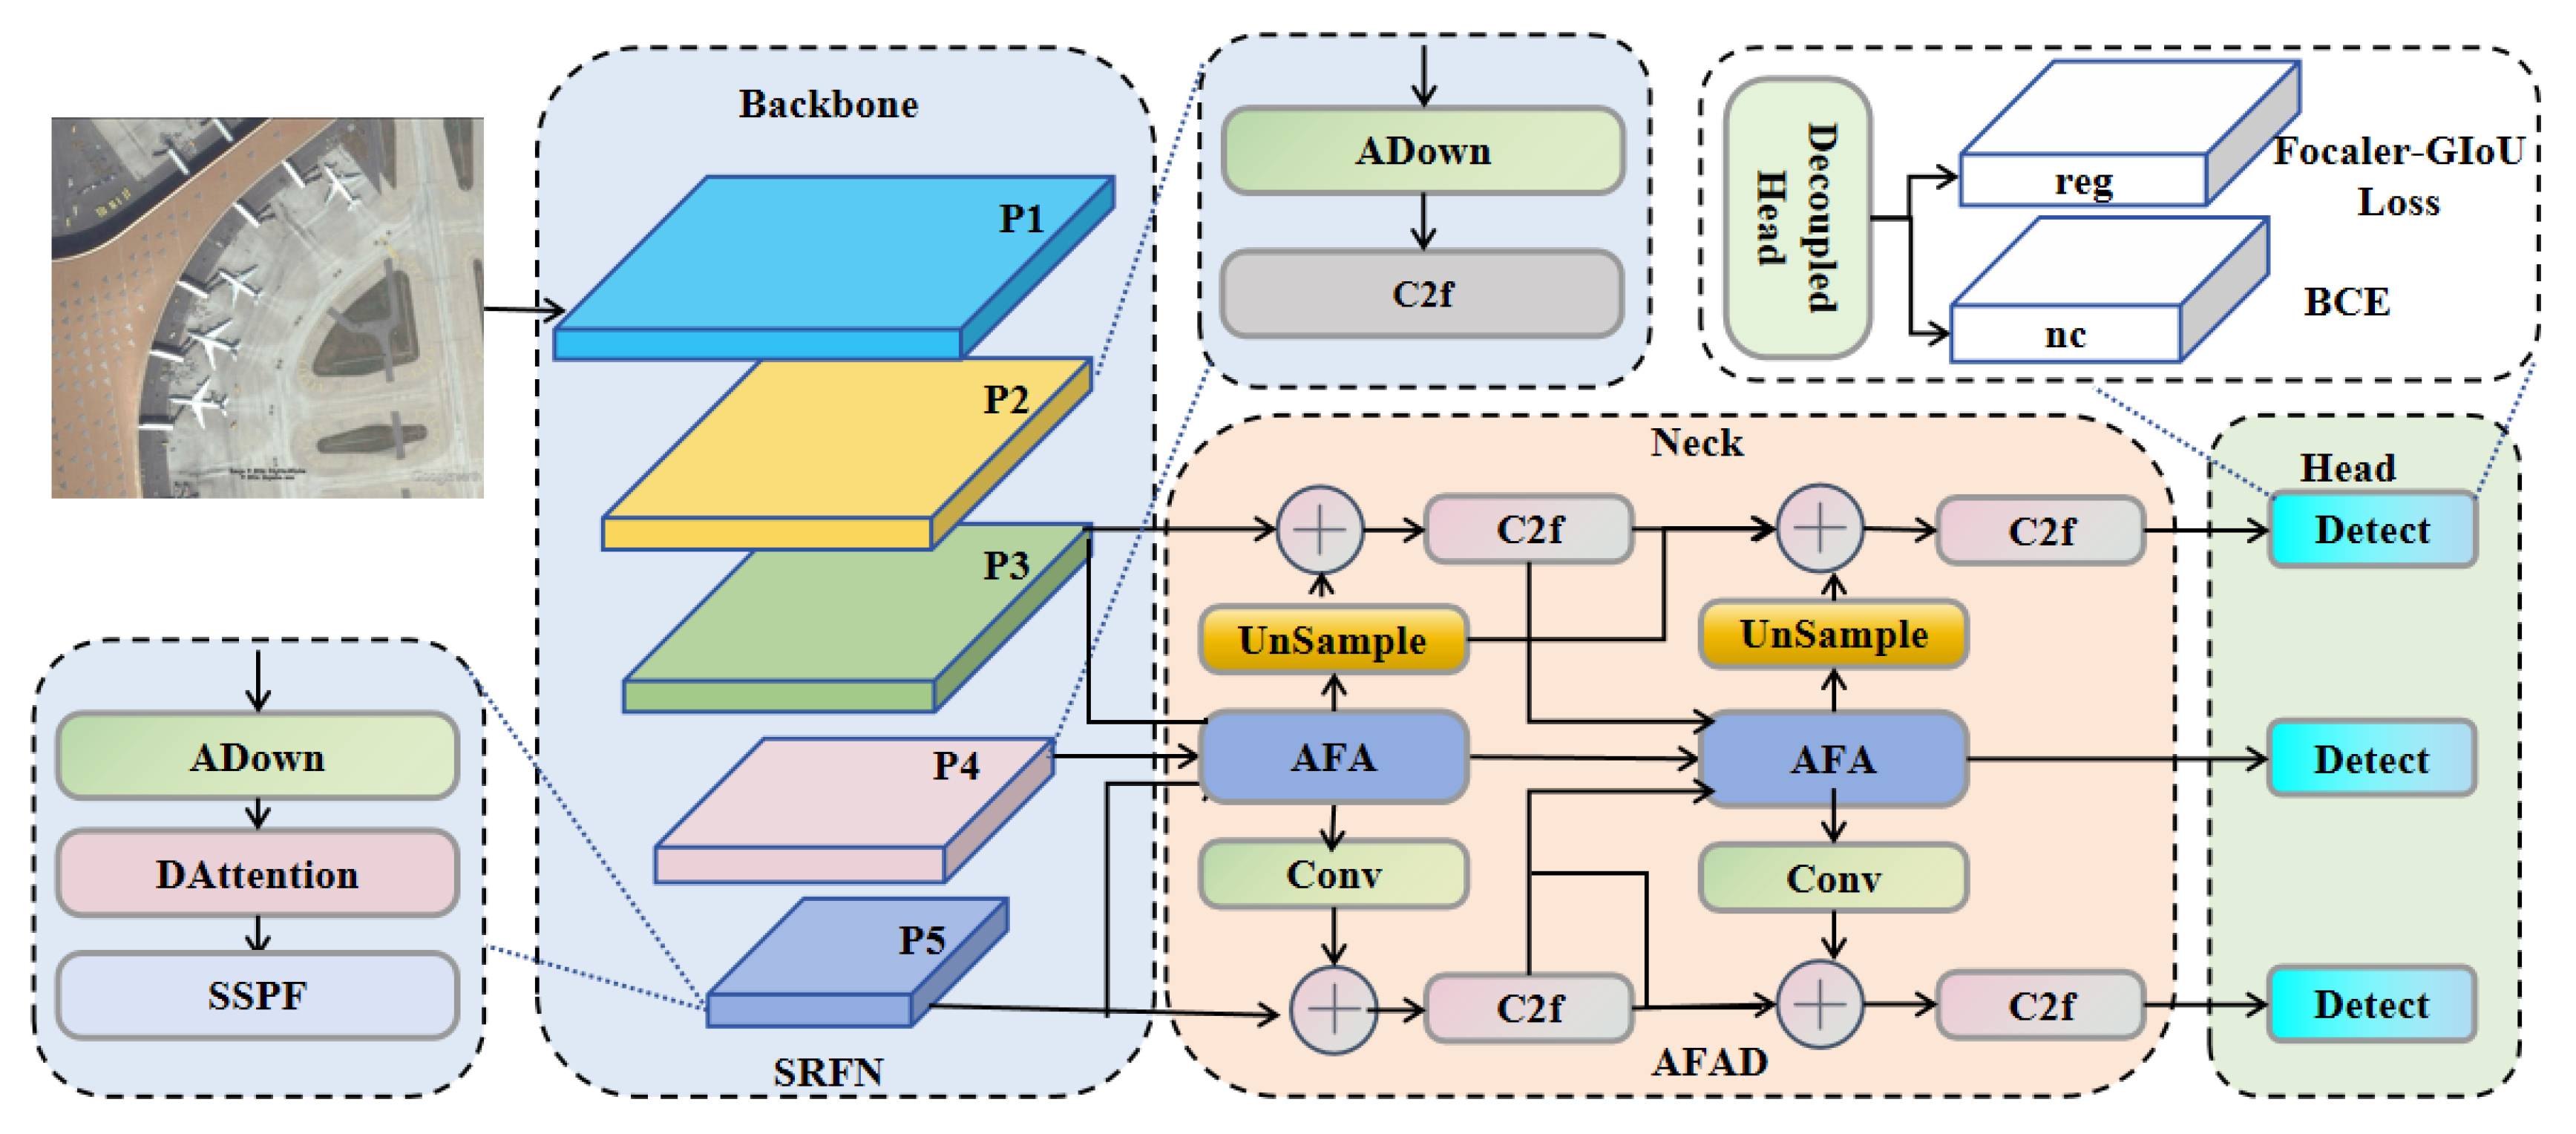
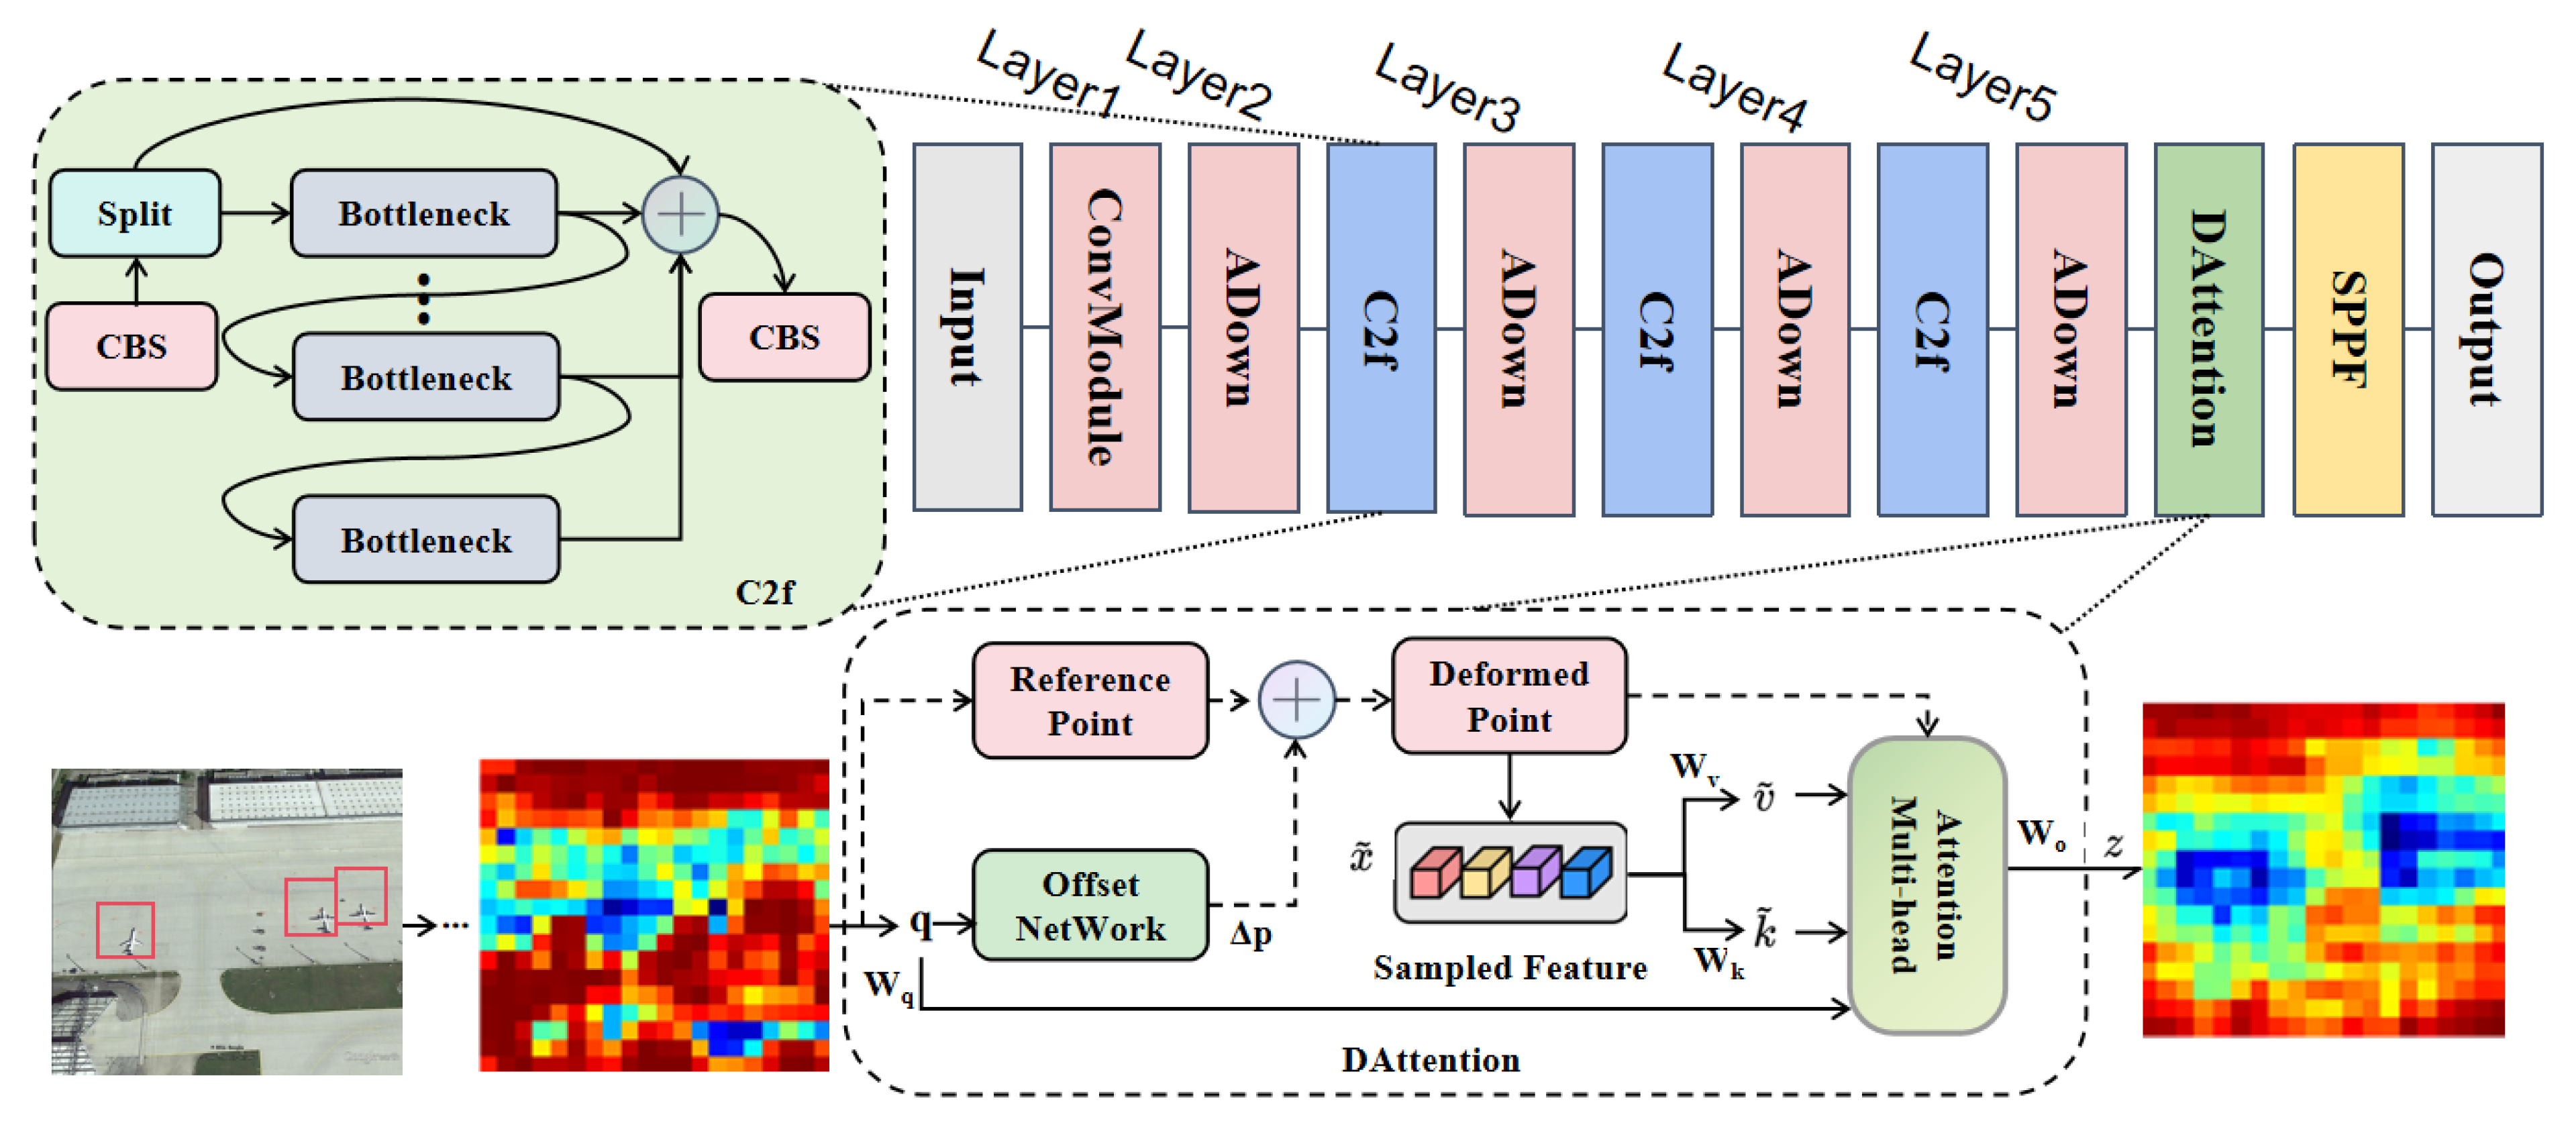
Our proposed SRFAD-Net follows the structure of mainstream object detection networks, comprising Backbone, Neck, and Heads. In Figure 1, the Backbone constructs SRFN and utilizes a CNN network to create a five-layer feature pyramid for extracting information with varying scales and features. Layers 2 to 4 consist of the ADown module and the C2f module. ADown aggregations average pooling and max pooling to achieve downsampling while minimizing image feature loss. The DAttention module is introduced in the fifth layer to accurately model long-range information in remote sensing images. Subsequently, the extracted feature maps are further processed and aggregated with the Neck via the AFAD module, consisting of the AFA module and the C2f module. Multi-scale feature aggregation and diffusion are facilitated through channel perception, multi-core feature extraction, and feature diffusion. The Head layer receives features from the Neck layer, where it performs crucial object detection tasks such as accurately predicting the position and category of the target. To enhance the precision in describing the target’s position and shape during the regression task, the Focaler-GIoU Loss is utilized. The final output of the detection network comprises precise bounding box coordinates and class probabilities, ensuring accurate detection results.
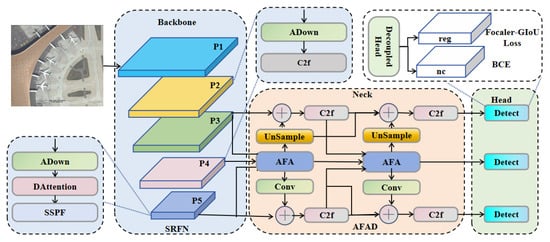
Figure 1.
Overall architecture of SRFAD-Net. Backbone uses SRFN to construct a five-layer feature pyramid for multi-scale feature extraction, Neck further implements feature extraction, aggregation, and diffusion through the AFAD module, Head performs localization and classification, and Focaler-GIoU Loss provides higher accuracy for describing target position.
3.2. Scale-Robust Feature Network
Feature extraction holds a crucial role in remote sensing target detection, yet the significant variations in target scale within remote sensing images present formidable challenges. These differences manifest as substantial variations in target visual features like texture, shape, and edge information. Traditional feature extraction methods, constrained by fixed scales and feature extractors, often struggle to comprehensively capture target features across diverse scales. To address these challenges, deep learning approaches commonly adopt multi-scale feature pyramid constructions. However, constructing feature pyramids in remote sensing images presents difficulties: small targets may be dilution or loss, while large targets exhibit intricate and diverse features, complicating feature extraction. In response, this paper proposed SRFN in its Backbone component, as illustrated in Figure 2. Layer 1 conducts convolution operations to extract low-level feature information from input images. Layers 2–4 consist of ADown modules and C2f modules, while the C2f module enriches model gradient flow by connecting additional branches. Layer 5 comprises ADown, DAttention, and SPPF modules.
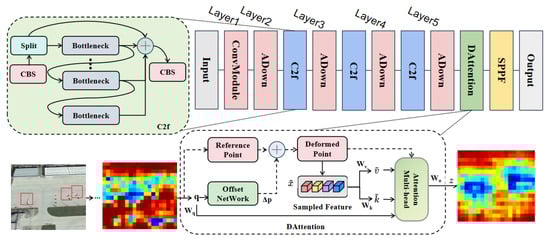
Figure 2.
Architecture of the proposed SRFN. Layer 1 extracts low-level feature information through convolutional modules, Layers 2–4 consist of ADown modules and C2f modules, and Layer 5 introduces DAttention modules.
The core of SRFN is the design of the ADown downsampling module and DAttention mechanism. The ADown downsampling module aims to minimize information loss during downsampling while preserving the integrity of small target features. Concurrently, the DAttention mechanism dynamically adjusts sampling positions and attention weights. The model’s ability to capture features of distant targets is enhanced, leading to significant improvements in feature extraction. By integrating these two strategies, SRFN effectively extracts robust features representing targets of various scales in remote sensing images, laying a solid foundation for subsequent object detection tasks.
3.2.1. DAttention Module
Input the feature map , where H represents height, W represents width, and C represents the number of channels. To determine the offset of each reference point, the feature map undergoes a linear projection onto the query marker q, given by . Subsequently, the reference points on the upper path are downsampled using scaling coefficients r and arranged into a grid. The offset is obtained from the offset network with the query as input, represented as , and added to the reference points to obtain the offset position information . The deformed reference points are further sampled using the bilinear interpolation method to obtain , , , as shown below:
Here, are the projection matrices. Multi-head attention can be calculated by adding relative position encoding, as follows:
where d is the dimension of each head, denotes the softmax function, and denotes the embedding output from the m-th attention head. The final output z is to concatenate the multi-head outputs .
From Figure 2, it can be seen that there are three aircraft targets in the leftmost image(as shown in the red box). The thermal map obtained after fourth layers of downsampling is shown in the second image. After passing through the DAttention module, the network fully captures the target information, ignoring the interference of complex backgrounds, as shown in the rightmost image. Therefore, the introduction of DAttention not only helps the model focus more on key areas related to the target object, ignoring background or other irrelevant information, but also helps the model locate the target object more accurately and improve detection performance.
3.2.2. ADown Module
During the processing of remote sensing image detection tasks, feature pyramids are constructed through downsampling. Typically, this involves using convolution with a stride of 2 to reduce the image size, as illustrated in Figure 3a. Remote sensing images, characterized by diverse imaging methods, often exhibit substantial variations in complex backgrounds and target orientations. This variability poses a challenge, as downsampling can easily result in the loss of information about small targets, leading to false positives and missed detections, thereby compromising the overall detection performance. Hence, the implementation of an effective downsampling strategy is crucial for extracting key features while minimizing computational costs. This article adopts the ADown module, as shown in Figure 3b. This approach combines the benefits of average and max pooling, effectively preserving both rich background information and salient features during downsampling. It also enhances the network’s robustness in detecting perception targets of varying scales and shapes.

Figure 3.
Structure diagram showing a comparison between ADown downsampling and regular downsampling.
The ADown module initially accepts an input feature map, typically comes from the previous layer in a convolutional neural network, and then performs average pooling. The resulting output is simultaneously directed into two branches, one branch with a stride of 2 convolution operations and the other branch executing max pooling operations. Subsequently, the outcomes from both branches are concatenated and forwarded as output. Average pooling serves to retain the global information of feature maps, thereby expanding the receptive field of subsequent convolutional layers and facilitating the capture of a broader range of contextual information. Concurrently, max pooling accentuates the local maximum value within the feature map, representing the most salient feature. The output feature maps from the two branches are subsequently fused. This fusion technique amalgamates the benefits of average pooling and max pooling, yielding a novel feature map encompassing both global information and prominent features.
The ADown module enhances the receptive field of following convolutional layers and capturing contextual information across a broader range while preserving significant features like edges, corners, and textures. This boosts the network’s resilience to targets of varied scales and shapes. Simultaneously reducing feature dimensionality, it upholds high computational efficiency.
3.3. AFAD Module
Multi-scale feature fusion plays a pivotal role in optimizing the detection performance for remote sensing target detection. However, integrating features across different scales poses significant challenges due to variations in expression form, resolution, and semantic information. Traditional fusion methods, such as simple feature stacking or concatenation, often fail to fully leverage the complementarity and differences between features at different scales, leading to suboptimal fusion outcomes. Moreover, most methods only fuse features at a single level, limiting the model’s exploitation of semantic information and resolution across different levels, while overlooking the importance of feature weights at different scales. To tackle these challenges, we introduce the AFAD module. The AFAD module adopts a channel-aware strategy, fully considering the weight and importance of features at different scales, effectively integrating local and contextual information, and spreading this information to various scales, thereby significantly enhancing the model’s feature fusion capability. This design not only considers the complementarity between features at different scales but also endows the model with the ability to adaptively adjust fusion strategies, allowing it to flexibly adjust according to the characteristics of different tasks and datasets. The AFAD module achieves superior results in multi-scale feature fusion. This approach enhances the accuracy and generalization capabilities for remote sensing target detection.
The AFAD module structure is shown in Figure 1. It is composed of an AFA module and features a diffusion mechanism. Among them, the AFA module can accept inputs of three different scales. It uses a dimension adaptive perception selection mechanism and combines a set of parallel depthwise convolution operations to accurately select and aggregate multi-channel information. The feature diffusion mechanism consists of a C2f module, upsampling, and concat operation, which effectively spreads features containing rich contextual information to various scales, making it more conducive to subsequent target detection and classification.
The AFA module, depicted in Figure 4, aligns high-dimensional features and low-dimensional features with the current layer’s features through convolution and split operations. These features are then divided into four equal segments, , , and , and , , and represent the i-th partition feature of the high-dimensional, low-dimensional, and current layer’s features, respectively. This operation can be expressed as follows:
where represents convolution operations with a kernel size of , represents the upsample operation, while indicates split quartering in the channel dimension. represents the value obtained through the activation function applied to , and represents the selective aggregation result for each partition.
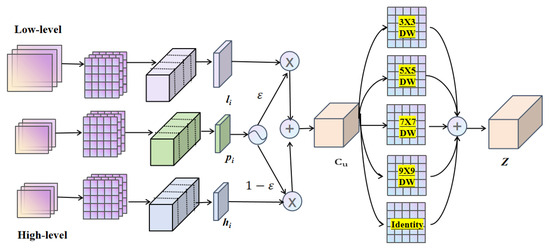
Figure 4.
Architecture of the proposed AFA module. Receive feature maps of three scales, select features through dimension perception, and then aggregate features through depthwise convolution.
The variable possesses the capability to perceive and select feature dimensions. When , the model prioritizes fine-grained features, whereas when , it emphasizes contextual features. The calculation for channel perception aggregation features is represented as follow:
where the operations , and denote concat, convolution, batch normalization, and rectified linear unit (ReLU), respectively.
After merging p in the channel dimension, is processed through a set of parallel depthwise convolutions to extract contextual features. These convolutions utilize kernels of 3, 5, 7, and 9 without dilation, thereby preventing overly sparse feature extraction. Subsequently, 1 × 1 convolution is employed to fuse the local and contextual features. This 1 × 1 convolution acts as a channel fusion mechanism, integrating features with varying receptive field sizes. Finally, the output is obtained.
Through this approach, the AFAD module effectively handles multi-scale inputs, adaptively selects feature dimensions, captures broad contextual information while preserving feature integrity, and fuses local and contextual features. Additionally, the rich features obtained earlier are efficiently diffused to various scales through a diffusion mechanism, thereby enhancing detection accuracy.
3.4. Focaler-GIoU Loss
In object detection, regression models predict the bounding box position and size, but scale differences challenge their performance. Small-scale targets lack feature information, hampering accurate bounding box prediction, while large-scale targets suffer localization accuracy reduction due to noise. Addressing these challenges, a Focaler-GIoU Loss accurately measures bounding box similarity, emphasizing hard-to-classify samples and enhancing detection accuracy. Our model shows significant regression and localization improvement, particularly in handling scale differences, demonstrating robustness and accuracy.
The Focaler-GIoU Loss combines Focaler-IOU [27] and GIOU Loss [48] concepts, defined as follows:
where is the reconstructed Focaler-IoU, IoU is the original IoU value, and . B and represent the predicted box and ground truth (GT) box, respectively. By adjusting the values of d and u, we can make focus on different regression samples. Its loss L is defined below:
The GIoU loss, as an enhancement of IoU, calculates losses by incorporating a minimum bounding rectangle encompassing both the predicted and true boxes, thereby providing a more accurate measure of their overlap. With the introduction of Focaler-GIoU, the model is encouraged to pay greater attention to challenging hard samples during training, specifically those with lower GIoU values. This combination allows Focaler-GIoU to not only address cases excluded by standard IoU but also prioritize samples that significantly influence detection performance. Consequently, it provides a more refined measure of the similarity between predicted and true bounding boxes, leading to improved detection accuracy.
4. Experiment
4.1. Dataset
We assessed the performance of the proposed SRFAD-Net on the RSOD dataset [48] and NWPU VHR-10 [49] datasets. The RSOD (Remote Sensing Object Detection) dataset is an open dataset designed specifically for remote sensing image object detection tasks. This dataset was released by Wuhan University in 2017 and includes a total of 976 images and 6950 targets for four categories: aircraft, oil tanks, playgrounds, and overpasses. Each type of target corresponds to a specific set of remote sensing images, and detailed information is shown in Table 1. Due to these images being extracted from platforms such as Google Earth and Sky Map, the image resolution is not high and includes a wide range of regions and various types of terrain. The targets in the image may present in multiple scales and directions, and the backgrounds are usually complex, with a lot of noise, occlusion, and shadows. Some targets are arranged very densely, even overlapping, which increases the difficulty of object detection.

Table 1.
Detailed introduction to RSOD dataset.
The NWPU VHR-10 dataset, provided by Northwestern Polytechnical University, is a publicly available geospatial object detection dataset consisting of 10 classes. This dataset is commonly utilized for research purposes and contains 650 ultra-high resolution (UHR) remote sensing images with 10 distinct target categories. These images were meticulously annotated by experts and were sourced from Google Earth and the Vaihingen datasets. The object categories include airplanes, ships, storage tanks, baseball diamonds, tennis courts, basketball courts, ground runways, ports, bridges, and vehicles. Notably, the dataset exhibits both sparse and dense object distributions, with tanks and vehicles often clustered densely, while ground track fields appear relatively sparse. The dataset was divided into training, validation, and testing sets at a ratio of 7:2:1. Detailed information is provided in Table 2.
Table 2.
Detailed introduction to NWPU VHR-10 dataset.
4.2. Evaluation Indicators and Experimental Environment
4.2.1. Evaluation Indicators
In order to assess the effectiveness of remote sensing image object detection methods in a scientific and precise manner, a set of quantitative evaluation metrics is essential. These metrics primarily comprise precision, recall, and mean average precision (mAP). Precision measures the accuracy of positive predictions by determining the ratio of true positives (TP) to the total predicted positives, which includes true positives and false positives (FP). The formula for Precision is as follows:
The recall rate evaluates the detection effectiveness based on actual positive samples. It quantifies the ratio of accurately predicted positive samples to the total actual positive samples. Specifically, a correct prediction is designated as true positive (TP), while an incorrect prediction is classified as false negative (FN). The recall rate is calculated using the following formula:
In object detection, a high recall rate suggests that the model detects most targets, but it may come with a cost of a high false positive (FP) rate, affecting accuracy. Conversely, high accuracy indicates a high proportion of positive predictions, but it might miss more actual targets, lowering recall. The mAP metric combines these two indicators to comprehensively evaluate the performance of object detection algorithms. In multi-category object detection tasks, mAP calculates the average precision for each category and averages them to obtain the final mAP value. This can be expressed as follows:
In the formula, AP_n represents the average precision of the n-th type of the target, and its value is equal to the area covered by the Pecision–Recall function and the coordinate axis. This is represented by the following:
The metric mAP_0.5 expresses the average accuracy when the Intersection over Union (IoU) threshold is set to 0.5. Extending this, by setting IoU thresholds from 0.5 to 0.95 in increments of 0.05, we obtain corresponding mAP values. The average of these values results in mAP_0.5:0.95, a comprehensive evaluation metric that spans multiple IoU thresholds.
Furthermore, mAP can be appended with suffixes such as ’s’, ’m’, and ’l’, representing the average accuracy for small, medium, and large targets, respectively. This metric provides a holistic view of object detection performance, encompassing detection results across multiple categories and target sizes. By doing so, it avoids the limitations of single-category evaluation metrics. As a result, mAP is widely adopted in object detection tasks for evaluating model performance.
4.2.2. Experimental Environment
The training parameters for the model are configured as 300 epochs, a batch size of 16, 8 processes (workers), and an input image size of 640 × 640. The SGD optimizer is employed, with a learning rate range of 1 × (maximum) to 1 × (minimum). To mitigate overfitting, a weight decay of 5 × and a momentum of 0.937 are implemented. Furthermore, the model utilizes an early stopping mechanism, which automatically halts training when the validation loss plateaus, signifying fundamental convergence.
The experimental environment is the Red Hat 4.8.5–28 operating system, equipped with PyTorch 2.1, Python 3.11, and CUDA 12.1. The experiments were conducted on an A800 GPU cluster with 3 GPUs, each having 256 GB of memory. To accelerate the experimental process while retaining precision, we employed varying degrees of data augmentation tailored to different model sizes. For input images sized 640 × 640 pixels with three channels, SRFAD-Net consists of 287 layers and 3.11 million parameters and performs 9.6 GFLOPs.
4.3. Ablation Experiment
4.3.1. Overall Algorithm Experiment
To validate the effectiveness of each proposed module, ablation experiments were conducted on both the RSOD and NWPU VHR-10 datasets. YOLOv8 served as the baseline, and the results on the RSOD dataset are presented in Table 3.
Table 3.
RSOD dataset ablation experiment.
The mAP of the baseline is 91.1%. This performance is attributed to the inclusion of multiple convolutional and pooling layers in the Backbone section, enabling the extraction of both low-level and high-level features from the input images. The convolutional layer adopts a C2f structure, integrating additional skip connections and split operations to enhance feature richness while mitigating computational complexity. Despite its lightweight nature, these operations effectively capture gradient flow information. While these methods yield promising results in natural scenes, they exhibit limitations in remote sensing images characterized by complex backgrounds with numerous small targets, particularly in scenarios with significant background interference and shape variations.
Integrating the ADown module into the baseline led to a significant 2.7% improvement in mAP. This improvement is attributed to the ADown module’s capability to preserve global features by parallel processing involving average pooling and max pooling, highlighting salient features, enlarging the receptive field of subsequent convolutional layers, and mitigating downsampling effects on detection. Incorporating the DAttention module further enhanced mAP by 0.6%. The DAttention module combines the local perception ability of CNN with the global abstraction ability of ViT, enabling better attention focus on areas of interest, capturing spatial information effectively, and improving the modeling of long-distance information in remote sensing images. The integration of the AFAD structure boosted mAP by 3.9%, showcasing its effectiveness in feature dimension perception, context fusion with local features, and interference suppression from complex backgrounds, thus enhancing detection accuracy significantly. Additionally, the inclusion of the Focaler-GIoU Loss function led to a 2.1% increase in mAP, highlighting its attention to low-quality large gradient samples in remote sensing images. The simultaneous addition of the DAttention module and AFAD improved mAP by 3.4% compared to the baseline method, demonstrating their independence and effectiveness in different detection stages. The combined inclusion of three modules (DAttention, AFAD, and Focaler-GIoU) resulted in a 4.3% mAP increase compared with the baseline. Finally, integrating all four modules achieved the optimal effect with a 4.6% mAP increase, suggesting potential synergistic effects. These modules collectively optimize various aspects of the network, better adapting to complex scene target detection tasks and jointly elevating the effectiveness of remote sensing image target detection.
We can obtain similar experimental results in NWPU VHR-10, as shown in Table 4. In contrast with relying solely on a single module, networks composed of a stacked combination of various blocks demonstrate superior performance. The addition of four modules enables the model to capture spatial information in remote sensing images and perform dimension perception on the extracted features, adaptively integrating them and effectively suppressing the interference of complex backgrounds. Notably, the network achieved enhanced regression and classification outcomes. Furthermore, the experiment validated the compatibility of the proposed module, and when all proposed methods were integrated, the model exhibited optimal performance, achieving a remarkable accuracy of 88.1%.
Table 4.
NWPU VHR-10 dataset ablation experiment.
4.3.2. Ablation Experiment of DAttention Module
To validate the efficacy of the DAttention module, ablation experiments were conducted at various locations within the backbone network. The backbone network comprises five layers, with the first three layers primarily dedicated to extracting high-resolution image features. Given their primary function, these initial layers were deemed unsuitable for integrating attention modules. Therefore, experiments mainly focused on the fourth and fifth layers. The ablation results obtained from experiments conducted on the RSOD and NWPU VHR-10 datasets are presented in Table 5.
Table 5.
Ablation experiment of DAttention module.
Observing the table, the first row reveals the outcome when the DAttention module was excluded from SRFAD-Net. After adding the DAttention module in the fifth layer, the detection accuracy improves the most. Adding to the fourth layer, which is the next priority, and adding it in both layers reduces the accuracy. This is because as the network hierarchy deepens, feature representation gradually transitions from low-level detail information (such as edges and textures) to high-level semantic information (such as object categories). Applying DAttention at a deeper level (such as the fifth layer) may better leverage its advantages in processing advanced semantic information. Typically, the fifth layer possesses a broader receptive field, enabling it to capture richer contextual information. DAttention adjusts the shape and dimensions of this receptive field, optimizing the capture of target area features, ultimately aiding the model in achieving more precise target localization and recognition. Although the receptive field in the fourth layer is smaller than that in the fifth layer, it is sufficient for the dataset in this article. Applying DAttention in the fourth layer can also bring performance improvements, but the effect may not be as significant as in the fifth layer. When DAttention is applied simultaneously in the fifth and fourth layers, it would extract similar or redundant features, which may not be very helpful for detection tasks and instead introduce noise. Furthermore, incorporating both layers would drastically elevate the network’s complexity, which not only increases the computational burden but also may make it more difficult to optimize the network during training, leading to performance degradation and affecting detection accuracy. Thus, this article adds the DAttention module in the fifth layer.
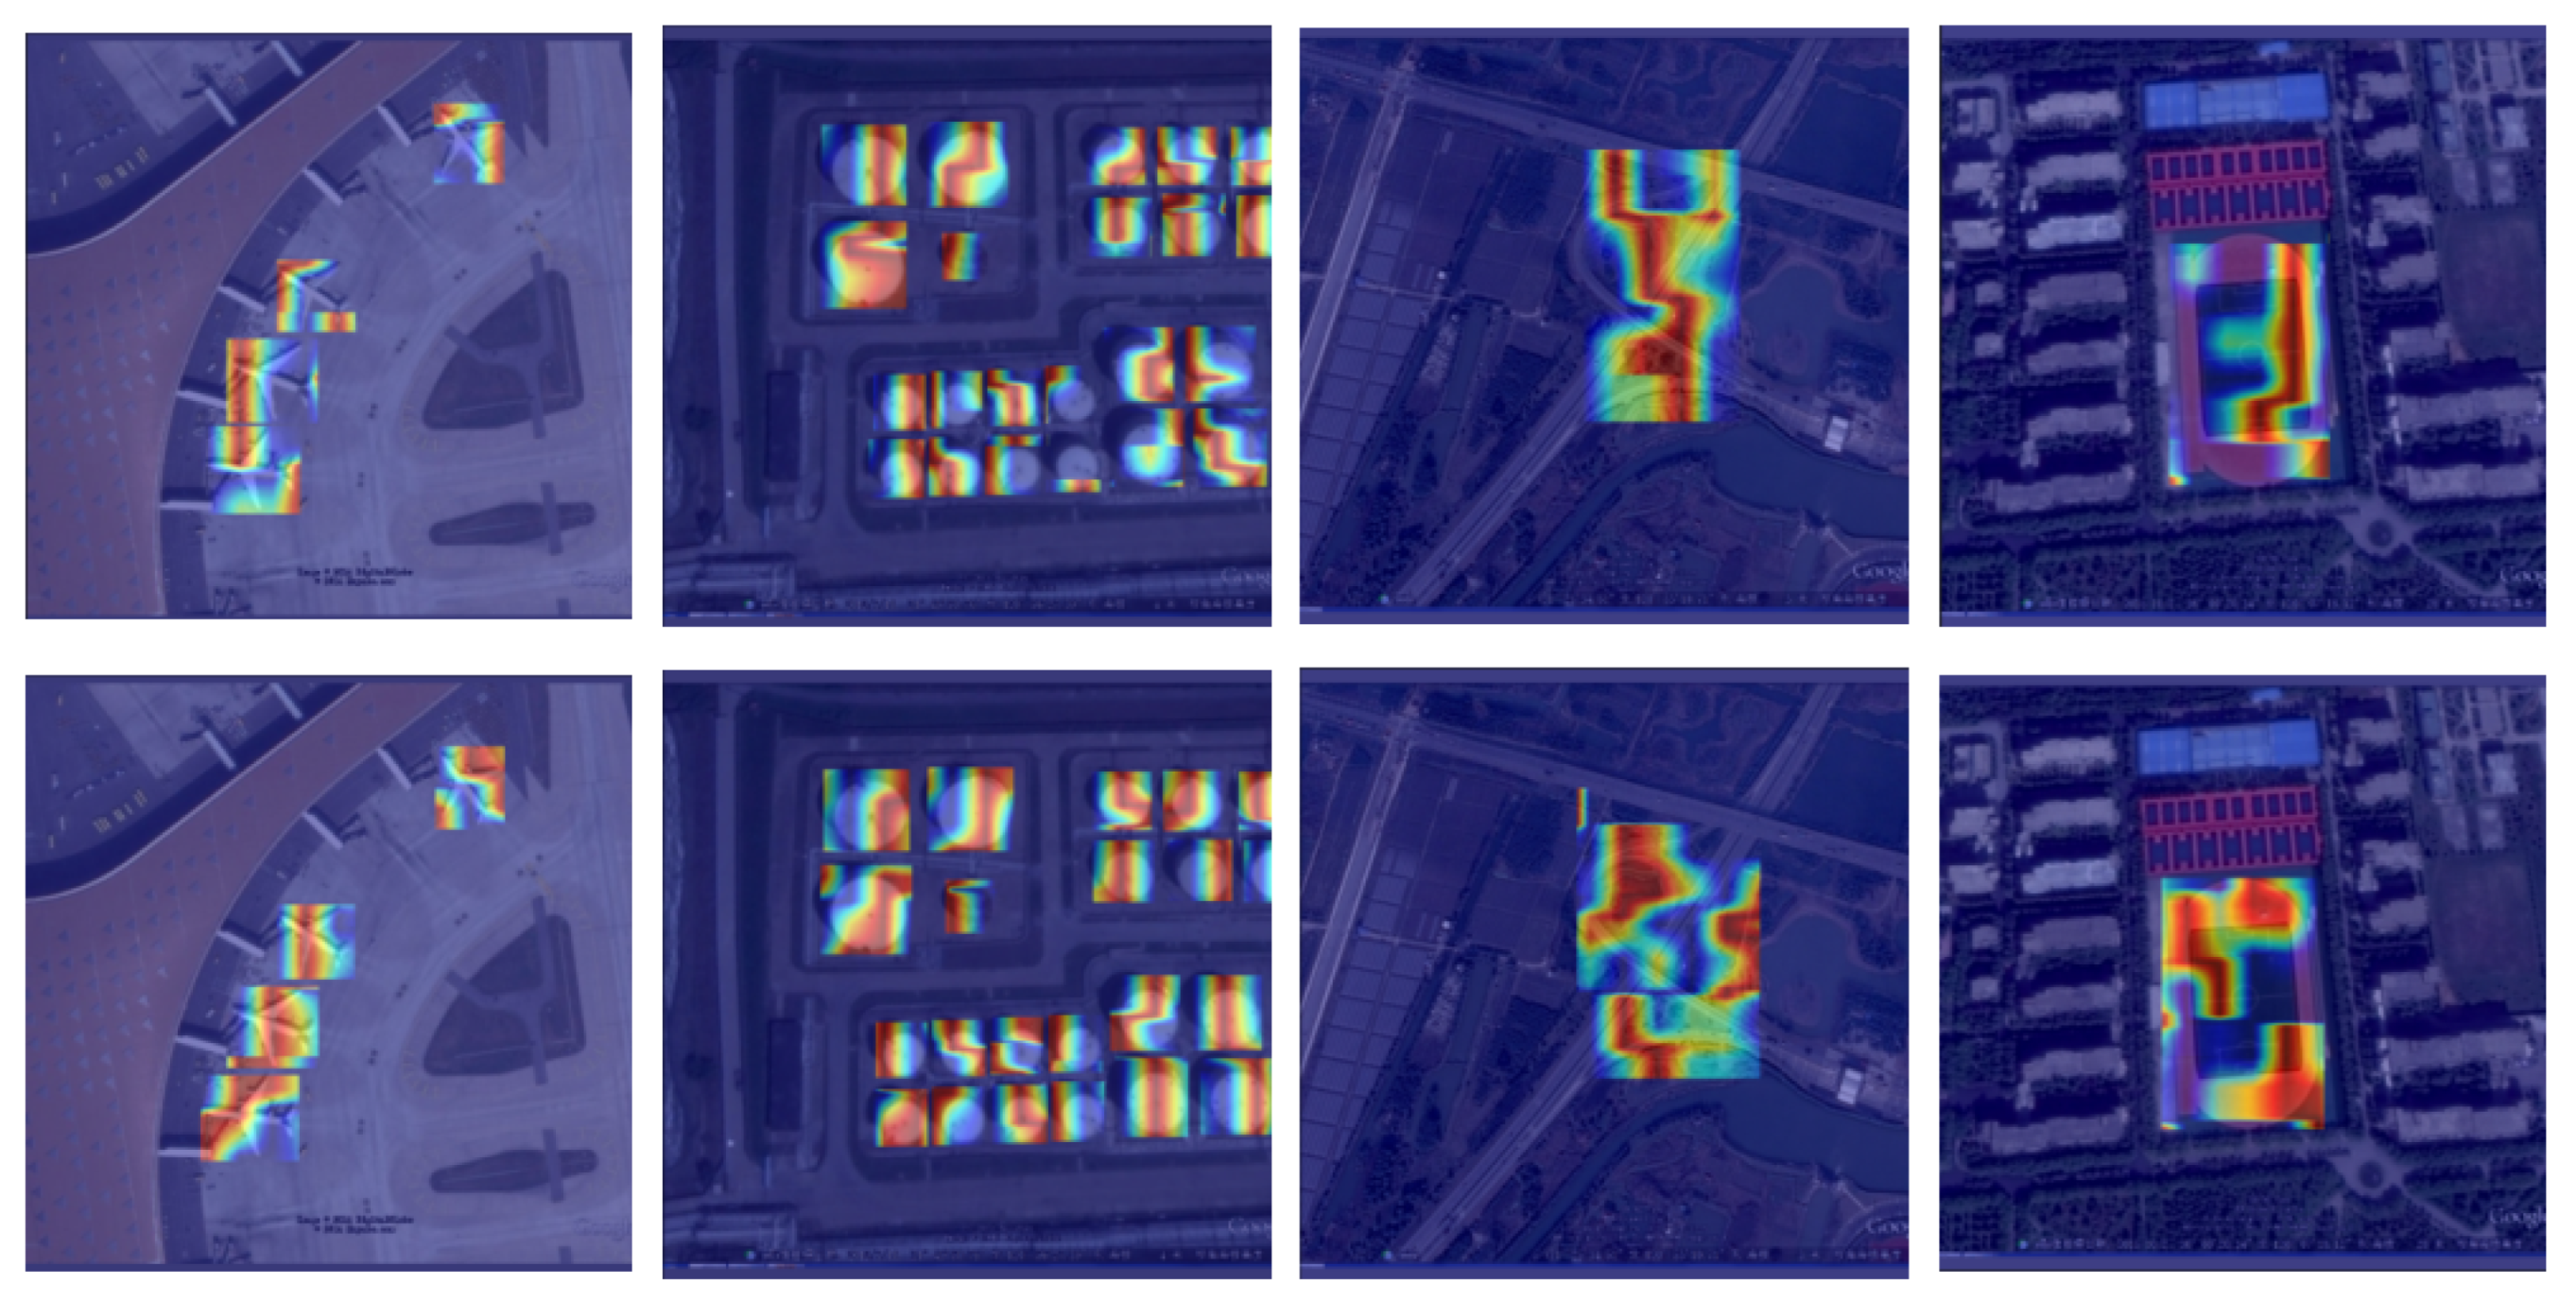
To validate the efficacy of the DAttention module in bolstering model feature representation, we conducted a comparative analysis between the baseline method and our proposed approach that integrates the DAttention module. To visually illustrate the distinction in feature representation, we generated thermal maps at the Backbone stage for the four target types in the RSOD dataset. These thermal maps offer a color-depth-based representation of the model’s focus on various image regions.
As depicted in Figure 5, the first row exhibits the heat map produced by the baseline method, while the second row showcases the heat map generated by our proposed approach. It can be seen that when using the DAttention module, the model’s feature information is richer and can better cover the target area. Meanwhile, as shown in Table 3, when using DAttention alone, the model accuracy increases by 0.6% compared with the baseline, indicating that DAttention can significantly enhance the model’s modeling of long-range targets, thereby improving detection accuracy.
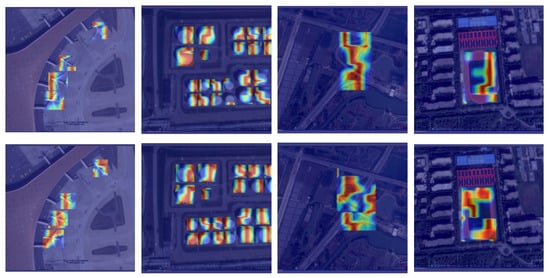
Figure 5.
Comparison of heat maps between SRFAD-Net and the baseline method.The first line is the baseline method, and the second line is our method. It can be seen that the addition of the DAttention module significantly enhances the ability of feature extraction in Backbone.
4.4. Comparative Experiment
4.4.1. RSOD Dataset
To verify the effectiveness of SRFAD-Net, we performed comparative experiments on the RSOD dataset against other established classical methods, as summarized in Table 6. The evaluation indicators used here include mean average precision (mAP), mAP at an IoU threshold of 0.5 (mAP_0.5), mAP at an IoU threshold of 0.75 (mAP_0.75), mAP for small targets (mAP_s), mAP for medium targets (mAP_m), and mAP for large targets (mAP_l).
Table 6.
Comparative experiment based on RSOD.
Notably, Faster-RCNN and Cascade-RCNN adopt a two-stage approach, while the remaining methods employ a one-stage approach. For the RSOD dataset, one-stage methods prevail over two-stage methods due to their direct prediction of target position and category, leading to a reduced number of hyperparameters and a streamlined network architecture. Additionally, in the realm of remote sensing image object detection, datasets tend to be smaller, which minimizes the risk of overfitting. Since targets in remote sensing images exhibit varying sizes, shapes, and orientations, often amidst complex backgrounds, one-stage methods excel at capturing contextual information comprehensively and predicting target position and category directly through end-to-end methods, thereby offering distinct advantages.
SRFAD-Net has shown a decrease in mAP_s compared with YOLOv8, RTMDet, Faster-RCNN, and Cascade-RCNN, while all other indicators have improved. The results suggest that SRFAD-Net still encounters certain challenges in detecting smaller objects, highlighting a potential area for improvement in its performance. However for other indicators, SRFAD-Net’s mAP_0.5 is 4.2% higher than that of YOLOv8, indicating that the model can still maintain good performance when the overlap between the predicted bounding boxes and the true boxes is low. MAP_0.75 increased by 3.1%, mainly due to the poor detection performance of small targets, resulting in a relatively small overall improvement. MAP_m increased by 1.9%, mAP_l increased by 3.9%, and the overall average accuracy improved by 3.2%, still achieving the best accuracy.
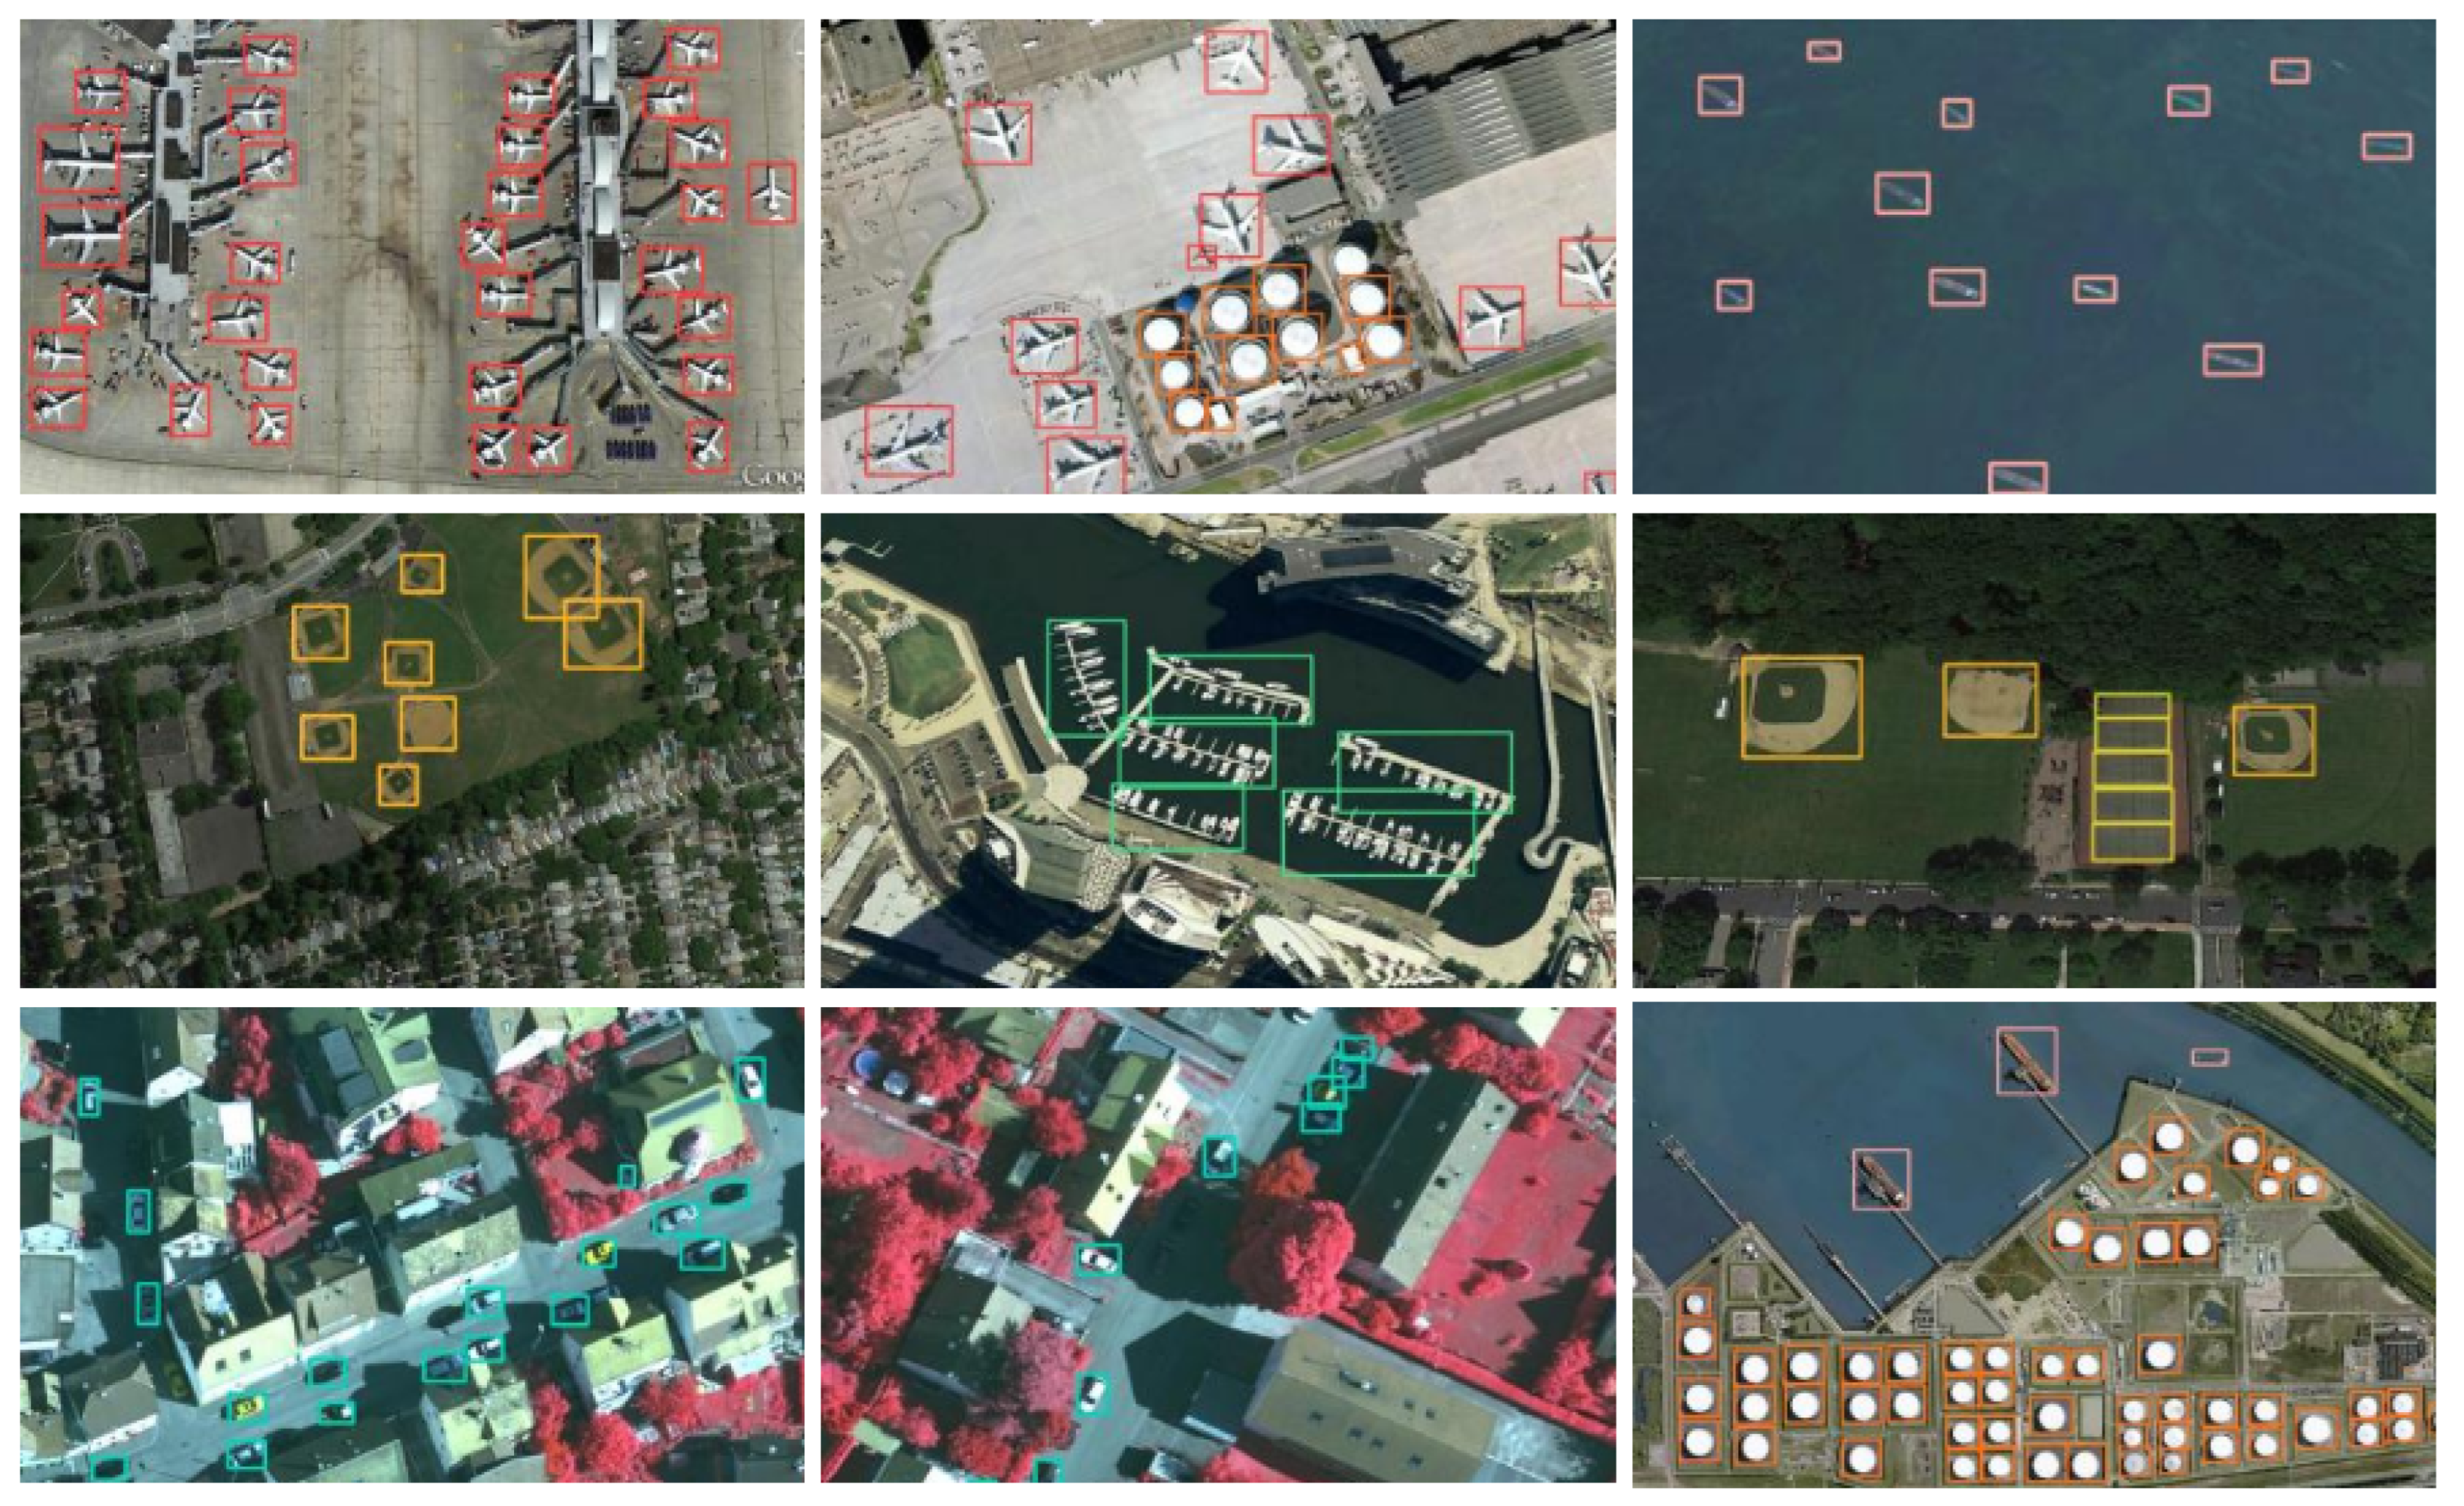
As shown in Figure 6, the detection performance of SRFAD-Net can be observed on different types, sizes, and directions of remote sensing targets, especially in complex scenes and under different lighting, occlusion, and background interference. SRFAD-Net is robust.
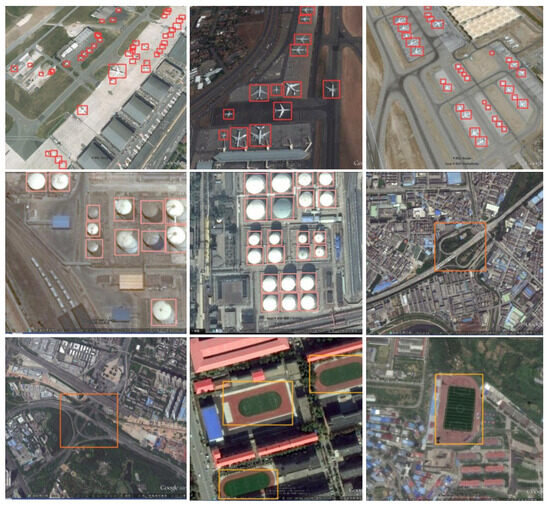
Figure 6.
The detection results of SRFAD-Net on the RSOD dataset.
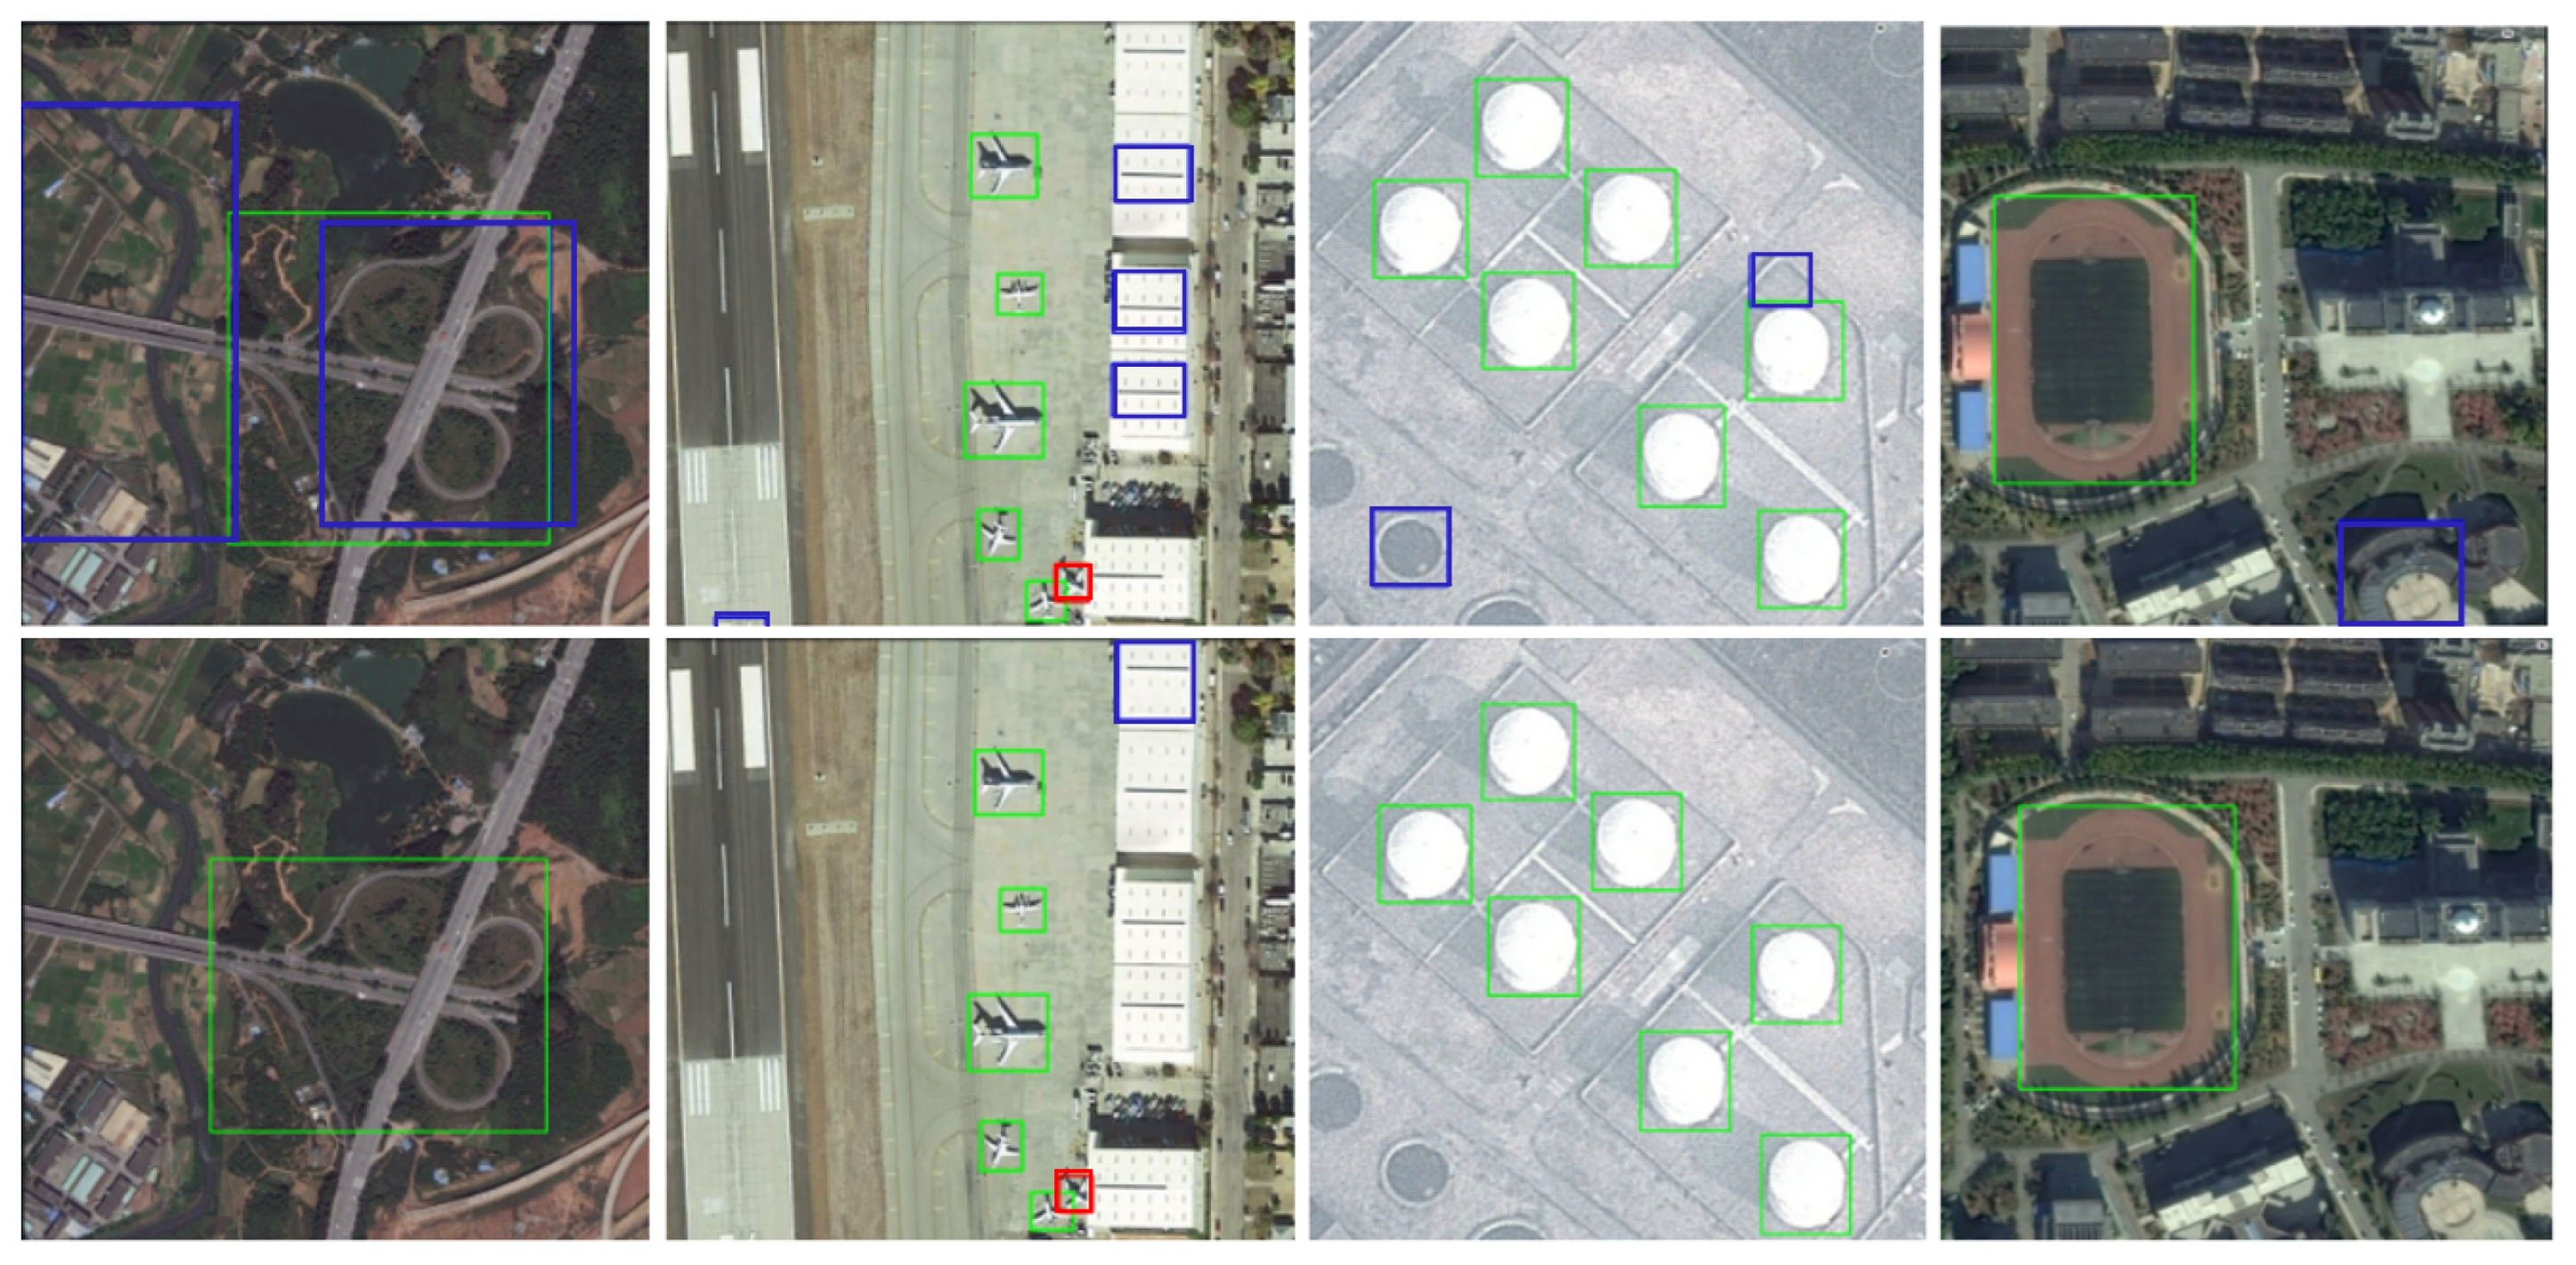
Figure 7 provides a comparative analysis of detection performance between SRFAD-Net and the baseline method. The top row presents results from the baseline method, while the bottom row shows outcomes from SRFAD-Net. The green boxes indicate true positives (TP), while the blue boxes correspond to false positives (FP), and the red box represents a false negative (FN). It is noteworthy that the baseline method exhibits a certain degree of false positives and missed detections (FN) for the four types of RSOD targets. However, SRFAD-Net significantly mitigates this issue by substantially reducing FP and FN cases. This allows SRFAD-Net to detect more objects accurately, resulting in a lower false positive rate and an overall improvement in detection accuracy.
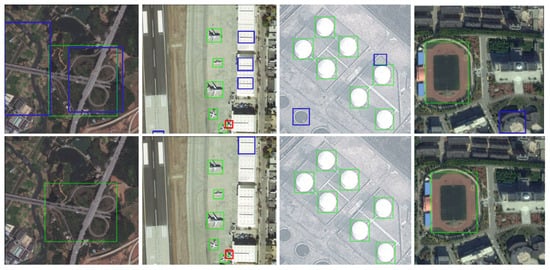
Figure 7.
Compared with the baseline method in terms of detection performance. The first line is the baseline method, and the second line is our method. Our method greatly reduced the FP and FN, thereby improving detection accuracy.
The proposed approach’s superior performance can be primarily attributed to integrating the DAttention module into the backbone network. This module employs deformation sampling points to dynamically adjust the receptive field’s shape and size, enabling a more precise capture of target area characteristics and enhancing the model’s modeling capabilities for distant targets in remote sensing images. Additionally, in the feature integration and extraction module, the AFAD network leverages multi-scale feature aggregation, coupled with context information integration and diffusion mechanisms. This approach enhances the model’s ability to observe and comprehend targets across multiple fields of view or resolutions, extracting more discriminative and robust features. This results in improved generalization when faced with varying scenes and scale changes. Furthermore, Focaler-GIoU’s focus on challenging samples and its proficiency in handling non-overlapping bounding boxes allow for a more precise depiction of target positions and shapes in remote sensing object detection, ultimately enhancing detection accuracy.
However, for small object detection, SRFAD-Net still needs further improvement and optimization. Future work can explore more effective feature extraction methods, network structure design, or training strategies based on the characteristics of small object detection, to improve the performance of the model in small object detection.
4.4.2. NWPU VHR-10 Dataset
We conducted a comparative evaluation of SRFAD-Net against leading state-of-the-art methods on the NWPU VHR-10 dataset, and the results are summarized in Table 7. While one-stage methods have demonstrated promising results on the RSOD dataset, our analysis reveals that two-stage approaches, such as Faster R-CNN and Cascade R-CNN, exhibit superior performance compared with other one-stage methods on the NWPU dataset. The main advantage of NWPU compared with RSOD is that it has a wide variety of terrain types and the boundaries between different terrain types may not be clear, leading to increased classification difficulty. There are still many small or densely populated areas of land, with a more complex background and occlusion and shadows, such as buildings, and trees. These noises may affect the accuracy of classification. The two-stage approach initially produces a series of high-quality candidate regions, referred to as region proposals, utilizing the region proposal network (RPN). Subsequently, these regions undergo precise classification and localization. This two-stage approach helps to more accurately locate targets, especially when there are significant changes in target size, shape, and proportion. Therefore, the two-stage method can leverage its advantages. However, The mAP_s of SRFAD-Net have decreased compared with Faster-RCNN, Cascade-RCNN, TOOD, and RetinaNet, while other indicators have improved. However, for the NWPU VHR-10 dataset, mAP is still significantly improved compared with the other method. Some visual detection results of NWPU VHR-10 are shown in Figure 8.
Table 7.
Comparative experiment based on NWPU VHR-10.

Figure 8.
The detection results of SRFAD-Net on NWPU VHR-10.
The above scenes have problems such as dense arrangement (oil tanks, ports), arbitrary direction (airplanes), occlusion (cars), and small targets (ships, airplanes), which all pose challenges to object detection. SRFAD-Net can adaptively adjust the size and shape of the receptive field, aggregate and diffuse context and salient features at multiple scales, and solve the problem of bounding box overlap through loss functions. These all improve the ability of the method in remote sensing scene object detection.
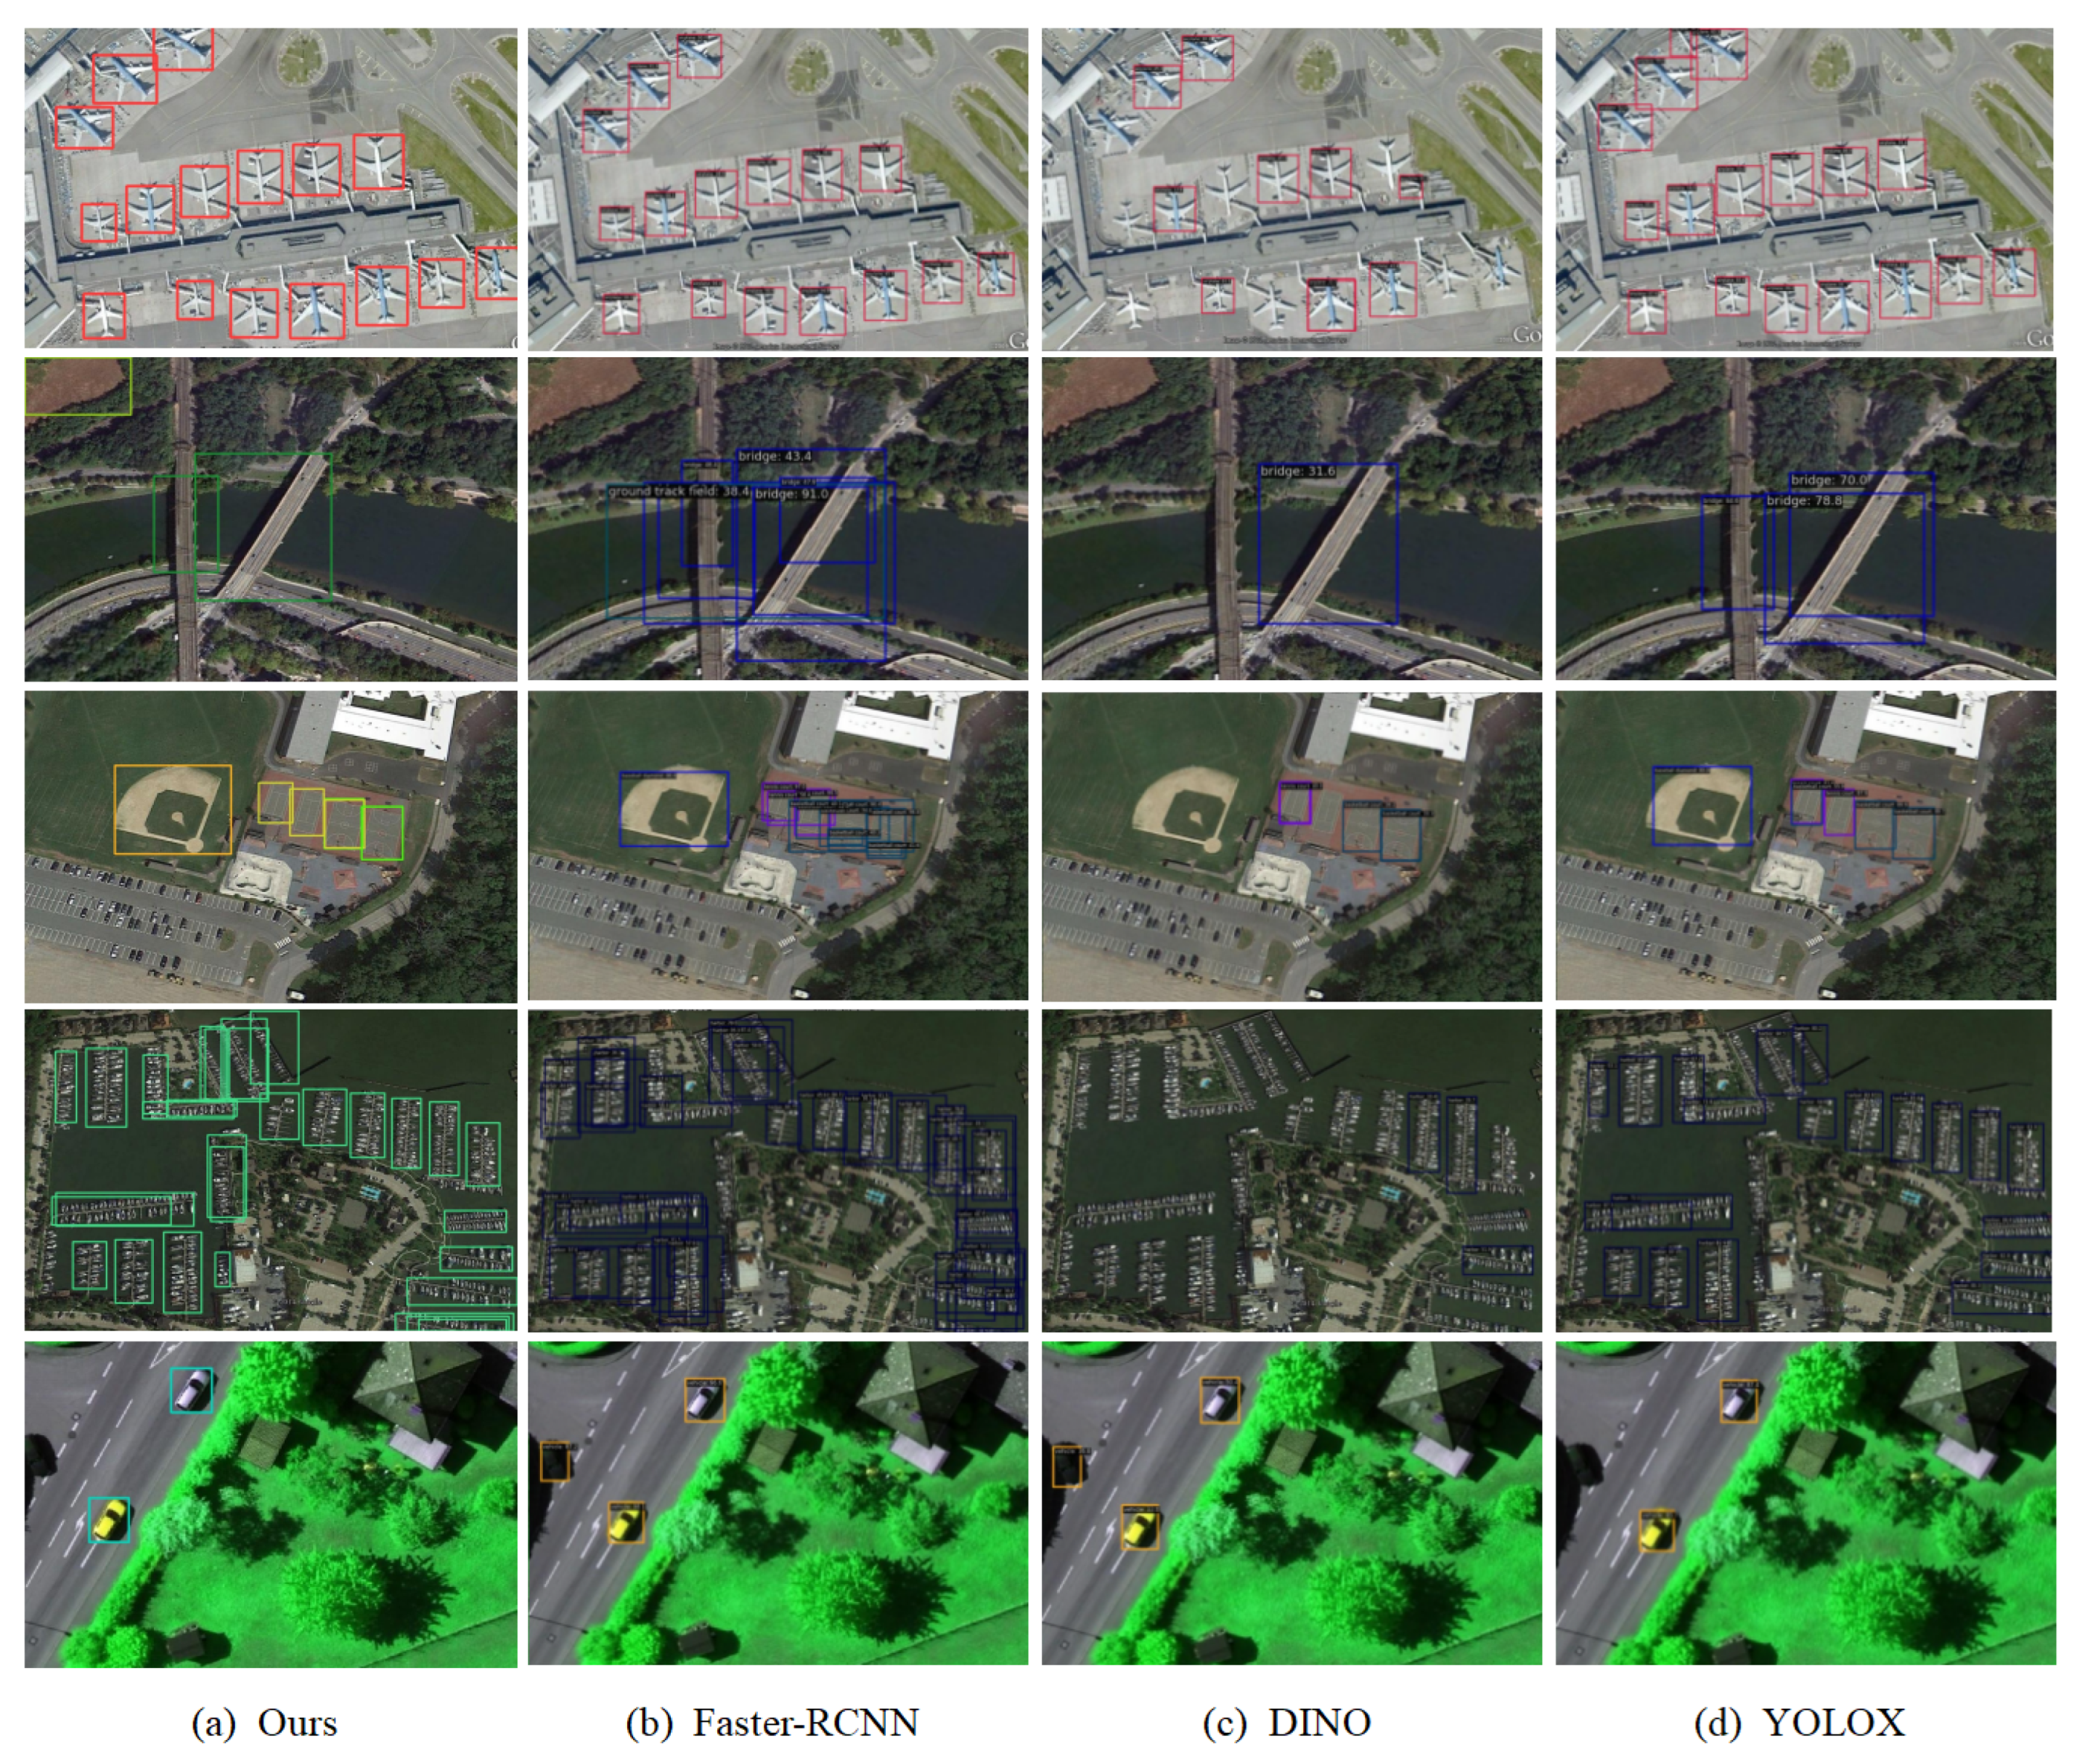
To compare the methods proposed in this article more intuitively, this section selects some complex scenes, images with extremely small target proportions, and dense sample distributions from the test set, and compares several representative neural network algorithms for testing. The detection results are shown in Figure 9. It can be seen that the aircraft targets in the first row of the test image are extremely small and densely distributed. Among the four methods, DINO has missed detections, while the other three methods demonstrate high performance in handling small targets and densely distributed scenes. For the bridge and playground targets in the second row, the other three methods did not detect the playground, and there was also an issue of overlapping detection boxes, indicating that these methods have limitations in distinguishing different categories of targets and processing overlapping areas. In the third row, only DINO was missed, while in the fourth row, the ship arrangement was dense. All other methods were missed, indicating that SRFAD-Net has a higher recognition accuracy in dealing with dense targets. For the car target in the fifth row, there is a shadow situation, which was correctly detected by SRFAD-Net and YOLOX. The other two methods both detect shadows as targets, demonstrating the advantages of SRFAD-Net and YOLOX in dealing with shadow interference.
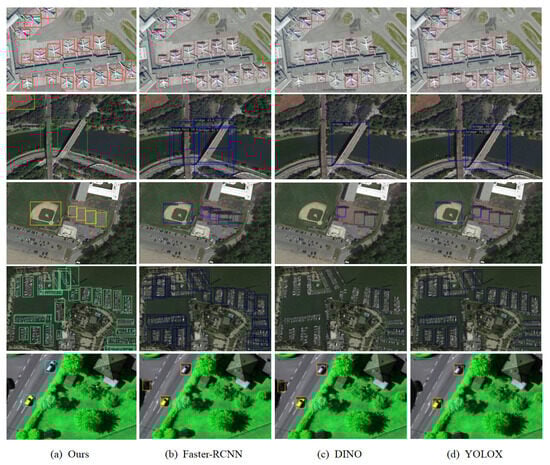
Figure 9.
Comparison of detection results between SRFAD-Net and popular methods.
5. Conclusions
This article has introduced the Scale-Robust Adaptive Feature Aggregation and Diffusion Network (SRFAD-Net) for object detection in remote sensing images. By employing a carefully designed Backbone, Neck, and Heads, the network has effectively addressed challenges related to feature extraction, fusion, regression, and classification posed by scale variations in remote sensing images. In the Backbone, SRFN has constructed a multi-scale pyramid and incorporated an ADown downsampling module and DAttention module. These components have preserved rich backgrounds and salient features while dynamically adjusting sampling positions and attention weights to accommodate targets of varying shapes and scales. This design has notably enhanced the network’s robustness to targets of diverse scales and shapes, mitigating information loss for small targets and improving modeling for long-range targets. In the Neck, the AFAD module has utilized channel awareness to aggregate local and contextual information, effectively propagating it across various scales through diffusion mechanisms. AFAD has significantly enhanced the model’s feature fusion capability, enabling it to fully exploit the complementarity among features at different scales and further enhance detection performance. In the head, incorporating a Focaler-GIoU Loss has enabled SRFAD-Net to accurately measure the similarity between predicted and truth bounding boxes and prioritize challenging samples for classification. This approach has enhanced both the model’s detection accuracy and its adaptability to complex scenes and diverse datasets.
Extensive experimental results have demonstrated that SRFAD-Net achieves higher accuracy compared with current mainstream one-stage and two-stage methods. Furthermore, the effectiveness of each module has also been discussed in the ablation study. Future efforts will primarily focus on optimizing network models further, reducing computational complexity, and enhancing the detection capability for small targets to enhance the robustness and generalization of the models.
Author Contributions
Conceptualization, J.L. and H.Z.; methodology, J.L. and C.D.; software, D.J. and C.D.; validation, D.J.; visualization, D.J.; writing—original draft, J.L.; writing—review and editing, H.Z. and C.D. All authors have read and agreed to the published version of this manuscript.
Funding
This research received no external funding.
Data Availability Statement
The RSOD and NWPU VHR-10 are available at https://github.com/RSIA-LIESMARS-WHU/RSOD-Dataset- (accessed on 10 March 2024) and https://labelbox.com/datasets/nwpu-vhr-10/(accessed on 15 March 2024), respectively.
Acknowledgments
The authors acknowledge the referees and the editor for carefully reading this paper and giving many helpful comments. The authors also express their gratitude to the reviewers for their insightful comments.
Conflicts of Interest
The authors declare no conflicts of interest.
References
- Ren, S.; He, K.; Girshick, R.B.; Sun, J. Faster R-CNN: Towards Real-Time Object Detection with Region Proposal Networks. arXiv 2015, arXiv:1506.01497. [Google Scholar] [CrossRef] [PubMed]
- He, K.; Gkioxari, G.; Dollár, P.; Girshick, R. Mask r-cnn. In Proceedings of the IEEE International Conference on Computer Vision, Venice, Italy, 22–29 October 2017; pp. 2961–2969. [Google Scholar]
- Cai, Z.; Vasconcelos, N. Cascade r-cnn: Delving into high quality object detection. In Proceedings of the IEEE Conference on Computer Vision and Pattern Recognition, Salt Lake City, UT, USA, 18–23 June2018; pp. 6154–6162. [Google Scholar]
- Liu, W.; Anguelov, D.; Erhan, D.; Szegedy, C.; Reed, S.; Fu, C.Y.; Berg, A.C. Ssd: Single shot multibox detector. In Proceedings of the Computer Vision—ECCV 2016: 14th European Conference, Proceedings, Part I 14, Amsterdam, The Netherlands, 11–14 October 2016; Springer: Berlin/Heidelberg, Germany, 2016; pp. 21–37. [Google Scholar]
- Lin, T.Y.; Goyal, P.; Girshick, R.; He, K.; Dollár, P. Focal loss for dense object detection. In Proceedings of the IEEE International Conference on Computer Vision, Venice, Italy, 22–29 October 2017; pp. 2980–2988. [Google Scholar]
- Redmon, J.; Divvala, S.; Girshick, R.; Farhadi, A. You only look once: Unified, real-time object detection. In Proceedings of the IEEE Conference on Computer Vision and Pattern Recognition, Las Vegas, NV, USA, 27–30 June 2016; pp. 779–788. [Google Scholar]
- Zhang, J.; Lei, J.; Xie, W.; Fang, Z.; Li, Y.; Du, Q. SuperYOLO: Super resolution assisted object detection in multimodal remote sensing imagery. IEEE Trans. Geosci. Remote Sens. 2023, 61, 5605415. [Google Scholar] [CrossRef]
- Redmon, J.; Farhadi, A. Yolov3: An incremental improvement. arXiv 2018, arXiv:1804.02767. [Google Scholar]
- Bochkovskiy, A.; Wang, C.Y.; Liao, H.Y.M. Yolov4: Optimal speed and accuracy of object detection. arXiv 2020, arXiv:2004.10934. [Google Scholar]
- Wang, C.Y.; Bochkovskiy, A.; Liao, H.Y.M. YOLOv7: Trainable bag-of-freebies sets new state-of-the-art for real-time object detectors. In Proceedings of the IEEE/CVF Conference on Computer Vision and Pattern Recognition, Vancouver, BC, Canada, 17–24 June 2023; pp. 7464–7475. [Google Scholar]
- Wang, C.Y.; Yeh, I.H.; Liao, H.Y.M. YOLOv9: Learning What You Want to Learn Using Programmable Gradient Information. arXiv 2024, arXiv:2402.13616. [Google Scholar]
- Van Etten, A. You only look twice: Rapid multi-scale object detection in satellite imagery. arXiv 2018, arXiv:1805.09512. [Google Scholar]
- Tarasiou, M.; Chavez, E.; Zafeiriou, S. Vits for sits: Vision transformers for satellite image time series. In Proceedings of the IEEE/CVF Conference on Computer Vision and Pattern Recognition, Vancouver, BC, Canada, 17–24 June 2023; pp. 10418–10428. [Google Scholar]
- Zhao, Y.; Lv, W.; Xu, S.; Wei, J.; Wang, G.; Dang, Q.; Liu, Y.; Chen, J. Detrs beat yolos on real-time object detection. arXiv 2023, arXiv:2304.08069. [Google Scholar]
- Gu, A.; Dao, T. Mamba: Linear-time sequence modeling with selective state spaces. arXiv 2023, arXiv:2312.00752. [Google Scholar]
- Li, K.; Wan, G.; Cheng, G.; Meng, L.; Han, J. Object detection in optical remote sensing images: A survey and a new benchmark. Isprs J. Photogramm. Remote Sens. 2020, 159, 296–307. [Google Scholar] [CrossRef]
- Ojala, T.; Pietikainen, M.; Maenpaa, T. Multiresolution gray-scale and rotation invariant texture classification with local binary patterns. IEEE Trans. Pattern Anal. Mach. Intell. 2002, 24, 971–987. [Google Scholar] [CrossRef]
- Zhang, D.; Lu, G. Shape-based image retrieval using generic Fourier descriptor. Signal Process. Image Commun. 2002, 17, 825–848. [Google Scholar] [CrossRef]
- Dalal, N.; Triggs, B. Histograms of oriented gradients for human detection. In Proceedings of the 2005 IEEE Computer Society Conference on Computer Vision and Pattern Recognition (CVPR’05), San Diego, CA, USA, 20–25 June 2005; IEEE: Piscataway, NJ, USA; Volume 1, pp. 886–893. [Google Scholar]
- Lin, T.Y.; Dollár, P.; Girshick, R.; He, K.; Hariharan, B.; Belongie, S. Feature pyramid networks for object detection. In Proceedings of the IEEE Conference on Computer Vision and Pattern Recognition, Honolulu, HI, USA, 21–26 July 2017; pp. 2117–2125. [Google Scholar]
- Liu, S.; Qi, X.; Shi, J.; Zhang, H.; Jia, J. Multi-scale patch aggregation (mpa) for simultaneous detection and segmentation. In Proceedings of the IEEE Conference on Computer Vision and Pattern Recognition, Las Vegas, NV, USA, 27–30 June 2016; pp. 3141–3149. [Google Scholar]
- Xia, Z.; Pan, X.; Song, S.; Li, L.E.; Huang, G. Vision transformer with deformable attention. In Proceedings of the IEEE/CVF Conference on Computer Vision and Pattern Recognition, New Orleans, LA, USA, 18–24 June 2022; pp. 4794–4803. [Google Scholar]
- Ma, C.; Mu, X.; Sha, D. Multi-layers feature fusion of convolutional neural network for scene classification of remote sensing. IEEE Access 2019, 7, 121685–121694. [Google Scholar] [CrossRef]
- Li, Z.; Yang, L.; Zhou, F. FSSD: Feature fusion single shot multibox detector. arXiv 2017, arXiv:1712.00960. [Google Scholar]
- Li, Z.; Leung, H. Fusion of multispectral and panchromatic images using a restoration-based method. IEEE Trans. Geosci. Remote Sens. 2008, 47, 1482–1491. [Google Scholar]
- Zheng, Z.; Wang, P.; Liu, W.; Li, J.; Ye, R.; Ren, D. Distance-IoU loss: Faster and better learning for bounding box regression. In Proceedings of the AAAI Conference on Artificial Intelligence, New York, NY, USA, 7–12 February 2020; Volume 34, pp. 12993–13000. [Google Scholar]
- Zhang, H.; Zhang, S. Focaler-IoU: More Focused Intersection over Union Loss. arXiv 2024, arXiv:2401.10525. [Google Scholar]
- Zhang, H.; Zhang, S. Shape-IoU: More Accurate Metric considering Bounding Box Shape and Scale. arXiv 2024, arXiv:2312.17663. [Google Scholar]
- Gevorgyan, Z. SIoU Loss: More Powerful Learning for Bounding Box Regression. arXiv 2022, arXiv:2205.12740. [Google Scholar]
- Jiang, Y.; Zhu, X.; Wang, X.; Yang, S.; Li, W.; Wang, H.; Fu, P.; Luo, Z. R2CNN: Rotational region CNN for orientation robust scene text detection. arXiv 2017, arXiv:1706.09579. [Google Scholar]
- Zhang, Z.; Guo, W.; Zhu, S.; Yu, W. Toward arbitrary-oriented ship detection with rotated region proposal and discrimination networks. IEEE Geosci. Remote Sens. Lett. 2018, 15, 1745–1749. [Google Scholar] [CrossRef]
- Ma, J.; Shao, W.; Ye, H.; Wang, L.; Wang, H.; Zheng, Y.; Xue, X. Arbitrary-oriented scene text detection via rotation proposals. IEEE Trans. Multimed. 2018, 20, 3111–3122. [Google Scholar] [CrossRef]
- Xie, X.; Cheng, G.; Wang, J.; Yao, X.; Han, J. Oriented R-CNN for object detection. In Proceedings of the IEEE/CVF International Conference on Computer Vision, Montreal, BC, Canada, 11–17 October 2021; pp. 3520–3529. [Google Scholar]
- Ding, J.; Xue, N.; Long, Y.; Xia, G.S.; Lu, Q. Learning RoI transformer for oriented object detection in aerial images. In Proceedings of the IEEE/CVF Conference on Computer Vision and Pattern Recognition, Long Beach, CA, USA, 15–20 June 2019; pp. 2849–2858. [Google Scholar]
- Han, J.; Ding, J.; Xue, N.; Xia, G.S. Redet: A rotation-equivariant detector for aerial object detection. In Proceedings of the IEEE/CVF Conference on Computer Vision and Pattern Recognition, Nashville, TN, USA, 20–25 June 2021; pp. 2786–2795. [Google Scholar]
- Yang, X.; Yan, J.; Feng, Z.; He, T. R3det: Refined single-stage detector with feature refinement for rotating object. In Proceedings of the AAAI Conference on Artificial Intelligence, Vancouver, BC, Canada, 2–9 February 2021; Volume 35, pp. 3163–3171. [Google Scholar]
- Yang, X.; Yang, J.; Yan, J.; Zhang, Y.; Zhang, T.; Guo, Z.; Sun, X.; Fu, K. Scrdet: Towards more robust detection for small, cluttered and rotated objects. In Proceedings of the IEEE/CVF International Conference on Computer Vision, Seoul, Republic of Korea, 27 October–2 November 2019; pp. 8232–8241. [Google Scholar]
- Yang, X.; Yan, J.; Liao, W.; Yang, X.; Tang, J.; He, T. Scrdet++: Detecting small, cluttered and rotated objects via instance-level feature denoising and rotation loss smoothing. IEEE Trans. Pattern Anal. Mach. Intell. 2022, 45, 2384–2399. [Google Scholar] [CrossRef] [PubMed]
- Han, J.; Ding, J.; Li, J.; Xia, G.S. Align deep features for oriented object detection. IEEE Trans. Geosci. Remote Sens. 2021, 60, 5602511. [Google Scholar] [CrossRef]
- Pu, Y.; Wang, Y.; Xia, Z.; Han, Y.; Wang, Y.; Gan, W.; Wang, Z.; Song, S.; Huang, G. Adaptive rotated convolution for rotated object detection. In Proceedings of the IEEE/CVF International Conference on Computer Vision, Paris, France, 2–3 October 2023; pp. 6589–6600. [Google Scholar]
- Cai, X.; Lai, Q.; Wang, Y.; Wang, W.; Sun, Z.; Yao, Y. Poly Kernel Inception Network for Remote Sensing Detection. arXiv 2024, arXiv:2403.06258. [Google Scholar]
- Li, Y.; Hou, Q.; Zheng, Z.; Cheng, M.M.; Yang, J.; Li, X. Large selective kernel network for remote sensing object detection. In Proceedings of the IEEE/CVF International Conference on Computer Vision, Paris, France, 4–6 October 2023; pp. 16794–16805. [Google Scholar]
- Ma, X.; Zhang, X.; Pun, M.O.; Liu, M. A multilevel multimodal fusion transformer for remote sensing semantic segmentation. IEEE Trans. Geosci. Remote Sens. 2024, 62, 5403215. [Google Scholar] [CrossRef]
- Ding, J.; Xue, N.; Long, Y.; Xia, G.S.; Lu, Q. Learning RoI transformer for detecting oriented objects in aerial images. arXiv 2018, arXiv:1812.00155. [Google Scholar]
- Wang, W.; Xie, E.; Li, X.; Fan, D.P.; Song, K.; Liang, D.; Lu, T.; Luo, P.; Shao, L. Pyramid vision transformer: A versatile backbone for dense prediction without convolutions. In Proceedings of the IEEE/CVF International CONFERENCE on computer Vision, Montreal, BC, Canada, 11–17 October 2021; pp. 568–578. [Google Scholar]
- Dai, L.; Liu, H.; Tang, H.; Wu, Z.; Song, P. Ao2-detr: Arbitrary-oriented object detection transformer. IEEE Trans. Circuits Syst. Video Technol. 2022, 33, 2342–2356. [Google Scholar] [CrossRef]
- Zhao, S.; Chen, H.; Zhang, X.; Xiao, P.; Bai, L.; Ouyang, W. Rs-mamba for large remote sensing image dense prediction. arXiv 2024, arXiv:2404.02668. [Google Scholar]
- Long, Y.; Gong, Y.; Xiao, Z.; Liu, Q. Accurate object localization in remote sensing images based on convolutional neural networks. IEEE Trans. Geosci. Remote Sens. 2017, 55, 2486–2498. [Google Scholar] [CrossRef]
- Cheng, G.; Han, J.; Zhou, P.; Guo, L. Multi-class geospatial object detection and geographic image classification based on collection of part detectors. Isprs J. Photogramm. Remote Sens. 2014, 98, 119–132. [Google Scholar] [CrossRef]
- Feng, C.; Zhong, Y.; Gao, Y.; Scott, M.R.; Huang, W. Tood: Task-aligned one-stage object detection. In Proceedings of the 2021 IEEE/CVF International Conference on Computer Vision (ICCV), Montreal, BC, Canada, 10–17 October 2021; IEEE Computer Society: Washington, DC, USA, 2021; pp. 3490–3499. [Google Scholar]
- Caron, M.; Touvron, H.; Misra, I.; Jégou, H.; Mairal, J.; Bojanowski, P.; Joulin, A. Emerging properties in self-supervised vision transformers. In Proceedings of the IEEE/CVF International Conference on Computer Vision, Montreal, BC, Canada, 11–17 October 2021; pp. 9650–9660. [Google Scholar]
- Biffi, L.J.; Mitishita, E.; Liesenberg, V.; Santos, A.A.d.; Gonçalves, D.N.; Estrabis, N.V.; Silva, J.d.A.; Osco, L.P.; Ramos, A.P.M.; Centeno, J.A.S.; et al. ATSS deep learning-based approach to detect apple fruits. Remote Sens. 2020, 13, 54. [Google Scholar] [CrossRef]
- Lyu, C.; Zhang, W.; Huang, H.; Zhou, Y.; Wang, Y.; Liu, Y.; Zhang, S.; Chen, K. Rtmdet: An empirical study of designing real-time object detectors. arXiv 2022, arXiv:2212.07784. [Google Scholar]
- Ge, Z.; Liu, S.; Wang, F.; Li, Z.; Sun, J. Yolox: Exceeding yolo series in 2021. arXiv 2021, arXiv:2107.08430. [Google Scholar]


Disclaimer/Publisher’s Note: The statements, opinions and data contained in all publications are solely those of the individual author(s) and contributor(s) and not of MDPI and/or the editor(s). MDPI and/or the editor(s) disclaim responsibility for any injury to people or property resulting from any ideas, methods, instructions or products referred to in the content. |
© 2024 by the authors. Licensee MDPI, Basel, Switzerland. This article is an open access article distributed under the terms and conditions of the Creative Commons Attribution (CC BY) license (https://creativecommons.org/licenses/by/4.0/).